Article

Subcooling Effect on PCM Solidification: A Thermostat-like Approach to Thermal Energy Storage

1
Dipartimento di Ingegneria Industriale, Università degli Studi di Napoli Federico II, P. Le Tecchio 80, 80125 Napoli, Italy
2
Dipartimento di Ingegneria, Università degli Studi del Sannio, Piazza Roma 21, 82100 Benevento, Italy
3
ENEA–Italian National Agency for New Technologies, Energy and Sustainable Economic Development, Piazzale Enrico Fermi 1, 80055 Portici, Italy
*
Author to whom correspondence should be addressed.
Energies 2023, 16(12), 4834; https://doi.org/10.3390/en16124834
Submission received: 16 May 2023 / Revised: 9 June 2023 / Accepted: 18 June 2023 / Published: 20 June 2023

Abstract

:
Choosing the right phase change material (PCM) for a thermal energy storage (TES) application is a crucial step in guaranteeing the effectiveness of the system. Among a variety of PCMs available, the choice for a given application is established by several key factors, e.g., latent heat, stability, and melting point. However, phenomena such as subcooling—for which PCM cools in a liquid state below its solidification point—can lead to a reduction in the amount of energy stored or released, reducing the TES overall effectiveness, and also in some inaccuracies when modeling the problem. Thus, understanding the effects of subcooling on PCM performance is crucial for modeling and optimizing the design and the performance of TES systems. To this end, this work analyzes the PCM discharging phase in a cold thermal energy storage coupled to a chiller system. A first conduction-based predictive model is developed based on enthalpy–porosity formulation. Subcooling phenomena are encompassed through a control variable formulation, which takes its cue from the operation of a thermostat. Then, thermal properties of the PCM, i.e., the phase change range and specific heat capacity curve with temperature, are evaluated by using differential scanning calorimetry (DSC), in order to derive a second predictive model based on these new data, without including subcooling, for the sake of comparison with the first one. Experimental results from the storage tank confirm both model reliability and the fact that the PCM suffers from subcooling. Between the two numerical models developed, the first one that considers subcooling proves it is able to predict with satisfactory accuracy (RMSE < 1 °C) the temperature evolution on different tank levels.

1. Introduction

A phase change material (PCM) is a substance with a high fusion heat which is capable of storing and releasing large amounts of energy via melting and solidifying at a constant temperature [1]. Specifically, when melting, it absorbs heat from its surroundings; when solidifying, it releases heat. The temperature at which the PCM changes phase is called the melting or solidification point—specific to each PCM—and strongly affects the PCM choice. Most commercial PCMs are organic compounds [2], such as paraffin wax, but some inorganic compounds, such as salts, are also used. Inorganic PCMs tend to have higher melting points and latent heat of fusion than organic ones [3]. However, organic PCMs are chemically neutral and have homogeneous melting. The main types of inorganic PCMs are salt and metal hydrates, while the main types of organic PCMs are paraffin waxes and non-paraffins [3]. PCMs are usually used in one of two ways:
  • As a heat storage material, in which case they are used to store heat from a certain source, e.g., the sun, power plants, or to control temperature fluctuations, for instance with IT equipment.
  • As a cold storage material, in which case they are used to store cold energy from a refrigeration system and release it when needed.
The main advantage of PCMs is their high latent heat, which means that they can store large amounts of heat per unit mass, while the main drawback is their low thermal conductivity. This means that PCMs are not very effective at spreading heat and this weakness limits their self-sufficient usage. This has paved the way for a range of strategies to be developed to improve heat transfer, i.e., using fins [4], increasing the heat transfer surface with encapsulation [5], using nanofluids [6] and metal foams [7,8]. Therefore, PCMs can be tailored to meet the needs of specific applications. For instance, the selection of PCM type and size, as well as the choice of suspending medium, can be adjusted to optimize heat transfer and energy storage. Further, PCMs can be encapsulated using polymeric shells [5]. These capsules are typically around 100 microns in size and contain the PCMs in a solid state. Recent developments in the field of microencapsulated phase change materials have focused on improving their performance, durability, and cost effectiveness. Researchers have been exploring various promising solutions, focusing on the heat transfer [9], and their integration in thermal energy storages [10]. However, there are also some significant disadvantages for using latent heat storage, which include:
  • Slow thermal transients: one of the biggest disadvantages of latent heat storage is that the time required for fusion/solidification generally exceeds that required for specific applications. This limits the amount of heat that can be stored.
  • High costs: another significant disadvantage of latent heat storage is its high cost. This is because PCMs are generally expensive.
  • Phase change handling: another drawback of latent heat storage is that it can be difficult to manage PCM volume expansion during phase change.
However, PCMs are rising above the most suitable solutions to control temperature and heat release in heat transfer systems, such as heat sinks and thermal storage systems. Numerical modelling of these materials is well established, and various experimental analyses on their usage for thermal management or latent heat storage have been carried out [11]. Most of these approaches are based on 1D or 2D modelling [12,13], and little effort has yet been made for 3D models due to their high nonlinearities and computational times [14]. As regards 1D and 2D models, the most used ways to describe the phase transition are (i) enthalpy–porosity method; (ii) apparent heat capacity method; (iii) source-based method [1]. These approaches can reveal significant discrepancies from the experimental evidence, and the main reasons can be the temperature dependence of thermophysical properties, or the ideal shape of the step function used to model the phase transition; above all, the neglect of phenomena as subcooling and thermal hysteresis might also affect the modeling quality. When using these approaches, subcooling and hysteresis are rarely considered [15] because of the model complexity. To this end, a fundamental point is the distinction between the definitions of subcooling and hysteresis. According to the subcooling, PCM requires cooling to a temperature below the theoretical solidification point before it starts to crystallize; this has an impact on how latent heat is released and used [16]. This translates in PCM not crystallizing at the theoretical solidification point. Therefore, the subcooling degree is the term used to describe the discrepancy between actual and theoretical solidification temperatures. On the other hand, thermal hysteresis causes the phase change material solidification temperature to deviate from its melting temperature [17]. Thus, PCMs have distinct enthalpy values in the same condition and melt and solidify at different temperatures [18]. Whenever a comparison was made between models with and without hysteresis, it was found that the poor accuracy of the non-hysteresis model in representing the melting and solidification processes of the PCM storage represents an important limitation [19,20]. Thus, it further emphasizes the importance of considering hysteresis effects in simulations involving PCM materials. Since heating and cooling can show different thermal behaviors because of their nucleation mechanisms, we generally refer to distinction as hysteresis. A graphical comparison of the differences between subcooling and hysteresis is provided in Figure 1, showing which temperature ranges are labelled as subcooling or hysteresis.
The nucleation rate of PCM is proportional to two main factors: the nucleation rate factor, which affects the hysteresis, and the atomic diffusion probability, which influences the subcooling [21]. During the solidification process, the temperature of PCM steadily falls. When the temperature falls below freezing, two contrasting effects occur: the nucleation power increases while the rate of nucleation drops. When the temperature continues to fall to the lower one reached under the cooling load, atomic diffusion becomes constrained because of the lower temperature, and the nucleation rate reduces rapidly. In this work, we will focus on subcooling, which indicates that, at least within some temperature range, distinct states can exist at the same temperature. This point represents the main issue when adding subcooling in numerical models.

1.1. Subcooling: Literature Review

There is still no harmony about the inclusion of subcooling in numerical models. The major point is the unpredictable behavior of PCM with the subcooling level. The occurrence of crystallization is reliant on several factors and thus is case-sensitive. The rate of cooling [22], volume of liquid PCM [23], thermal history of PCM [24], roughness of surfaces [25] and additives [26], are all factors that have a more or less significant influence on the probability of subcooling occurring.
The challenge in modeling supercooling consists in accurately simulating the thermal behavior of PCMs during the solidification phase while preserving continuity of enthalpy, temperature, and melt fraction [27]. The subcooling is incorporated into models using a variety of methods, such as including an instantaneous isenthalpic transformation between the PCM crystallization temperature and its enthalpy curve of melting [28]. However, this model is only partially validated because the numerically modeled recalescence process does not fit well with experimental temperature data. Alternatively, a heat source term to model recalescence can be added into each node of the numerical model when the node temperature falls below the nucleation temperature or when the liquid node is in direct contact with a solid neighbor node [29]. The subcooling can also be considered by dividing the solidification phase into four stages: regular solidification; liquid cooling while the PCM is in a metastable state; kinetic nucleation to model the temperature increase during recalescence; and cooling of the solid phase [30]. Other researchers have proposed alternative methods that utilize temperature functions, solidified-fraction functions, and heat source terms [31]. Finally, a novel formulation that considers the effective heat capacity as negative during the recalescence process has been recently proposed [32], which allows for modeling the temperature increase during recalescence.

1.2. Aims and Originality

Based on the presented literature survey, it emerges that PCM subcooling is a major challenge in the efficient use of phase change materials for practical applications, as well as in modeling accuracy. Several numerical and experimental studies have been conducted to model PCM, but most of them have ignored the subcooling effect. This is where the current approach comes into play. Using a control variable approach—which draws inspiration from the working principle of a thermostat—the effect of the subcooling is included in the 2D conduction-based finite element model. This approach is then applied to a case study regarding the solidification of a biological PCM, i.e., PureTemp15, in a shell-and-tube heat exchanger for cold thermal energy storage. By comparing experimental and numerical temperature evolutions, we show that more accurate results can be achieved, if one includes the subcooling effect within the model, without increasing the model’s complexity. Therefore, in this work, the originality of using a control variable approach for PCM subcooling modeling emerges, and special emphasis is placed on its benefits and its limitations. Furthermore, these model outcomes are compared with numerical results based on data from the DSC analysis.

2. Materials and Methods

This section describes how to define the mathematical model that encompasses the subcooling. To this end, we firstly introduce the thermophysical properties of the phase change material (PCM) here analyzed, and the heat storage system in which it is integrated. In detail, evidence on the experimental apparatus and its operation are provided. These allow for the definition of two numerical models, with the first including subcooling, while the second considers no subcooling with outcomes from the DSC analysis performed on the PCM.

2.1. Latent Heat Thermal Energy Storage: Shell-and-Tube Heat Exchanger

In this work, a biological PCM, i.e., PureTemp15 by PureTemp LLC, Minneapolis, MN, USA, was employed. The PureTemp15 was integrated in a cold thermal energy storage system coupled to a chiller. This storage system—depicted in Figure 2—works with water as the heat transfer fluid. It is a shell-and-tube heat exchanger that presents PCM and flowing water on shell and tube sides, respectively. All details on the storage geometry, chiller operation, and thermophysical properties of PureTemp 15 can be found here [14]. The tank height (L) is 1.35 m and the distance between the thermocouples housing (Ltc) is 0.195 m. The working principle is as follow: during charging, the cold water from the chiller enters the shell-and-tube storage and causes the PCM to cool down, releasing heat. By doing so, PCM solidifies since its transition point is about 15 °C, while cold water is at about 8 °C. Then, in the discharging phase, water enters the storage system, becomes warmer than the PCM, causing the latter to rise in temperature and then to melt. In this way, charging and discharging processes continue cyclically, involving a storage/release of thermal energy that benefits the chiller operation.
Although the PCM should have the same solidification and melting temperature, it was found [14] that this does not happen for a variety of reasons, i.e., PCM hysteresis, non-uniformity of water distribution in the tubes, stratification of the PCM, and subcooling. In particular, the latter occurred extensively, so a model capable of simulating this effect was evaluated in this work.

2.2. Conduction-Based Model

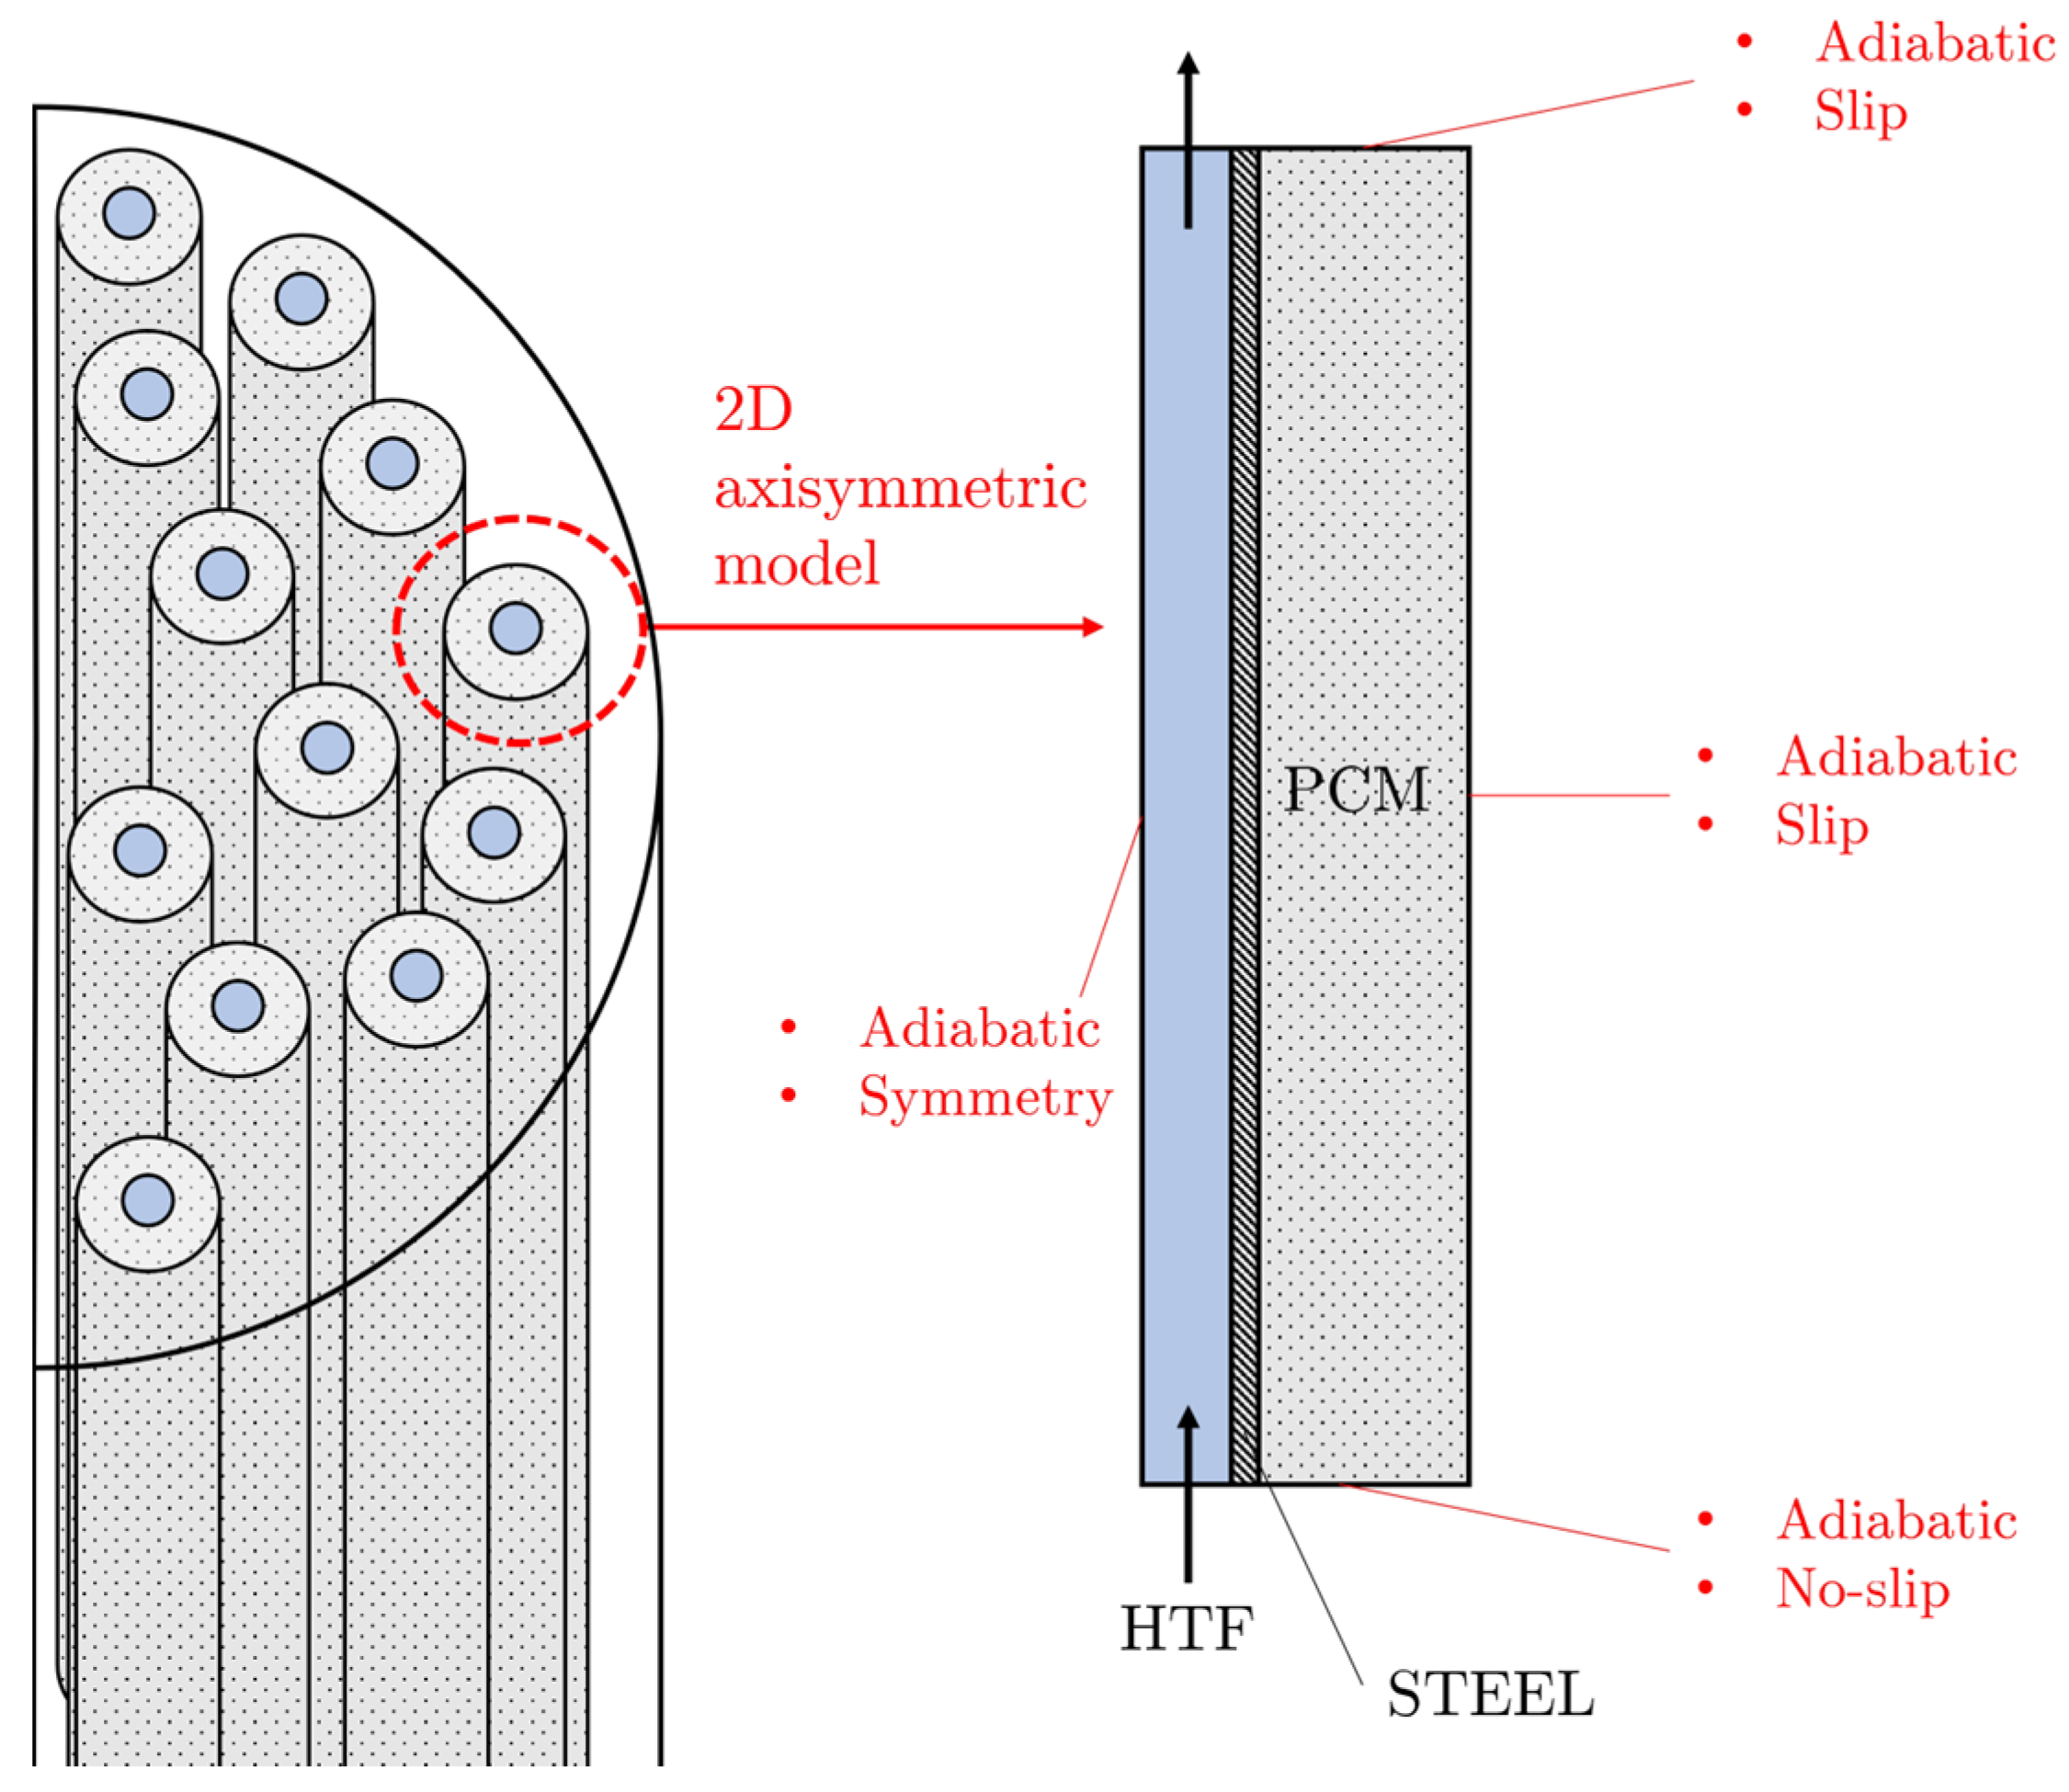
The easiest way to model the heat transfer inside PCM is to solve the energy balance alone with no inclusion of liquid PCM motion. This reduces the high non-linearities arising from the momentum equation and allows for faster convergence. On the other hand, where natural convection plays an important role—with high Rayleigh number values—this approach can lead to significant deviations from experimental results. From the initial 3D configuration, this work used the assumption of a 2D axisymmetric model to perform the thermofluidic–dynamic analysis. Therefore, the model is defined as in Figure 3.
According to the enthalpy–porosity formulation [33], the energy equation can be expressed as:
ρ c P C M T t = k P C M T + S h
where (ρc)PCM is the product between the density and the specific heat of the PCM, that represents the volumetric heat capacity; kPCM is the thermal conductivity; t the time; T the temperature; p the pressure; and μPCM the dynamic viscosity. An appropriate source term (Sh) is modelled to include the latent heat contribution in the PCM phase transition:
S h = ρ P C M L f φ t
This term depends on the PCM density, the latent heat of fusion (Lf), and a term that considers the liquid PCM fraction (φ), specified as the amount of liquid on the total PCM:
φ ( T ) = T T S T L T S = T T M + Δ T M 2 Δ T M =         0               f o r       T < T S 0 < φ < 1         f o r       T S T T L         1               f o r         T > T L        
where TM is the melting temperature; while TL and TS are the liquidus and solidus temperatures, i.e., TM ± ΔTM.

2.3. Analogy with Thermostat

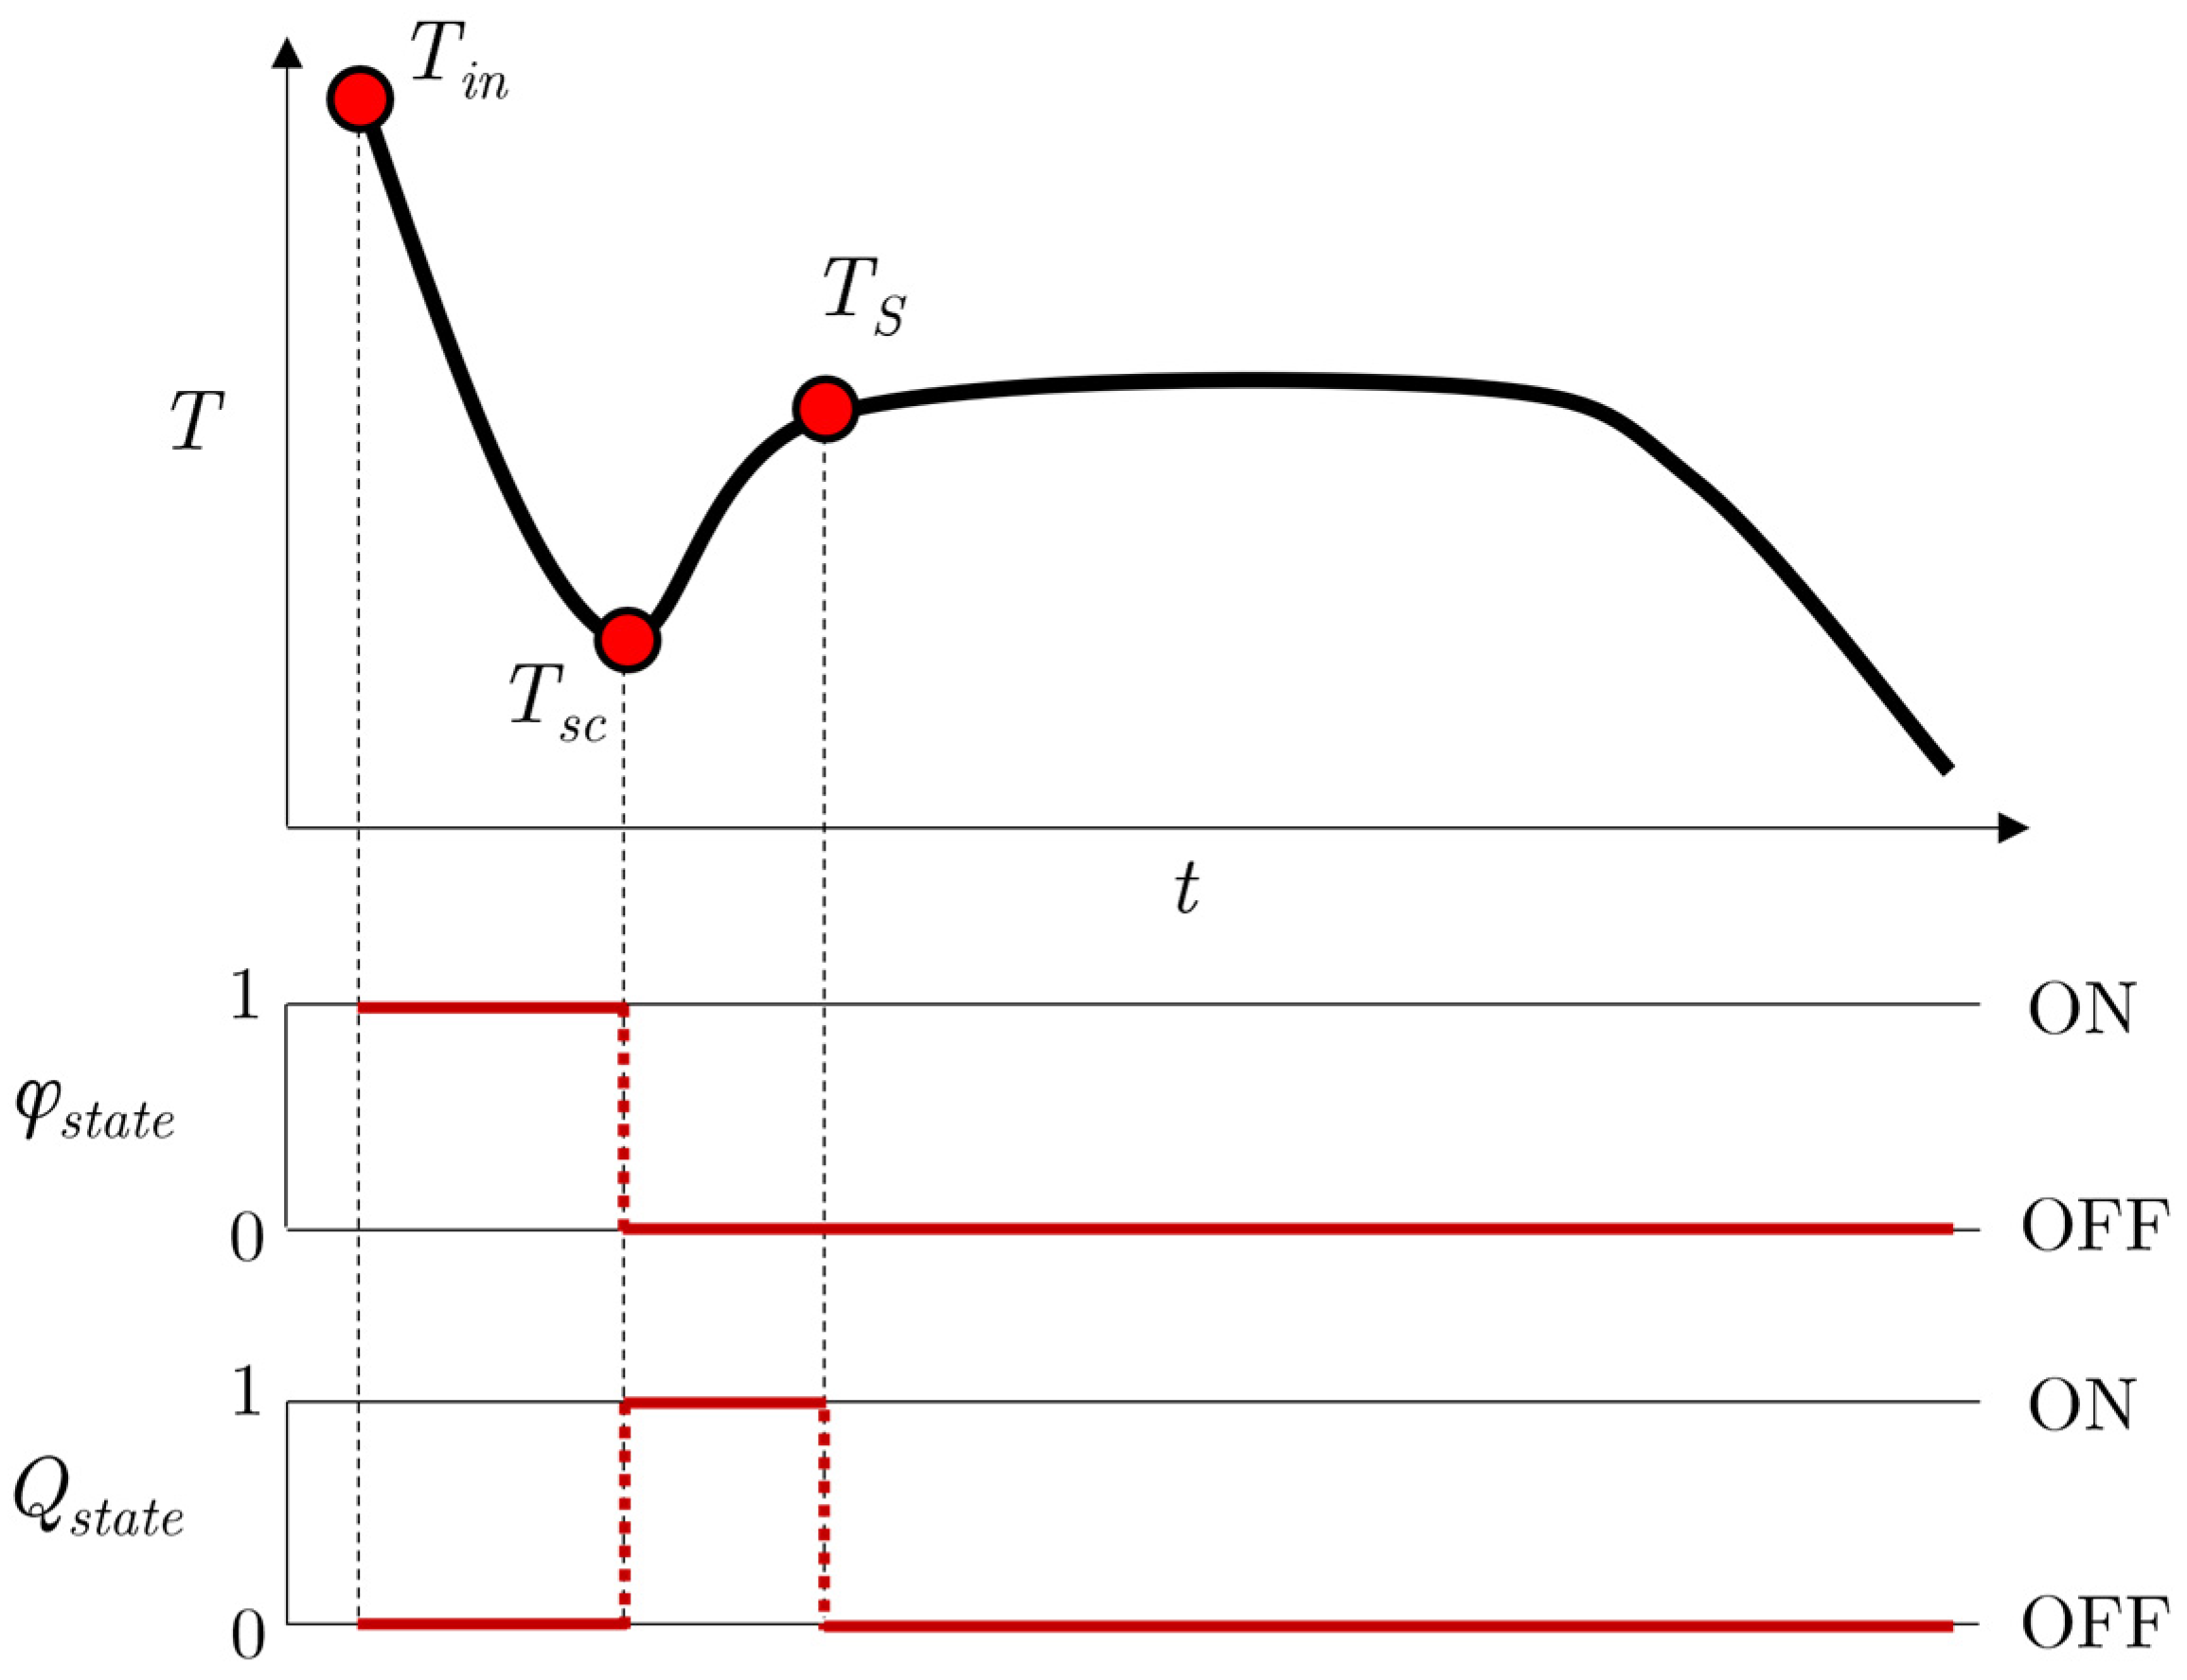
The evolution of the temperature during the subcooling can be assumed to be similar to the one that characterizes a thermostat working principle. Figure 4 resumes this analogy between an ideal thermostat and subcooling during the PCM charging phase. In control theory, an on–off controller is a form of feedback controller that changes between two states. A classic example is a domestic thermostat, which switches off/on to regulate the home temperature at a designed temperature. Thus, a temperature sensor placed within the system—which can be a room as well as a water tank—makes the thermostat (Figure 4) turn the heater on when the temperature drops below a certain lower limit, and turn it off when it exceeds an upper limit.
Without considering thermal inertia, the reaction of the system is ideally instantaneous, and the temperature is guaranteed to be inside the ΔT control band. Likewise, the PCM behavior during subcooling is such that, after it reaches a bottom temperature equal to Tsc, the temperature increases because the thermostat-like subcooling effect is switched off; this happens until the phase change is reached. In conclusion, one can argue that a thermostat-like control process can be applied to include the subcooling effect within the PCM modelling behavior, to include it in a mathematical model.

2.4. Subcooling Model

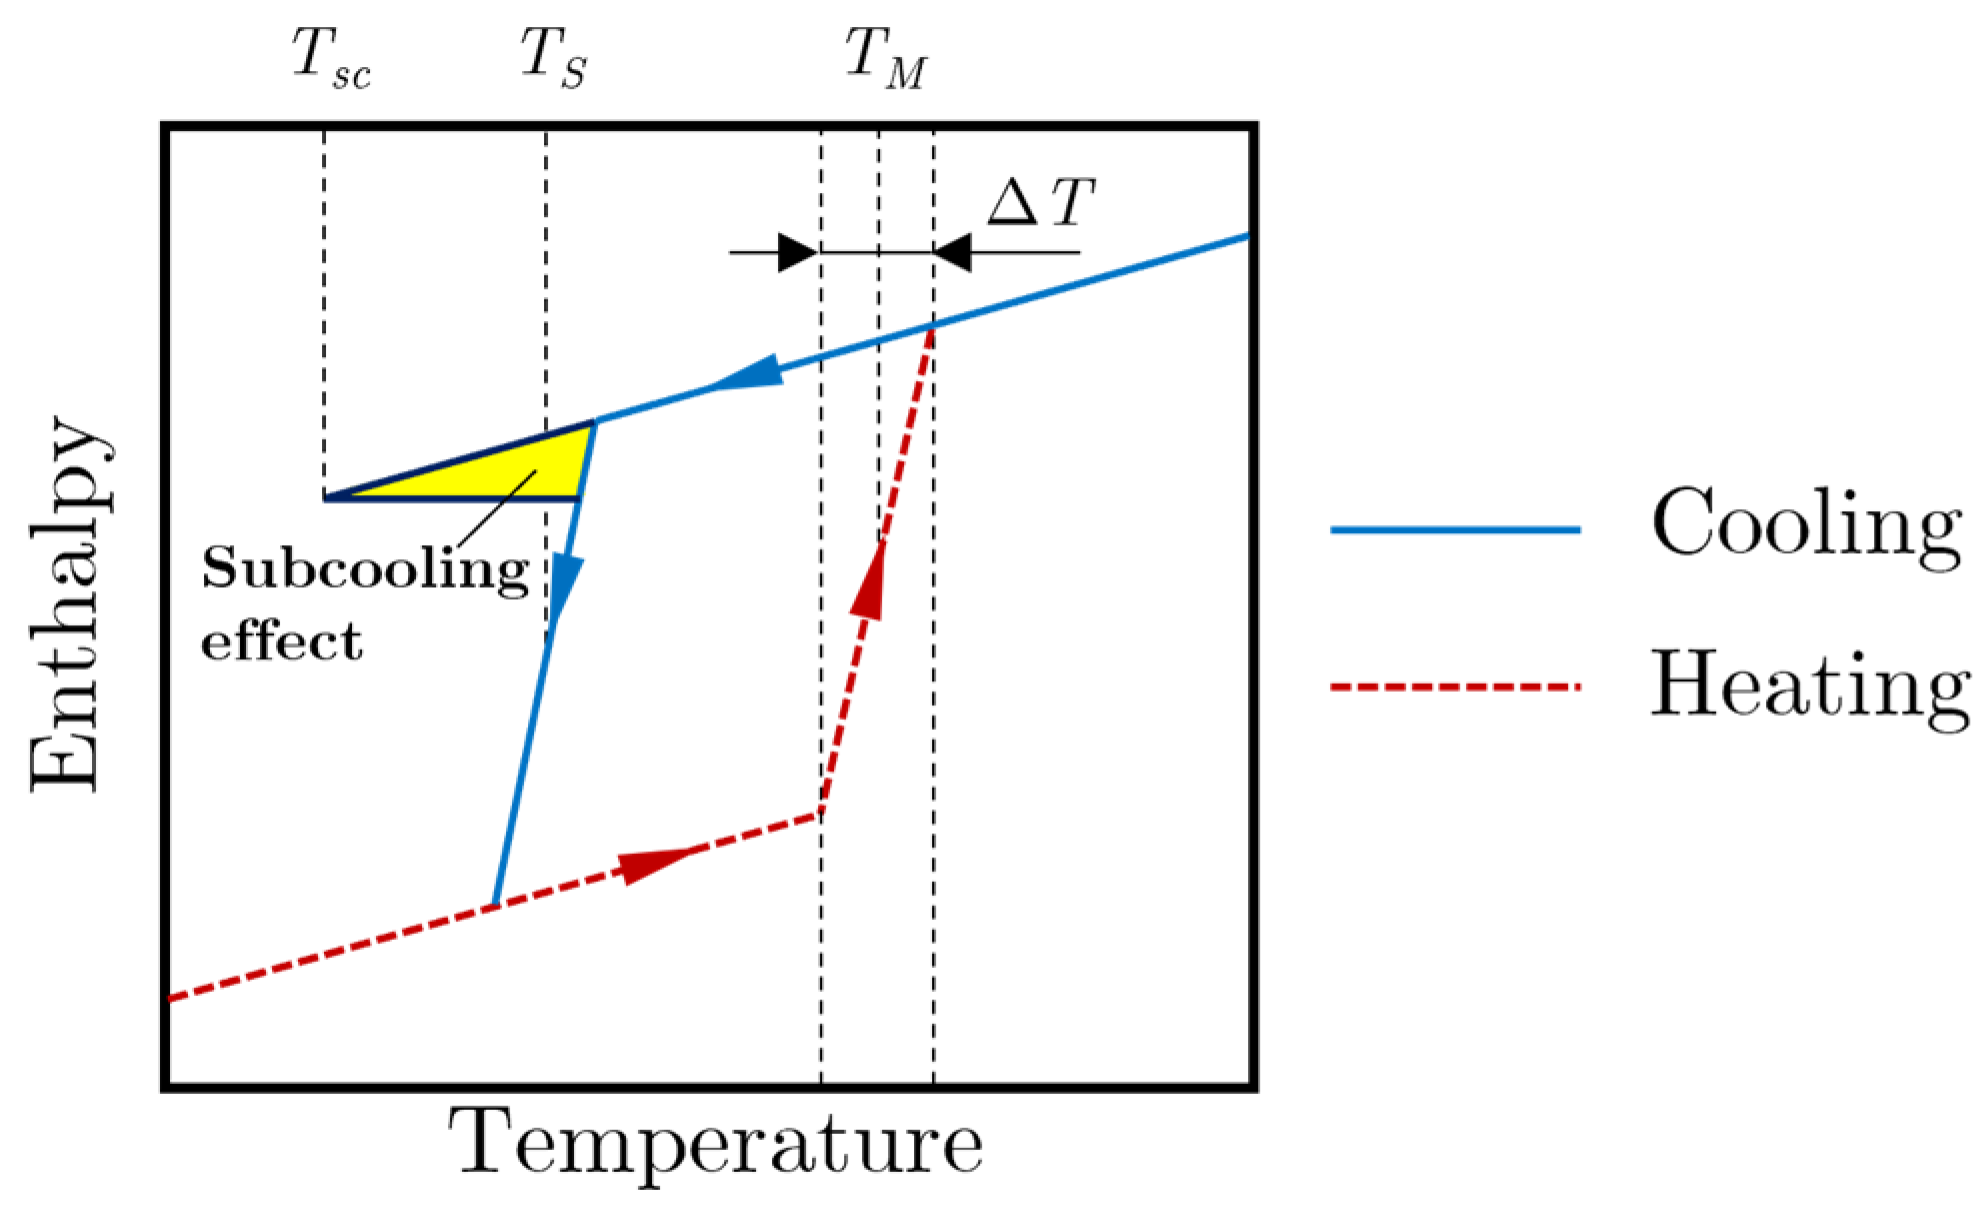
As discussed in the literature review, an issue of including subcooling in numerical models lies in the enthalpy dependence on temperature. When resorting to a simplified model, from the evaluation of enthalpy vs. temperature curve, one can evaluate the derivative dh/dT to smear the latent heat of fusion peak, to also be included in a c(T) function [16]. When the subcooling is included, the enthalpy does not depend on T anymore since, at the same temperature, one can found two different enthalpy values (Figure 5). Looking at the cooling phase (blue line), the PCM temperature decreases until it approaches the solidification one. At this point, while normally there is a phase transition with a release of the stored latent heat, when subcooling occurs the temperature continues to drop to Tsc. Once this temperature has been reached, the solidification of the PCM, in liquid phase until that point, begins. After that, so-called recalescence occurs, i.e., to the detriment of a portion of the latent heat, the PCM temperature increases, and the enthalpy returns to follow the initial path. Thus, in the interval between Tsc and TS, it can be seen that depending on whether the PCM is in the cooling or heating phase, it has two different enthalpy values.
To overcome this challenge, this work introduces a new approach that considers subcooling by means of control variables. As for a thermostat, subcooling should be activated/turned off depending on the temperature history of the PCM. In detail, we introduce two Boolean control variables, named φstate and Qstate. The first is responsible for the change in the liquid fraction behavior, i.e., it activates subcooling if the temperatures drop down; on the other hand, the second controls the recalescence, i.e., how fast the release of latent heat is inside the PCM to cause a temperature increase after subcooling occurs. Both variables can vary from 0 (Off) to 1 (On). What allows these variables to change their binary state is a condition (an inequality, in this case defined on temperatures) that can be fulfilled depending on the history of the system temperature. Then, depending on whether the inequality is more or less respected, the state of the variable changes from 0 to 1, or vice versa. The following scheme (Figure 6) resumes the logical framework applied to the “cold charging” phase.
The function of φstate is to control the phase during subcooling. Thus, as depicted in Figure 6, φstate starts from an initial value of 1, and then it remains equal to 1 until the temperature does not reach the subcooling temperature Tsc. From this point, its value becomes 0 and continues to be 0 until the transient finishes, as the effect of subcooling does not occur a second time. As regards the second control variable Qstate, looking at Figure 4 one can observe a difference as it starts from 0 and continues to be off until the temperature reaches onset crystallization point (Tsc). Then, it is switched on, reaching Qstate = 1, until the nearly constant temperature section is reached (TS). At this point, Qstate needs to be deactivated. The reason why we need both φstate and Qstate is that we must maintain the two phenomena independently: indeed, the role of Qstate is just to determine how fast the temperature raises up from Tsc to Ts.
Therefore, in order to include the introduced subcooling effect, via control variables, in our mathematical model, we have to introduce the variable φnew, as well as a modified form of both Sh and keff. To this end, φnew is defined as:
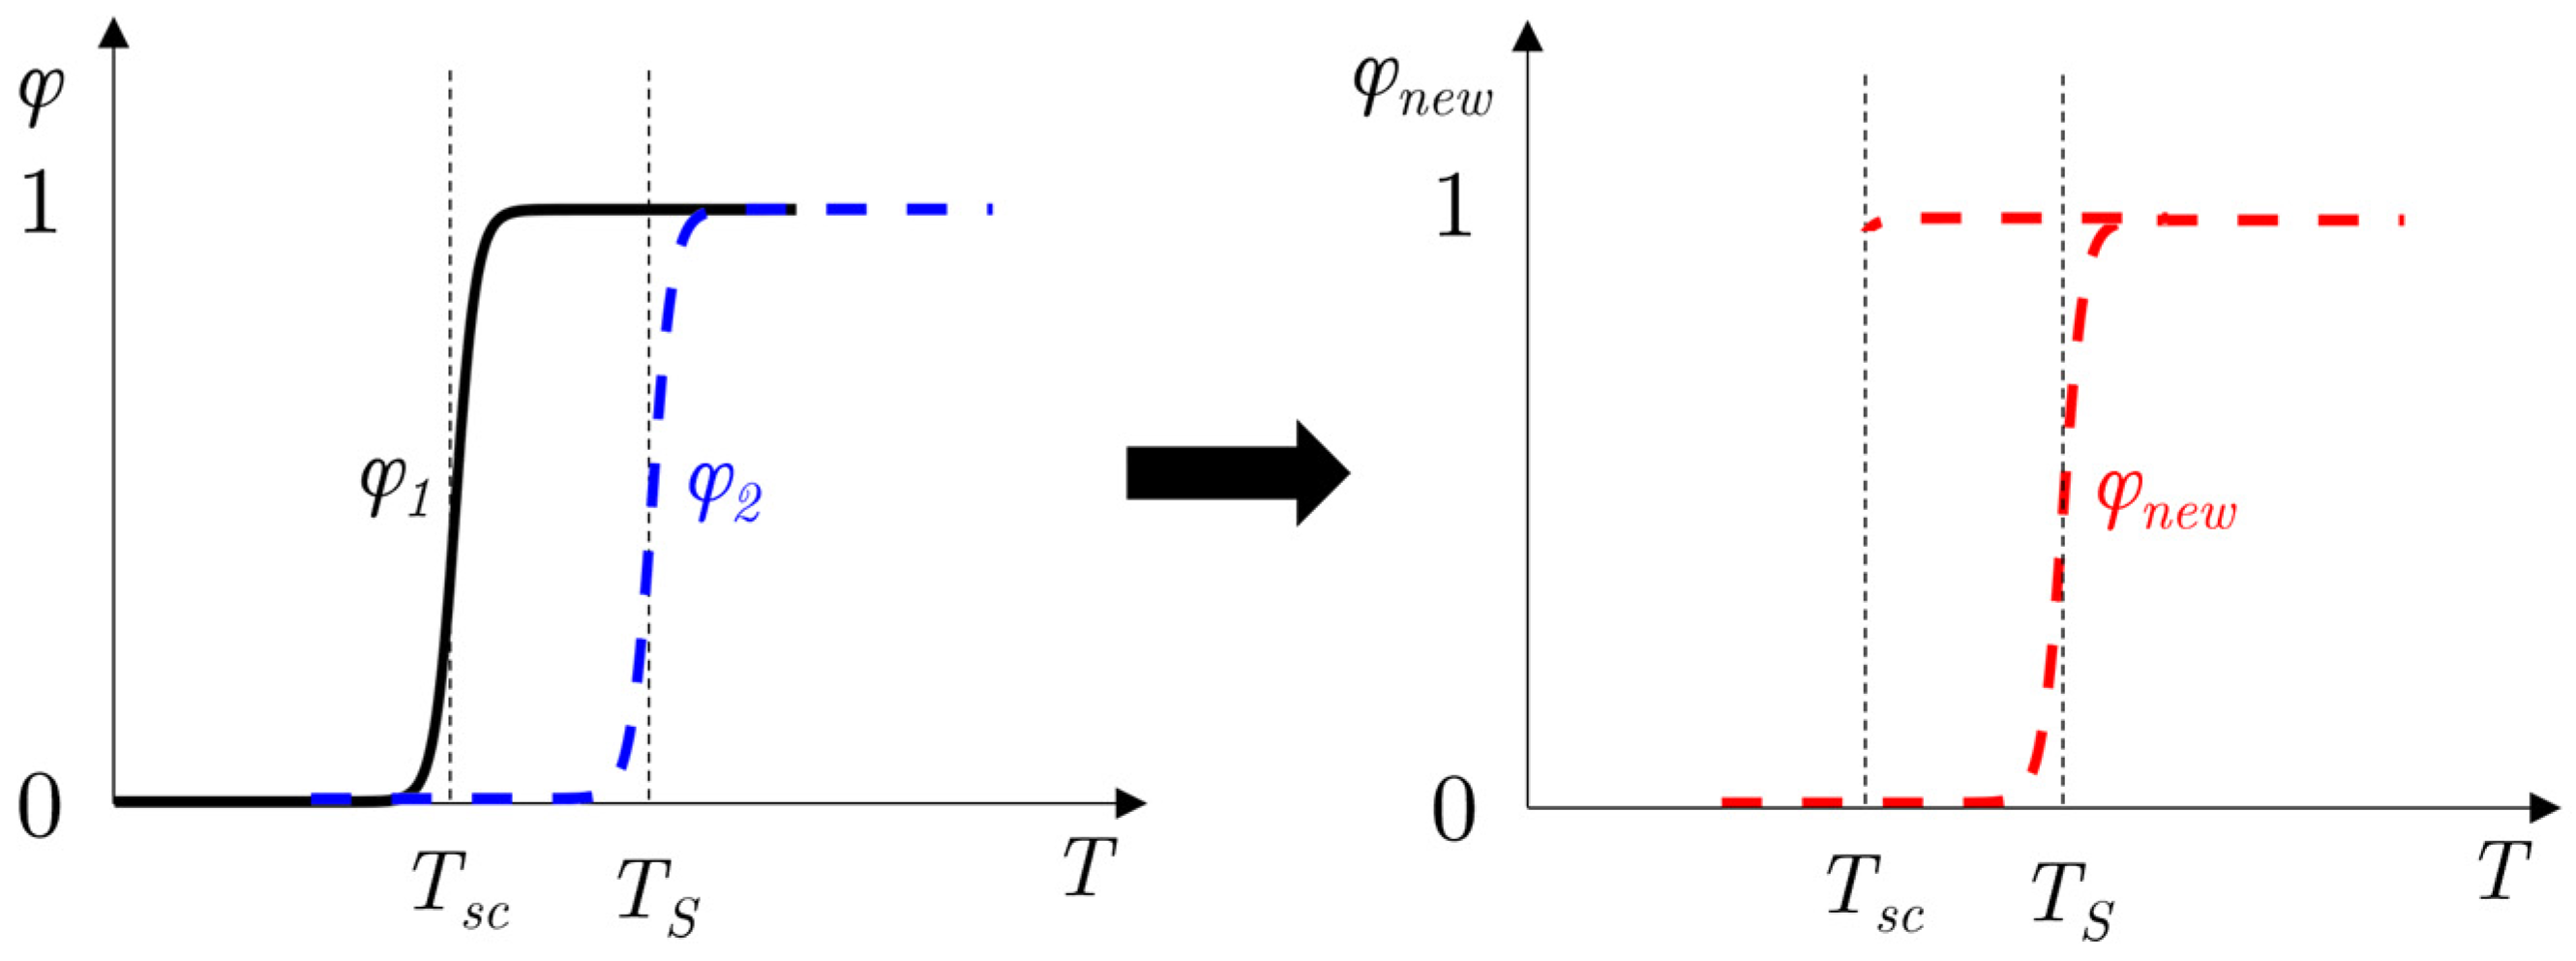
φ n e w ( T ) = φ 1 ( T s c ) φ s t a t e +   φ 2 ( T S ) ( 1 φ s t a t e )
where φ1 and φ2 are the liquid fractions computed with respect to the subcooling temperature and the solidification temperature, respectively (see Figure 7). Therefore, during the cooling, φ1 is equal to 1 until the temperature reaches Tsc, and becomes 0 for lower temperatures. Likewise, φ2 stays equal to 1 until T = TS and then becomes 0. By doing so, in the first stage the PCM will follow the φ1 curve that imposes a value of the liquid fraction equal to 1 until the subcooling point is reached. As soon as the temperature drops below this value, φstate turns into 0 and the original curve (φ2) becomes the new liquid fraction curve to be followed.
On the other hand, the way the variable Qstate influences the PCM behavior is explained in the following equation. This variable defines a new contribution in the energy equation due to recalescence. Specifically, this term reduces the overall “cold energy” that can be stored by the PCM, of a quantity that is the energy required to bring the temperature back from subcooling to solidification temperature. Thus, an energy source term (Ssc) needs to be summed to the original one (Sh) that accounts for latent heat. In detail, the integral of the thermal power exchanged between the two time instants Tsc and TS is equal to the stored energy with respect to the corresponding temperatures, Tsc and TS. It is summarized as follows:
t s c t S S s c   d t = T s c T S c P C M ρ P C M d T
Referring to the mean value ( S ¯ s c ) and considering the control variable governing its activation (Qstate), the contribution is written as:
S ¯ s c = Q s t a t e c P C M ρ P C M ( T S T s c ) / Δ t s c
where Δtsc is the time interval that defines how long the subcooling lasts, i.e., how much time is required for the system to go from Tsc to Ts. In the presented model, Δtsc needs to be set according to experimental results and therefore involves a calibration process of the model. The source term for the energy equation is formulated as:
S t o t = S h + S ¯ s c = ρ P C M L f φ 2 t ( 1 φ s t a t e ) + Q s t a t e c P C M ρ P C M ( T S T s c ) / Δ t s c
Lastly, the effect of subcooling on the thermal conductivity is encompassed through the definition of an effective property (keff), whose definition is strictly linked to the one of φnew:
k e f f = k s + ( k l k s ) φ n e w
Equation (8) makes the effective thermal conductivity equal to kl until φnew is equal to 1, after which the actual value of keff depends on the melt fraction value (φ2).

2.5. DSC-Based Model

The second predictive model proposed in this study is here shown. From the DSC analysis, one can evaluate the main parameters associated with melting/solidification, i.e., melting/crystallization temperature, enthalpy, and latent heat. The melting temperature is the temperature at the onset of the peak, evaluated by the intersection between the baseline and the tangent to the decreasing branch on the inflexion point [34]. The enthalpy of fusion is computed as the integral over the curve and the baseline with respect to the time.
The thermal analysis of PureTemp15 is performed using the differential scanning calorimetry (DSC) 250 from TA Instruments, with a sample weight of 7.19 mg. Data were sampled every 0.1 s and the following test schedule was adopted:
  • isotherm at 40 °C (2 min);
  • ramp from 40 °C to 0 °C, at −0.5 °C/min;
  • isotherm at 0 °C (2 min);
  • ramp from 0 °C to 40 °C at +0.5 °C/min.
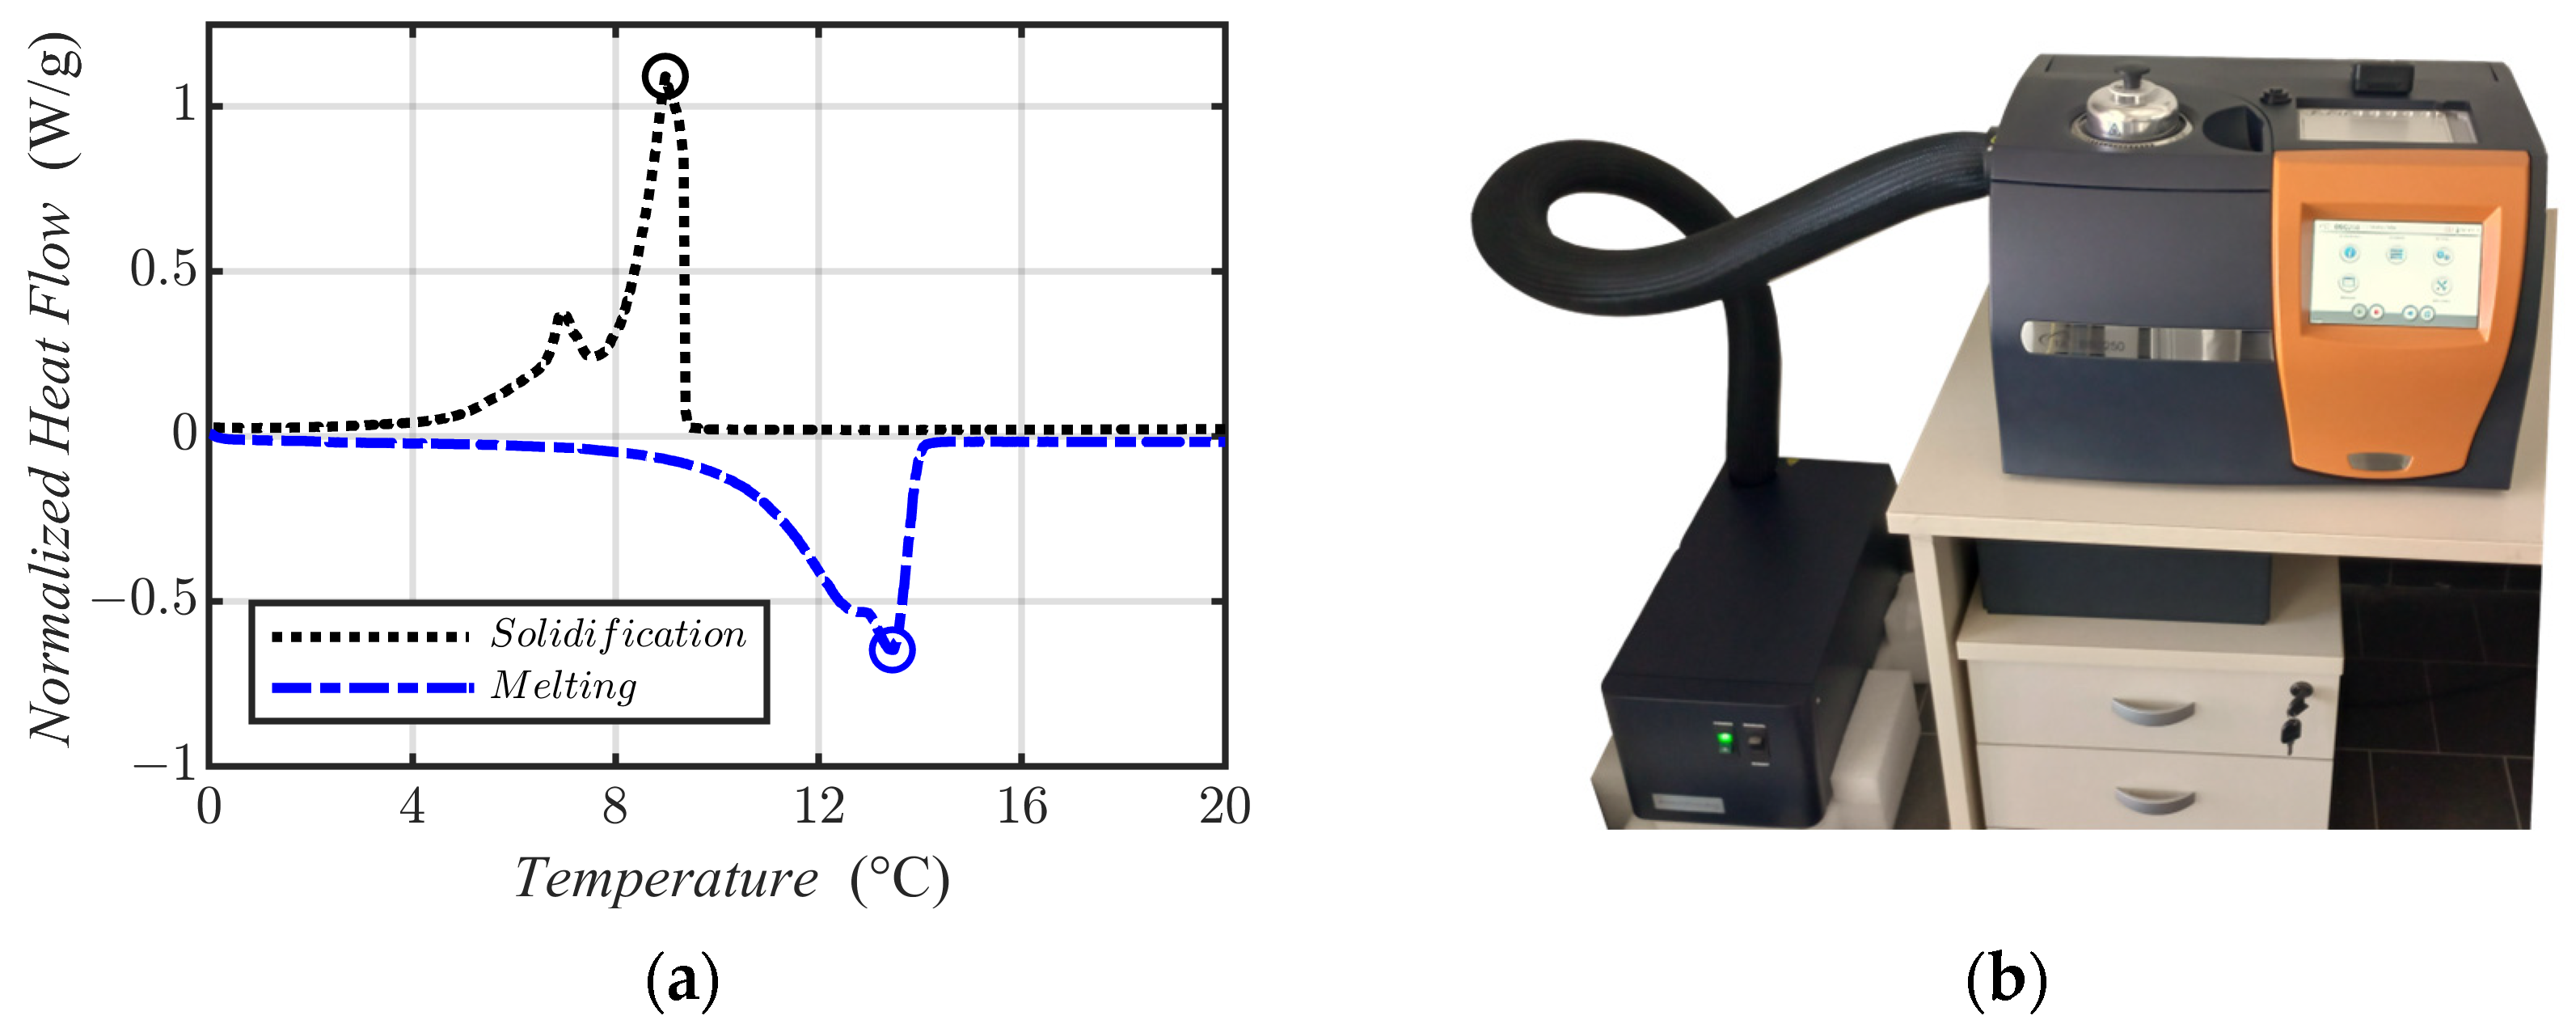
Figure 8 shows the normalized heat flow exchanged—by dividing the heat flow signal by the sample weight—with the sample during solidification and melting together with the experimental apparatus used to perform the evaluation. Results from the present biological PCM sample show a latent heat of 181.89 J/g if referred to the solidification and 180.61 J/g if referred to the melting, which is in good agreement with the certified values from the PureTemp15 catalogue. The peak temperature for solidification and melting are 8.98 °C and 13.46 °C, respectively.
The DSC analysis is propaedeutic to the evaluation of the specific heat that is used in the DSC-based model to properly define the energy stored by the PCM during the phase change. Thus, considering that when a material is heated at a constant rate, the heat flow into it is related to its specific heat, we can evaluate this property as follows:
c = 1 m d H d t d t d T
where m is the sample mass; dH/dt is the heat flow; and dt/dT is the reciprocal of the heating rate. The resulting c curves for both solidification and melting are displayed in Figure 9. The solidification curve is fitted into the model so that each temperature value is associated with the actual value of the specific heat of the PCM. This allows the model to be modified without imposing a priori the value of the solidification temperature TS.

3. Results

The results for the PCM temperature evolution through time are presented in this section. Firstly, measured temperature evolutions on lateral thermocouples positions are discussed. Then, the comparison with both the presented models is proposed, i.e., the subcooling-based model and the DSC-based model. Those models have been simulated through a finite element code. The water inlet mass flow rate is 0.075 kg/s, while the inlet temperature changes over time, i.e., 8 °C until 7 h, then increases by 0.8 °C every hour. The PCM region’s horizontal and right-vertical boundaries are considered adiabatic. This means that heat transfer across the upper boundary is ignored since the air volume between the PCM free surface, lateral shell gap, and upper tube sheet is a poor thermal conductor. The lower plenum is also considered adiabatic due to its limited length compared to the vertical length. Since the temperature distribution at t = 0 is non-uniform, experimental data are fitted with a cubic polynomial with an R2 of 0.99, i.e., T(z) = −2.8z3 + 8.6z +15. This formulation represents a good trade-off between modelling complexity and accuracy of the right initial condition for the thermal problem. Opting for a higher order polynomial did not lead to any further improvement. The momentum equation’s boundary conditions are consistent with the problem formulation, with no-slip conditions on the boundaries of PCM laps stainless steel and slip conditions on the upper and lateral boundaries. All cases analyzed are computed on a workstation equipped with an Intel® Core TM i7-10700KF 3.80 GHz CPU and 64 GB of RAM at 2133 MHz. Grid convergence was validated prior to finding a balance between model accuracy and running times. As a result, a mesh level of 31,084 triangular elements with boundary refinement is used.
Two statistical parameters, i.e., mean absolute error (MAE) and root mean square error (RMSE), are used to compare experimental and numerical results. In detail, those indices are evaluated according to Equations (10) and (11), respectively:
M A E = 1 N d a t a n = 1 N d a t a y n u m , n y e x p , n
R M S E = 1 N d a t a n = 1 N d a t a y n u m , n y e x p , n 2
Ndata represent the number of temperature values recorded in the experimental tests, while Tnum and Texp are the time-by-time numerical and experimental temperature values, respectively.

3.1. Experimental Results

The PCM experimental behavior related to the four lateral thermocouples (see Figure 2) is shown in Figure 10. These thermocouples are placed on three stages at different heights, i.e., L = 0.195 m, L = 0.585 m, L = 0.975 m, as depicted in Figure 10d. These levels are labelled as lower, medium, and upper levels. Thus, for each level four temperature evolutions are shown. There is a marked difference between the PCM temperature trends on the lower and medium level, which can be explained by the influence of the lower plenum and the heat transfer fluid (HTF) non-uniform distribution inside the tube bundle. For the last level, i.e., the upper, these effects are mitigated. The experimental results show a non-negligible subcooling, meaning that the PCM continues to store sensible heat since crystallization has not yet started. The actual melting point value remains around 12 °C. This subcooling phenomenon lasts about 1.5/2 h, and it is characterized by a difference between subcooling, Tsc, and solidification, Ts, temperatures, of about 1 °C.

3.2. Numerical Results: First Model

In this section, we aim to compare numerical outcomes obtained through the first subcooling model with the experimental results already shown. In detail, different from the previous figure, the experimental temperature evolutions are shown here as an average temperature for each level, i.e., a mean value for the four thermocouples’ data. This is reasonable because of the not so-high spatial deviations.
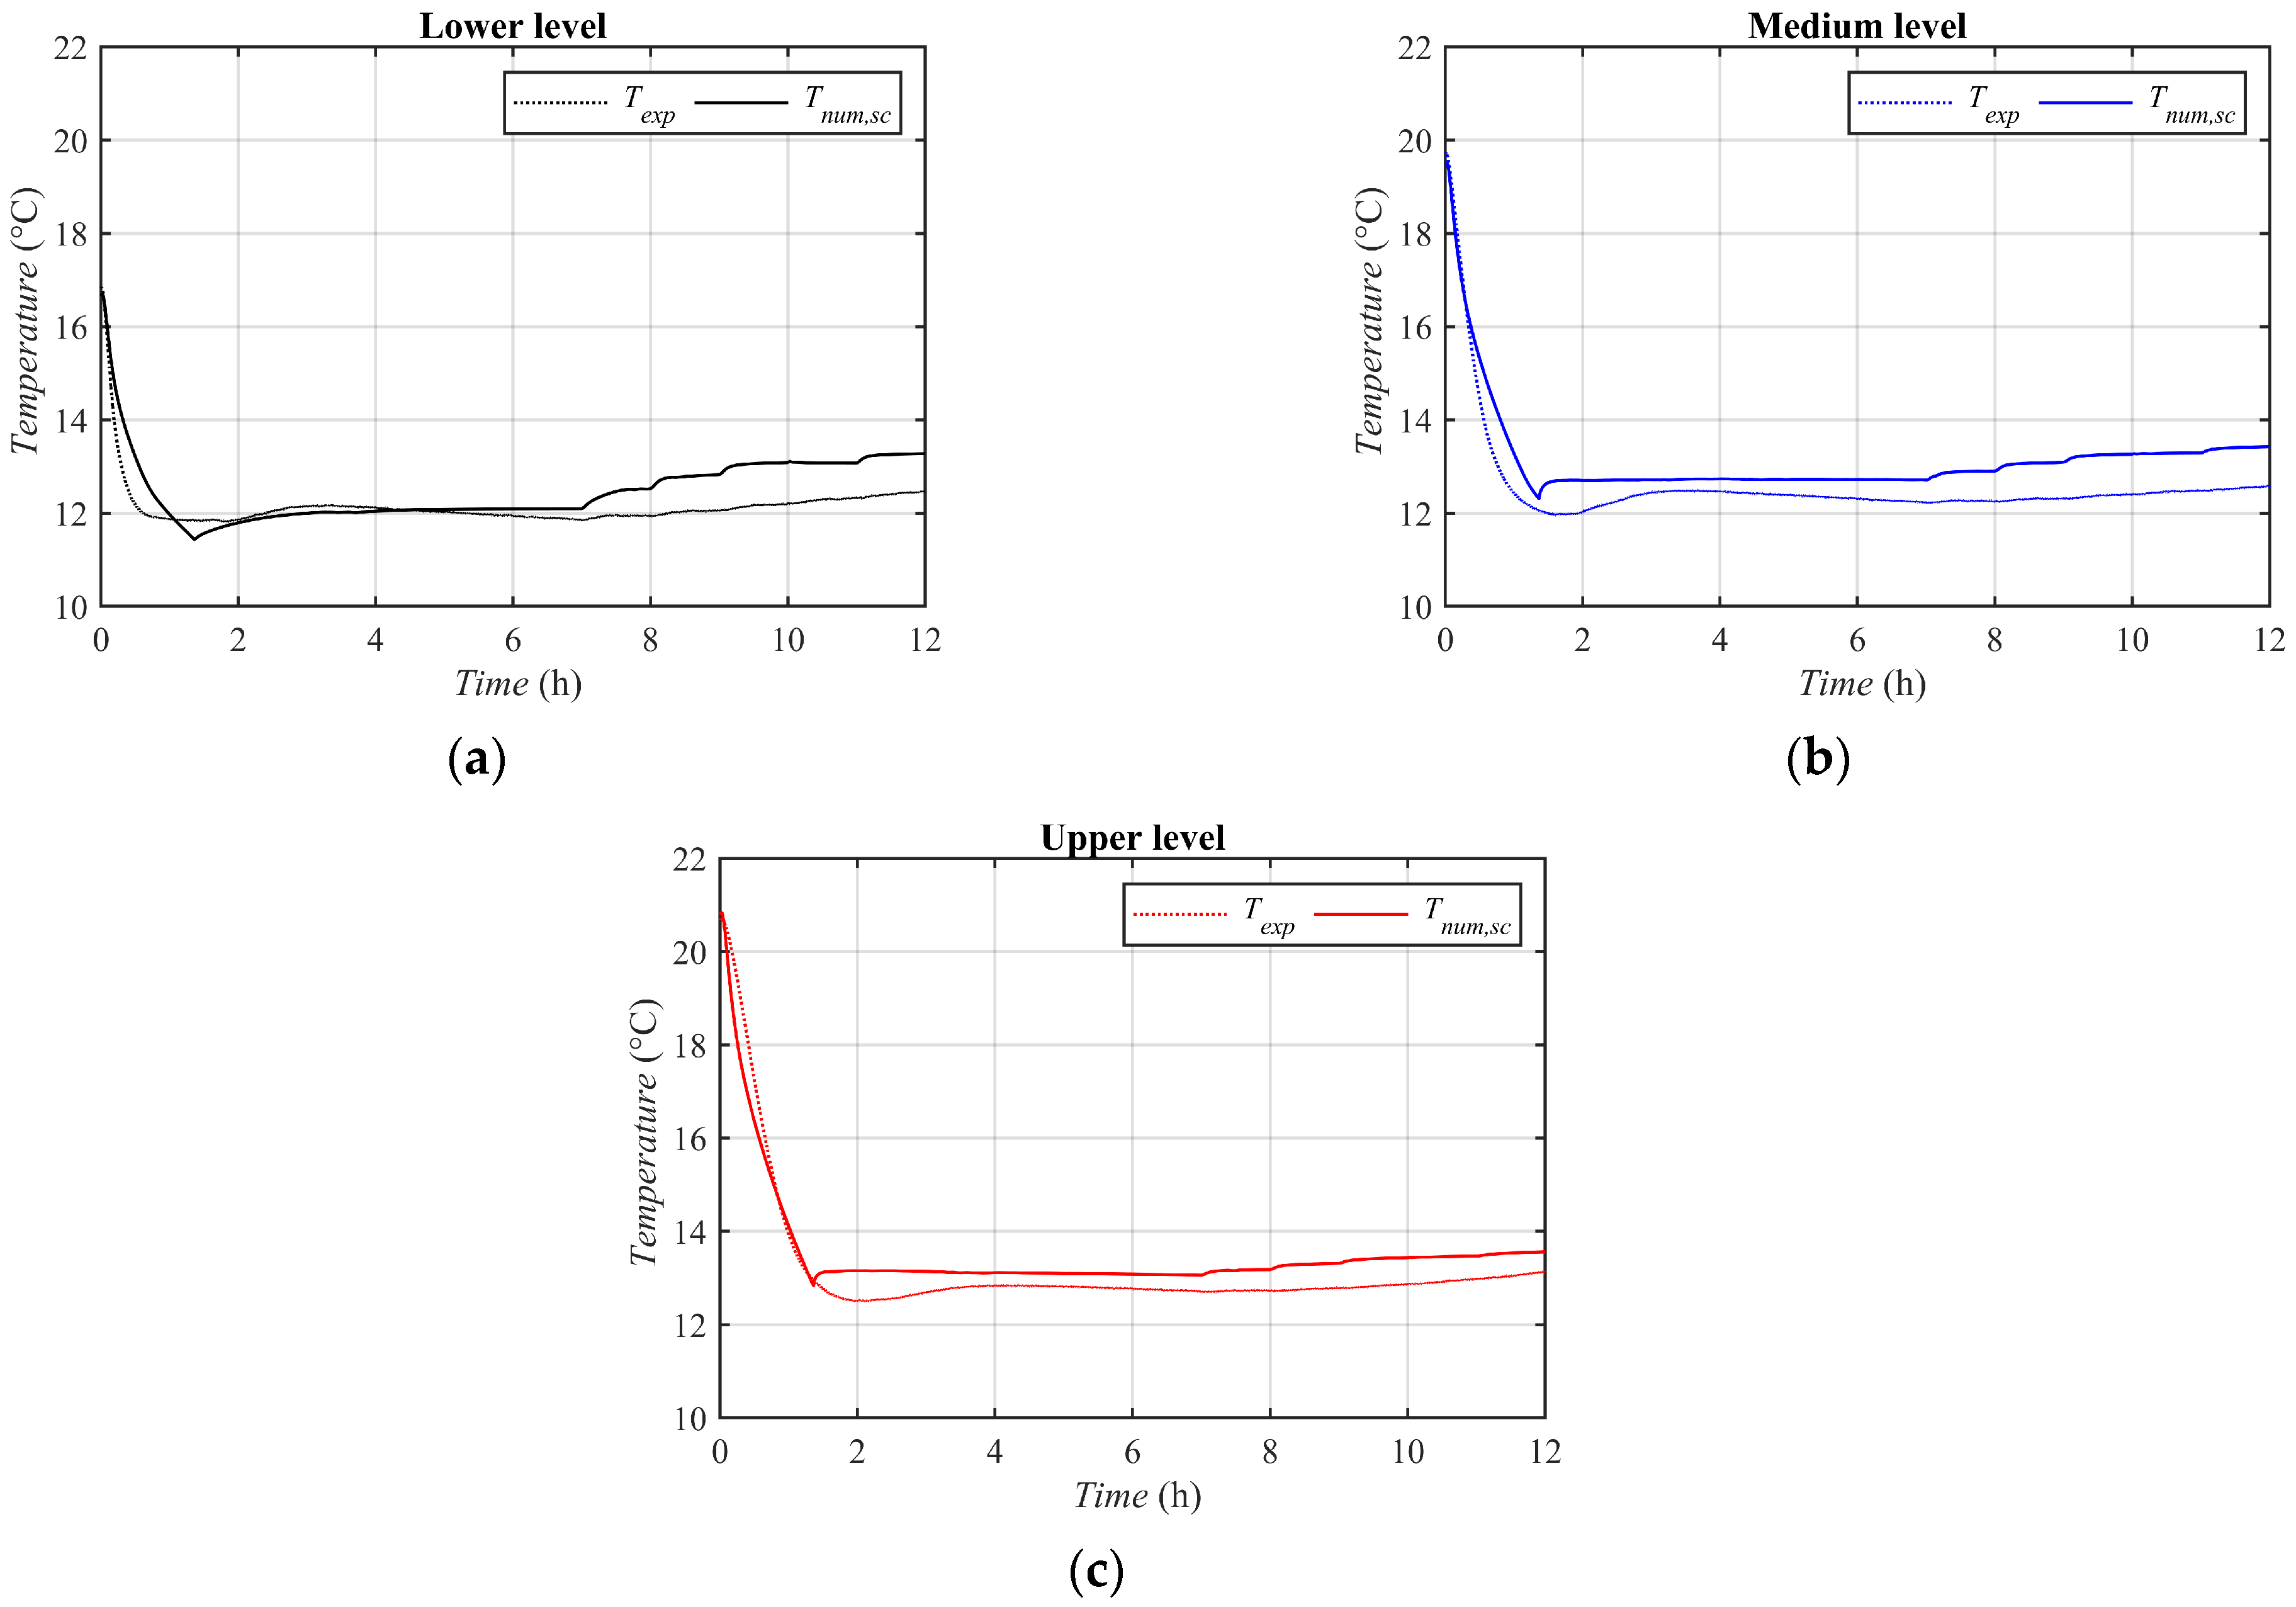
The obtained predicted averaged temperatures are shown in Figure 11 together with the temperatures averaged from the four thermocouples at each level, showing that the numerical findings closely resembled the experimental data. The main difference between the numerical model and experimental data is in how the subcooling, that arises at about t = 1 h, is predicted. Within the experimental runs, due to a moderate thermal diffusivity, the temperature shows a gradual rising from the point of solidification initiation (Tsc) to the actual solidification temperature (TS). On the contrary, in the numerical model, this transition occurs at a faster rate depending on the analyzed level, due to the absence of inertia in the activation of control variables. These variables act instantaneously once the temperature values set as a threshold are exceeded, determining an instantaneous response. Regarding the lower level (Figure 11a), subcooling occurs later than in the experimental evidence, specifically after 1 h and 15 min from the start, while the effective one is in the first 30 min. As one moves up to higher levels of the tank (Figure 10b,c), this discrepancy initially decreases, e.g., at the medium level where the two moments are almost identical, and even reverses for the top level, where subcooling occurs earlier than in the experimental evidence. Numerically, even looking at different levels, the moment when subcooling occurs is always the same, as a consequence of the adoption of the purely conductive model. This means that the first part of the control variable, say when φnew is activated, works pretty well. Experimentally, the change that occurs at the beginning of the solidification process is a result of some natural convection that arises. Nevertheless, the good agreement between the data is proved by the values of the statistical parameters (MAE and RMSE).
Specifically, the MAE value for each level is equal to 0.54, 0.78, and 0.58 °C, for the lower, medium, and upper level, respectively. It should be noted that these values are relatively close to the absolute value of the thermocouple accuracy, i.e., 0.5 °C, which indicates that the model results are reasonably comparable to the experimental behavior. Furthermore, this is confirmed by the values of the RSME, i.e., 0.63, 0.84, and 0.60 °C, for the lower, medium, and upper level, respectively. A further aspect to note is the sensitivity of the model to the boundary condition: for the lower level, in fact, at t = 7 h the model is much more sensitive to temperature variations than was observed experimentally. This difference tends to cancel out going up towards the upper levels. Overall, the comparison between the numerical and experimental plots showed that the numerical model accurately represented the real system. However, it is worth noting that here only one parameter has to be tuned in the subcooling model, i.e., Δtsc, set equal to 1.5 h, according to the experimental evidence; thus, the accuracy of the present prediction might be affected by this.

3.3. Numerical Results: Second Model

Figure 12 presents experimental and numerical results of the charging solidification process of the PCM temperature when the second model based on DSC outcomes is considered. The main evidence that stands out from Figure 12 is that using the DSC model the subcooling phenomenon is totally ignored, resulting in an effective solidification temperature that is notably lower than the actual one.
As a result, temperatures are generally an underestimation of the observed ones; this can be attributed to the fact that the actual temperature evolution is influenced by the stratification inside the PCM, which leads to higher discrepancies for the upper level, where the natural convection magnitude is larger. Indeed, the DSC outcomes suggest a solidification temperature of 9.35 °C, which is sensibly lower than the one experimentally recorded for the PCM inside the shell-and-tube thermal storage, i.e., around 12 °C. As a consequence of the effective PCM stratification in the shell-and-tube storage, the difference between the presented data increases from the lower to the upper level. This brings poor MAE and RMSE values: 2.21 and 2.46 °C for the lower level, 2.33 and 2.53 °C for the medium level, and 2.42 and 2. 61 °C for the upper level.

4. Conclusions

This work experimentally and numerically analyzes the solidification process of a biological PCM inside a shell-and-tube heat exchanger latent heat–cold thermal energy storage, with water as the working fluid. In depth, since the tested PCM suffers from subcooling, two numerical models are presented to predict that phenomenon. One is based on a 2D conduction-based finite element code, including the subcooling effect through a control variable approach that took inspiration from a thermostat control system; on the other hand, the second model is based on the outcomes of a DSC analysis carried on 7.19 mg of PureTemp15 PCM.
Experimental results, as temperature evolutions recorded by four thermocouples located at different heights of the storage tank, are compared with the analogous temperature trends evaluated on the 2D axisymmetric models. The first model—based on the proposed control variables approach—allows a proper consideration of the subcooling thanks to two new state variables, i.e., φstate and Qstate, which act on the melt fraction and stored energy, respectively. This model demonstrates a satisfactory prediction of the experimental data, with low values of mean absolute error (MAE) and root mean square error (RMSE) always lower than 1 °C. On the contrary, the DSC-based model shows shortcomings in correctly predicting temperature evolutions.
In conclusion, while the control variable approach has shown promising results for PCM subcooling modeling, there is still room for improvement. One limitation of the method is the need to define a priori the value of Δtsc, which requires experimental evidence and can be further tuned. To overcome this issue, future work should focus on introducing a term that allows for the accommodation of the effective temperature slope during PCM subcooling. By doing so, we can improve the accuracy of the model and gain a better understanding of the subcooling process; convection effects will also be included.

Author Contributions

Conceptualization: N.B., A.F., M.I., G.M.M. and L.M.; methodology: N.B., A.F., M.I., G.M.M. and L.M.; software, validation, formal analysis, investigation, resources, visualization, and data curation: N.B., A.F., M.I., G.M.M. and L.M.; writing—original draft preparation: N.B., A.F., M.I., G.M.M. and L.M.; writing—review and editing: N.B., A.F., M.I., G.M.M. and L.M.; supervision, project administration, and funding acquisition: L.M. All authors have read and agreed to the published version of the manuscript.

Funding

This research was funded by the Italian Ministry of Economic Development, within the research project “RdS-PAR 2019–2021”.

Data Availability Statement

The data from the present research are available upon request to the authors.

Conflicts of Interest

The authors declare no conflict of interest.

Nomenclature

cspecific heat (J/kg/K)
ggravitational acceleration (m/s2)
henthalpy (J/kg/K)
kthermal conductivity (W/m/K)
Lheat storage tank height (m)
Lflatent heat of fusion (J/kg)
ppressure (Pa)
Qheat source (W/m3)
sthickness (m)
ttime (s)
Ttemperature (K)
Greek Symbols
Δinterval
µdynamic viscosity (Pa s)
ρdensity (kg/m3)
φmelt fraction
Subscripts
effeffective
expexperimental
HTFheat transfer fluid
ininlet
initinitial
intinternal
Lliquid
mmean
Mmelting
numnumerical
outoutlet
Ssolid
scsubcooling
statestate variable
ttube
Acronyms
LHTESlatent heat thermal energy storage
MAEmean absolute error
PCMphase change material
RMSEroot mean square error
STHEshell-and-tube heat exchanger

References

  1. Cabeza, L.; Mehling, H. Heat and Cold Storage with PCM: An up to Date Introduction into Basics and Applications; Springer: Berlin/Heidelberg, Germany, 2008; ISBN 978-3-642-08807-0. [Google Scholar]
  2. Jouhara, H.; Żabnieńska-Góra, A.; Khordehgah, N.; Ahmad, D.; Lipinski, T. Latent Thermal Energy Storage Technologies and Applications: A Review. Int. J. Thermofluids 2020, 5–6, 100039. [Google Scholar] [CrossRef]
  3. Rostami, S.; Afrand, M.; Shahsavar, A.; Sheikholeslami, M.; Kalbasi, R.; Aghakhani, S.; Shadloo, M.S.; Oztop, H.F. A Review of Melting and Freezing Processes of PCM/Nano-PCM and Their Application in Energy Storage. Energy 2020, 211, 118698. [Google Scholar] [CrossRef]
  4. Bianco, N.; Busiello, S.; Iasiello, M.; Mauro, G.M. Finned Heat Sinks with Phase Change Materials and Metal Foams: Pareto Optimization to Address Cost and Operation Time. Appl. Therm. Eng. 2021, 197, 117436. [Google Scholar] [CrossRef]
  5. Bianco, N.; Caliano, M.; Fragnito, A.; Iasiello, M.; Mauro, G.M.; Mongibello, L. Thermal Analysis of Micro-Encapsulated Phase Change Material (MEPCM)-Based Units Integrated into a Commercial Water Tank for Cold Thermal Energy Storage. Energy 2023, 266, 126479. [Google Scholar] [CrossRef]
  6. NematpourKeshteli, A.; Iasiello, M.; Langella, G.; Bianco, N. Enhancing PCMs Thermal Conductivity: A Comparison among Porous Metal Foams, Nanoparticles and Finned Surfaces in Triplex Tube Heat Exchangers. Appl. Therm. Eng. 2022, 212, 118623. [Google Scholar] [CrossRef]
  7. Iasiello, M.; Mameli, M.; Filippeschi, S.; Bianco, N. Metal Foam/PCM Melting Evolution Analysis: Orientation and Morphology Effects. Appl. Therm. Eng. 2021, 187, 116572. [Google Scholar] [CrossRef]
  8. Dinesh, B.V.S.; Bhattacharya, A. Effect of Foam Geometry on Heat Absorption Characteristics of PCM-Metal Foam Composite Thermal Energy Storage Systems. Int. J. Heat Mass Transf. 2019, 134, 866–883. [Google Scholar] [CrossRef]
  9. Abdi, M.; Chaib, K.; Menouer, A.; Benferhat, S. A Natural Convection Conjugate Heat Transfer of Nano-Encapsulated Phase Change Materials (NEPCMs) in an Inclined Blocked Square Enclosure. Numer. Heat Transf. Part A Appl. 2022, 1–22. [Google Scholar] [CrossRef]
  10. Abderrahmane, A.; Qasem, N.A.A.; Mourad, A.; Al-Khaleel, M.; Said, Z.; Guedri, K.; Younis, O.; Marzouki, R. Enhancing the Melting Process of Shell-and-Tube PCM Thermal Energy Storage Unit Using Modified Tube Design. Nanomaterials 2022, 12, 3078. [Google Scholar] [CrossRef]
  11. González-Peña, D.; Alonso-deMiguel, I.; Díez-Mediavilla, M.; Alonso-Tristán, C. Experimental Analysis of a Novel PV/T Panel with PCM and Heat Pipes. Sustainability 2020, 12, 1710. [Google Scholar] [CrossRef] [Green Version]
  12. Moench, S.; Dittrich, R. Influence of Natural Convection and Volume Change on Numerical Simulation of Phase Change Materials for Latent Heat Storage. Energies 2022, 15, 2746. [Google Scholar] [CrossRef]
  13. Soni, M.K.; Tamar, N.; Bhattacharyya, S. Numerical Simulation and Parametric Analysis of Latent Heat Thermal Energy Storage System. J. Therm. Anal. Calorim. 2020, 141, 2511–2526. [Google Scholar] [CrossRef]
  14. Fragnito, A.; Bianco, N.; Iasiello, M.; Mauro, G.M.; Mongibello, L. Experimental and Numerical Analysis of a Phase Change Material-Based Shell-and-Tube Heat Exchanger for Cold Thermal Energy Storage. J. Energy Storage 2022, 56, 105975. [Google Scholar] [CrossRef]
  15. Que, L.; Zhang, X.; Ji, J.; Gao, L.; Xie, W.; Liu, L.; Ding, X. Numerical Simulation and Experimental Research Progress of Phase Change Hysteresis: A Review. Energy Build. 2021, 253, 111402. [Google Scholar] [CrossRef]
  16. Shamseddine, I.; Pennec, F.; Biwole, P.; Fardoun, F. Supercooling of Phase Change Materials: A Review. Renew. Sustain. Energy Rev. 2022, 158, 112172. [Google Scholar] [CrossRef]
  17. Biswas, K.; Shukla, Y.; Desjarlais, A.; Rawal, R. Thermal Characterization of Full-Scale PCM Products and Numerical Simulations, Including Hysteresis, to Evaluate Energy Impacts in an Envelope Application. Appl. Therm. Eng. 2018, 138, 501–512. [Google Scholar] [CrossRef]
  18. Hu, Y.; Guo, R.; Heiselberg, P.K.; Johra, H. Modeling PCM Phase Change Temperature and Hysteresis in Ventilation Cooling and Heating Applications. Energies 2020, 13, 6455. [Google Scholar] [CrossRef]
  19. Kuznik, F.; Virgone, J. Experimental Investigation of Wallboard Containing Phase Change Material: Data for Validation of Numerical Modeling. Energy Build. 2009, 41, 561–570. [Google Scholar] [CrossRef]
  20. Barz, T.; Sommer, A. Modeling Hysteresis in the Phase Transition of Industrial-Grade Solid/Liquid PCM for Thermal Energy Storages. Int. J. Heat Mass Transf. 2018, 127, 701–713. [Google Scholar] [CrossRef]
  21. Günther, E.; Huang, L.; Mehling, H.; Dötsch, C. Subcooling in PCM Emulsions—Part 2: Interpretation in Terms of Nucleation Theory. Thermochim. Acta 2011, 522, 199–204. [Google Scholar] [CrossRef]
  22. Taylor, R.A.; Tsafnat, N.; Washer, A. Experimental Characterisation of Sub-Cooling in Hydrated Salt Phase Change Materials. Appl. Therm. Eng. 2016, 93, 935–938. [Google Scholar] [CrossRef]
  23. Azad, M.; Groulx, D.; Donaldson, A. Natural Convection Onset during Melting of Phase Change Materials: Part I—Effects of the Geometry, Stefan Number, and Degree of Subcooling. Int. J. Therm. Sci. 2021, 170, 107180. [Google Scholar] [CrossRef]
  24. Vikram, M.P.; Kumaresan, V.; Christopher, S.; Velraj, R. Experimental Studies on Solidification and Subcooling Characteristics of Water-Based Phase Change Material (PCM) in a Spherical Encapsulation for Cool Thermal Energy Storage Applications. Int. J. Refrig. 2019, 100, 454–462. [Google Scholar] [CrossRef]
  25. Faucheux, M.; Muller, G.; Havet, M.; LeBail, A. Influence of Surface Roughness on the Supercooling Degree: Case of Selected Water/Ethanol Solutions Frozen on Aluminium Surfaces. Int. J. Refrig. 2006, 29, 1218–1224. [Google Scholar] [CrossRef]
  26. Ribezzo, A.; Falciani, G.; Bergamasco, L.; Fasano, M.; Chiavazzo, E. An Overview on the Use of Additives and Preparation Procedure in Phase Change Materials for Thermal Energy Storage with a Focus on Long Term Applications. J. Energy Storage 2022, 53, 105140. [Google Scholar] [CrossRef]
  27. Thonon, M.; Fraisse, G.; Zalewski, L.; Pailha, M. Analytical Modelling of PCM Supercooling Including Recalescence for Complete and Partial Heating/Cooling Cycles. Appl. Therm. Eng. 2021, 190, 116751. [Google Scholar] [CrossRef]
  28. Bony, J.; Citherlet, S. Numerical Model and Experimental Validation of Heat Storage with Phase Change Materials. Energy Build. 2007, 39, 1065–1072. [Google Scholar] [CrossRef]
  29. Günther, E.; Mehling, H.; Hiebler, S. Modeling of Subcooling and Solidification of Phase Change Materials. Model. Simul. Mater. Sci. Eng. 2007, 15, 879–892. [Google Scholar] [CrossRef]
  30. Uzan, A.Y.; Kozak, Y.; Korin, Y.; Harary, I.; Mehling, H.; Ziskind, G. A Novel Multi-Dimensional Model for Solidification Process with Supercooling. Int. J. Heat Mass Transf. 2017, 106, 91–102. [Google Scholar] [CrossRef]
  31. Jin, X.; Hu, H.; Shi, X.; Zhou, X.; Yang, L.; Yin, Y.; Zhang, X. A New Heat Transfer Model of Phase Change Material Based on Energy Asymmetry. Appl. Energy 2018, 212, 1409–1416. [Google Scholar] [CrossRef]
  32. Davin, T.; Lefez, B.; Guillet, A. Supercooling of Phase Change: A New Modeling Formulation Using Apparent Specific Heat Capacity. Int. J. Therm. Sci. 2020, 147, 106121. [Google Scholar] [CrossRef]
  33. Brent, A.D.; Voller, V.R.; Reid, K.J. Enthalpy-Porosity Technique for Modeling Convection-Diffusion Phase Change: Application to the Melting of a Pure Metal. Numer. Heat Transf. 1988, 13, 297–318. [Google Scholar] [CrossRef]
  34. Jin, X.; Hu, H.; Shi, X.; Zhang, X. Energy Asymmetry in Melting and Solidifying Processes of PCM. Energy Convers. Manag. 2015, 106, 608–614. [Google Scholar] [CrossRef]
Figure 1. Variations in subcooling and hysteresis as the solidification temperature (TS) varies, fixing melting (TM) and subcooling (TSC) temperatures: a higher TS implies higher subcooling and lower hysteresis.
Energies 16 04834 g001
Figure 2. Shell-and-tube latent heat storage: (a) shell appearance and thermocouples housing; (b) cross section view, tubes displacement. Laterals (1–4) and central (5) thermocouples positions.
Energies 16 04834 g002
Figure 3. Shell-and-tube latent heat storage modelling simplification: 2D axisymmetric model.
Energies 16 04834 g003
Figure 4. Comparison between ideal thermostat temperature evolution and temperature of PCM during subcooling.
Energies 16 04834 g004
Figure 5. Subcooling effect on enthalpy: temperature.
Energies 16 04834 g005
Figure 6. Scheme of the state variables working principles for subcooling modeling: φstate is responsible for the change in the liquid fraction behavior, and Qstate controls how fast the release of latent heat is inside PCM to cause a temperature increase after subcooling occurs.
Energies 16 04834 g006
Figure 7. Subcooling effect on melt fraction, φnew.
Energies 16 04834 g007
Figure 8. DSC analysis results: (a) normalized heat flow for solidification and melting; (b) TA Instruments DSC 250 equipment by WatersTM, New Castle, DE, USA (b).
Energies 16 04834 g008
Figure 9. Specific heat curves for heating and cooling rate of 0.5 °C/min.
Energies 16 04834 g009
Figure 10. Experimental results: (a) lower level PCM temperature; (b) medium level PCM temperature; (c) upper level PCM temperature; (d) 3 levels on which PCM temperature is recorded.
Energies 16 04834 g010
Figure 11. Subcooling model results vs. experimental data: evolution of (a) lower level PCM temperature; (b) medium level PCM temperature; (c) upper level PCM temperature.
Energies 16 04834 g011
Figure 12. DSC model results vs. experimental data: (a) lower level PCM temperature; (b) medium level PCM temperature; (c) upper level PCM temperature.
Energies 16 04834 g012
Disclaimer/Publisher’s Note: The statements, opinions and data contained in all publications are solely those of the individual author(s) and contributor(s) and not of MDPI and/or the editor(s). MDPI and/or the editor(s) disclaim responsibility for any injury to people or property resulting from any ideas, methods, instructions or products referred to in the content.