Abstract
Digital twin is often viewed as a technology that can assist engineers and researchers make data-driven system and network-level decisions. Across the scientific literature, digital twins have been consistently theorized as a strong solution to facilitate proactive discovery of system failures, system and network efficiency improvement, system and network operation optimization, among others. With their strong affinity to the industrial metaverse concept, digital twins have the potential to offer high-value propositions that are unique to the energy sector stakeholders to realize the true potential of physical and digital convergence and pertinent sustainability goals. Although the technology has been known for a long time in theory, its practical real-world applications have been so far limited, nevertheless with tremendous growth projections. In the energy sector, there have been theoretical and lab-level experimental analysis of digital twins but few of those experiments resulted in real-world deployments. There may be many contributing factors to any friction associated with real-world scalable deployment in the energy sector such as cost, regulatory, and compliance requirements, and measurable and comparable methods to evaluate performance and return on investment. Those factors can be potentially addressed if the digital twin applications are built on the foundations of a scalable and interoperable framework that can drive a digital twin application across the project lifecycle: from ideation to theoretical deep dive to proof of concept to large-scale experiment to real-world deployment at scale. This paper is an attempt to define a digital twin open architecture framework that comprises a digital twin technology stack (D-Arc) coupled with information flow, sequence, and object diagrams. Those artifacts can be used by energy sector engineers and researchers to use any digital twin platform to drive research and engineering. This paper also provides critical details related to cybersecurity aspects, data management processes, and relevant energy sector use cases.
1. Introduction
Modernization and automation of the connected electromechanical control systems are pivotal to Industry 4.0 architectures [1]. Such modernization through digitization can provide invaluable system information and capabilities needed to ensure economic viability, enhance efficiency, increase service reliability, improve resiliency, and expand the performance envelope of the facilities that host and operate these control systems. The purpose of such facilities can range from energy generation, transmission, and distribution to manufacturing of systems including distributed energy resources (DERs) and associated peripheral components. Despite the benefits of digitization and automation, such increased digitization equals increased system complexity, requiring a more systematic approach to reap the benefits of the new capabilities that digitization brings. Digital twin is seen as a powerful tool across many sectors/industries [2,3,4] for exercising the full capabilities of a system by using the system’s native sensing capabilities, combined with the mathematical processes, system dynamics, and physics-driven predictions, to provide system-specific insights and advanced analytics [5]. This can also balance capabilities with the incremental costs of system maintenance and the risk of component failures. The development of digital twins in the energy sector [6] is a unique opportunity to incorporate data streams (resource availability, temperature, dissolved gases, pressure, min or max flows, ramping rate limits, etc.) that account for dynamic external factors that rapidly alter the flexibility available for the generation facilities to respond to grid signals.
The concept of digital twins is not new [7], nor is its potential value proposition in advancing many of our antiquated infrastructures and operations. Despite the concept of digital twins being discussed and experimental for nearly two decades [7], the majority of the advancements have been a mix bag of early-stage research explorations, tabletop experiments, and ad hoc deployments. With cross-sector industries heading toward infrastructure advancements and modernization [8], it is vital for the industry players, including manufacturing entities and energy producing utilities, to use a scalable and interoperable digital twin framework for design, development, testing, and deployment. Furthermore, digital twins will enable industry players to operate with greater flexibility, improve physical process performance [9], and pursue additional revenue streams with a better understanding of the tradeoffs with operation and maintenance costs. Management of risks and costs will be more effective because digital twins will improve predictive maintenance and the safety of plant operation; inform health of equipment operation and system performance; and support staff training, engineering design, development of procedures, and effective emergency preparedness planning by being able to simulate drills and plant response (procedural and human factors). As with any technology, factors such as scalability, interoperability, security, trustworthiness, determination of information/data sources, and hosting infrastructure are critical for long-term design and deployment of digital twins [10].
Building scalable digital twins for power grid applications requires answering some fundamental questions: (1) What are the peripheral and integral building blocks of a digital twin for power systems applications? (2) What are the needed interactions and expected relationships between the physical grid systems and the respective digital twin models? (3) What level of granular modeling is required for digital twin’s comparative and reasonable behavior as compared to the physical counterparts? (4) What is the role of data in the end-to-end digital twin design and deployment process? (5) What are the critical cybersecurity aspects and network engineering consideration for a digital twin design process? (6) How should one model system level, subsystem level, network and security level, protocol level attributes, and parameters for a digital twin of the entire network? (7) What are the physical dependencies, software dependencies, and data dependencies for a power system network’s digital twin? and (8) What are the required underlying data orchestration processes? This paper attempts to provide insights into the above critical questions, supports the arguments by presenting a digital twin open architecture framework (D-Arc) with the characteristics shown in Figure 1, and expands on a streamlined set of processes pertaining to data flows and data orchestration that are at the core of a successful digital twin development.
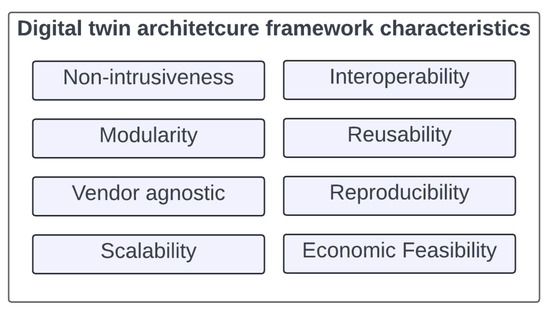
Figure 1.
Necessary characteristics of a digital twin architecture framework.
2. Novel Contributions and Structural Overview of the Paper
Novel contributions of this paper are as follows: (1) a D-Arc technology stack that is agnostic to any digital twin platform and grid systems; (2) process flows and pertinent definitions critical to design accurate and usable digital twins; and (3) a well-defined data orchestration model that is compatible with on-premises and cloud infrastructure. The paper supports these contributions through a detailed deep-dive into relationship models and depicts high-value use cases in the energy sector. This paper is organized with Section 2 providing an in-depth analysis of digital twins; their characteristics, types, and phases; and a handshake illustration between integral and peripheral components; and presents an overview of potential digital twin architectures. Section 3 is dedicated to a technical deep-dive into the D-Arc technology stack design, detailed analysis of the stack’s various layers and their relationships, sequential information flow and system relationship analysis using D-Arc for power grid digital twin modeling effort, sequence of steps to assist the digital twin designers in operationalizing D-Arc and its usability, and important cybersecurity risks and related mitigations for consideration during the design process. Based on the evidence from Section 3 regarding the data orchestration relationship and the importance of data, Section 4 is dedicated to the overall data orchestration process and provides in-depth analysis of various phases involved in the process and offers guidance on handling potential data anomalies and artifacts that are expected during the digital twin development process. Section 5 identifies high-value power grid use cases that have the potential to benefit from digital twins, and Section 6 provides the conclusion to the paper, identifying gaps in the current methodology that are yet to be addressed.
3. Digital Twins
Digital twin technology involves replicating a plant system design, operation, or process using mathematical models. Elements of a digital twin framework accommodate methods to obtain data needed to duplicate a virtual “twin” system, equipment, or process (e.g., sensor data and information) and methods to develop, deploy, and operate the digital twin model (DTM). Using these models, industry players can: (1) discover underlying problems and predict failures by monitoring parameters such as vibration and temperature; (2) get a real-time overview of system status, estimate remaining value of life using data from sensors, virtual sensors, etc., and initiate measures to address forecasted system challenges; (3) perform flow analysis and electromagnetic simulations, and provide other insights that could lead to change in operating conditions and discover ideal operating modes, from an economic standpoint, based on system status; (4) develop and study various “what if” scenarios on a digital twin component and discover system response; (5) gain information about the state of the system and implement predictive maintenance measures to avoid unplanned downtime and maximize availability; (6) explore abstract factory/plant/utility topologies and develop coupled multiphysics equations to understand site-specific customization with the physical system; (7) develop a dynamic view of the ability to operate flexibly in response to grid signals and identify constraints that cause bottlenecks; and (8) perform stress analysis and develop responses to:
- (a)
- subject digital twin components to varying stresses that cannot be predicted in advance, and predict wear and tear or system degradation due to excessive stress, which will enable timely replacement of the component before damage can occur and impede the downstream processes.
- (b)
- perform strength calculations to find critical points with maximum stresses on the system components.
- (c)
- determine current stress at the hot spots with a high degree of certainty at any time, ultimately enabling a robust service life calculation on that basis.
The process of digital twin development involves system modeling, modular system development, and decentralized sensor network technologies such as Cymbiote [11], VOLTTRON [12], and SerialTap [13], to satisfy DTM data requirements. Those technologies were designed to interface with physical and software systems to non-intrusively collect data. For instance, Cymbiote is a utility-scale tested system that can be connected to a physical system to collect network traffic, environmental parameters, and device-level characteristics. On a similar note, the VOLTTRON platform enables distributed sensing and controls and can be integrated with any control system. VOLTTRON has been used in power grid and smart building research to collect measurement data from hardware control systems such as water heaters, HVAC systems, photovoltaic systems, batteries and microgrid generation systems, and many more. Finally, SerialTap was developed to bridge the gap between older serial-based devices and modern networks in industrial control systems.
In the realm of algorithmic models that consume data from the above data acquisition systems and generate value-added information artifacts, researchers have been developing machine learning (ML) systems to use granular models from platforms such as Energy+ [14] and Modelica [15] to leverage partial knowledge of system dynamics and constraint enforcing multiobjective loss functions to effectively use small and static datasets. On-going DOE-funded research successfully demonstrated the effectiveness of a novel unifying framework for constrained optimal control of linear systems to provide stability guarantees for learned dynamics, robustness in the face of uncertainty, and high sampling efficiency [16]. In another DOE-funded effort, researchers have been developing physics-based sensor network modeling to predict failures [17]. Lessons learned from such existing research can be used to address challenges related to data gaps and physics-based modeling in DTM development.
The synchronicity between the building blocks of the DTM is critical for accurate functionality and deployability. Some of these types of challenges were addressed by proprietary digital twin research and solutions in thermal power and oil and gas domains [18]. It is evident that mature research exists across connecting elements of digital twin development, ranging from data acquisition to ML modeling. However, the disparate or ad hoc nature of how these research artifacts are connected to produce scalable, tangible, and operational digital twins is widely unexplored. Expanding upon the aforementioned limitations, this paper introduces a comprehensive framework that meticulously documents a universal backbone that facilitates the data orchestration processes for the research and development of digital twins. The remainder of this section will provide an overview of digital twin design and development processes and introduce a relevant framework in the context of the energy systems.
3.1. Types and Phases of Digital Twins
Digital twin signifies the digital representation through a model of a physical system, process, or any piece of equipment [19]. Figure 2 shows the primary components of a digital twin. It is evident from Figure 2 that the DTM can be developed using:
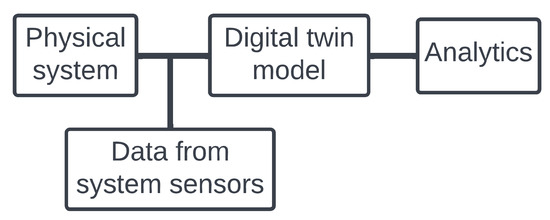
Figure 2.
Digital twin components.
- Virtual representations of the hardware components and their corresponding connections within a physical system.
- Real-time data from the system sensors that are integral or peripheral (example: Internet of Things) to the physical system.
The resultant model will facilitate estimating the performance evaluation and data analytics of the physical system, forecasting/predicting failures, and detecting anomalies. Since data are a critical component of an efficient DTM (or digital twin), the data orchestration process is inherent to the twin development process. There are two types of digital twins: project digital twin and performance digital twin.
- The goal of a project digital twin is to facilitate the design, simulation, and engineering of a physical asset/process or to modernize an existing physical asset.
- The goal of a performance digital twin is to facilitate efficient operations and maintain needed performance of an industrial system.
It is paramount to have good quality and well-managed data to have an effective and successful operation of a digital twin. In most cases that involve electromechnical systems that are at least partially network connected, it might be required to achieve a combination of a project digital twin and a performance digital twin.
Designing the appropriately sized and scalable digital twin archetypes for the physical systems will require the twin to have the following attributes:
- Accurate digital representation of the physical components that are integral to the physical system.
- Ability to simulate the industrial or network-wide operations of the physical system.
- Ability to facilitate smooth maintenance and operations of the physical system.
To fulfill the above attributes, the digital twin design and development process should be categorized into three phases [20]: (a) Design, (b) Build, and (c) Operate. The Design and Build phases are part of project digital twin, whereas the Operate phase is part of the performance digital twin.
- In the Design phase, the physical elements and virtual elements (software) will coordinate and collaborate in a single operation-oriented design of the system. This phase will involve architecting the virtual representation of the system through digital counterparts of the physical system’s hardware subcomponents. The Design phase can be performed on cloud or a physical system/server.
- The Build phase pertains to understanding the performance and behavioral elements of the system. These include attributes such as system tolerance, stress, and design. This phase is related to the simulation aspects of the digital twin. Simulation will provide an estimate of digital twin operations with respect to the physical system operations. Based on the simulated operations, system-level influencing factors and parameters can be determined. These controllable factors and parameters will be critical toward making performance and operational improvement decisions on the physical system.
- The Operate phase corresponds to the actual operations of the physical system and its attributes such as age, operational constraints, etc. In this phase, the digital twin is expected to run in real time alongside the physical system.
3.2. Potential Digital Twin Architectures
Data (such as measurements, system states, etc.) from the physical systems (such as sensors) and digital models (such as CAD-based, granular spice, etc.) are the main virtual/digital components of the digital twin. There are at least five possible architectures based on the digital twin location, data location, and sensor location:
- Data and digital twin on physical (on-premises) device
- Data on cloud (such as AWS) and digital twin on a physical (on-premises) device
- Data and digital twin on the same cloud service (such as AWS)
- Data on a physical (on-premises) device and digital twin on cloud (such as AWS)
- Data and digital twin on different cloud services (such as data: Azure; digital twin: AWS)
These architectures are driven by possible locations of the data repository and the digital twin. Irrespective of the architecture chosen for implementation, the following handshake diagram is valid for all architectures discussed here. It is important to note that the most important differences between the architectures are the data location (where the data repository is stored/located) and the location of the DTM.
As shown in Figure 3, there are several handshakes expected to happen in the digital twin environment. Note that the figure only provides a high-level overview of these handshakes. Cryptographic components such as data encryption and hashing are critical toward secure operations and accurate performance of the digital twin. Here is the walkthrough of Figure 3.
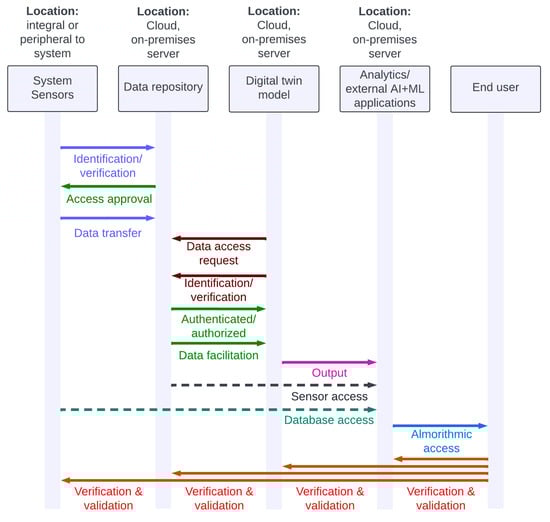
Figure 3.
Theoretical handshake between digital twin components.
- System sensors, components, or the system as a whole, when possible, may be expected to send the identification/verification information to the data repository to access and write to the data repository.
- Once the validation happens at the repository level, the physical systems are approved with write access privileges so the system sensors can periodically transfer measurement data to the repository.
- When the client/end user deploys the digital twin (application), the digital twin first requests the repository to gain read access to the measurement data. The digital twin will be required to send its identification information toward the authorization process.
- Once the repository validates and approves the read access, the digital twin can start accessing the data and activate its processes. These processes could be arithmetic, logical, or transcendental operations in nature.
- External applications such as ML peripheral software to perform detection, classification, forecasting, etc., will access the digital twin’s output. Note that the identification, authentication, and authorization steps pertaining to the external application is not discussed here. The external application may require going through standalone identification, authentication, and authorization steps with the digital twin (application) and potentially the data repository and sensors (based on the need and possibility). This will be required if the external application wants to verify the digital twin’s output and correlate with the input. This can be necessary to mitigate a man-in-the-middle attack.
- Depending on the digital twin’s environmental feasibility, there could also be a verification and validation process between the client/end user and the rest of the environmental components: external application, digital twin, data repository, and system sensors block. Such intricate security features can mitigate data corruption and related cyberattacks. However, this level of verification and validation may result in latencies and be nonfeasible with certain systems. Therefore, security enhancements should be weighed against the cost of implementation prior to designing the digital twin environment.
Implementing any of the above architectures would require a framework or software platform to facilitate such development and deployment. The following sections present such framework called D-Arc and provide a theoretical depiction of using it to architect, design, and develop scalable DTMs.
4. D-Arc: Technology Stack and Usable Approach
The D-Arc framework presented in this section is designed to address the challenges discussed in the previous sections and it will allow the industry stakeholders to:
- identify software components, communication network parameters, and data requirements to develop a DTM and perform replicable static and dynamic analysis on the DTM;
- develop data pipelines between the DTM and external software to forecast failures, detect anomalies, etc.; and
- manage, enhance, and patch the DTM without causing irreparable downstream impacts.
4.1. D-Arc Technology Stack
The D-Arc technology stack is designed to facilitate these three objectives. D-Arc allows a plug-and-play approach for various DTMs, including those available from open libraries, such as from Modelica, Energy+, PyTorch, TensorFlow, and from proprietary systems. Note that the application and usability of D-Arc is not restricted to energy and power sectors. The stack is agnostic enough to apply for any sectors. However, this paper is particularly scoped to expand on D-Arc’s application to energy and power sector through the information models and use cases presented. The presented D-Arc technology stack facilitates:
- High-fidelity modeling of the underlying physical processes: Tools such as Modelica can be used to perform simulations of the processes that will be suitable for offline analytics, long-term forecasting, and planning.
- Data-driven modeling and approximation with simplified mathematics and physics: Tools and libraries such as PyTorch or TensorFlow can be used for real-time applications such as short-term forecasting, fault detection, and control.
- Interconnection of high-fidelity emulators with data-driven methods: This hybrid approach depends on domain-specific applications. Emerging ML concepts can be used in future adoptions of D-Arc to develop DTMs for any industrial control system (ICS) or electromechanical system.
The D-Arc technology stack is categorized into two dimensions (physical and digital) that consist of six horizontal layers and a vertical layer (see Figure 4). The remainder of this section will provide a detailed analysis of the dimensions and layers of the D-Arc technology stack.
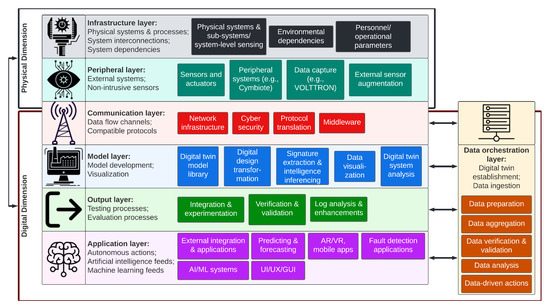
Figure 4.
D-Arc Technology Stack.
- 1.
- The physical dimension corresponds to the infrastructure and physical systems/devices. This also includes environmental and operational entities such as personnel or personnel interactions with the physical system, and built-in and external data acquisition systems such as sensors and actuators. Following are the two layers in the physical dimension:
- (a)
- The infrastructure layer pertains to physical systems: their subsystems and associated processes, interconnections between the systems (such as communications), and other system dependencies. The components that fall into this layer are the built-in sensors (pressure sensor, vibration monitoring sensor, etc.), external and environment dependencies, upstream and downstream system components and data, personnel/operators, operational parameters, and other physical operational technology/ICS resources needed for the digital twin design. The elements of this layer are the critical aspects of the digital twin: inaccuracies, inconsistencies, lack of trust, and visibility gaps at the hardware electromechanical system level that result in digital twins that are incapable of producing tangible outcomes.
- (b)
- The peripheral layer includes third-party, external, and peripheral data acquisition systems (such as Cymbiote, Volttron, SerialTap) that can be used to procure system-wide, network-wide, and environmental data that are otherwise impossible to gain by only relying on the components from the infrastructure layer. Depending on data requirements and gaps, use of this layer may be optional, and external interfacing for data acquisition may not be needed if sufficient observability is acquired from the infrastructure layer.
- 2.
- The digital dimension corresponds to the sequential processes that will lead to efficient digital twins and their ability to interface with external user applications, such as a ML failure forecasting system, artificial intelligence (AI)-based anomaly detection system, etc. The digital dimension layers can be established in cloud infrastructure or on-premises servers. This dimension is categorized into three layers:
- (a)
- The communication layer facilitates the flow of needed information between the physical and digital dimensions. This layer corresponds to the needed network systems and protocols that will allow the transfer of data and information from the physical dimension to the digital dimension (and vice-versa). Protocol examples may include Ethernet-based, TCP-IP, UDP, and serial in combination of common ICS protocols (e.g., OPC, Modbus, DNP3, IEC 61850, CIP).
- (b)
- The model layer pertains to the process of digital twin establishment and data ingestion from the physical systems to feed into the digital twins. Furthermore, data analysis and visualization are integral to evaluate the effectiveness of DTMs. Finally, preliminary signature extraction and inferencing intelligence from the collected data using logical filters are also part of this layer; this is critical to ensure that necessary feedback loops are in place to improve DTMs. The following functions are part of this layer: (1) DTMs (e.g., model library); (2) digital design transformation (e.g., information models, software needed for digital model transformations and mathematical functions), which is necessary for accurate digital representation of the physical system with provisions for expected/required inputs and outputs, and includes accurately capturing the control logic and physics-based mathematical models; (3) signature extraction and intelligence inference; (4) data visualization; and (5) digital twin system analysis by coupling the data aggregation with the DTMs developed. Digital twin evaluation to compare against the physical systems begins in this layer. The functional DTM can be established to work in two or more modes, in parallel to the physical system or independent of the physical system.
- (c)
- The output layer includes the testing and validation processes. This layer provides DTM logs and postprocessing analysis to ensure expected behavior, and modules to perform static and dynamic testing to evaluate its efficacy under extreme boundary conditions. These conditions or edge cases will include operating the digital twin in conditions that approach a failure or alarm while still functioning within the bounds of operational acceptance.
- (d)
- The application layer will connect DTMs with AI/ML detection/forecast, graphical user interfaces, etc. The application programming interfaces (APIs) can be open-source and vendor-agnostic or proprietary. Systems or modules in this layer will use the digital twin to perform failure forecasting, anomaly detection, etc.
- (e)
- The data orchestration layer is a vertical layer that spans across the entire digital dimension. In other words, data orchestration and related processes are underlying backend infrastructure for a well-functioning digital twin platform or ecosystem. The functions of this layer include (1) data preparation, (2) corruption-free data aggregation within acceptable error thresholds, (3) data verification and validation, (4) data analysis, and (5) data-driven actions. The following subsection provides an in-depth analysis of the data orchestration layer.
4.2. System and Network Information Flow per D-Arc
Operationalzing D-Arc requires intricate definitions of systems, networks, and interdependencies. Detailed illustrative attempts are made to define such relationships in a power grid environment (see Figure 5—Note that under “Grid Security system”, NIST CSF is the abbreviation of the NIST Cyber Security Framework. In practice, depending on the use case, this can be replaced with other standards such as the NIST 800-53, ISA 62443, NERC CIP, etc.). A real-world, end-to-end grid network relationship representation will be significantly more complicated than this representation. The intent of this illustration is to show the level of information needed from systems, subsystems (including sensors), support systems such as the network and security infrastructure, etc. Modeling these system-level intricacies combined with modeling the network intricacies are crucial to achieve a realistic digital twin for energy infrastructure. An illustrative information flow, dependencies, and relationships of the physical dimension D-Arc technology stack layers in the context of a power grid is shown in Figure 6. Transfer of data, sequence of activities, and the relationship between system and subsystem models are also shown. For ease of readability, the icons from the D-Arc technology stack are denoted next to respective components.
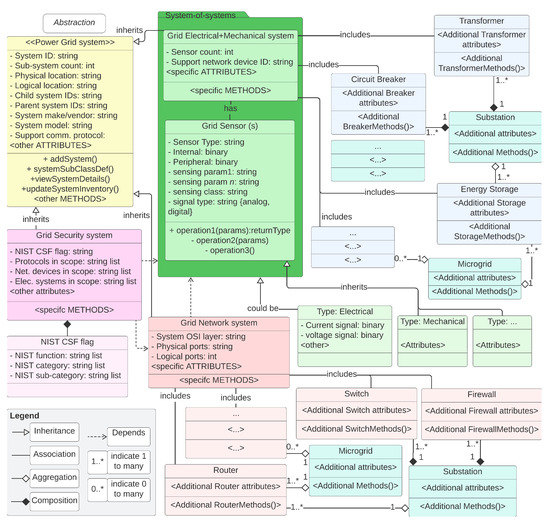
Figure 5.
Applicability and usability depiction of D-Arc technology stack in a phased approach.
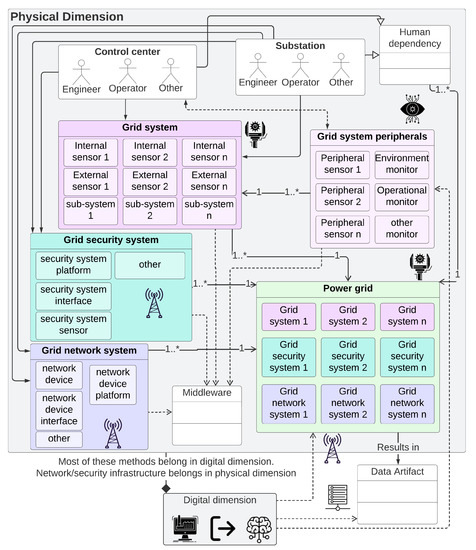
Figure 6.
Information flow, dependencies, and relationships of the physical dimension D-Arc technology stack layers in the context of a power grid operations. For additional details, please see Figure A5.
All information flow and object model diagrams are depicted in this paper are inspired by the Unified Modeling Language (UML) Class diagram standard. The UML class diagrams are largely used in software development processes. Digital twins are hybrid technology with closely coupled hardware and software systems and subsystems. Therefore, the UML class diagram standard is chosen to represent the diagrams. In these diagrams, the rectangular boxes represent classes. Although classes are building blocks of the software-related objects, similar parallel can be drawn to diagrammatically represent the hardware components. In other words, in a software/digital portion of the diagrams, the rectangular objects represent the building blocks of the software/programmatic objects; but in the hardware-related portions of the diagrams, the rectangular boxes represent building blocks of a system or subsystem. Nomenclature of the rectangular box is as follows:
- The top row of the rectangular boxes represents the building block name.
- The middle row of the rectangular boxes represents attributes and potential data types. This representation follows <attribute: datatype> (e.g., System ID: string).
- The bottom half of the rectangular boxes represents methods otherwise known as operations. In the diagrams, one operation is defined per line.
Figure 5, Figure 6, Figure 7 and Figure 8 show illustrative building blocks or classes, attributes, and methods or operations. The purpose here is to use the UML class diagram standard to demonstrate the expandability of D-Arc, generalize the framework, and demonstrate its applicability to Energy sector use cases (Section 5). This fulfills the purpose of demonstrating the usability of the framework and a methodical approach to apply D-Arc for any use case in the depicted fashion.
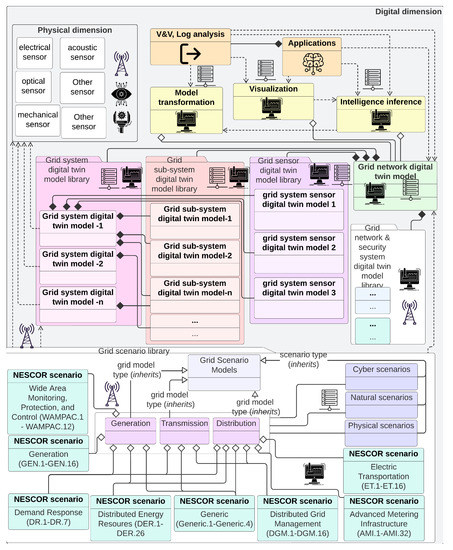
Figure 7.
Information flow, dependencies, and relationships of the digital dimension D-Arc technology stack layers in the context of a NESCOR scenarios. For added detail, please see Figure A6.
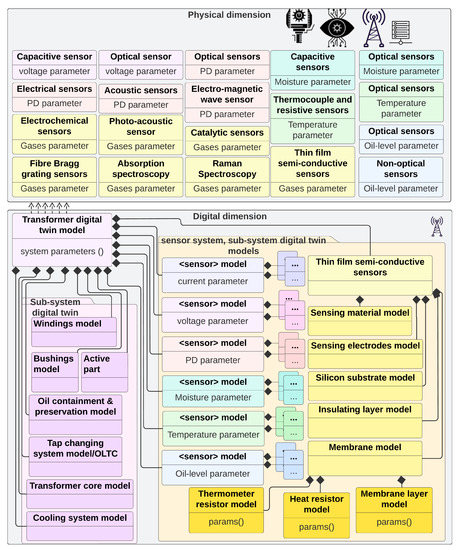
Figure 8.
Illustration of the D-Arc and UML sequence flow process using Transformer system as an example. For added detail, please see Figure A7.
Figure 6 is being used to illustrate the following: (1) physical elements of a potential grid system; (2) peripheral components that may interact with the grid system; (3) network and security system subelements; (4) expected means of interactions between those systems through middleware; (5) depiction of how these systems belong to the power grid and require accurate digital twin representation; (6) expected human interaction with the systems and potential human/user classes or categories; (7) data artifacts and elements that would define a dataset; and finally, (8) the relationship between everything above in a physical dimension to the digital dimension. Although Figure 6 is used for illustration proposes, it is intended to show how the relationship diagrams can be architected using D-Arc prior to building the digital twins. Lack of understanding of such interdependencies and relationships will result in an unrealistic set of digital twins that cannot contribute to any intended high-value use cases.
Note that the purpose behind defining methods in the physical dimension’s UML entity class elements is to depict three important possibilities: (1) there may be system-level software methods that are responsible for the attribute’s definition; (2) there may be peripheral or interfacing software components (e.g., through API/middleware) that would be responsible for the attribute’s definition; and (3) it may indicate that, in the absence of physical system’s inherent or peripheral software components where the identified methods can contribute to the attribute’s definitions, such software development would need to be done as integral to the digital dimension. This is shown in Figure 7 by illustrating the Middleware class object as “crossing the physical dimension boundaries”. This figure provides a deep dive into the digital dimension and is meant to show the probably level of granularity needed in the digital dimension modeling efforts with D-Arc technology stack as reference. In addition to the grid systems, subsystems, sensors, and pertinent grid network model, which includes all of those software models and network, security, and protocol models/representations, Figure 7 also shows an architectural view of the scenario library. This scenario library uses NESCOR failure scenarios [21] as reference to demonstrate the process. Finally, a typical transformer system is used as an example to put all of the above in the context of the complexity that may be involved in creating a transformer DTM. This illustration is shown in Figure 8 and is meant to show the level of granularity that can be obtained for each of the grid systems. To model this example, system design parameters that are identified in [22] are used. The granularity of a system model, however, depends on the available information about the system itself. If the information about a physical system is not readily available, some assumptions about the subsystem relationship should be made that could result in behavior discrepancies between the physical system and digital twin.
In summary, the above sequence of illustrations are meant to visualize the end-to-end process involved in the design, development, and deployment of a power system and power grid network digital twins through UML sequence diagrams. In the process, the illustrations are offered to show the operational nature of the D-Arc technology stack and provide a method that can be applied to any grid system digital twin design.
4.3. Use of D-Arc Technology Stack
D-Arc can be used to develop DTMs in a sequential process that spans across the following phases (see Figure 9): (1) design and development; (2) build and intelligence extraction; (3) verification, validation, and testing; and (4) delivery, deployment, and field analysis.
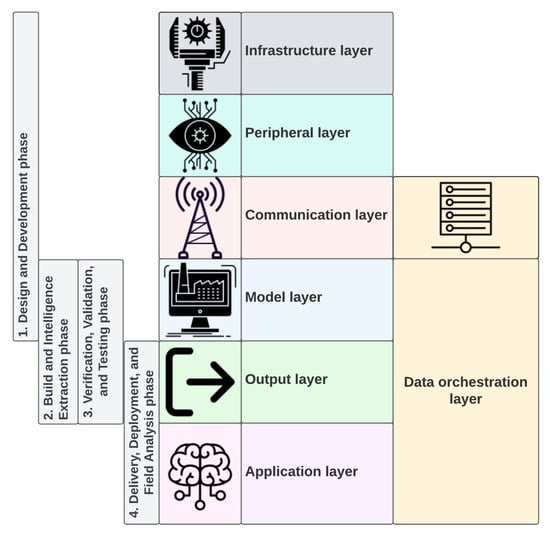
Figure 9.
Applicability and usability depiction of D-Arc technology stack in a phased approach.
- Design and development: The first phase of DTM development spans across the infrastructure, peripheral, communication, and DTM D-Arc layers. This phase involves identifying system components, data, communication systems, and sensors to address data gaps (note that the data gaps may vary for different right-sized archetype models that can be designed). Furthermore, key differences regarding calibrated data versus uncalibrated data should be considered. This phase pertains to aggregating machine data, human factors data, operational data, and environmental data using built-in and peripheral sensors (e.g., Cymbiote and SerialTap). This phase also corresponds to converting the analog outputs from the system to digital form to feed into the DTM using systems such as VOLTTRON and SerialTap.
- Build and intelligence extraction: This phase spans across D-Arc’s integration and process layers and corresponds to model and output layers. This phase is largely focused on the DTM development process. Connected equipment operations, system operations, and system processes will be part of the digital twin. In this phase, data from the previous phase will be used by the DTM to run its processes.
- Verification, validation, and testing: This phase spans across D-Arc’s model and output layers. DTMs from the model library will be simulated through test cases to evaluate behavior under anomalous and data-constrained conditions (“what ifs”). Using those tests, behavioral accuracy of the DTMs will be evaluated and error rate, operating boundaries based on available data, minimum and maximum data needs, etc. will be determined. DTM outputs will be compared against physical system outputs to evaluate the performance and accuracy of the DTM and to optimize it.
- Delivery, deployment, and field analysis: This phase spans across D-Arc’s output and application layers. AI/ML forecasting, detection, prediction systems, etc. will be part of this layer. Data output from the DTM will be fed into AI/ML software. Testing and verification procedures from the previous phase will be used to perform boundary testing on the AI/ML software. Integrated testing between the previous and current phase will involve development of estimation or approximation software systems to fill the data gaps and attempt to fulfill the data requirements.
The remainder of this section illustrates a mechanism of applying D-Arc to a digital twin proof-of-concept simulation. The purpose of this illustrative approach is to present a reasonable methodology that can scale and mature over time based on data availability for the digital twins to grow. Furthermore, the approach below also presents a method to classify the digital twins based on factors such as observability, accuracy, and the availability of sensors/data acquisition systems, both peripheral and integral to the physical system.
- Step 1: Initially, a proof-of-concept quasi-DTM of a physical system/subsystem should be developed. The model is referred to as “quasi” because the model, in the current initial state, can only involve mathematical and physics-driven process approximations bounded to the simulation engine instead of an accurate digital replica of a physical system in production.
- Step 2: Data generated in the simulation engine can be used to drive the quasi-DTM. Data generation and availability are categorized as “from system” and “from peripheral sensors” as the data feeds into the model. In this process, the quasidigital twin would be simulated with total observability to capture the outputs and should be used as a simulation baseline.
- Step 3: Data availability should be adjusted followed by the simulation of the DTM. The DTM output under varying data consistency conditions should be compared against the baseline to estimate data requirement boundaries (minimum and maximum data required). Parameters such as error rate can be calculated in this step.
- Step 4: Based on the above simulation loop, four or more device classifications can be defined as shown in Figure 10. Data availability and DTM output accuracy are among the leading factors that should be used to determine the class of the physical system. Through this classification, the digital twin architect/designer will be able to determine the “true value” of a digital twin in their environment. Furthermore, they can determine the needed peripheral systems to deploy to improve DTM accuracy based on return on investment. The proposed classification system allows the digital twin architect to understand the limitations and define different archetype frameworks that can be customized. In retrospect,
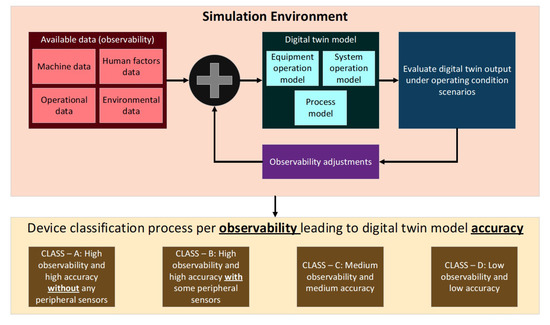 Figure 10. Quasi-DTM in simulation environment for device classifications.
- (a)
- advanced/latest systems with built-in sensing capabilities fall under class A.
- (b)
- systems with a mix of built-in sensing and the ability to interface with peripheral sensors fall under class B.
- (c)
- older systems with limited built-in sensing and limited ability to interface with peripheral sensors will fall under class C.
- (d)
- legacy systems with least data availability and inability to interface with peripherals will fall under class D.
The D-Arc technology stack is architected to be vendor agnostic. Therefore, irrespective of using any available commercial-off-the-shelf platforms/software tools or custom-built tools to build digital twins [18,23,24,25,26,27], the stack can be used to methodically build, use, and transfer the models between platforms as needed.
4.4. Model Accuracy Implications and Considerations
In the world of digital twins, the accuracy in behavior of digital artifacts versus physical artifacts is crucial. Building on the D-Arc stack discussed earlier, factors that would impact the accuracy should be estimated. This estimation can be computed by determining the contextual losses in between the real-world system outputs versus the behavior calculated by the digital artifact. This will be mostly influenced by the digital model’s fidelity among other factors, but it will also be influenced by the physical system’s ability to accurately capture and represent the real-world state. For example, the data generated from a sensor may go through several stages of processing and handling before it reaches the digital twin model, with each stage resulting in some contextual loss. Depending on where the artifact belongs in the D-Arc stack, factors that influence the contextual losses and the artifact accuracy will vary. Detailed analysis of such mathematical relationships is beyond the scope of this paper and will be strongly considered for future work. However, we will briefly define the above mathematical relationship for a set of preconceived conditions.
Theorem definition: The artifact accuracy (A) is a function of the contextual loss (C) (see Equation (1)).
Generally speaking, can represent a combination of linear, nonlinear, continuous, or discontinuous functions that reflect on the model’s accuracy, simulation operational range, and ability to capture real-world data (e.g., bandwidth and quantization limits). An example of a nonlinear function is given in Equation (2).
where is the displacement or proportionality factor and x is a nonlinearity factor. Both and x are used to represent the nonlinear relationship between A and C. Note that for , A and C bear a linear relationship and a nonlinear relation when . For the sake of simplicity, we can assume that is a linear function and thus:
where is the displacement or proportionality factor and used to represent the nonlinear relationship the nonlinear relationship between A and C.
Theorem analysis: Mathematical representation of the above definition when applied to the D-Arc stack is as follows (see Table A3 for additional explanation):
Assume that the artifact accuracy at a given layer is denoted as where represents an artifact at a given stack layer L. Within the layer or between the layers, every transformation of will result in a contextual loss pertaining to at layer L: . This relationship is defined as follows:
where i and j represent the artifact transformation in horizontal (e.g., within layer L) and vertical (between layers) transformations.
Note: In Equation (10), the context losses due to model limitations could be additive, multiplicative, or other combinatorial forms. Comparisons between different combinatorial forms is beyond the scope of this paper and will be evaluated in future work. For the sake of simplicity, the rest of this section will assume that losses can be computed using an additive approach. Therefore, the expanded form of the artifact accuracy can be written as follows:
If , will be at its maximum value (≈). Therefore, the objective to achieve during artifact transformations is to minimize the losses—this is represented as follows:
The aforementioned equation clarifies the relationship between i, j, and L by further representing L as two components:
where is any transformation of an artifact.
As indicated earlier, the artifact transformation is influenced by varying factors in a layer or between the layers. For, instance, factors pertinent to infrastructure, peripheral, and communication layers include network throughput (N), data sampling rate (S), and latency (Y). With those three factors in scope, their relationship with and for N is as follows:
In other words, if the network throughput is lower than the necessary throughput to accommodate the instrumentation, the losses could increase due to potential loss of data/packets. Therefore, the relationship between the network throughput and the losses is inversely proportional.
Losses due to insufficient network throughput are as follows:
where is a proportionality factor and is the maximum possible threshold beyond which improving N can no longer minimize . Therefore, another relationship for N can be shown as:
- ⊳
- Value of N to is unchanged for
- ⊳
- Value of N to is at maximum for
Because of the inverse proportionality relationship between N and , N is related to the artifact accuracy as follows:
Similarly, the relationship between S and , is as follows:
- ⊳
- Value of S to is unchanged for
- ⊳
- Value of S to is at maximum for
The relationship between Y and , is slightly different and is as follows:
- ⊳
- Value of Y to is the maximum for
Unlike network throughput and data sampling rate, latency should be lower to minimize losses. A lower latency implies lower losses while a higher latency leads to higher losses. Therefore, the relationship between latency and losses is directly proportional.
Note that the above relationship illustrations are to demonstrate that the artifact accuracy and contextual loss calculations would involve analyzing individual factors. The computations or mathematical representations of such influencing factors may significantly vary as compared to the above relationships. As indicated previously, the presented mathematical analysis is in early stages and a detailed analysis will be the focus of future research.
The relationship between model sufficiency is directly proportional to the artifact accuracy.
Model sufficiency depends on the physical instrumentation from which the data are acquired. Therefore, the built-in and peripheral instrumentation of a device or system serves as a strong dependency for model sufficiency. Such hardware dependency analysis might have to be performed based on the measurands, types (or classes) of sensors, and system characteristics. These analyses could be used to identify conditions where either an insufficient number of sensors exist or too many sensors report on the same measurand (e.g., sensor overcrowding). Sensor classes could include acoustic, thermal, vibration, frequency, electrical (voltage and current), mechanical, etc. Mathematically, this can be estimated as follows:
For a given set of sensors/instrumentation, if is achieved, further increase in instrumentation will result in diminishing returns. If is not achieved, additional peripheral instrumentation can be added to increase local observability data until is achieved.
The above logic can also be understood by using a more traditional approach in control systems theory. Specifically, the observability test requires that sensors are placed in such a way that a nonsingular determinant exists. Putting it in simpler terms, there should be enough sensors to assemble an independent set of vector spaces that make the system observable. If the vector spaces are repeated (e.g., due to sensor overcrowding), no additional information will be gained, while empty vector spaces will yield unobservable states until specific sensors are installed within the problem area to fill this void.
4.5. Cybersecurity Implication and Consideration
Security risks: Hearn et al. [28] emphasizes the criticality of securing the digital twin’s platform and its software for the safety of digital twins and the corresponding physical system. An example of a security gap between the digital twin and physical system could be the presence of an advanced security feature such as securing the microcontrollers in the hardware of the physical system but absence of it in the digital twin platform. Another security concern is the ability of an adversary to obtain access to the digital twin. The digital twin will serve as a blueprint of the physical system, enabling the adversary to not only learn the piping and instrumentation diagrams but also to use that knowledge to craft and execute a tailored or targeted attack on the physical system. Compromising a digital twin exposes the organization to backend system attacks through the server [29]. Code analysis of the API calls will enable the hacker to deliver backend systems attack. Remainder of this section will present various steps to securing digital twin implementation.
Security mitigations: Begin with a clear and well-designed secure software development lifecycle management process that includes all aspects of the lifecycle. The security requirements should be defined prior to design and development. To maintain security of the software source code, the organization must automate a few processes such as (1) peer code review, (2) secure coding methodology, (3) good repository control to scan source code for language conformance, (4) flaws and known vulnerabilities, and (5) open-source compliance to organization policy.
Software and data can be locked to specific devices (computers) through data and copy protection technologies and hardening APIs. In regard to security of the overall digital twin development process, digital twins, peripheral applications, and securing the data while at rest, in transit, and in use are some considerations and requirements.
- Perform vulnerability analysis and threat modeling on the software systems and models.
- Compute and identify the qualitative and quantitative risks associated with digital twin and peripheral software deployments. Architect the vulnerability and risk mitigations.
- Identify the overall cybersecurity posture of the facility with and without digital twin deployments. Based on the comparative analysis, take necessary measures to minimize the attack surface. For example, use the outcomes of self-assessment tools to drive system- and network-level actions.
- Identify the threat actors or related information that can exploit digital twins (for example, Diamond model and MITE ATT&CK ICS matrix).
- Perform a consequence-based analysis on the twins to identify critical areas of concern. For example, to perform various scenario-based testing and analysis on the twin, and not risk damaging the hardware equivalent, first identify the resilience and security scenarios that could impact the hardware systems, then run those scenarios on the twin. In the process, identify the consequences in a situation where the twin is corrupted. Another critical aspect is to ensure that data at rest, in transit, and in use are secure.
- Ensure the communications/interactions and interoperability between two or more digital twins are consistent with their hardware counterparts. Simplifying protocol-based communications in the digital world will result in missing critical gaps that need to be addressed.
For secure development and implementation, NIST guidance [30,31] that includes testing and experimental analysis should be used throughout the development lifecycle.
5. Data Orchestration for Digital Twins
Among all the D-Arc technology stack layers discussed in the previous section, the inherent nature of the data orchestration process is shown through its vertical alignment and depiction in Figure 4. Data orchestration can be defined [32] as automation of data-driven processes from end to end. This section focuses on a technical deep-dive of the data orchestration process.
As discussed previously, the physical dimension components that involve physical/hardware electromechanical systems and associated sensors are connected to the digital dimension through the communication architecture. The OSI reference model can be used to architect the network and pertaining cybersecurity measures depending on the sensors involved and the method of communication used.
Data orchestration is the only vertical layer within the digital dimension that can be further broken down into five sublayers (see Figure 11): (1) data integration, (2) management, (3) software architecture, (4) management-II, and (5) data output. The data flows through these sublayers as part of processing and filtering (discussed in later sections). Finally, the DTM and other layers consume the data to perform data-driven actions.
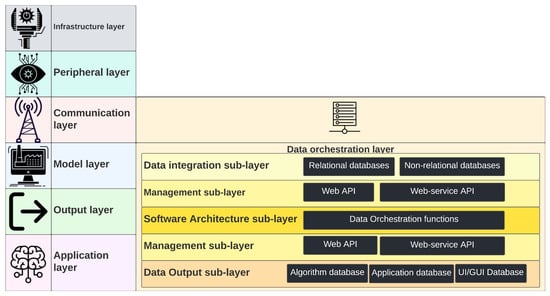
Figure 11.
Inherent sublayers of the data orchestration layer and associated processes.
The complete process of data orchestration is sequentially represented in Figure 12. As shown in the figure, the three main sequential components are (1) data preparation or curation, (2) data verification and validation, and (3) data-driven actions. Although data warehousing is shown at the end, warehousing could serve at an intermediate level (between the three components); therefore, data orchestration may involve multiple data warehouses.
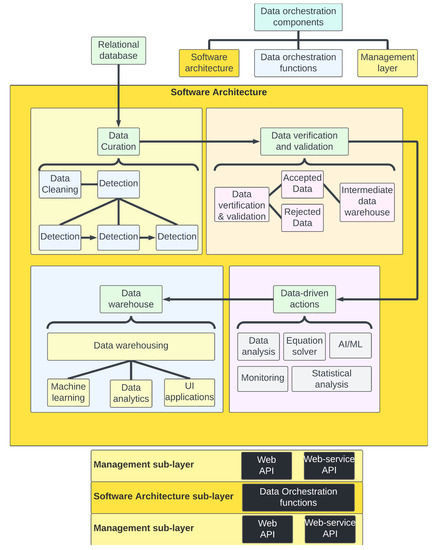
Figure 12.
Sequential representation of data orchestration process.
Data preparation pertains to curation before the data go through validation and are stored in a data warehouse. A commonly agreed-upon, functionality-based definition of a data warehouse is that it centralizes and consolidates large amounts of heterogeneous data from multiple sources [33].
Data verification and validation involves the decision-making process to determine whether to accept or reject the curated data, followed by storing the accepted data in another data warehouse.
Data-driven actions are the operations that can be conducted on the accepted data procured from the data warehouse based on the user needs.
As discussed earlier, the goals of the data orchestration process are to make data more accessible to DTMs for compute and mathematical modeling, and to provide data to the data-driven peripheral applications to perform data-driven actions. The data themselves might originate from the electromechanical systems or ICS and may use cloud or open-source platforms (see Figure 13). See Appendix A for a deep dive on the data orchestration processes. Since data orchestration is not a new field, the authors provided pertinent details in Appendix A.
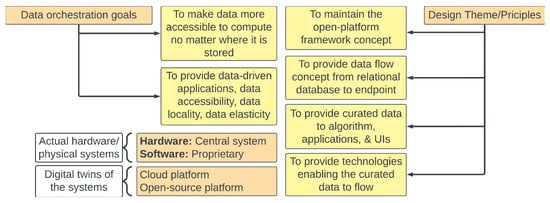
Figure 13.
Data orchestration goals.
6. Digital Twin Use Cases
Digital twin has applications in multiple sectors such as energy, critical manufacturing, supply chain, etc. Since the focus of this paper has been energy sector applications, this section identifies some critical use cases and pertinent value propositions. Digital twin has the potential to assist the energy sector stakeholders (utilities, transmission owner, reliability coordinator, etc.) to understand how the grid is performing in real time or near real time. Such in-depth analysis could help stakeholders achieve situational awareness and evaluate change settings and impact in virtualized environments to achieve optimal efficiency and help future planning. Some high-level power grid applications are described below that can be supported by digital twins in the future. Table 1 maps the use cases to the D-Arc framework at a high level. This section focuses on six high-value energy sector use cases. However, the application of digital twins and D-Arc to the energy sector is beyond these six use cases. A wider set of relevant use cases that can use D-Arc are depicted in Appendix B.

Table 1.
Mapping power grid DT use case with DT D0.
6.1. Use Case 1: Model Validation and Planning Studies through Parameter Tuning
The electrical grid relies on physical infrastructure to transport and distribute energy across its service area. Although much of this infrastructure is static in nature (e.g., lines and transformers), a mixture of actuators and control mechanisms work together to dynamically change the behavior depending on the operational needs (see Figure 14). These decisions depend on the sensor’s reported data, the control logic, and the network models. It is imperative that grid operators have accurate network models that can represent a wide range of operational scenarios (e.g., emergency vs. normal conditions). However, this is not always possible due to a multitude of issues that range from incorrect or obsolete asset parameters to a lack of mathematical models. Bad network models have been in part responsible for events such as the 1996 Western Interconnect blackout [34] and can routinely lead to cases where engineers unintentionally operate the grid in an insecure state. To mitigate these risks, digital twin models can be used to constantly compare the physical grid state against a simulated world state. At a minimum, grid components should be able to replicate the steady-state properties, but more advanced use cases could benefit from being able to replicate the system behavior when frequency or weather conditions change. Relevant asset parameters will be dependent on the simulation engine being used, but could range from those used in power flow studies [35,36] to those used for electromagnetic event modeling [37,38]. In addition to the improved grid models, sensor-level digital twins can be used to ensure that field measurements are consistent with past and current behavior (e.g., by implementing event recorders). It is expected that with these types of DTMs, engineers will be able to assert the validity of future expansion studies. They will also be able to assert the system behavior when abnormal or emergency operational conditions arise (e.g., by relying on hypothetical disturbance scenarios). For instance, engineers will be able to simulate the real-world implications of deploying microgrids and connecting to privately owned DER farms, and utility DER deployments for energy management studies (see [39]) as well as being able to evaluate the system’s resiliency after a significant weather event occurs (e.g., a hurricane or wildfire).
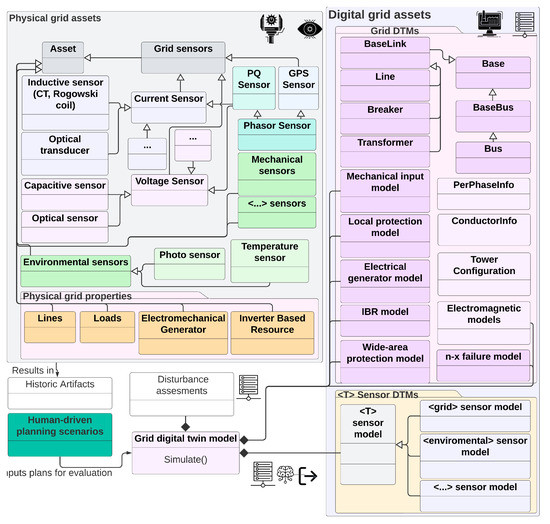
Figure 14.
Information flow and object modeling for use case 1. For added detail, please see Figure A8.
6.2. Use Case 2: Improving Security through Detection and Forecasting
By definition, and as described in use case 1, digital twins for the power grid are required (and expected) to collect and compare data from different grid sensors and the underlying physical infrastructure in real-time. However, the modern grid is also dependent on its interactions with information and communications technology assets. As such, it becomes necessary for system operators to know and understand the digital equipment attached to the grid (e.g., digital devices, network links, and the software that runs on top of them) to attain a holistic system view. It is important to note that these devices have become so ubiquitous in our modern world that their presence may be ignored, but include assets such as digital protection devices, automated/smart meter readers, digital sensors, digital actuators, dedicated control systems, and remote-control room systems. In addition to their ubiquity, the majority (if not all) of these devices may be vulnerable to cyberattacks that could lead to physical impacts. To better understand these interactions, a DTM should try to replicate as many of the digital functions and attributes as possible (see Figure 15 for an example architecture). Depending on the extent and depth of the cybersecurity assessments that are taking place, the DTM should mimic:
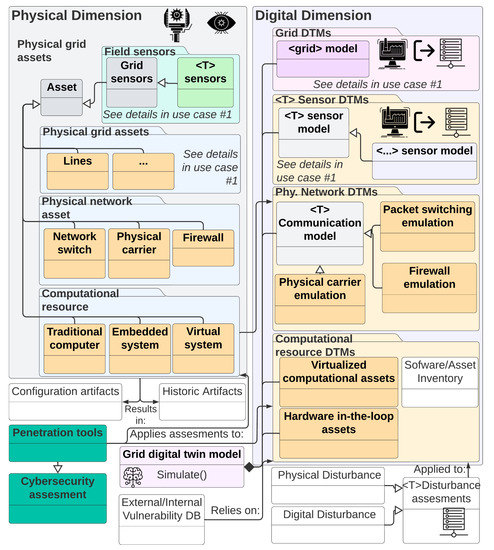
Figure 15.
Information flow and object modeling for use case 2. For added detail, please see Figure A9.
- Input/output characteristics: These capture the digital and grid interfaces that are used or accessible to the device in question. A DTM should attempt to replicate or at least describe these interactions.
- Digital systems: These may include low-level hardware models or be abstracted in the form of virtual appliances. These systems will typically run firmware or operating systems that dictate their behavior.
- Software components: This includes any piece of software that runs on top of a digital system that can take decisions, process data, and communicate with input/output interfaces. In an ideal DTM, a full replica may be desirable, but if this is not possible, at least up-to-date inventories and vulnerability databases must be maintained.
- Communication paths: These capture the communication topology and can be used to identify topological vulnerabilities (e.g., single points of failure) and entry/exit points (which may be used to deploy an attack).
- Traffic management devices:This includes routers, switches, and any other device that can alter or set a message transversal path.
- Security and monitoring devices: This often includes firewalls but may also include network sniffers and any other systems that help an operator or system to gain visibility.
- Supervisory systems:This may include tools or systems that collect data and perform health evaluations.
Based on the above characteristics, a successful DTM will therefore enable cybersecurity engineers to find vulnerabilities, assert defense strategies, and overall increase the cybersecurity posture of their system.
6.3. Use Case 3: Grid Resiliency Analysis:
Based on the capabilities outlined by use cases 1 and 2, it becomes possible for grid operators to simulate a sequence of well-orchestrated cyber and physical events to assess a system’s resiliency attributes. However, analyzing the consequences of natural events (such as those caused by extreme weather conditions) can remain a challenge unless the DTM considers these as part of its model. For this example, Figure 16 adds considerations for analyzing the economic impact of markets due to weather events. This is done by (1) adding historical weather datasets, (2) modifying grid models to account for weather variables, and (3) adding an economic model that captures the market behavior. By adding these two dimensions (one serving as input, while the economic perspective serves as an output), a DTM can help operators to not only plan for the actual outages but also to ensure that tariffs remain acceptable to their customers [40].
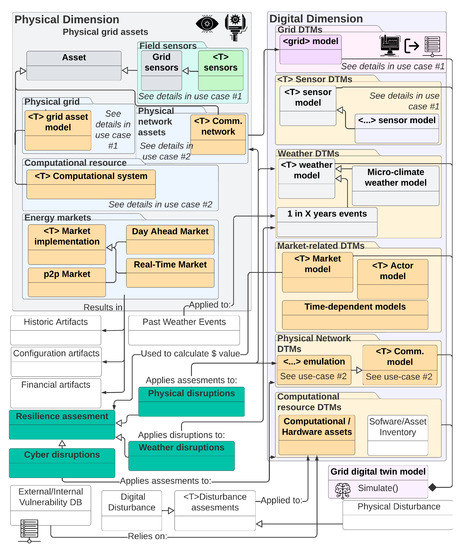
Figure 16.
Information flow and object modeling for use case 3. For added detail, please see Figure A10.
The outcomes of such scenarios can then be used to augment the grid’s ability to operate and maintain customer expectations even under severe circumstances. Some countries are already using DTM to do large-scale modeling to study infrastructural enhancement scenarios and implications [41], whereas in [42], they have focused on the energy market studies.
6.4. Use Case 4: Enhance Situational Awareness through Control Room Advisor
Although grid automation has and continues to advance, control center operators are ultimately responsible for a continuous system operation. However, the amount of data they must process to maintain situational awareness sometimes exceeds the limits of the human brain. DTMs could be used to test different techniques and tools to ensure human operators are not overloaded and thus can safely operate the system. Furthermore, techniques under test can be evaluated by automated behavioral models to ensure the results are replicable and remain valid under all circumstances (see Figure 17).
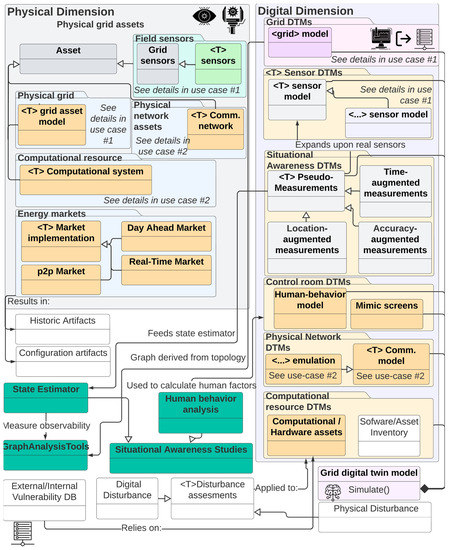
Figure 17.
Information flow and object modeling for use case 4. For added detail, please see Figure A11.
DTMs can also be used to complement existing situation awareness platforms by offering enhanced state estimators and other time or resolution augmentation tools that can eliminate data voids or other artifacts that distract or confuse operators. This, for example, may be used to generate visualizations or diagrams that complement and summarize information (thereby reducing the mental burden).
6.5. Use Case 5: Increased Behind-the-Meter Visibility and Digital Asset Management Gap Analysis
Digital twins can also be used to increase system visibility where no data are available due to a lack of sensing capability or technical limitations (e.g., unable to measure a large customer-owned load). This can largely be done by performing measurement disaggregation (via Amazon Machine Image (AMI)-hosted functions or centralized approaches) but can be difficult to generalize when larger behind-the-meter systems are in place (e.g., commercial photovoltaic (PV) deployments). By implementing these functions on a DTM-based platform, engineers can increase their situational awareness and be able to more easily identify areas that require increased visibility and segments of the grid with poor quality measurements, helping them to take physical actions to mitigate these issues. It is important to note that this increase in visibility is not limited to measurements but can also be extended to the physical domain by enabling grid operators to identify missing or unaccounted assets that are present in the field (by comparing reported measurements and doing periodic network scans). This can enable engineers to have a higher degree of certainty about the devices deployed within the service region. An example architecture of such a system is presented in Figure 18.
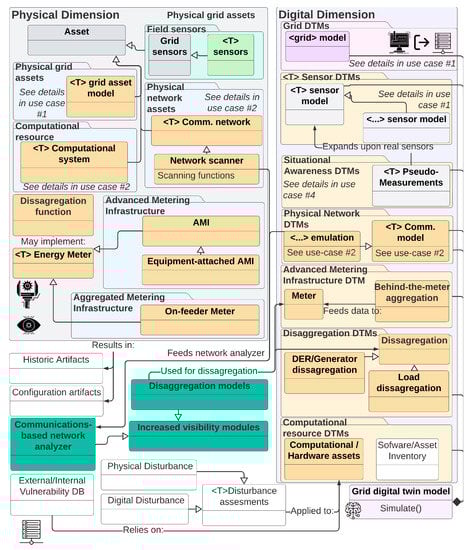
Figure 18.
Information flow and object modeling for use case 5. For added detail, please see Figure A12.
6.6. Use Case 6: Power System Performance Analysis
Based on use cases 1 and 2, it is clear that a digital twin has the ability to support holistic system views, which accurately mimic the system behavior. These features can be used to test new tools and techniques that seek to increase operational performance without having to experience the risks associated with field deployments. Furthermore, it can accelerate the deployment of new or novel algorithms by allowing researchers to safely evaluate new test tools, enabling them to identify shortcomings and improvements early in the design process, and helping them increase their technology readiness levels.
Another benefit of DTMs is their ability to identify faults early on (by evaluating device-level discrepancies). This can be further complemented by adding fault and maintenance data that can be used to develop better preventive maintenance programs that ensure a continuous and reliable grid operation. Although individual applications will need to tailor the design to their needs, Figure 19 illustrates a performance-oriented platform that can be used to optimize system operations and performance activities.
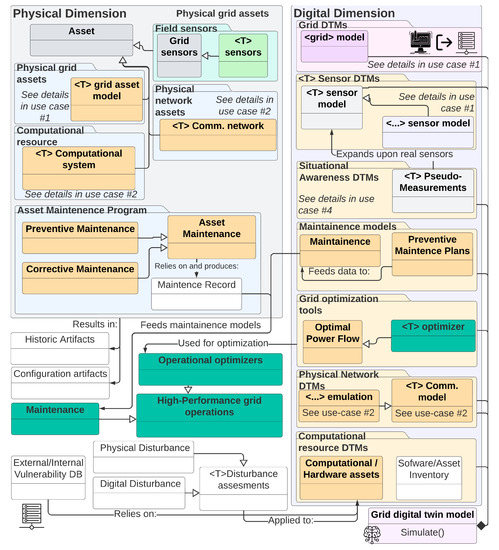
Figure 19.
Information flow and object modeling for use case 6. For added detail, please see Figure A13.
7. Comparative Analysis
To evaluate and demonstrate the efficacy of D-Arc, the framework is compared against 18 different existing frameworks, architectures, and models (collectively referred to as frameworks for the remainder of this section) that are highly cited or used. The reviewed frameworks are largely focused on Energy and Power use cases with a small percentage applied to additional sectors such as advanced manufacturing. Table A2 shows the comprehensive comparative analysis and pertinent observations. The table is formatted to assign a rating for each of the columns (excluding the final column) that represent D-Arc related components and layers. The final column of the table provides noteworthy observations and justification behind the assigned rating. The legend explaining the ratings for the columns is defined at the bottom of the table. The analysis and data from Table A2 is plotted in Figure 20 for simplified analysis and to provide inferences. According to Figure 20, the bulk of the existing frameworks focused on identifying physical systems and designing their respective digital models, which is reasonable in proof-of-concept and experimental studies. However, thorough analysis combined with the design and relationship definitions are needed at communication, output, and data orchestration layers to build, deploy, and scale real-world digital twins. Furthermore, none of the reviewed frameworks depicted design phases of the digital twin development process that can be reused or replicated by other research groups.
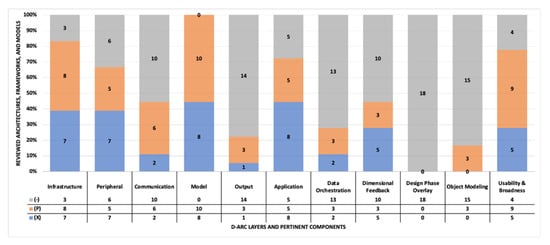
Figure 20.
Comprehensive view of the comparative analysis presented in Table A1.
Another noteworthy observation is that most of the reviewed frameworks did not present information and object modeling. The digital twin development process involves relying on software tools and artifacts; the lack of information/object/data modeling would make it nearly impossible to operationalize a framework or an experiment. Only three of the studied frameworks alluded to some level of object modeling. Ranking across the above factors is used to subjectively estimate the usability of the frameworks outside the scope of the use cases within the 18 papers. Thorough analysis of the frameworks further solidified the need for D-Arc. As discussed in the previous sections, D-Arc is designed to serve as a detailed framework that is complemented by modeling artifacts. These artifacts combined with the framework can be used to ideate, design, and deploy digital twins for any use case. D-Arc itself is not designed with any intended use case except for the driving philosophy to primarily apply D-Arc to the Energy sector and secondarily apply D-Arc to other sectors such as advanced manufacturing and others. In conclusion, D-Arc is compatible with all four levels of digital twins that are described in [43,44]
- Level-1—Predigital Twin: This level involves physics-based simulation without any emphasis on the physical system, supporting applications/GUIs, and machine learning systems. The digital twins that are included in this level would mainly focus on maturing the Model Layer of the D-Arc framework with necessary network connections to the Infrastructure and Peripheral Layers for needed data flows. In terms of D-Arc phases, the modeling process involved in Level-1 digital twins primarily stay within the Design and Development Phase with need-basis emphasis or expansion into the Build & Intelligence Extraction Phase; Verification, Validation, and Testing Phase.
- Level-2—Digital Twin: In addition to physics-based simulation, this level involves thorough understanding and integration with the physical system. Therefore, the digital twins that are included in this level would focus (at least partially) on maturing the Infrastructure, Peripheral, Communication, Model, and Data Orchestration Layers. In terms of D-Arc phases, the modeling process involved in Level-2 digital twins mainly stay within the Design and Development Phase; Build & Intelligence Extraction Phase with need-basis emphasis or expansion into the Verification, Validation, and Testing Phase.
- Level-3—Adaptive Digital Twin: The digital twins in this this level would emphasize everything a Level-2 digital twin would emphasize, as well as fully maturing Data Orchestration, Output Layers and Dashboards/GUIs related components under the Application Layer. In terms of D-Arc phases, the modeling process involved in Level-3 digital twins primarily stay within the Design and Development Phase; Build & Intelligence Extraction Phase; Verification, Validation, and Testing Phase with limited emphasis or expansion into the Delivery, Deployment, and Field Analysis Phase.
- Level-4—Intelligent Digital twins: To achieve the digital twins that are included in this level, elements from all layers of the D-Arc framework should be highly matured (including the design of matured machine learning components). In terms of D-Arc phases, the modeling process involved in Level-4 digital twins would go through all four phases of the D-Arc framework (i.e., a complete end-to-end digital twin).
8. Potential Challenges and Limitations with Digital Twins and D-Arc
The concept of digital twins has promising benefits in rapidly evolving energy infrastructures. However, building a true digital twin is nontrivial. There is existing literature where researchers synonymously used granular modeling as digital twins. However, based on the technical details and justification discussed in this paper, for a physics-based granular model to be a called a digital twin, the twin should have some level of (near) real-time interaction with the physical systems. As the technology and its applications evolve, there are several noteworthy challenges that should be addressed with the digital twin development:
- Digital twins could be subject to cyberphysical attacks such as denial of service, false data injection, or network infrastructure attacks leading to man-in-the-middle or adversary-in-the-middle attacks, etc. [43].
- It is not uncommon for energy utilities to have some differences between planning and operational grid models. Moreover, feeder maintenance efforts are always ongoing. In such changing ecosystems, it can be problematic to ensure that the planning and operational models are synchronized in real time. This challenge extends to the digital twin modeling of the grid feeder because it is often a common practice to use planning models or “near-to-real” operational models for simulation and modeling efforts including digital twins.
- Digital twin development and pertinent end-to-end processes would involve large datasets. To ensure (near) real-time synchronization between the digital twins and physical systems, data processing and orchestration, data transfer and handling should happen at a high speed with minimal temporal overhead. This may involve relying on cloud infrastructure or expensive on-premises infrastructure that support extremely low latency and high throughput. In addition to security of the digital twins, it is important to ensure the security of physical systems. Adversaries could compromise a subsystem and laterally move into more critical systems. If the physical infrastructure is compromised, the integrity and usability of the digital twin outputs can be compromised. Furthermore, strict data handling processes should be in place because the exchange of information between the physical systems and the digital twin, including the feeder models, may be deemed as business critical/sensitive information. Therefore, data and model confidentiality are of high importance [45].
D-Arc framework is designed from a technological/engineering perspective with very minimal emphasis on nontechnical aspects such as correlation to business needs. Here are the noteworthy limitations of D-Arc, and future work will involve addressing these limitations:
- Lack of governance layer: In its current state, D-Arc does not have a mechanism to incorporate governance rules and policies. This will be considered in D-Arc’s expansion efforts.
- Lack of business and social layers: Social/societal implications and correlation to business needs/policies are not defined in D-Arc. These may be nontechnical in nature, but it is vital to build and deploy digital twins that solve specific organizational needs and risks.
- Lack of technology/tool mapping across layers: The current state of D-Arc is technology-agnostic and does not emphasize or recommend a particular open-source or proprietary solution. A potentially useful expansion of D-Arc could map verified existing tools and technologies that can support achieving goals/requirements across each of the D-Arc layers and design phases. The risk associated with addressing the tool mapping limitation is that such mapping lists become outdated quickly.
- Cybersecurity testing: An important next step for D-Arc involves thorough cyberphysical security and cyber and physical resiliency testing using security frameworks such as MITRE ATT&CK. Such an exercise can assist in evaluating the resiliency and security of the framework and respective use cases that leverage the framework. Such an exploration would be followed by a list of security and resiliency mitigations/guidance.
- Granular object modeling for more use cases: The paper highlighted six use case categories and over 55 potential use cases. However, the object modeling processes/templates presented in the paper are only applied to the six broad categories. A useful expansion of this exercise would be to further granularize the object models of the six broad categories by applying the object models to all use cases under these categories. The risk of such an exercise is that it could potentially result in a never-ending exploration because of the constant evolution of digital twin use cases.
9. Conclusions
The emphasis on digital twins and pertinent applications across sectors is only expected to grow [46]. Research and development and engineering investments in the technology will continue to mature. However, as of 2022, the technology is hovering near the peak of inflated expectations on the hype curve [47]. Therefore, it is of high importance to define scalable frameworks that can lead to building scalable digital twins with realistic expectations and clear definitions of the use cases. This paper is an attempt to assist researchers and engineers in this space by providing a framework that can be used to analyze potential use cases from the ideation phase to real-world deployment phase. Ongoing research by the authors is focused on building on the foundational blocks laid out in this paper to architect early-stage use cases in energy sector applications, such as digital twin demonstrations for hydropower generation plants, etc. During the process, diligent attempts will be made to expand the presented framework and processes toward supporting demonstrable use cases, which will be published as future work. Although this paper provides an in-depth view into various relationships that are pertinent to the digital twin development process, further explorations are needed in the space of standardization through organizations such as IEEE, ISA, etc.; design of system and protocol-specific libraries for open-source use and consumption; identification of cybersecurity and cyber resilience threat models and risk models with pertinent mitigations; and real-world demonstrations. Finally, this paper articulated noteworthy limitations with digital twins and D-Arc’s current state. Both would be addressed through on-going research and experimentation. In particular to D-Arc, the authors expect to address the identified limitations through its current application testing to energy sector use-cases that are estimated to continue through 2024. Addressing the limitations of digital twins to apply them to large scale real-world use-cases would require many factors including protocol standardization, cross-vendor/system cooperation and interoperability, and open-source tools for security and unit testing.
Author Contributions
Conceptualization, S.N.G.G. and S.B.; Methodology, S.N.G.G., S.B., D.J.S.-C. and M.T.; Validation, D.J.S.-C.; Investigation, S.N.G.G., S.B. and D.J.S.-C.; Resources, S.N.G.G., D.J.S.-C., M.T. and O.A.; Data curation, S.B. and M.T.; Writing—original draft, S.N.G.G., S.B., M.T. and D.J.S.-C.; Writing—review & editing, S.N.G.G., S.B. and D.J.S.-C.; Visualization, S.N.G.G. and D.J.S.-C.; Supervision, S.N.G.G.; Project administration, O.A.; Funding acquisition, O.A. All authors have read and agreed to the published version of the manuscript.
Funding
The work reported in this paper was funded by the United States Department of Energy under Contract DE-AC05-76RL01830.
Conflicts of Interest
The authors declare no conflict of interest.
Appendix A. Overview of Data Orchestration Process Flow
Figure A1 shows the three building blocks of the data orchestration platform. Data from the relational database are consumed by the data orchestration platform through a REST JSON API (or similar) in form of JSON structure. The data orchestration platform is then divided into three primary blocks:
- Data curation handles curating the data for further data orchestration operations. This functional block is further divided into two secondary categories:
- -
- Missing data [48] is defined as unavailable values that would be meaningful if observed. This missing data block could consume data from the relational database in commonly used formats such as JSON, XML, CSV, etc. Once the missing data are detected, they should be treated through appropriate missing data handling mechanisms (see Figure A2) and saved in the curated missing data warehouse in form of commonly used formats such as JSON, XML, CSV, etc.
- -
- Outliers [49] are defined as extreme values that deviate from other data observations, which may imply measurement variability, experimental errors, or a novelty. The outlier detection block consumes data from the curated missing data warehouse in commonly used formats such as JSON, XML, CSV, etc. When the outliers are detected from the curated missing data, they are treated through appropriate outlier handling mechanisms and saved in the curated data warehouse in form of JSON structure.
- Data verification and validation [50] pertain to ensuring that data entered exactly match the original source. The data verification block accepts data from the curated data warehouse in form of JSON structure and then verifies the data through appropriate verification techniques. As an output of the data verification block, the data are divided into two categories: verified and nonverified. Data validation ensures that data entered are sensible and reasonable. The data validation block accepts verified data in form of JSON structure and validates the data through appropriate validation methods.
- Output data warehouse stores curated, verified, and validated data in the form of a relational database for data to be further consumed by the output layers or algorithm layer, application layer, and user interface layer. Data-driven actions have a two-way relationship with the data warehouse. These actions pertain to application layer components where the data are consumed to generate value-added products or artifacts (see the yellow boxes pertaining to ML, data analytics, and user interface applications in Figure A1).

Figure A1.
Data flow from input to output of data orchestration.
Data Curation
This is the first stage of the data orchestration process. Once received from sensors or the electromechanical system/ICS and staged in a repository, the data are not quite ready for consumption. They need to go through the curation or preparation process. This section will discuss these processes (see Figure A1 and Figure A2 for an in-depth view of the data curation process).
Missing data detection [48], shown in Figure A2, emphasizes the curation of detected missing data. Once the missing data are detected, the pattern (reason) of the missing data are identified. There are three possible reasons for the missing data:
- Missing completely at random (MCAR)—A scenario where missing data has no connection with the completely observed variable (say X) and partly missing variable (say Y). The advantage of data that are MCAR is that the analysis remains unbiased.
- Missing at random (MAR)—A scenario where missing data on a partly missing variable (say Y) has connection to some other completely observed variable (say X) but no connection to the values of variable Y.
- Missing not at random (MNAR)—A scenario where missing of the data is specifically connected to the variable that is missing. When the missing data characters cannot be categorized in either the MCAR or MAR, they fall under the category of MNAR.

Figure A2.
Data curation—Missing data analysis.
Missing data treatment [51] can be handled in two ways: deletion and imputation. Deletion scenarios are when the data are discarded to rectify the missingness. Deletion can be classified into three categories based on how missing data are removed:
- Listwise deletion is when data for a case (row) containing one or more missing values are deleted. This is also called complete-case analysis deletion.
- Pairwise deletion is when only the missing observations of a case are deleted, but not the complete case (row), and then analysis is done based on available observations. This is also called available-case analysis deletion.
- Deleting columns is when too much data are missing for a variable, then the complete variable is deleted from the dataset. This is also called dropping variables.
Imputation scenarios are when missing data are replaced with substituted values. Imputation can be classified into three categories based on how the imputation is followed: (1) single imputation, (2) multiple imputation, and (3) model imputation. Single imputation [52] is when missing values are replaced by a value following a certain rule. This can be classified into the following subcategories:
- Mean, median, and mode is when the missing data are substituted by either the mean value, median value, or mode value of a variable. Mean substitution is a reasonable estimate for a variable with normal distribution. Median substitution is advisable for a variable with skewed distribution. Mode substitution is used when the missing data are replaced by the most frequent value of the variable.
- Last observation carried forward is when the missing value is replaced with the last observed value. It is the most widely used imputation method for time-series data.
- Next observation carried forward is when the missing value is replaced with the first observation after the missing value.
- Linear interpolation is when interpolation is performed between the values before the missing data and the value. Interpolation means adjusting a function to data and using this function to extrapolate the missing data.
- Common-point imputation is when the missing data are replaced by the middle point of the range or the most chosen value. This imputation is like mean value of a variable but more suitable for ordinal values.
- Adding a category to capture NA is when all the missing observations are grouped into a newly created label ‘Missing’, i.e., an added category of a variable. This could be the most widely used missing data imputation for categorical variables.
- Frequent category imputation is when missing values are substituted by most frequent category of the variable. This is applicable to categorical data. This imputation is equivalent to mode imputation.
- Arbitrary value imputation is when all missing values of a variable are substituted with an arbitrary value. Preferably, the arbitrary value should be different from the mean/median/mode values and are typically set by the originator. Some examples of arbitrary values are 0, 999, −999, −1 (if the variable contains only positive values).
- Adding a variable to capture NA is when the importance of missingness needs to be captured by creating an added variable that can only have binary values. The value “0” of the new variable indicates absence of missingness, whereas the value “1” indicates presence of missingness.
- Random sampling imputation is when a random observation is chosen from the pool of available observations to replace the missing values. This imputation is like mean/median imputation because the statistical parameters of the original variable are preserved.
Multiple imputation is a scenario where a set of plausible values are estimated for the missing data from the distribution of the observed data. Multiple datasets are created by incorporating random components into these estimated values to show their uncertainty. These datasets are then analyzed individually and identically to obtain a set of parameter estimates. Model imputation should be implemented in conjunction with some cross-validation scheme to avoid leakage. Some examples of model imputation are discussed below:
- Linear regression is when existing variables are used to predict, and then the predicted value is substituted as an obtained value. This method avoids modifying the standard deviation or distribution shape of the variable.
- Random forest is suitable for both data missing at random and not missing at random scenarios. This method uses multiple decision trees to estimate missing values and outputs out-of-the-bag imputation error estimates. An important note about random forest is that it works better with large datasets because it has the potential of overfitting in case of small datasets.
- k-NN (k nearest neighbor) is when missing observations are substituted based on the nearest k neighbor, and are determined based on distance measure. When the k neighbors are determined, the missing value is imputed by taking mean/median or mode of known values of the variable with missing values.
- Maximum likelihood is when parameters are estimated using the available data, and then missing data are estimated based on the previous estimated parameters.
- Expectation-maximization consists of the following steps: (1) expectation step is where parameters like variance, covariance, and mean are estimated; (2) regression step is where the previous estimated parameters are used to create a regression equation to predict the missing data; and (3) maximization step is where the previous created regression equations are used to predict the missing data. These three steps are repeated until the system is stable.
- Sensitivity analysis is the study where uncertainty in the output of a model can be mapped to the different uncertainties in the model inputs.
Outlier data treatment pertains to detecting the outliers and addressing them by exclusion, correction, etc. from the dataset. There are two kinds of outliers based on feature space [53]:
- Univariate outliers are found in a single feature space
- Multivariate outliers are found in n-dimensional space (of n-features)
Whereas, there are three types of outliers based on their environment:
- Point outliers are single data points appearing far from the rest of the distribution
- Contextual outliers can be noise in data
- Collective outliers can be subsets of novelties in data implying a new phenomenon
Outlier detection is applied on the treated missing data once the data are treated. The outliers can be detected through methods such as those described in [26,54]. These can be graphically summarized as shown in Figure A3:
- Standard deviation is calculated for a dataset with respect to the mean of the dataset. If an observation is a certain number of standard deviations from the mean, then that observation will be identified as an outlier. The specified number of standard deviations is called the threshold, which is “3” for default [55].
- Boxplots are a graphical representation of numerical data portrayed through their quartiles or quantiles. The boxplots use the concept of the interquartile range (IQR). The IQR is a measure of where majority of the data lie. The IQR is calculated by subtracting the first quartile () from the third quartile () [56]Quartiles are values that divide the data into quarters [57]. The quarters dividing a dataset into quartiles are:
- -
- The lowest 25% of numeric data
- -
- The next lowest 25% of numeric data (up to the median)
- -
- The second highest 25% of numeric data (above the median)
- -
- The highest 25% of numeric data
- DBScan (density-based spatial clustering of applications with noise) clustering is an algorithm focused on finding neighbors by density (MinPts) on an ‘n-dimensional sphere’ with sphere . A cluster is the maximal set of ‘density connected points’ in the feature space. Then, DBScan defines different classes of points:
- -
- Core point is a point if its neighborhood (defined by ) contains at least the same number or more points than MinPts.
- -
- Border point is a point that lies in a cluster and its neighborhood does not contain more points than MinPts but is still ‘density reachable’ by other points in the cluster.
- -
- Outlier is a point that lies in no cluster and is neither ‘density reachable’ nor ‘density connected’ to any other point. This outlier will have its own cluster.
- *
- Density reachable [58]: A point q is density reachable from p with respect to and MinPts if there is a chain of points with , such that is directly density reachable from with respect to and MinPts for all 1 ≤ i ≤ n. Density reachable is not symmetric. Since, q is not a core point, thus, is not directly density reachable from q. Therefore, p is not density reachable from point q.
- *
- Density connected [53]: A point q is density connected to point p with respect to and MinPts if there is a point o such that both p and q are density reachable from o with respect to and MinPts. Density connectivity is symmetric. If point q is density connected to point p, then point p is also density connected to point q.
- Isolation forest uses the basic principle that outliers are few and far from the rest of the observations. The algorithm chooses a feature from the feature space and a random split value ranging between the maximums and minimums to build a tree (training). This is done for each of the observations in the training set. An ensemble tree is built from averaging all the trees in the forest. The algorithm compares an observation against splitting value in a ‘node’ that will have two node children on which further random comparisons will be conducted for prediction. ‘Path length’ is the number of splittings made by the algorithm. Outliers will have shorter path lengths than rest of the observations. An outlier score can be computed for each observation through the following formula:where, = path length of sample x= maximum path length of a binary tree from root to external noden = number of external nodes.Each observation is scored from 0 to 1, where the higher observation score increases the probability of it being an outlier.
- Robust random cut forest is an algorithm used by AWS services to detect an outlier. The algorithm assigns an anomaly score to each observation. Low anomaly score implies the observation is normal, high anomaly score implies the observation possibly being an anomaly. This algorithm works well with high dimensional data, offline data, and realstreaming data.
Outlier treatment [59] can be done in three ways:
- Trimming/removing is a technique of discarding the outlier observation from the dataset; however, it may not always be advisable. Some outliers may be natural occurrences and warrant for further investigation, while others might be errors that can be removed upon investigation and confirmation as an error.
- Quantile-based flooring and capping is a technique where outlier values above the 90th percentile are capped while outlier values below the 10th percentile are floored.
- Mean/median imputation is a technique of substituting the outlier observation with the mean/median value of the dataset. However, the mean value may be influenced by the outliers; hence, it is advisable to replace the outliers with the median value of the dataset.

Figure A3.
Data curation—Outlier detection analysis.
Appendix B. Digital Twin Use Cases in Energy Sector
This appendix provides a brief analysis on digital-twin-based power systems use cases researched across recent scientific literature. All use cases listed in Table A2 are provided as bullets with one of the following prefix letters: M, I, G, E, A. A description of these letters is described in the legend at the end of the table. The legend corresponds to the use case categories discussed in Section 5. Below are several noteworthy observations among the 60 use cases that were reviewed (see Figure A4):

Figure A4.
Comprehensive view of use cases presented in Table A2.
- 39% of the reviewed use cases (23 out of 59) can be categorized as digital-twin-based studies that correspond to Model Validation and Planning Studies Through Parameter Tuning.
- 27% of the reviewed use cases (16 out of 59) can be categorized as digital-twin-based studies that correspond to Improving Security Through Detection and Forecasting.
- 22% of the reviewed use cases (13 out of 59) can be categorized as digital-twin-based studies that correspond to Power System Performance Analysis.
- 7% of the reviewed use cases (4 out of 59) can be categorized as digital-twin-based studies that correspond to Enhance Situational Awareness through Control Room Advisory.
- 3% of the reviewed use cases (2 out of 59) can be categorized as digital-twin-based studies that correspond to Grid Resiliency Analysis.
- 2% of the reviewed use cases (1 out of 59) can be categorized as digital-twin-based studies that correspond to Asset Management Gap through Visualization.
It is unsurprising to see a large percentage of use cases focused on planning studies, cybersecurity, and power system performance analysis. The data, however, indicate that there may be many opportunities to explore digital twins for grid resiliency, asset management, and control room advisory studies.
Table A1.
Comparative Analysis between D-Arc and other Digital Twin Frameworks, Architectures, and Models.
Table A1.
Comparative Analysis between D-Arc and other Digital Twin Frameworks, Architectures, and Models.
| Ref. | D-Arc Layer | D-Arc Related Components | Other Factors | |||||||||
|---|---|---|---|---|---|---|---|---|---|---|---|---|
| I | P | C | M | O | A | D | DF | b | OM | UB | Observations and Rating Justification | |
| [60] | (X) | (P) | (-) | (P) | (-) | (P) | (-) | (-) | (-) | (-) | (P) | The framework is custom developed for the state estimation related use case defined in the paper. Although it is straightforward to use the framework outside the scope of the paper, the applicability will be limited to use cases that are highly like the paper’s use case. Architecture layer abstraction is limited, and lack of object modeling makes reusability nearly impossible across use cases. |
| [61] | (X) | (X) | (-) | (X) | (-) | (X) | (-) | (X) | (-) | (P) | (X) | The framework is defined to be broad, and it can be used across a wide range of use cases. However, the use may only be limited to early ideation phase due to lack of thorough data orchestration processes. The paper alludes to object modeling, but it is extremely limited and cannot fit other use cases within the defined object model or similar models. |
| [62] | (P) | (P) | (-) | (P) | (-) | (P) | (-) | (-) | (-) | (-) | (P) | The framework and modeling may be categorized as a granular simulation as opposed to a true digital twin. System-level subcomponent dependencies and pertinent physics is defined in a simplified manner, which in turn significantly simplifies the model. The framework does not define sensor connections to the model that pushes the method far from a true digital twin. Many layers and pertinent components are not discussed. Data modeling and process flow modeling is not defined; therefore, it is nontrivial to reuse the framework outside the paper. |
| [63] | (-) | (-) | (-) | (P) | (-) | (-) | (-) | (-) | (-) | (-) | (-) | The paper presents a high-level framework on correlating business requirements with digital twins. However, the framework does not present the needed technical depth across physical and digital dimensions to use it for use cases. |
| [64] | (-) | (P) | (P) | (P) | (P) | (-) | (-) | (-) | (-) | (-) | (P) | The framework presented in the paper is a method of outlining the technologies that are useful for digital twin development. The paper briefly mentions components of various layers, but it does not analyze the interactions between the various subcomponents. Therefore, the presented framework is primarily illustrative and may not be usable for granular use case architecture and design. |
| [65] | (X) | (X) | (X) | (P) | (P) | (X) | (X) | (-) | (-) | (P) | (X) | The paper presents a detailed framework with emphasis on information modeling, pertinent ontology structure, and concepts. The paper discusses the interactions through sequence diagrams and information flow definitions. The paper has limited emphasis on the digital twin modeling layer and does not define the feedback model between physical and digital dimensions. The framework can potentially be used outside the scope of the paper but customized expansion in the infrastructure and peripheral layers, model layer, and data feedback mechanisms is needed. |
| [66] | (P) | (-) | (-) | (X) | (-) | (X) | (-) | (X) | (-) | (-) | (P) | The paper presents a use-case-based digital twins architecture with heavy emphasis on using the data for model development and pertinent applications. The framework does not provide data and information modeling and related process flows. Therefore, the architecture may only be reusable in similar use cases in a similar experiment setting as defined in the paper. |
| [67] | (X) | (P) | (-) | (P) | (X) | (X) | (-) | (X) | (-) | (-) | (P) | The paper presents a detailed framework that can be potentially reused for various use cases. The paper, however, does not provide insights into data handling processes, information flows, and communication network interconnections between the physical and digital dimensions. Therefore, reusability of the presented framework could surface consistency gaps across its use in the use cases. |
| [68] | (P) | (X) | (X) | (X) | (P) | (P) | (-) | (X) | (-) | (-) | (P) | The framework presents a detailed and highly reusable framework focused largely on digital twin model development and pertinent tools with minimal emphasis on handling physical dimension and data orchestration processes. The paper does not present object modeling processes to easily reuse the presented framework and pertinent processes. |
| [43] | (P) | (-) | (P) | (X) | (-) | (X) | (-) | (-) | (-) | (-) | (P) | The framework is depicted at a broad level; therefore, many layers and pertinent components are missing. The framework gives the general idea of digital twins but does not provide needed technical and engineering details to reuse it for use cases outside the paper. |
| [69] | (P) | (X) | (-) | (X) | (-) | (X) | (-) | (P) | (-) | (-) | (X) | The framework discusses detailed interactions between the physical and digital dimensions, including the modeling approaches needed for accurate digital twin design. The framework does not provide engineering details around communication infrastructure and pertinent processes, the application layer components, and information models to reuse the framework at scale. |
| [70] | (P) | (-) | (-) | (P) | (-) | (X) | (P) | (-) | (-) | (-) | (-) | The paper presents a model for digital twin development in the nuclear energy sector. However, the presented model may not be categorized as a general framework that applies to a wide range of use cases. |
| [71] | (-) | (-) | (-) | (P) | (-) | (-) | (-) | (P) | (-) | (-) | (-) | The framework combines engineering and social aspects of the digital twin design process. However, it does not present the core engineering aspects that are necessary to depict for a digital twin design. |
| [72] | (X) | (X) | (-) | (X) | (-) | (-) | (-) | (X) | (-) | (-) | (X) | The comprehensive framework presents a hierarchical set of relationships between the physical and digital dimension components. The framework can be used beyond the presented use case for early-stage experiments. Lack of thorough analysis on the network protocol models, relationship definition to the application layer components, and data and information models potentially limits the framework’s use in large scale near-production digital twins. |
| [45] | (X) | (X) | (P) | (X) | (-) | (X) | (X) | (P) | (-) | (-) | (X) | Across all frameworks reviewed, this is the most detailed framework with a good balance between the technical depth in physical and digital dimension. Given its comprehensive nature, the framework can be used outside the presented use case. The framework, however, has limited emphasis on the communication and network infrastructure and pertinent protocols and processes, information, and object modeling. Therefore, reapplicability of the framework across use cases in a comparable fashion can prove difficult. |
| [73] | (P) | (-) | (P) | (P) | (-) | (P) | (-) | (-) | (-) | (-) | (-) | The paper presents a use-case-driven architecture that may be categorized as a model and not as a framework. It is customized to the presented use case and defined at a high level. Therefore, lack of granular relationship definitions makes it complex to use for use cases out of the scope of the paper. |
| [74] | (X) | (X) | (P) | (X) | (-) | (P) | (P) | (-) | (-) | (P) | (P) | This paper presents a highly granular use-case-driven digital twins model architecture that can potentially derive a generic framework that can be used outside the scope of the paper’s use case. The paper does not present such generic framework, and therefore its applicability in use cases outside the paper may be limited. The process behind the hierarchical physical-driven modeling process depicted in the paper is well presented and can be followed for other use cases. |
| [75] | (P) | (P) | (P) | (P) | (-) | (-) | (P) | (-) | (-) | (-) | (P) | The paper presents a highly customized, use-case-driven architecture that could be used as a generic framework for similar applications. The framework does not cover a broad range of communication parameters, information, and data model processes, which potentially limits its usability outside the scope of the paper. |
| D-Arc | (X) | (X) | (X) | (X) | (X) | (X) | (X) | (X) | (X) | (X) | (X) | Thorough analysis of the above frameworks, architectures, and models validated the need of D-Arc or similar open architecture framework that is agnostic to use cases. Such a framework is necessary to architect, develop, test, compare, and scale digital twin use cases across a multitude of research teams. Furthermore, the data and information modeling processes defined in relation to D-Arc illustrates a detailed roadmap of digital twin development and layer-to-layer interactions. |
DF: Dimensional feedback; DPO: Design phase overlay; Ref: Reference; Scale for D-Arc layers and related components: (-): Not defined in the framework, (X): Fully defined in the framework, (P): Partially defined in the framework; UB: Usability and broadness of the framework: (-): Not usable outside the paper, (X): Fully usable outside the paper, (P): Partial or limited use outside the paper; OM: Object modeling: (X): Object and information modeling, relationship flows are defined, (-): Object and information modeling, relationship flows are not defined.
Table A2.
Summary of high value digital twin use cases for power and energy systems.
Table A2.
Summary of high value digital twin use cases for power and energy systems.
| Ref. | Use Cases Discussed |
|---|---|
| [60] |
|
| [61] |
|
| [62] |
|
| [67] |
|
| [87] |
|
| [91] |
|
| [43] |
|
| [43] |
|
| [94] |
|
| [95] |
|
| [69] |
|
| |
| Related observations: The paper discusses the following tools for physics-based dynamic system modeling: IDAES (Institute for the Design of Advanced Energy Systems)[111] that uses Python’s Pyomo package for optimization, Generalized Addictive Models (GAMs) for system input-output analysis, and multistage Vector Autoregressive Model (VAR). The paper also emphasizes that, in addition to system-level data, peripheral/environmental sensors such as temperature, vibration, pressure, and accelerometers are useful in a power system’s subsystem modeling. Note that [69] provides a comprehensive list of 50+ use cases across various sectors. The below list is a summary of energy and power related use cases in the context of grid operation. | |
| [68] |
|
M: Model validation and planning studies through parameter tuning; I: Improving security through detection
and forecasting; G: Grid resiliency analysis; E: Enhance situational awareness through control room advisory;
A: Asset management gap analysis through visualization; P: Power system performance analysis.
Table A3.
List of symbols used in this work.
Table A3.
List of symbols used in this work.
| Symbol | Description |
|---|---|
| |
| |
| |
| |
| |
| |
| |
| |
| |
| |
| |
| |
|
Appendix C. Extended UML Diagrams
In this section, an extended version of UML diagrams is presented. These include specific methods and properties that are relevant to each use case.

Figure A5.
Extended information flow, dependencies, and relationships of the physical dimension D-Arc technology stack layers in the context of power grid operations.

Figure A6.
Extended information flow, dependencies, and relationships of the digital dimension D-Arc technology stack layers in the context of the NESCOR scenarios.

Figure A7.
Extended illustration of the D-Arc and UML sequence flow process using transformer system as an example.

Figure A8.
Extended information flow and object modeling for use case #1.

Figure A9.
Information flow and object modeling for use case #2.

Figure A10.
Extended information flow and object modeling for use case #3.

Figure A11.
Extended information flow and object modeling for use case #4.

Figure A12.
Extended information flow and object modeling for use case #5.

Figure A13.
Extended information flow and object modeling for use case #6.
References
- Ghobakhloo, M. Industry 4.0, digitization, and opportunities for sustainability. J. Clean. Prod. 2020, 252, 119869. [Google Scholar] [CrossRef]
- Tao, F.; Zhang, M.; Cheng, J.; Qi, Q. Digital twin workshop: A new paradigm for future workshop. Comput. Integr. Manuf. Syst. 2017, 23, 1–9. Available online: http://www.cims-journal.cn/EN/10.13196/j.cims.2017.01.001 (accessed on 9 May 2023).
- Tao, F.; Zhang, H.; Liu, A.; Nee, A.Y.C. Digital Twin in Industry: State-of-the-Art. IEEE Trans. Ind. Inform. 2019, 15, 2405–2415. [Google Scholar] [CrossRef]
- Howard, D.A.; Ma, Z.; Jørgensen, B.N. Digital twin framework for energy efficient greenhouse industry 4.0. In Proceedings of the Ambient Intelligence–Software and Applications: 11th International Symposium on Ambient Intelligence, L’Aquila, Italy, 17–19 June 2020; Springer: Berlin/Heidelberg, Germany, 2021; pp. 293–297. [Google Scholar]
- Glaessgen, E.; Stargel, D. The Digital Twin Paradigm for Future NASA and U.S. Air Force Vehicles. In Proceedings of the 53rd AIAA/ASME/ASCE/AHS/ASC Structures, Structural Dynamics and Materials Conference, Honolulu, HI, USA, 23–26 April 2012. [Google Scholar] [CrossRef]
- Spinti, J.P.; Smith, P.J.; Smith, S.T. Atikokan Digital Twin: Machine learning in a biomass energy system. Appl. Energy 2022, 310, 118436. [Google Scholar] [CrossRef]
- Grieves, M. Digital Twin: Manufacturing Excellence through Virtual Factory Replication. 2014. Available online: https://www.3ds.com/fileadmin/PRODUCTS-SERVICES/DELMIA/PDF/Whitepaper/DELMIA-APRISO-Digital-Twin-Whitepaper.pdf (accessed on 1 May 2023).
- US Congress. H.R.3684—Infrastructure Investment and Jobs Act; US Congress: Washington, DC, USA, 2021.
- Qi, Q.; Tao, F. Digital Twin and Big Data Towards Smart Manufacturing and Industry 4.0: 360 Degree Comparison. IEEE Access 2018, 6, 3585–3593. [Google Scholar] [CrossRef]
- Fuller, A.; Fan, Z.; Day, C.; Barlow, C. Digital Twin: Enabling Technologies, Challenges and Open Research. IEEE Access 2020, 8, 108952–108971. [Google Scholar] [CrossRef]
- Rice, T.; Seppala, G.; Edgar, T.W.; Cain, D.; Choi, E. Fused Sensor Analysis and Advanced Control of Industrial Field Devices for Security: Cymbiote Multi-Source Sensor Fusion Platform. In Proceedings of the NCS ’19: Northwest Cybersecurity Symposium, Richland, WA, USA, 8–10 April 2019. [Google Scholar] [CrossRef]
- Pacific Northwest National Laboratory. Volttron. Available online: https://volttron.org/ (accessed on 1 May 2023).
- Pacific Northwest National Laboratory. A Triple-Threat Against Cyberthreats. Available online: https://www.pnnl.gov/news/release.aspx?id=4484 (accessed on 1 May 2023).
- EnergyPlus. Available online: https://energyplus.net/ (accessed on 1 May 2023).
- The Modelica Association. Available online: https://modelica.org/ (accessed on 1 May 2023).
- Drgona, J.; Tuor, A.; Vrabie, D. Learning Constrained Adaptive Differentiable Predictive Control Policies with Guarantees. arXiv 2020, arXiv:2004.11184. [Google Scholar]
- Mahapatra, K.; Sebastian-Cardenas, D.J.; Gourisetti, S.N.G.; Brien, J.G.; Ogle, J.P. Novel Data Driven Noise Emulation Framework using Deep Neural Network for Generating Synthetic PMU Measurements. In Proceedings of the 2021 Resilience Week (RWS), Salt Lake City, UT, USA, 18–21 October 2021; pp. 1–9. [Google Scholar] [CrossRef]
- Electric, G. Digital Ghost: Real-Time, Active Cyber Defense. Available online: https://www.ge.com/research/offering/digital-ghost-real-time-active-cyber-defense/ (accessed on 1 May 2023).
- Herrera, E.; Harclerode, C.; Krivonosova, S.; Edwards, S. Layers of Analytics and No-Code Operational Digital Twins with the PI System. OSIsoft. 2020. Available online: https://vertix.pe/wp-content/uploads/2022/09/Pi-and-Seeq-Better-Together-Global-Webinar.pdf (accessed on 1 May 2023).
- O’Conor, C. Introduction to Digital Twin: Simple, But Detailed; IBM: Armonk, NY, USA, 2014. [Google Scholar]
- NESCOR. Analysis of Selected Electric Sector High Risk Failure Scenarios—Version 2; National Electric Sector Cybersecurity Organization Resource: West Springfield, MA, USA, 2015.
- Samimi, M.H.; Ilkhechi, H.D. Survey of different sensors employed for the power transformer monitoring. Iet Sci. Meas. Technol. 2020, 14, 1–8. [Google Scholar] [CrossRef]
- Cognite. Available online: https://www.cognite.com/en/product/applications/cognite (accessed on 1 May 2023).
- Services, A.W. Digital Twins on AWS: Unlocking Business Value and Outcomes. Available online: https://aws.amazon.com/blogs/iot/digital-twins-on-aws-unlocking-business-value-and-outcomes/ (accessed on 1 May 2023).
- Microsoft Corporation. Azure Digital Twins. Available online: https://azure.microsoft.com/en-us/services/digital-twins/ (accessed on 1 May 2023).
- Autodesk. Digital Twins in Construction, Engineering & Architecture. Available online: https://www.autodesk.com/solutions/digital-twin/architecture-engineering-construction (accessed on 1 May 2023).
- Siemens Corporation. Next-Generation Modelling Tools across the Process Lifecycle. Available online: https://www.psenterprise.com/products/gproms/ (accessed on 1 May 2023).
- Hearn, M.; Rix, S. Cybersecurity Considerations for Digital Twin Implementations. Ind. Internet Consort. J. Innov. 2020. Available online: https://www.iiconsortium.org/news-pdf/joi-articles/2019-November-JoI-Cybersecurity-Considerations-for-Digital-Twin-Implementations.pdf (accessed on 1 May 2023).
- Mangabo, O. 6 Web Backend Security Risks to Consider in Development; GeekFlare: London, UK, 2020. [Google Scholar]
- Shao, G. Use Case Scenarios for Digital Twin Implementation Based on ISO 23247; National Institute of Standard and Technology (NIST): Gaithersburg, MD, USA, 2021.
- Voas, J.; Mell, P.; Piroumian, V. Considerations for Digital Twin 18 Technology and Emerging Standard; National Institute of Standard and Technology (NIST): Gaithersburg, MD, USA, 2021.
- Staff, O. What Is Data Orchestration? Databricks: San Francisco, CA, USA, 2019. [Google Scholar]
- Oracle. What Is a Data Warehouse? Available online: https://www.oracle.com/database/what-is-a-data-warehouse (accessed on 1 May 2023).
- Kosterev, D.N.; Taylor, C.W.; Mittelstadt, W.A. Model validation for the 10 August 1996 WSCC system outage. IEEE Trans. Power Syst. 1999, 14, 967–979. [Google Scholar] [CrossRef]
- Tuffner, F.; Fuller, J. Power Flow User Guide. 2009. Available online: http://gridlab-d.shoutwiki.com/wiki/PowerFlowUserGuide (accessed on 1 May 2023).
- Dugan, R.C.; Montenegro, D. Reference Guide: The Open Distribution System Simulator; EPRI: Washington, DC, USA, 2013. [Google Scholar]
- Center, L.E. Alternative Transients Program (ATP): Rule Book; EMTP: Montreal, QC, Canada, 1992. [Google Scholar]
- Keiter, E.R.; Mei, T.; Russo, T.V.; Rankin, E.L.; Schiek, R.L.; Thornquist, H.K.; Verley, J.C.; Fixel, D.A.; Coffey, T.S.; Pawlowski, R.P.; et al. Xyce Parallel Electronic Simulator: Users’ Guide; Technical Report; Sandia National Laboratories (SNL): Albuquerque, NM, USA; Livermore, CA, USA, 2012.
- Yan, M.; Gan, W.; Zhou, Y.; Wen, J.; Yao, W. Projection method for blockchain-enabled non-iterative decentralized management in integrated natural gas-electric systems and its application in digital twin modelling. Appl. Energy 2022, 311, 118645. [Google Scholar] [CrossRef]
- Gimon, E.; Fellow, S. Lessons from the Texas Big Freeze; Energy Innovation: San Francisco, CA, USA, 2021. [Google Scholar]
- Kaur, D. Singapore Cloned to Be World’s Largest Digital Twin Country. Available online: https://techwireasia.com/2022/06/singapore-cloned-to-be-worlds-largest-digital-twin-country/ (accessed on 1 May 2023).
- You, M.; Wang, Q.; Sun, H.; Castro, I.; Jiang, J. Digital twins based day-ahead integrated energy system scheduling under load and renewable energy uncertainties. Appl. Energy 2022, 305, 117899. [Google Scholar] [CrossRef]
- Danilczyk, W.; Sun, Y.; He, H. ANGEL: An Intelligent Digital Twin Framework for Microgrid Security. In Proceedings of the 2019 North American Power Symposium (NAPS), Wichita, KS, USA, 13–15 October 2019; pp. 1–6. [Google Scholar] [CrossRef]
- Madni, A.M.; Madni, C.C.; Lucero, S.D. Leveraging Digital Twin Technology in Model-Based Systems Engineering. Systems 2019, 7, 7. [Google Scholar] [CrossRef]
- Sifat, M.M.H.; Choudhury, S.M.; Das, S.K.; Ahamed, M.H.; Muyeen, S.; Hasan, M.M.; Ali, M.F.; Tasneem, Z.; Islam, M.M.; Islam, M.R.; et al. Towards electric digital twin grid: Technology and framework review. Energy AI 2023, 11, 100213. [Google Scholar] [CrossRef]
- Willige, A. Digital Twins: What Are They and Why Do They Matter? DAVOS. 2022. Available online: https://www.weforum.org/agenda/2022/05/digital-twin-technology-virtual-model-tech-for-good/ (accessed on 1 May 2023).
- Liliendahl, H.G. 4 Concepts in the Gartner Hype Cycle for Digital Business Capabilities That Will Shape MDM. Available online: https://liliendahl.com/2022/02/09/4-concepts-in-the-gartner-hype-cycle-for-digital-business-capabilities-that-will-shape-mdm/ (accessed on 1 May 2023).
- Roy, B. All About Missing Data Handling. TowardsData-Science. 2019. Available online: https://towardsdatascience.com/all-about-missing-data-handling-b94b8b5d2184?gi=bf145006f41f (accessed on 1 May 2023).
- Trotta, F. How To Detect Outliers in a Data Science Project. TowardsDataScience. 2022. Available online: https://towardsdatascience.com/how-to-detect-outliers-in-a-data-science-project-17f39653fb17 (accessed on 1 May 2023).
- Bitesize, G.B. Data Validation and Verification. Available online: https://www.bbc.co.uk/bitesize/guides/zdvrd2p/revision/1 (accessed on 1 May 2023).
- Swalin, A. How to Handle Missing Data. TowardsDataScience. 2018. Available online: https://towardsdatascience.com/how-to-handle-missing-data-8646b18db0d4 (accessed on 1 May 2023).
- Jakobsen, J.C.; Gluud, C.; Wetterslev, J.; Winkel, P. When and how should multiple imputation be used for handling missing data in randomised clinical trials—A practical guide with flowcharts. BMC Med. Res. Methodol. 2017, 17, 162. [Google Scholar] [CrossRef]
- Mishra, P. 5 Outlier Detection Techniques that every “Data Enthusiast” Must Know. TowardsDataScience. 2018. Available online: https://towardsdatascience.com/5-outlier-detection-methods-that-every-data-enthusiast-must-know-f917bf439210 (accessed on 1 May 2023).
- Taylor, M. Top Five Methods to Identify Outliers in Data. Available online: https://medium.com/swlh/top-five-methods-to-identify-outliers-in-data-2777a87dd7fe (accessed on 1 May 2023).
- Oracle. Outlier Detection Method. Available online: https://docs.oracle.com/cd/E17236_01/epm.1112/cb_statistical/frameset/ (accessed on 1 May 2023).
- Interquartile Range (IQR): What It Is and How to Find It. Available online: https://www.statisticshowto.com/probability-and-statistics/interquartile-range/ (accessed on 1 May 2023).
- What are Quartile. Available online: https://www.statisticshowto.com/what-are-quartiles (accessed on 1 May 2023).
- ML DBSCAN Reachability and Connectivity. Available online: https://www.geeksforgeeks.org/ml-dbscan-reachability-and-connectivity (accessed on 1 May 2023).
- Bonthu, H. Detecting and Treating Outliers|Treating the Odd One Out! Available online: https://www.analyticsvidhya.com/blog/2021/05/detecting-and-treating-outliers-treating-the-odd-one-out/ (accessed on 1 May 2023).
- Zhou, M.; Yan, J.; Feng, D. Digital twin framework and its application to power grid online analysis. CSEE J. Power Energy Syst. 2019, 5, 391–398. [Google Scholar] [CrossRef]
- Pan, H.; Dou, Z.; Cai, Y.; Li, W.; Lei, X.; Han, D. Digital Twin and Its Application in Power System. In Proceedings of the 2020 5th International Conference on Power and Renewable Energy (ICPRE), Shanghai, China, 12–14 September 2020; pp. 21–26. [Google Scholar] [CrossRef]
- Baboli, P.T.; Babazadeh, D.; Kumara Bowatte, D.R. Measurement-based Modeling of Smart Grid Dynamics: A Digital Twin Approach. In Proceedings of the 2020 10th Smart Grid Conference (SGC), Kashan, Iran, 16–17 December 2020; pp. 1–6. [Google Scholar] [CrossRef]
- Yu, W.; Patros, P.; Young, B.; Klinac, E.; Walmsley, T.G. Energy digital twin technology for industrial energy management: Classification, challenges and future. Renew. Sustain. Energy Rev. 2022, 161, 112407. [Google Scholar] [CrossRef]
- Liu, M.; Fang, S.; Dong, H.; Xu, C. Review of digital twin about concepts, technologies, and industrial applications. J. Manuf. Syst. 2021, 58, 346–361. [Google Scholar] [CrossRef]
- Steindl, G.; Stagl, M.; Kasper, L.; Kastner, W.; Hofmann, R. Generic Digital Twin Architecture for Industrial Energy Systems. Appl. Sci. 2020, 10, 8903. [Google Scholar] [CrossRef]
- Huang, J.; Zhao, L.; Wei, F.; Cao, B. The Application of Digital Twin on Power Industry. IOP Conf. Ser. Earth Environ. Sci. 2021, 647, 012015. [Google Scholar] [CrossRef]
- Palensky, P.; Cvetkovic, M.; Gusain, D.; Joseph, A. Digital twins and their use in future power systems [version 2; peer review: 2 approved]. Digit. Twin 2022, 1, 4. [Google Scholar] [CrossRef]
- He, X.; Ai, Q.; Qiu, R.C.; Zhang, D. Preliminary Exploration on Digital Twin for Power Systems: Challenges, Framework, and Applications. arXiv 2019, arXiv:1909.06977. [Google Scholar] [CrossRef]
- Sleiti, A.K.; Kapat, J.S.; Vesely, L. Digital twin in energy industry: Proposed robust digital twin for power plant and other complex capital-intensive large engineering systems. Energy Rep. 2022, 8, 3704–3726. [Google Scholar] [CrossRef]
- Patterson, E.A.; Taylor, R.J.; Bankhead, M. A framework for an integrated nuclear digital environment. Prog. Nucl. Energy 2016, 87, 97–103. [Google Scholar] [CrossRef]
- Okita, T.; Kawabata, T.; Murayama, H.; Nishino, N.; Aichi, M. A new concept of digital twin of artifact systems: Synthesizing monitoring/inspections, physical/numerical models, and social system models. Procedia CIRP 2019, 79, 667–672. [Google Scholar] [CrossRef]
- Barenji, A.V.; Liu, X.; Guo, H.; Li, Z. A digital twin-driven approach towards smart manufacturing: Reduced energy consumption for a robotic cell. Int. J. Comput. Integr. Manuf. 2021, 34, 844–859. [Google Scholar] [CrossRef]
- Qian, C.; Liu, X.; Ripley, C.; Qian, M.; Liang, F.; Yu, W. Digital Twin—Cyber Replica of Physical Things: Architecture, Applications and Future Research Directions. Future Internet 2022, 14, 64. [Google Scholar] [CrossRef]
- Saad, A.; Faddel, S.; Mohammed, O. IoT-Based Digital Twin for Energy Cyber-Physical Systems: Design and Implementation. Energies 2020, 13, 4762. [Google Scholar] [CrossRef]
- Atalay, M.; Angin, P. A Digital Twins Approach to Smart Grid Security Testing and Standardization. In Proceedings of the 2020 IEEE International Workshop on Metrology for Industry 4.0 & IoT, Roma, Italy, 3–5 June 2020; pp. 435–440. [Google Scholar] [CrossRef]
- Jain, P.; Poon, J.; Singh, J.P.; Spanos, C.; Sanders, S.R.; Panda, S.K. A Digital Twin Approach for Fault Diagnosis in Distributed Photovoltaic Systems. IEEE Trans. Power Electron. 2020, 35, 940–956. [Google Scholar] [CrossRef]
- Wu, F.; Moslehi, K.; Bose, A. Power System Control Centers: Past, Present, and Future. Proc. IEEE 2005, 93, 1890–1908. [Google Scholar] [CrossRef]
- Joseph, A.; Cvetković, M.; Palensky, P. Prediction of Short-Term Voltage Instability Using a Digital Faster than Real-Time Replica. In Proceedings of the IECON 2018—44th Annual Conference of the IEEE Industrial Electronics Society, Washington, DC, USA, 21–23 October 2018; pp. 3582–3587. [Google Scholar] [CrossRef]
- Assante, D.; Caforio, A.; Flamini, M.; Romano, E. Smart Education in the context of Industry 4.0. In Proceedings of the 2019 IEEE Global Engineering Education Conference (EDUCON), Dubai, United Arab Emirates, 8–11 April 2019; pp. 1140–1145. [Google Scholar] [CrossRef]
- Dagle, J. Postmortem analysis of power grid blackouts—The role of measurement systems. IEEE Power Energy Mag. 2006, 4, 30–35. [Google Scholar] [CrossRef]
- Liu, Z.; Meyendorf, N.; Mrad, N. The role of data fusion in predictive maintenance using digital twin. AIP Conf. Proc. 2018, 1949, 020023. [Google Scholar] [CrossRef]
- Fathy, Y.; Jaber, M.; Nadeem, Z. Digital Twin-Driven Decision Making and Planning for Energy Consumption. J. Sens. Actuator Netw. 2021, 10, 37. [Google Scholar] [CrossRef]
- Jiang, Z.; Lv, H.; Li, Y.; Guo, Y. A novel application architecture of digital twin in smart grid. J. Ambient. Intell. Humaniz. Comput. 2022, 13, 3819–3835. [Google Scholar] [CrossRef]
- Schroeder, G.; Steinmetz, C.; Pereira, C.E.; Muller, I.; Garcia, N.; Espindola, D.; Rodrigues, R. Visualising the digital twin using web services and augmented reality. In Proceedings of the 2016 IEEE 14th International Conference on Industrial Informatics (INDIN), Poitiers, France, 19–21 July 2016; pp. 522–527. [Google Scholar] [CrossRef]
- Bishop, I.D.; Stock, C. Using collaborative virtual environments to plan wind energy installations. Renew. Energy 2010, 35, 2348–2355. [Google Scholar] [CrossRef]
- Jain, A.; Nong, D.; Nghiem, T.X.; Mangharam, R. Digital twins for efficient modeling and control of buildings an integrated solution with scada systems. In Proceedings of the ASHRAE and IBPSA-USA Building Simulation Conference, Chicago, IL, USA, 26–28 September 2018. [Google Scholar]
- Danilczyk, W.; Sun, Y.L.; He, H. Smart Grid Anomaly Detection using a Deep Learning Digital Twin. In Proceedings of the 2020 52nd North American Power Symposium (NAPS), Tempe, AZ, USA, 11–13 April 2021; pp. 1–6. [Google Scholar] [CrossRef]
- Brosinsky, C.; Song, X.; Westermann, D. Digital Twin—Concept of a Continuously Adaptive Power System Mirror. In Proceedings of the International ETG-Congress 2019, ETG Symposium, Esslingen, Germany, 8–9 May 2019; pp. 1–6. [Google Scholar]
- Xu, Y.; Sun, Y.; Liu, X.; Zheng, Y. A Digital-Twin-Assisted Fault Diagnosis Using Deep Transfer Learning. IEEE Access 2019, 7, 19990–19999. [Google Scholar] [CrossRef]
- Brosinsky, C.; Westermann, D.; Krebs, R. Recent and prospective developments in power system control centers: Adapting the digital twin technology for application in power system control centers. In Proceedings of the 2018 IEEE International Energy Conference (ENERGYCON), Limassol, Cyprus, 3–7 June 2018; pp. 1–6. [Google Scholar] [CrossRef]
- Liu, T.; Yu, H.; Yin, H.; Zhang, Z.; Sui, Z.; Zhu, D.; Gao, L.; Li, Z. Research and Application of Digital Twin Technology in Power Grid Development Business. In Proceedings of the 2021 6th Asia Conference on Power and Electrical Engineering (ACPEE), Chongqing, China, 8–1 April 2021; pp. 383–387. [Google Scholar] [CrossRef]
- Lund, A.M.; Mochel, K.; Lin, J.W.; Onetto, R.; Srinivasan, J.; Gregg, P.; Bergman, J.E.; Hartling, K.D., Jr.; Ahmed, A.; Chotai, S. Digital Twin Interface for Operating Wind Farms. U.S. Patent US20160333854A1, 12 June 2018. [Google Scholar]
- Boschert, S.; Heinrich, C.; Rosen, R. Next Generation Digital Twin. In Proceedings of the TMCE 2018, Las Palmas de Gran Canaria, Spain, 12 October 2018. [Google Scholar]
- Ebrahimi, A. Challenges of developing a digital twin model of renewable energy generators. In Proceedings of the 2019 IEEE 28th International Symposium on Industrial Electronics (ISIE), Vancouver, BC, Canada, 12–14 June 2019; pp. 1059–1066. [Google Scholar] [CrossRef]
- Darbali-Zamora, R.; Johnson, J.; Summers, A.; Jones, C.B.; Hansen, C.; Showalter, C. State Estimation-Based Distributed Energy Resource Optimization for Distribution Voltage Regulation in Telemetry-Sparse Environments Using a Real-Time Digital Twin. Energies 2021, 14, 774. [Google Scholar] [CrossRef]
- Zitney, S.E. Dynamic Model-Based Digital Twin, Optimization, and Control Technologies for Improving Flexible Power Plant Operations. In Proceedings of the 2019 Connected Plant Conference, Charlotte, NC, USA, 19–21 February 2019. [Google Scholar]
- Pileggi, P.; Verriet, J.; Broekhuijsen, J.; van Leeuwen, C.; Wijbrandi, W.; Konsman, M. A Digital Twin for Cyber-Physical Energy Systems. In Proceedings of the 2019 7th Workshop on Modeling and Simulation of Cyber-Physical Energy Systems (MSCPES), Montreal, QC, Canada, 15 April 2019; pp. 1–6. [Google Scholar] [CrossRef]
- Brosinsky, C.; Krebs, R.; Westermann, D. Embedded Digital Twins in future energy management systems: Paving the way for automated grid control. Automatisierungstechnik 2020, 68, 750–764. [Google Scholar] [CrossRef]
- Park, H.A.; Byeon, G.; Son, W.; Jo, H.C.; Kim, J.; Kim, S. Digital Twin for Operation of Microgrid: Optimal Scheduling in Virtual Space of Digital Twin. Energies 2020, 13, 5504. [Google Scholar] [CrossRef]
- Saad, A.; Faddel, S.; Youssef, T.; Mohammed, O.A. On the Implementation of IoT-Based Digital Twin for Networked Microgrids Resiliency Against Cyber Attacks. IEEE Trans. Smart Grid 2020, 11, 5138–5150. [Google Scholar] [CrossRef]
- Gitelman, L.; Kozhevnikov, M.; Kaplin, D. Asset management in grid companies using integrated diagnostic devices. Int. J. Energy Prod. Manag. 2019, 4, 230–243. [Google Scholar] [CrossRef]
- Peng, Y.; Wang, H. Application of Digital Twin Concept in Condition Monitoring for DC-DC Converter. In Proceedings of the 2019 IEEE Energy Conversion Congress and Exposition (ECCE), Baltimore, MD, USA, 29 September–3 October 2019; pp. 2199–2204. [Google Scholar] [CrossRef]
- Oñederra, O.; Asensio, F.J.; Eguia, P.; Perea, E.; Pujana, A.; Martinez, L. MV Cable Modeling for Application in the Digital Twin of a Windfarm. In Proceedings of the 2019 International Conference on Clean Electrical Power (ICCEP), Otranto, Italy, 2–4 July 2019; pp. 617–622. [Google Scholar] [CrossRef]
- Andryushkevich, S.K.; Kovalyov, S.P.; Nefedov, E. Composition and Application of Power System Digital Twins Based on Ontological Modeling. In Proceedings of the 2019 IEEE 17th International Conference on Industrial Informatics (INDIN), Espoo, Finland, 23–25 July 2019; Volume 1, pp. 1536–1542. [Google Scholar] [CrossRef]
- Xu, B.; Wang, J.; Wang, X.; Liang, Z.; Cui, L.; Liu, X.; Ku, A.Y. A case study of digital-twin-modelling analysis on power-plant-performance optimizations. Clean Energy 2019, 3, 227–234. [Google Scholar] [CrossRef]
- Sivalingam, K.; Sepulveda, M.; Spring, M.; Davies, P. A Review and Methodology Development for Remaining Useful Life Prediction of Offshore Fixed and Floating Wind turbine Power Converter with Digital Twin Technology Perspective. In Proceedings of the 2018 2nd International Conference on Green Energy and Applications (ICGEA), Singapore, 24–26 March 2018; pp. 197–204. [Google Scholar] [CrossRef]
- Moussa, C.; Ai-Haddad, K.; Kedjar, B.; Merkhouf, A. Insights into Digital Twin Based on Finite Element Simulation of a Large Hydro Generator. In Proceedings of the IECON 2018—44th Annual Conference of the IEEE Industrial Electronics Society, Washington, DC, USA, 21–23 October 2018; pp. 553–558. [Google Scholar] [CrossRef]
- O’Dwyer, E.; Pan, I.; Charlesworth, R.; Butler, S.; Shah, N. Integration of an energy management tool and digital twin for coordination and control of multi-vector smart energy systems. Sustain. Cities Soc. 2020, 62, 102412. [Google Scholar] [CrossRef]
- Talkhestani, B.A.; Jung, T.; Lindemann, B.; Sahlab, N.; Jazdi, N.; Schloegl, W.; Weyrich, M. An architecture of an Intelligent Digital Twin in a Cyber-Physical Production System. Automatisierungstechnik 2019, 67, 762–782. [Google Scholar] [CrossRef]
- Kaewunruen, S.; Rungskunroch, P.; Welsh, J. A Digital-Twin Evaluation of Net Zero Energy Building for Existing Buildings. Sustainability 2019, 11, 159. [Google Scholar] [CrossRef]
- Gunter, D.K.; Agarwal, D.A.; Beattie, K.S.; Boverhof, J.R.; Cholia, S.; Cheah, Y.W.; Elgammal, H.; Sahinidis, N.V.; Miller, D.; Siirola, J.; et al. Institute for the Design of Advanced Energy Systems Process Systems Engineering Framework (IDAES PSE Framework); Computer Software; Lawrence Berkeley National Laboratory (LBNL): Berkeley, CA, USA, 2018. [CrossRef]
Disclaimer/Publisher’s Note: The statements, opinions and data contained in all publications are solely those of the individual author(s) and contributor(s) and not of MDPI and/or the editor(s). MDPI and/or the editor(s) disclaim responsibility for any injury to people or property resulting from any ideas, methods, instructions or products referred to in the content. |
© 2023 by the authors. Licensee MDPI, Basel, Switzerland. This article is an open access article distributed under the terms and conditions of the Creative Commons Attribution (CC BY) license (https://creativecommons.org/licenses/by/4.0/).