Article

Effects of Boundary Conditions on Performance Prediction of Deep-Buried Ground Heat Exchangers for Geothermal Energy Utilization

1
School of Human Settlements and Civil Engineering, Xi’an Jiaotong University, Xi’an 710049, China
2
Key Laboratory of Coal Resources Exploration and Comprehensive Utilization, Ministry of Natural Resources, Xi’an 710021, China
3
Department of Aeronautics and Astronautics, National Cheng Kung University, Tainan 701, Taiwan
4
Research Center for Smart Sustainable Circular Economy, Tunghai University, Taichung 407, Taiwan
5
Department of Mechanical Engineering, National Chin-Yi University of Technology, Taichung 411, Taiwan
6
Shaanxi Yateer Scientific and Technological Innovation Construction Co., Ltd., Xi’an 710076, China
*
Authors to whom correspondence should be addressed.
Energies 2023, 16(13), 4874; https://doi.org/10.3390/en16134874
Submission received: 14 May 2023 / Revised: 15 June 2023 / Accepted: 19 June 2023 / Published: 22 June 2023
(This article belongs to the Topic Sustainable Energy Technology, 2nd Volume)

Abstract

:
An accurate prediction for deep-buried ground heat exchangers (DBGHEs) is the premise for efficient utilization of geothermal energy. Due to the complexity of the geological composition spanning thousands of meters, the configuration of boundary conditions plays a critical role in evaluating DBGHE thermal performance. This paper proposed a three-dimensional model of full-scale DBGHE involving both conductive and convective heat transfer in aquifuge and aquifer layers. The constant inlet temperature and constant heating power boundaries in the DBGHE domain, and the surface–bottom temperature and heat flux boundaries in the rock-soil domain were examined. It was found that the differences in the performance prediction caused by different DBGHE boundary conditions were closely related to the system’s operating time. The relative differences in heat extraction amount and average borehole temperature of 2000 m DBGHE caused by the two inlet boundaries on the 30th day were, respectively, 19.5% and 18.3%, while these differences on the 120th day were decreased to 8.4% and 9.9%, respectively. It was found that the constant inlet temperature boundary was more appropriate than the constant heating power condition for estimating aquifer effects on the performance of DBGHE. For the rock-soil domain, the results showed that the heat extraction amount of DBGHE under the heat flux boundary was 12.6%–13.6% higher than that under the surface–bottom temperature boundary. Particularly, when considering the velocity change of groundwater in the aquifer, the relative difference in heat extraction amount increments caused by the two types of rock-soil boundaries can reach 26.6% on the 120th day. It was also found that the thermal influence radius at the end of a heating season was hardly affected by either the DBGHE inlet or rock-soil domain boundary conditions.

1. Introduction

Geothermal energy as a kind of clean and renewable energy has been widely applied in the space heating and cooling of buildings to achieve carbon neutrality. Recently, deep-buried ground heat exchangers (DBGHEs) have become an important way to extract geothermal energy with higher temperatures in medium and deep strata (several thousand meters) [1]. To exploit geothermal energy efficiently, it is of great importance to investigate the heat transfer processes through DBGHEs and different geological layers.
The factors affecting DBGHE performance—such as the sizes and thermo-physical properties of outer and inner pipes, the DBGHE flow rate and inlet temperature, the thermal physical properties of strata, and the geothermal gradient—have been studied in many references [2,3,4,5,6]. It is difficult to investigate DBGHEs by means of experiments or commercial numerical simulation software due to their depth of 2000–3000 m. Thus, most scholars modeled the heat transfer through the DBGHEs and the rocks and soil by adopting some methods to simplify heat transfer processes. In [7,8,9,10,11,12], the convective heat transfer coefficients calculated by the Nusselt number empirical correlation were usually used to solve the heat transfer of the working fluid inside DBGHEs. For heat transfer in the rock-soil domain, numerical methods and analytical methods were both used in these references.
The analytical solutions for the DBGHEs were mostly proposed based on the finite cylinder source (FCS) and finite line source (FLS) methods. Luo et al. [7,8] proposed segment FCS (SFCS) and segment FLS (SFLS) methods. Their investigations showed that, compared to the FCS method, the results obtained by the SFCS method were closer to the experimental data. Huang et al. [9] also applied the SFCS method to investigate the effects of fluid inlet directions, DBGHE inlet temperature, rock-soil thermal conductivity, and geothermal gradients. However, it may not be suitable for the analytical solution to simulate DBGHEs under more complicated geological conditions due to the assumptions in this method.
Some scholars have developed various numerical methods to solve heat transfer processes in the DBGHE and rock-soil domain. Jia et al. [10] simplified heat transfer between the DBGHE and strata into one-dimensional radial conduction. Morita et al. [11] proposed a two-dimensional conduction model to solve heat transfer in the strata and validated it using the field test. Bu et al. [12] also developed a two-dimensional conduction model of the rock-soil domain. They concluded that the annual mean heat extracted during the tenth heating season was 7.77% less than that in the first heating season. In references [13,14,15,16,17,18], a two-dimensional conduction model of the rock-soil domain was also established and numerically solved. In the above references, convective heat transfer in rocks and soil was ignored in the presence of groundwater flow. However, groundwater flow has a critical impact on the heat transfer process between GHEs and surrounding rocks and soil, according to some investigative results on the GHEs [19,20]. You et al. [21] found that the temperature drop of soil located upstream and near the ground heat exchanger could be alleviated by groundwater flow. Wang et al.’s [22] investigation demonstrated that, as groundwater flow velocity changes from 9.5 × 10⁻⁶ m∙s−1 to 2.5 × 10⁻⁵ m∙s−1, the total heat extraction amount of a GHE group increases by 36.8%. Thus, developing a full-scale three-dimensional model of DBGHEs is helpful to comprehensively study the effect of groundwater flow on the thermal performance of DBGHEs.
The boundary conditions are critical in the solution of the DBGHE heat transfer model. The boundary conditions are set by simplifying the actual conditions. The DBGHE inlet temperature is one of the important boundaries. When the DBGHEs run at a constant inlet temperature, their heat extraction amounts can be directly reflected by the outlet temperature. Thus, constant temperature was set as the inlet boundary condition in the simulations performed by Holmberg et al. [3], Luo et al. [7,8], Huang et al. [9], Morita et al. [11], Bu et al. [12], Liu et al. [14], Song et al. [18,23], Brown et al. [24], and Nian et al. [25]. In practical engineering, DBGHEs can also operate at a constant heating power according to the heating load of a building. In other words, DBGHEs obtain heat from rocks and soil based on this requirement. Therefore, some scholars [13,17,26,27] calculated the inlet temperature using constant heating power as the inlet boundary condition. Zhang et al. [28] concluded that the shallow GHE operation mode at a constant inlet temperature is superior to that at a constant heating power.
Scholars also adopted different boundary conditions for rocks and soil. The surface and bottom of the rock-soil domain were set as constant temperature boundary conditions in references [3,12,14,16,26,29,30,31]. Li et al. [17], Fang et al. [32], and Pan et al. [33] set the surface and bottom of the rock-soil domain as the convective heat transfer boundary and heat flux boundary, respectively. Song et al. [18] applied adiabatic boundary conditions to the surface and bottom of the rock-soil domain. Song et al. set the surface and bottom of the rocks and soil as the adiabatic boundary and constant temperature boundary in [23]. In the above reviews, the temperature boundary, convective heat transfer boundary, and heat flux boundary were commonly used in the rocks and soil.
Various thermal boundary conditions of the DBGHE inlet and rock-soil domains were adopted in the literature. Constant heating power and constant inlet temperature are two typical boundaries used in the simulation of the DBGHE. However, the heat flux boundary and surface–bottom temperature boundary are two widely used boundary conditions of the rock-soil domain, which are reasonably simplified compared to the actual conditions. The prediction of DBGHE involves various performance factors such as outlet temperature, heat extraction amount, thermal influence radius, etc. However, the impacts of boundary conditions on these factors have not been quantitatively examined.
This paper proposed a three-dimensional model of full-scale DBGHE with surrounding rock-soil involving both convection and conduction induced by groundwater movement. The impacts of the above-mentioned boundary conditions on the outlet temperature, heat extraction amount, borehole temperature, and thermal influence radius were compared and analyzed. In addition, the influence of boundary conditions on the analysis of the relationship between groundwater velocity and performance of DBGHE was evaluated. We hope that this study will provide a reference for choosing appropriate boundary conditions to obtain more accurate results in the simulation of the DBGHE.

2. Model Development and Solution

2.1. Model Development

A DBGHE full-scale model with a depth of 2000 m was established, as shown in Figure 1. According to the geological conditions surveyed by Shaanxi, Hebei, and Shandong et al. [34,35,36], there are three typical layers of cap rock, namely, insulation, thermal reservoir, and bed rock from the ground surface. Groundwater is usually present in thermal reservoirs; hence, the thermal reservoir was considered as an aquifer in this study to investigate the influence of groundwater. Thus, the geological conditions around the DBGHE were simplified into one aquifer layer and two aquifuge layers. The rocks and soil in the upper aquifuge layer, middle aquifer layer, and lower aquifuge layer were approximately considered as clay, sandstone, and limestone, respectively. The thickness of each stratum is shown in Figure 1. The parameters of the DBGHE and the thermal physical properties of materials in the model are presented in Table 1 and Table 2, respectively. According to the discussed groundwater velocities in references [37,38,39], the groundwater velocities were set as 1 × 10⁻⁸ m·s−1, 1 × 10⁻⁶ m·s−1, and 5 × 10⁻⁶ m·s−1 in the following discussions.
The heat transfer process through the DBGHE and ground consists of the heat transfer between the annular fluid and the central fluid, the heat transfer between the backfill and annular fluid, the thermal conduction in the backfill domain, and the conjugated conduction and convection in the rock-soil domain. In the cylindrical coordinate system, the governing equation of the rock-soil domain, considering the convective heat transfer caused by groundwater flow, is [43]
( ρ m c p , m T s ) t + 1 r r ( r ρ w c p , w u r T s ) + 1 r θ ( ρ w c p , w u θ T s ) = 1 r r ( λ m r T s r ) + 1 r θ ( λ m r T s θ ) + z ( λ m T s z )
The groundwater velocity (ux) is assumed to lie along the x direction. Thus, u r = u x c o s θ ; u θ = u x s i n θ in Equation (1) according to Figure 1. In the aquifer and aquifuge, ux is a constant value and zero, respectively.
The pure conduction in the backfill layer is governed by [43]
( ρ b c p , b T b ) t = 1 r r ( λ b r T b r ) + 1 r θ ( λ b r T b θ ) + z ( λ b T b z )
The annular fluid governing equation [18] is
( ρ w c p w S a T a ) t + ( ρ w c p w v a S a T a ) z = T c T a R c a + T b T a R a b
where S denotes the cross-sectional area. The subscripts a and c are annular fluid and central fluid, respectively. Here, Rca represents the thermal resistance used to calculate the heat transfer between the annular fluid and central fluid, which is expressed as
R c a = 1 h I , o r I , o Δ θ + 1 λ I Δ θ ln r I , o r I , i + 1 h I , i r I , i Δ θ
In addition, Rab denotes the thermal resistance used to calculate the heat transfer between the annular fluid and backfill and is expressed as
R a b = 1 h O , i r O , i Δ θ + 1 λ O Δ θ ln r O , o r O , i + 1 λ b Δ θ ln r O , o + r b 2 r O , o
The central fluid governing equation [18] is
( ρ w c p w S c T c ) t + ( ρ w c p w S c v c T c ) z = T a T c R c a
In Equations (4) and (5), h is the convective heat transfer coefficient calculated by the Gnielinski equation [10]. The subscripts i, o, I, and O are the inner surface, outer surface, inner pipe, and outer pipe, respectively.
The boundary conditions of the DBGHE inlet are
Tc (z = 0, t) = Tin (t); vc (z = 0, t) = vin
where Tin (t) denotes the inlet temperature, which can be a constant value that does not vary with time or can be calculated by the heating power (Q) as
T i n ( t ) = T o u t ( t ) Q m ˙ c p w
where m ˙ denotes the mass flow rate.
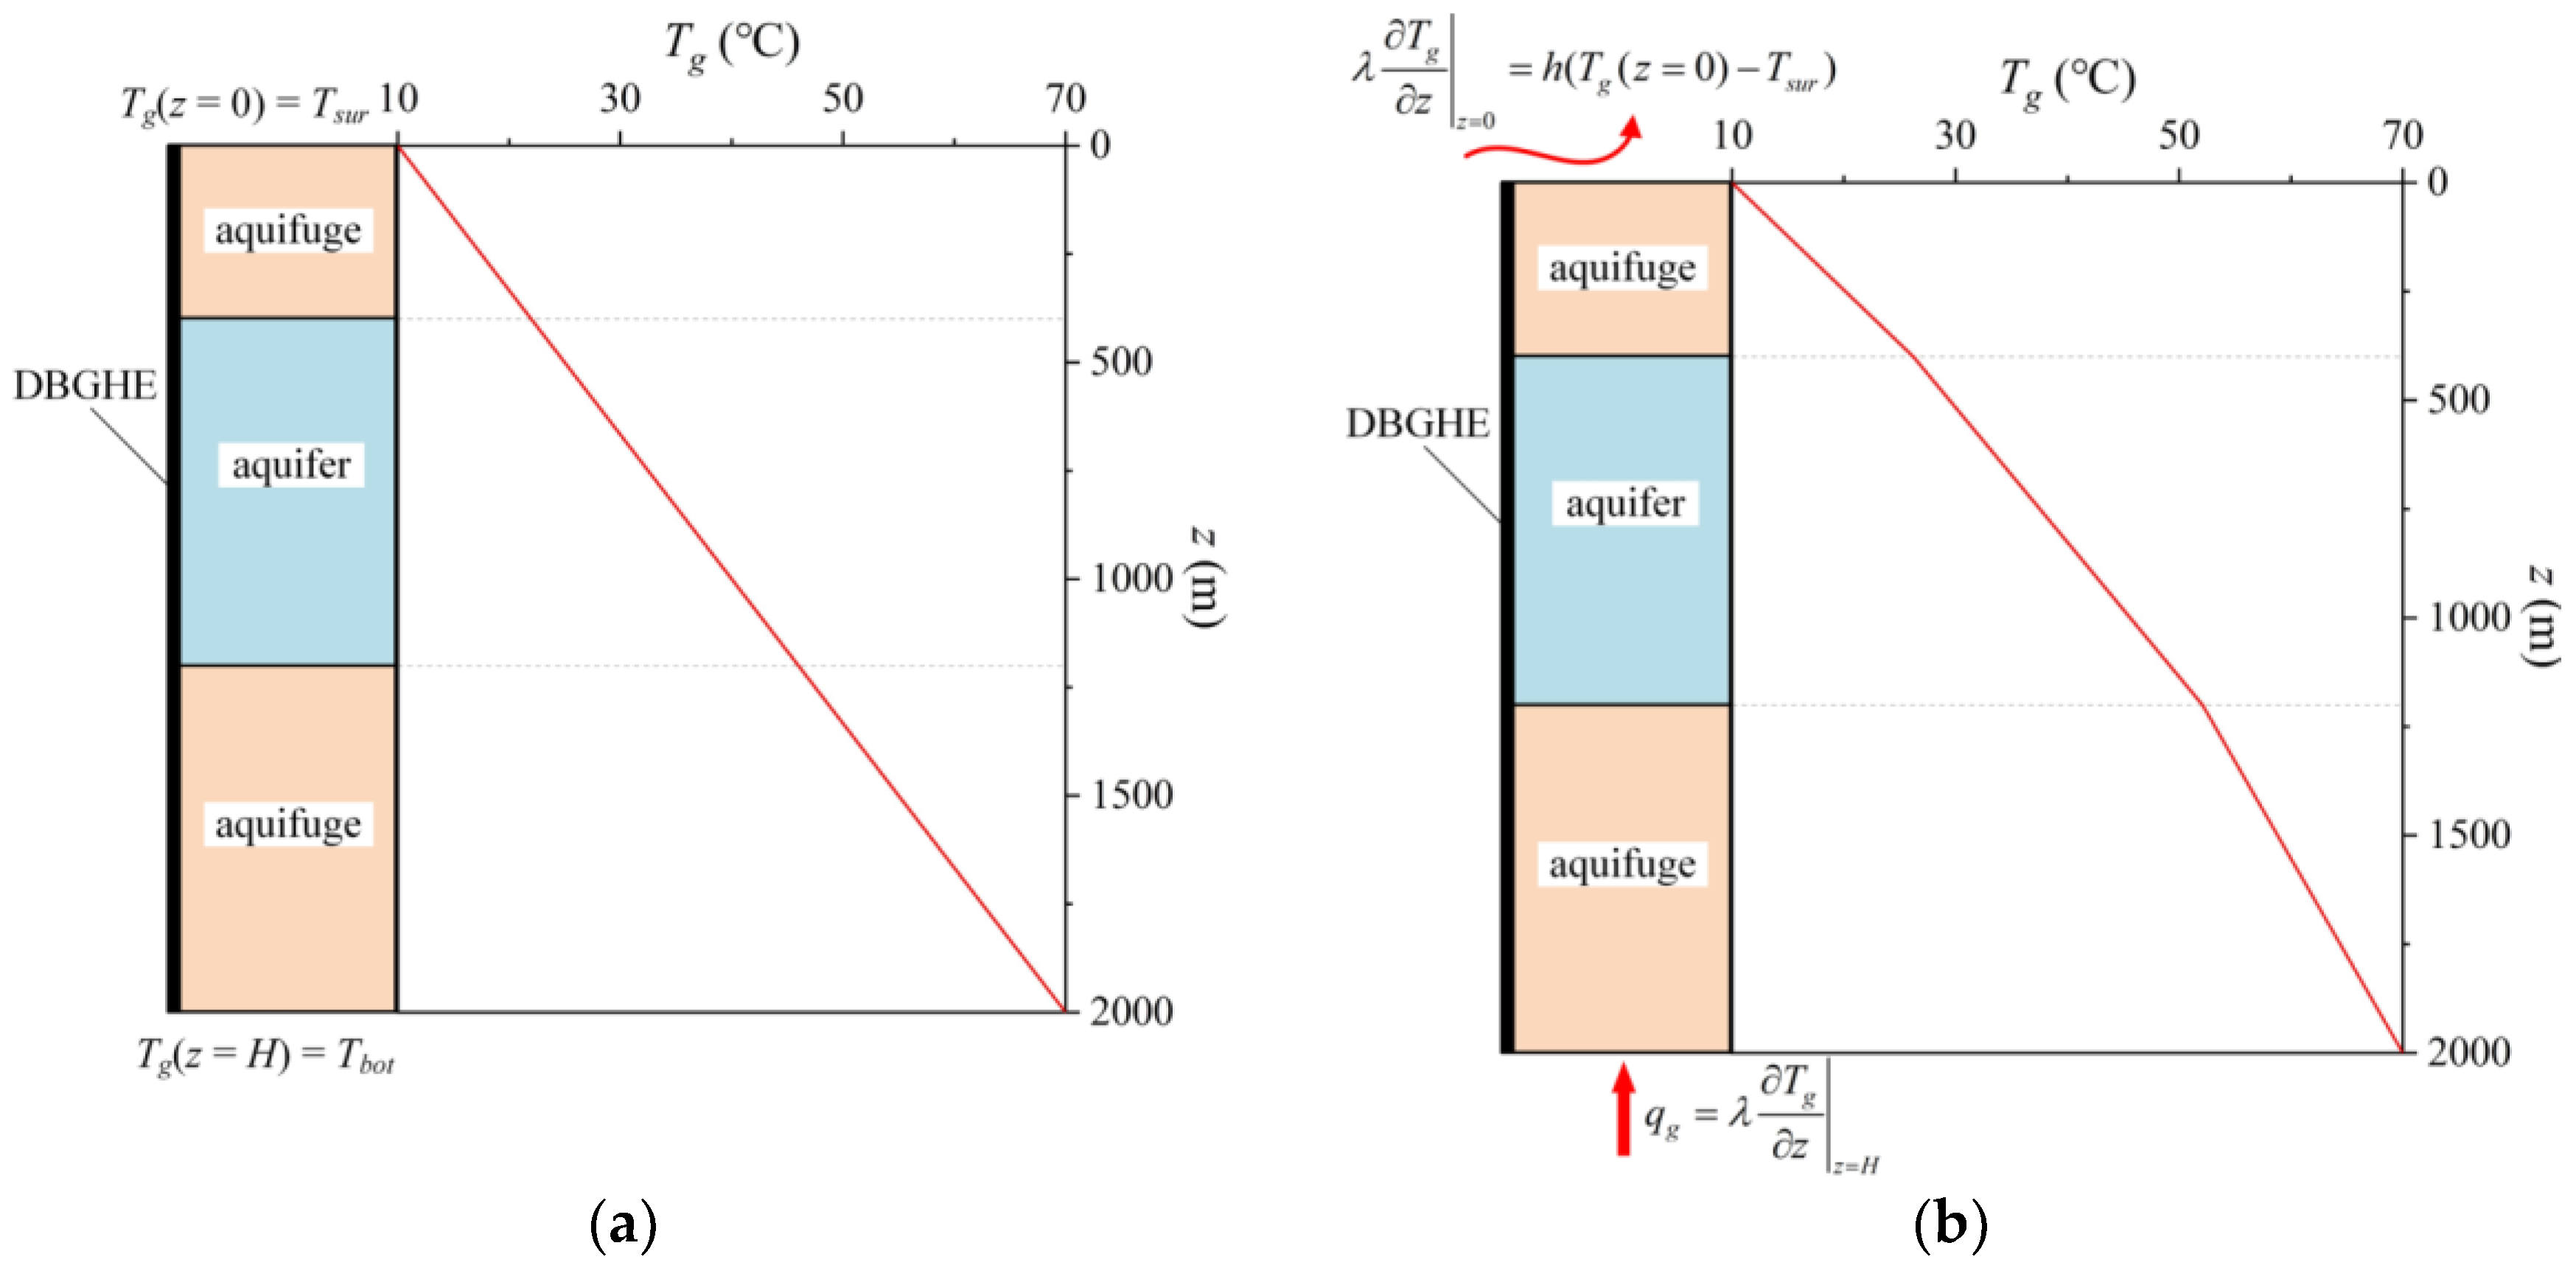
Two kinds of thermal boundary conditions are often used in rocks and soil as shown in Figure 2. The first kind of thermal boundary condition is
Tg (z = 0) = Tsur, Tg (z = H) = Tsur + GG × H, Tg (r = rs, z) = Tsur + GG × z
where Tsur is the rock-soil surface temperature and GG is the geothermal gradient.
The second kind of temperature boundary condition is
λ T g z z = 0 = h ( T g ( z = 0 ) T s u r ) , λ T g z z = H = q g
T g ( r = r s , z 0 , H 1 ) = T s u r + q g h + q g λ s , 1 z T g ( r = r s , z H 1 , H 2 ) = T g ( r = r s , z = H 1 ) + q g λ s , 2 ( z H 1 ) T g ( r = r s , z H 2 , H ) = T g ( r = r s , z = H 2 ) + q g λ s , 3 ( z H 2 )
where H1 and H2 denote the depths of the first and second soil layers, respectively, and qg is the terrestrial heat flow.
The initial rock-soil temperatures are the same as the far-field rock-soil temperatures in Equations (9) and (10). The finite volume method (FVM) was used to spatially discretize the above governing equations in the cylindrical coordinate system. The numbers of nodes in the θ, r, and z directions are nθ, nr, and nz, respectively. The time term of the governing equations was discretized by an implicit scheme. The general discretized equation of the node (i, j, k) is
a e T i + 1 , j , k ( t ) + a w T i 1 , j , k ( t ) + a a T i , j + 1 , k ( t ) + a b T i , j 1 , k ( t ) + a n T i , j , k 1 ( t ) + a s T i , j , k + 1 ( t ) + 1 Δ t T i , j , k ( t 1 ) ( a p + 1 Δ t ) T i , j , k ( t ) = 0
where Δt is the time step. The coefficient ap is
a p = a e + a w + a a + a b + a n + a s
where ae, aw, aa, ab, an, as are the coefficients of the adjacent nodes.
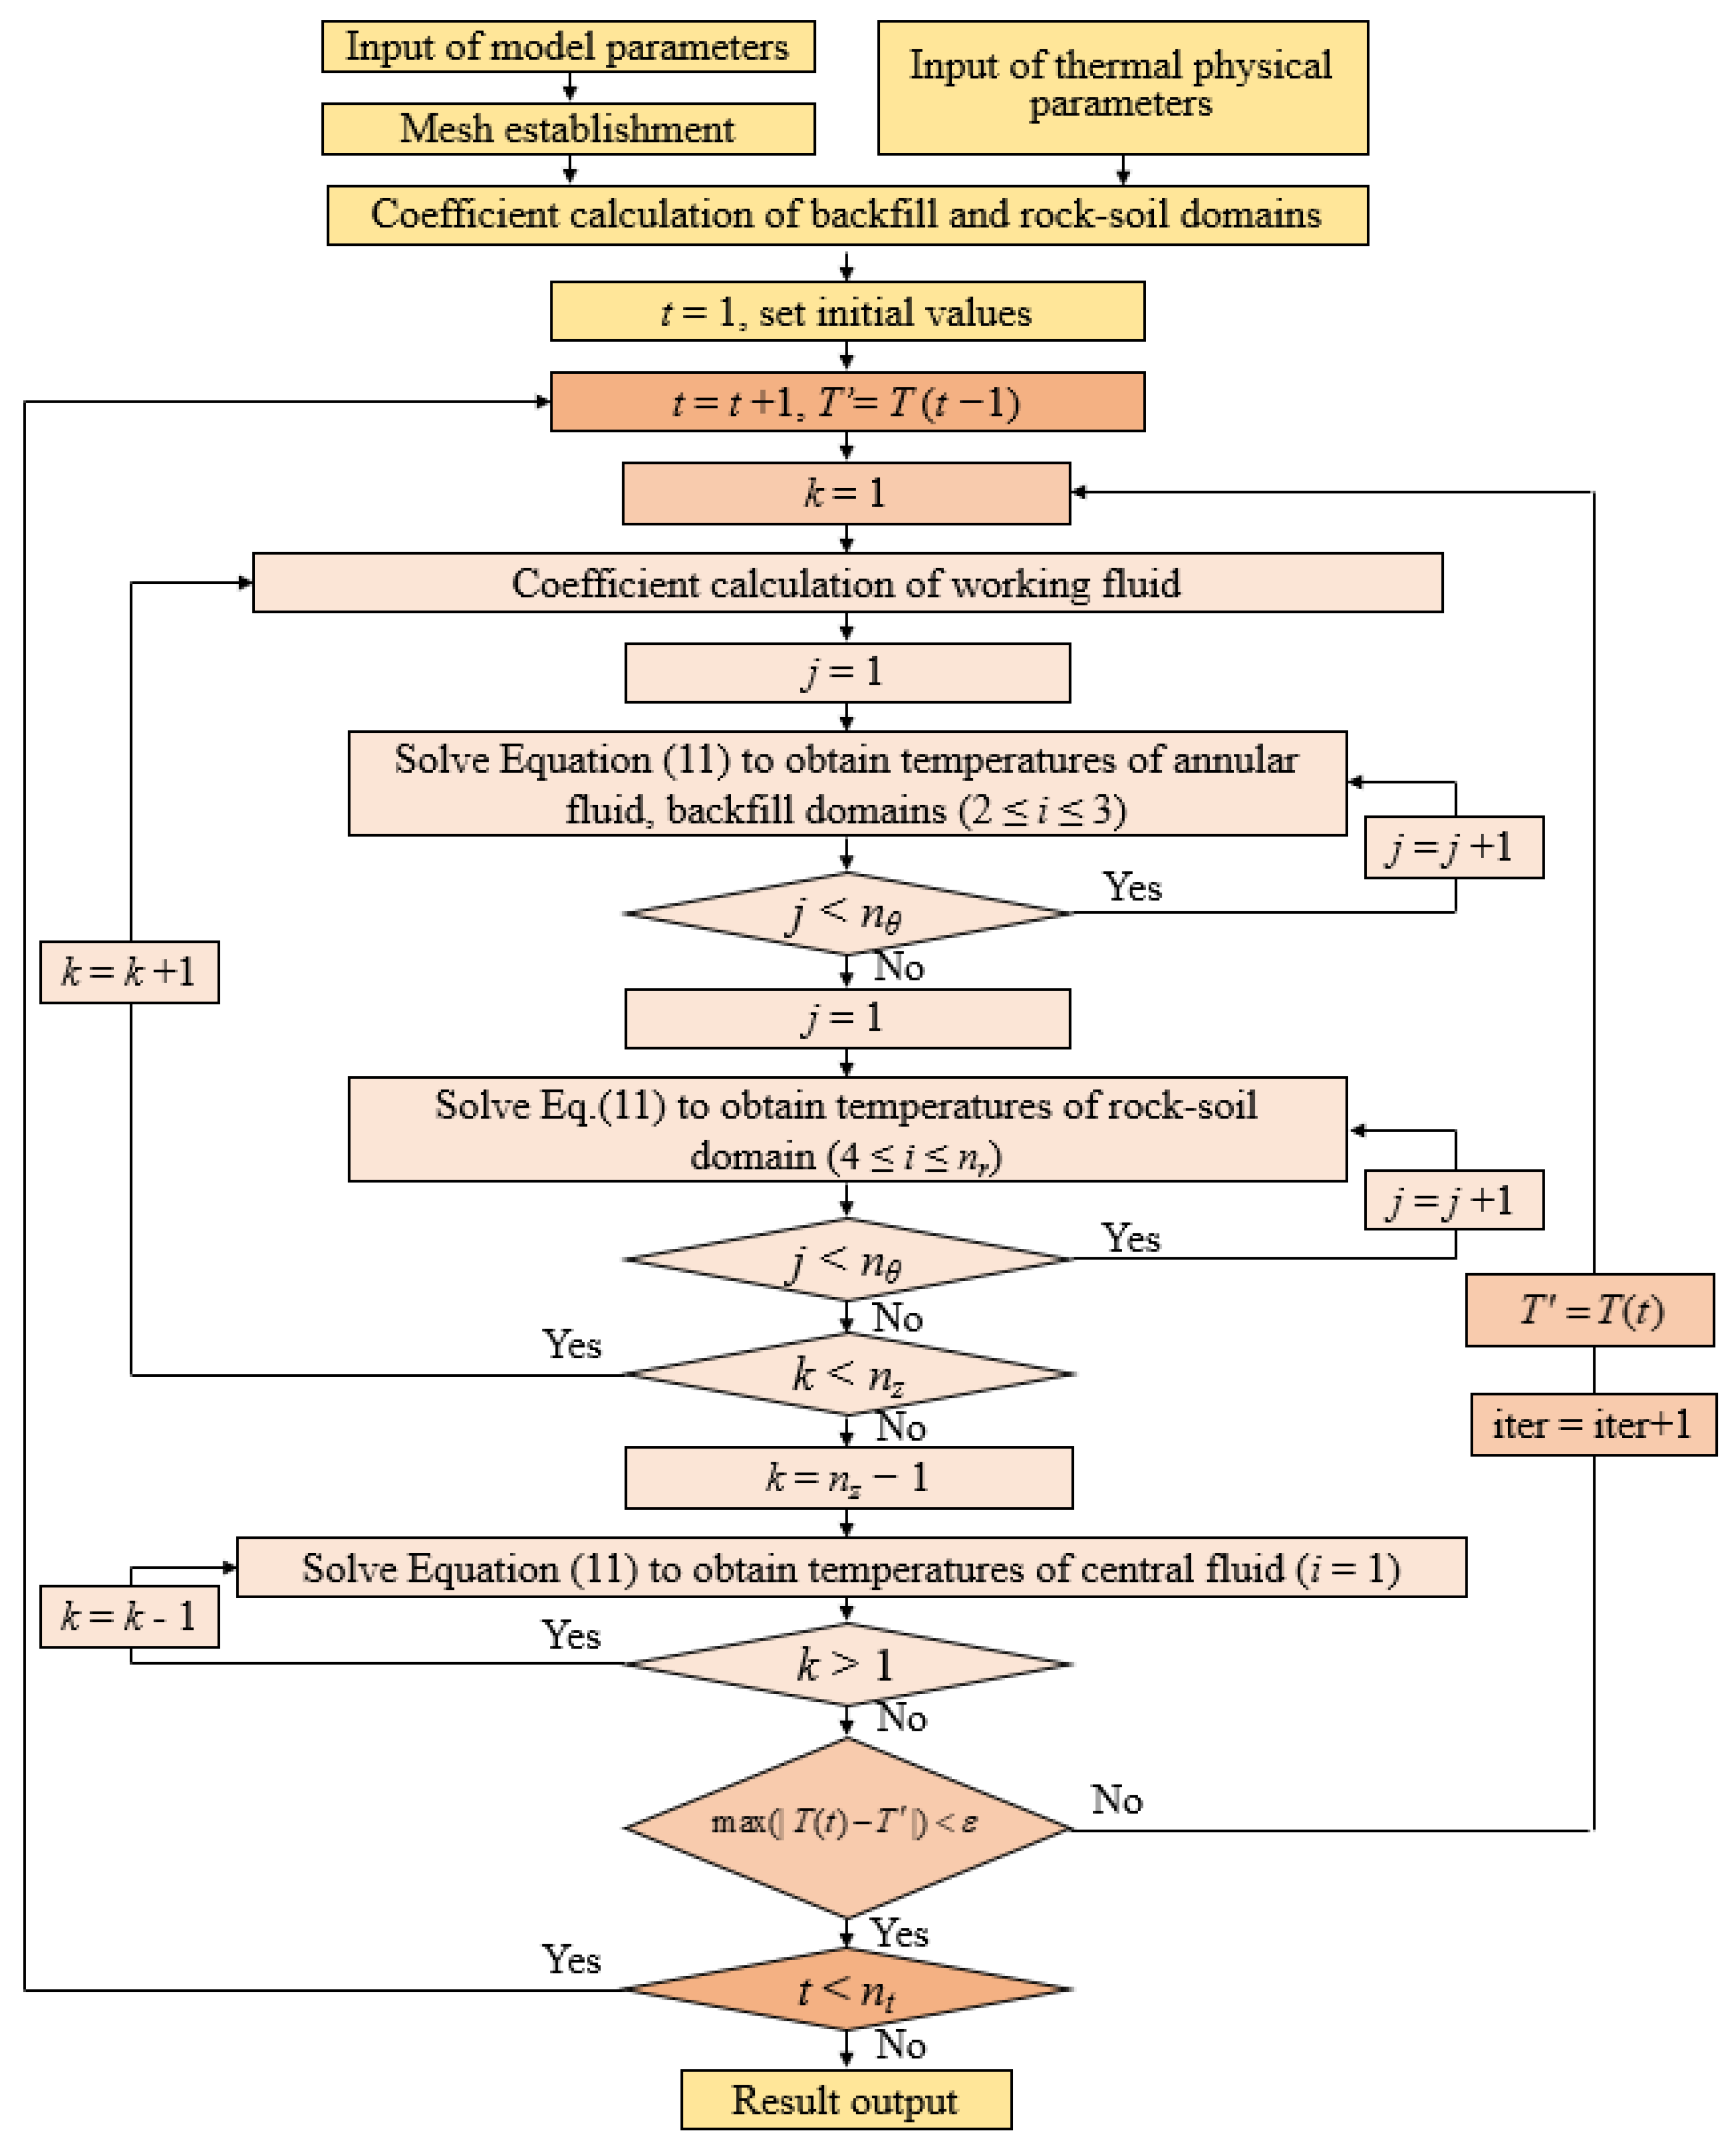
The block iterative method was used to solve the discretized equations. To ensure the convergence of the calculation, for one iteration, the equations of the nodes in the annular fluid and backfill domains (2 ≤ i ≤ 3) were solved first. Then, the temperatures of the nodes in the rock-soil domain (4 ≤ inr) were obtained. Finally, the nodes of the inner fluid (i = 1) were solved. The detailed procedures are shown in Figure 3.

2.2. Validation

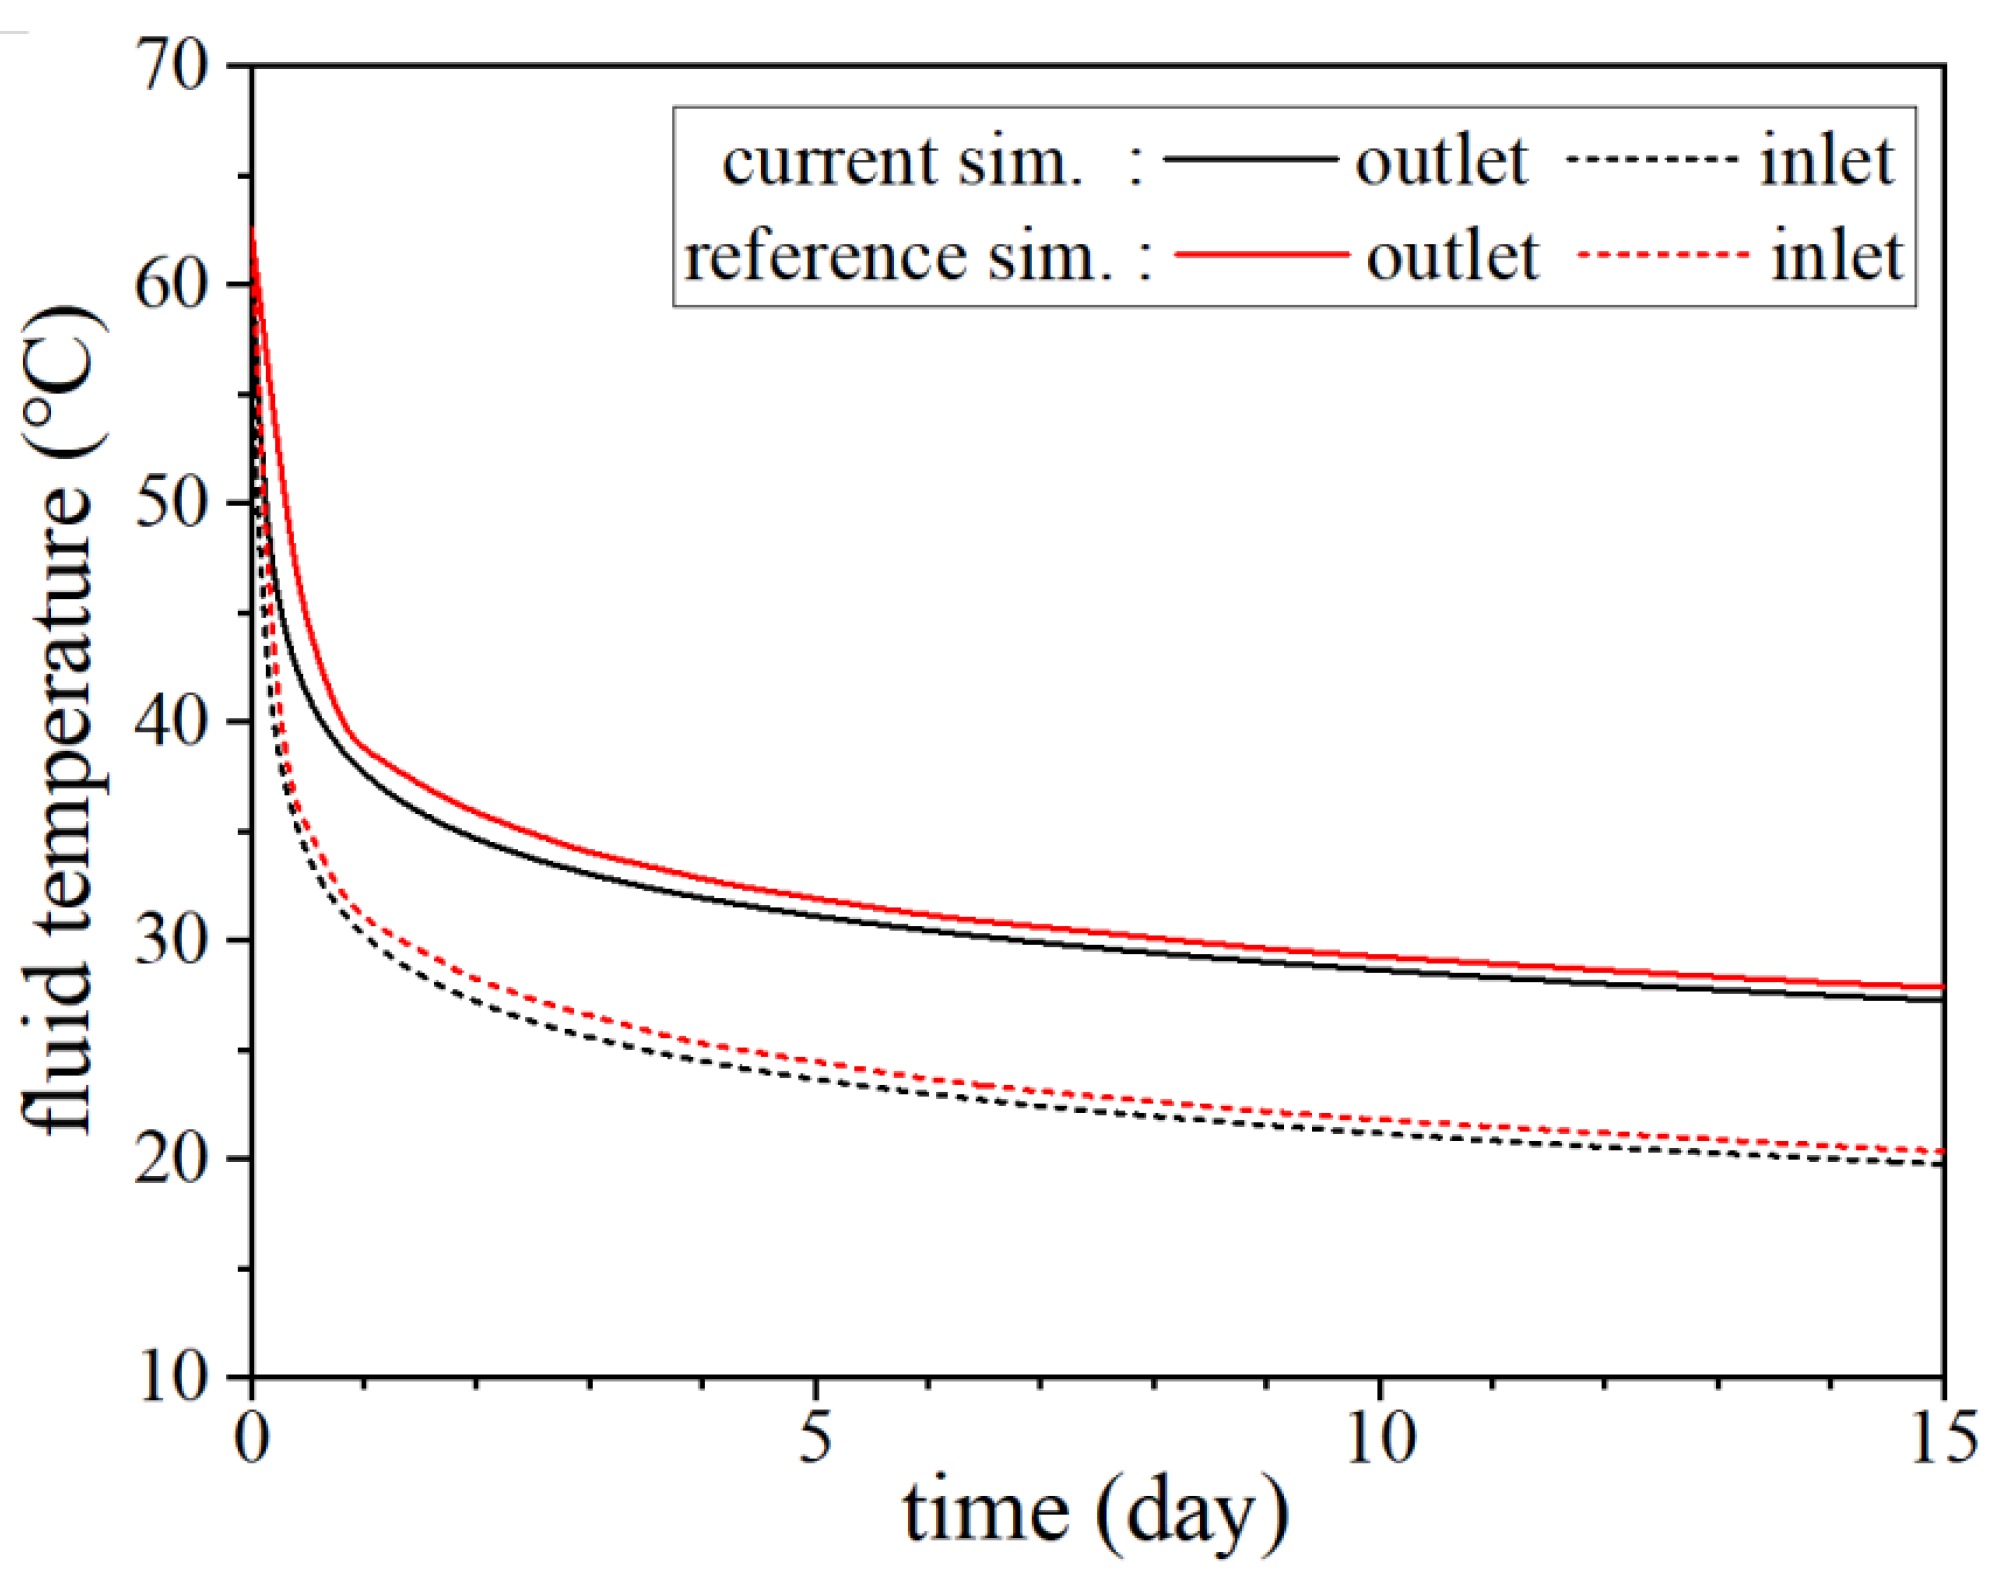
The DBGHE model with an aquifer layer of ux = 0.364 m∙d−1 in reference [39] was simulated using the method in this paper for validation. The depth of the DBGHE was 2600 m. The heating power remained constant at 260 kW. The flow rate was 30 m3∙h−1. Figure 4 compares the inlet and outlet temperatures in the simulation and reference [39]. It can be seen from the figure that the outlet and inlet temperatures of the proposed model are in good agreement with those in reference [39], which illustrates the accuracy of the proposed DBGHE model.

2.3. Mesh Independence Test

The simulation accuracy can be affected by the mesh of the numerical calculation model of DBGHE. The mesh amounts were set as 3.7312 × 10⁶, 6.66 × 10⁶, and 1.0656 × 10⁷ to simulate the established DBGHE heat transfer model. Figure 5 shows the outlet temperatures on the 10th day, 20th day, and 30th day. The results show that the outlet temperature changes insignificantly when the mesh amount increases from 6.66 × 10⁶ to 1.0656 × 10⁷. Thus, the mesh amount was set as 6.66 × 10⁶ in the following investigations.

3. Results and Discussion

3.1. Effects of Inlet Temperature Conditions of DBGHE

The inlet temperature is an important parameter that can have an impact on the heat transfer process between the DBGHE and the rocks and soil. In some simulations of DBGHEs, the inlet temperature was considered to be a constant value during the operation. Some scholars considered the heating power to be a constant value that results in the variation of inlet temperature with operating time. Thus, the DBGHEs at a constant inlet temperature of 15 °C and a constant heating power of 200 kW were simulated and compared for 120 days during a heating season in most areas of northern China [44]. The boundary conditions and groundwater velocities of the cases discussed in this section are listed in Table 3.

3.1.1. Outlet Temperatures and Heat Extraction Amount

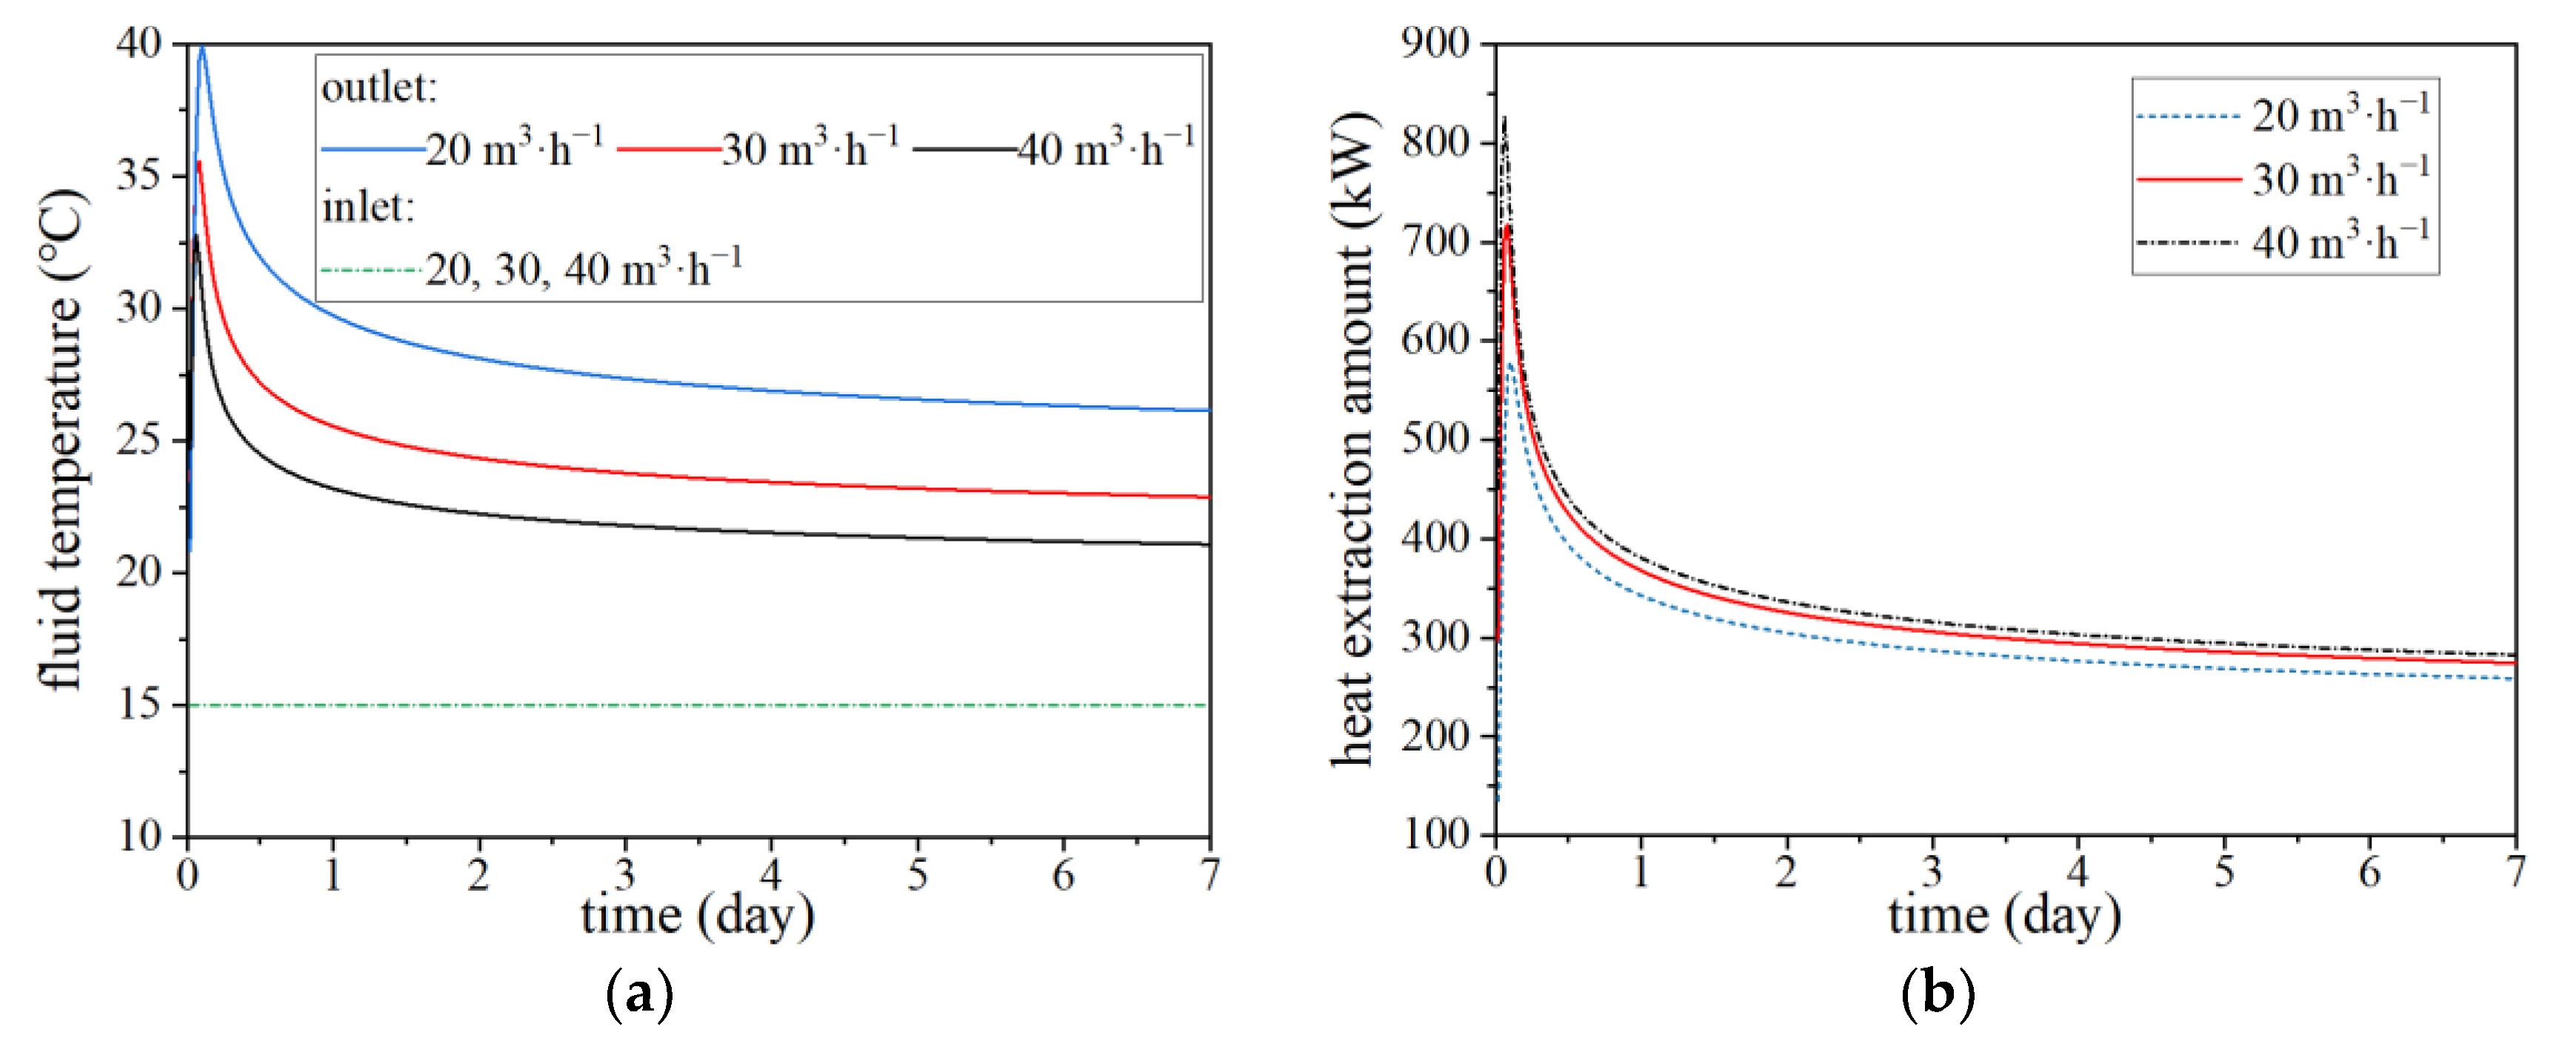
The DBGHE performance is relevant to the flow rate. The outlet temperatures and heat extraction amount under different volumetric flow rates are compared to choose an appropriate flow rate for the following investigation. As shown in Figure 6, the outlet temperature decreases and the heat extraction amount increases more slowly when the flow rate increases from 20 m3·h−1 to 40 m3·h−1 under a constant inlet temperature. In terms of the constant heating power, it can be seen from Figure 7 that the decrease in the outlet temperature and the growth of the inlet temperature also slow down with the increase of the flow rate. The increase of the flow rate would result in the increase of the pressure drop. Thus, the effects of the boundary conditions were investigated at a moderate flow rate of 30 m3·h−1.
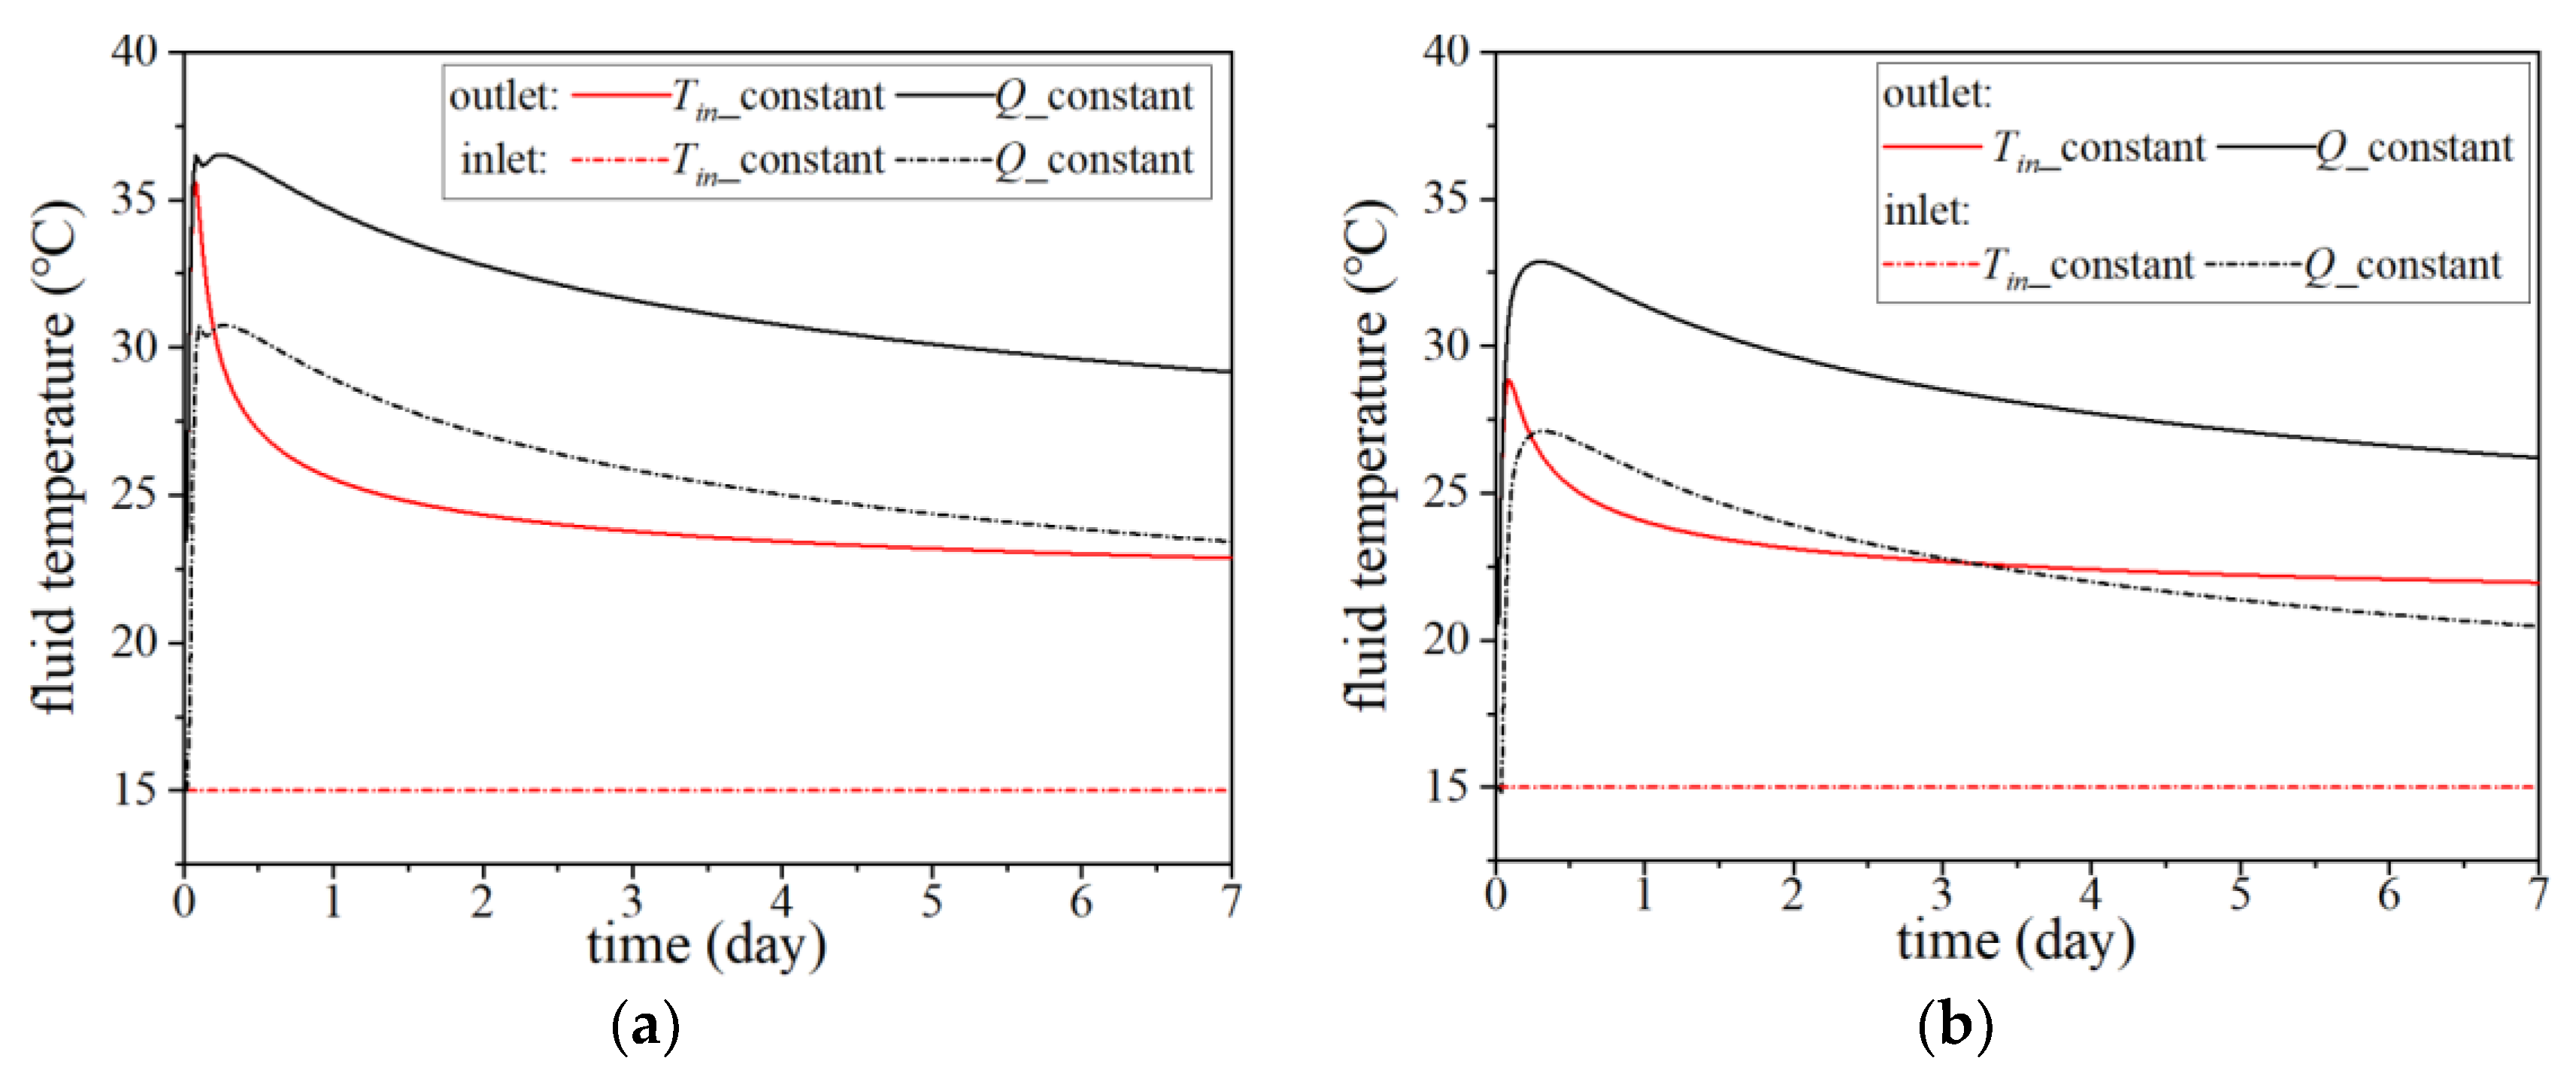
The thermal conductivity of the inner pipe can also affect the heat extraction of DBGHE. Figure 8 shows the outlet and inlet temperatures during a short period of 7 days with a higher inner pipe thermal conductivity of 0.45 W·m−1·K−1 and a lower value of 0.025 W·m−1·K−1. It can be seen from the figure that outlet temperatures reach maximum values quickly under the two conditions and then decrease with the extension of the DBGHE operation time. Under both thermal conductivities, the outlet temperatures at a constant inlet temperature are lower than those at a constant heating power. Moreover, the outlet temperatures with a thermal conductivity of 0.025 W·m−1·K−1 are higher than those with a thermal conductivity of 0.45 W·m−1·K−1. The above comparison indicates that an insulation inner pipe helps to reduce thermal short circuiting and increase the DBGHE heat extraction amount. Considering that the inner pipe with a lower thermal conductivity would be widely applied in the near future, the thermal conductivity of 0.025 W·m−1·K−1 is selected for ffurther investigating the inlet boundary conditions.
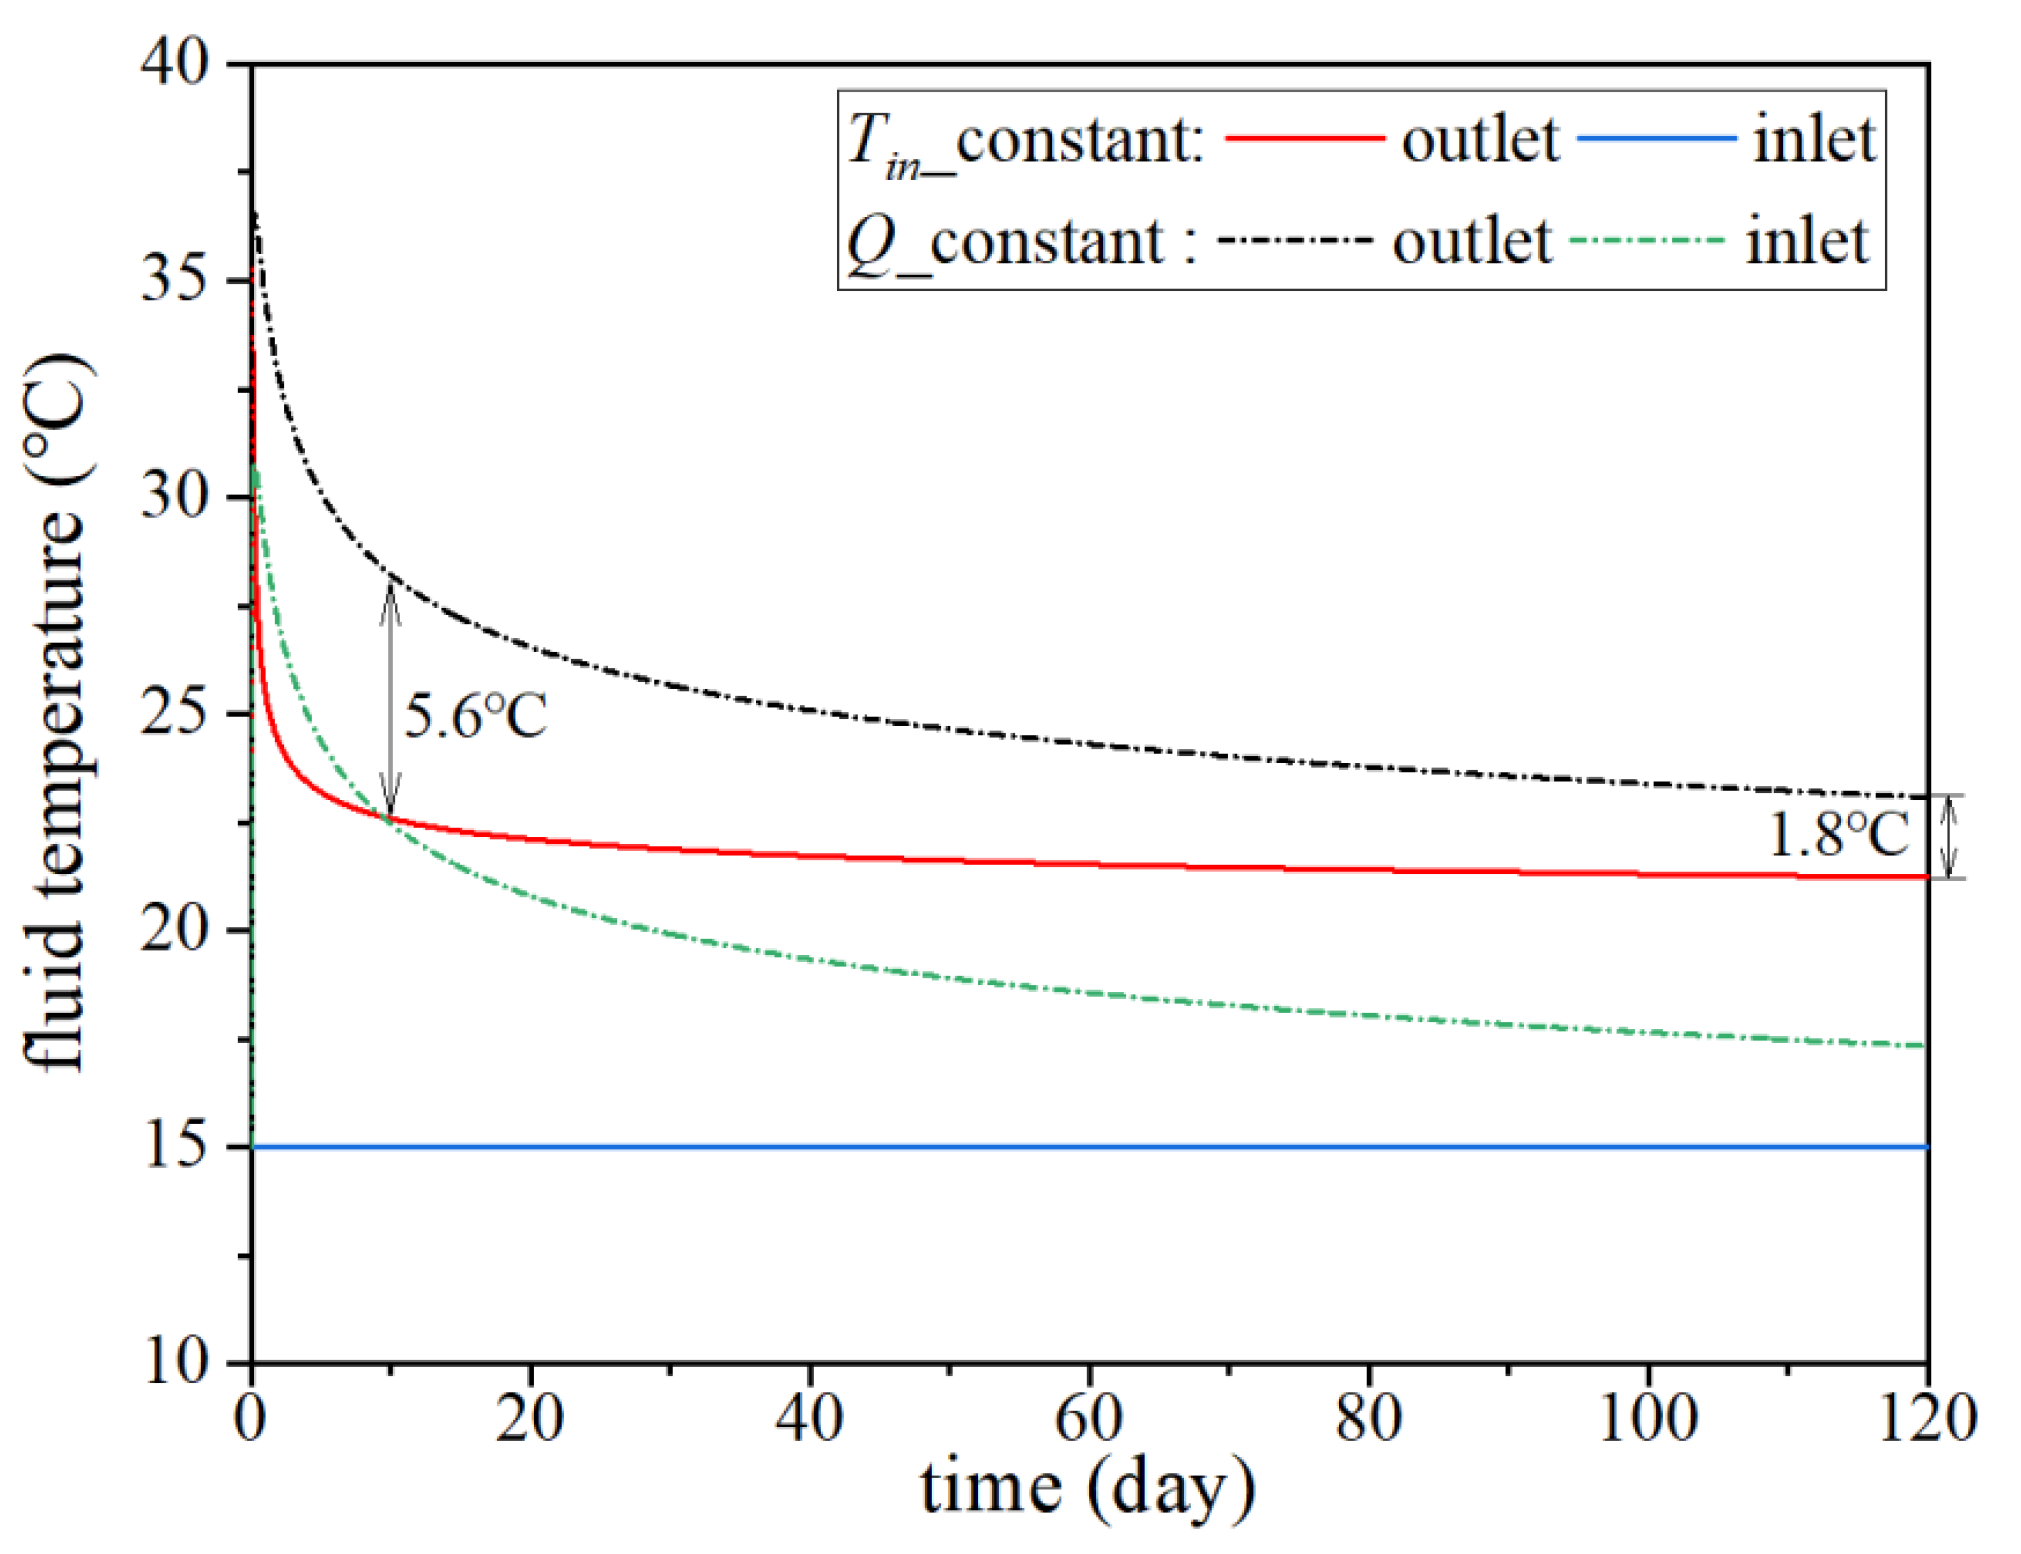
The outlet temperatures at a constant inlet temperature and a constant heating power for 120 days during a heating season are further shown in Figure 9. It can be seen from the figure that, at a constant heating power, the outlet temperatures are 5.6 °C and 1.8 °C higher than those at a constant inlet temperature on the 10th and 120th day, respectively. The differences in outlet temperature caused by the two inlet boundaries decrease with DBGHE operation.
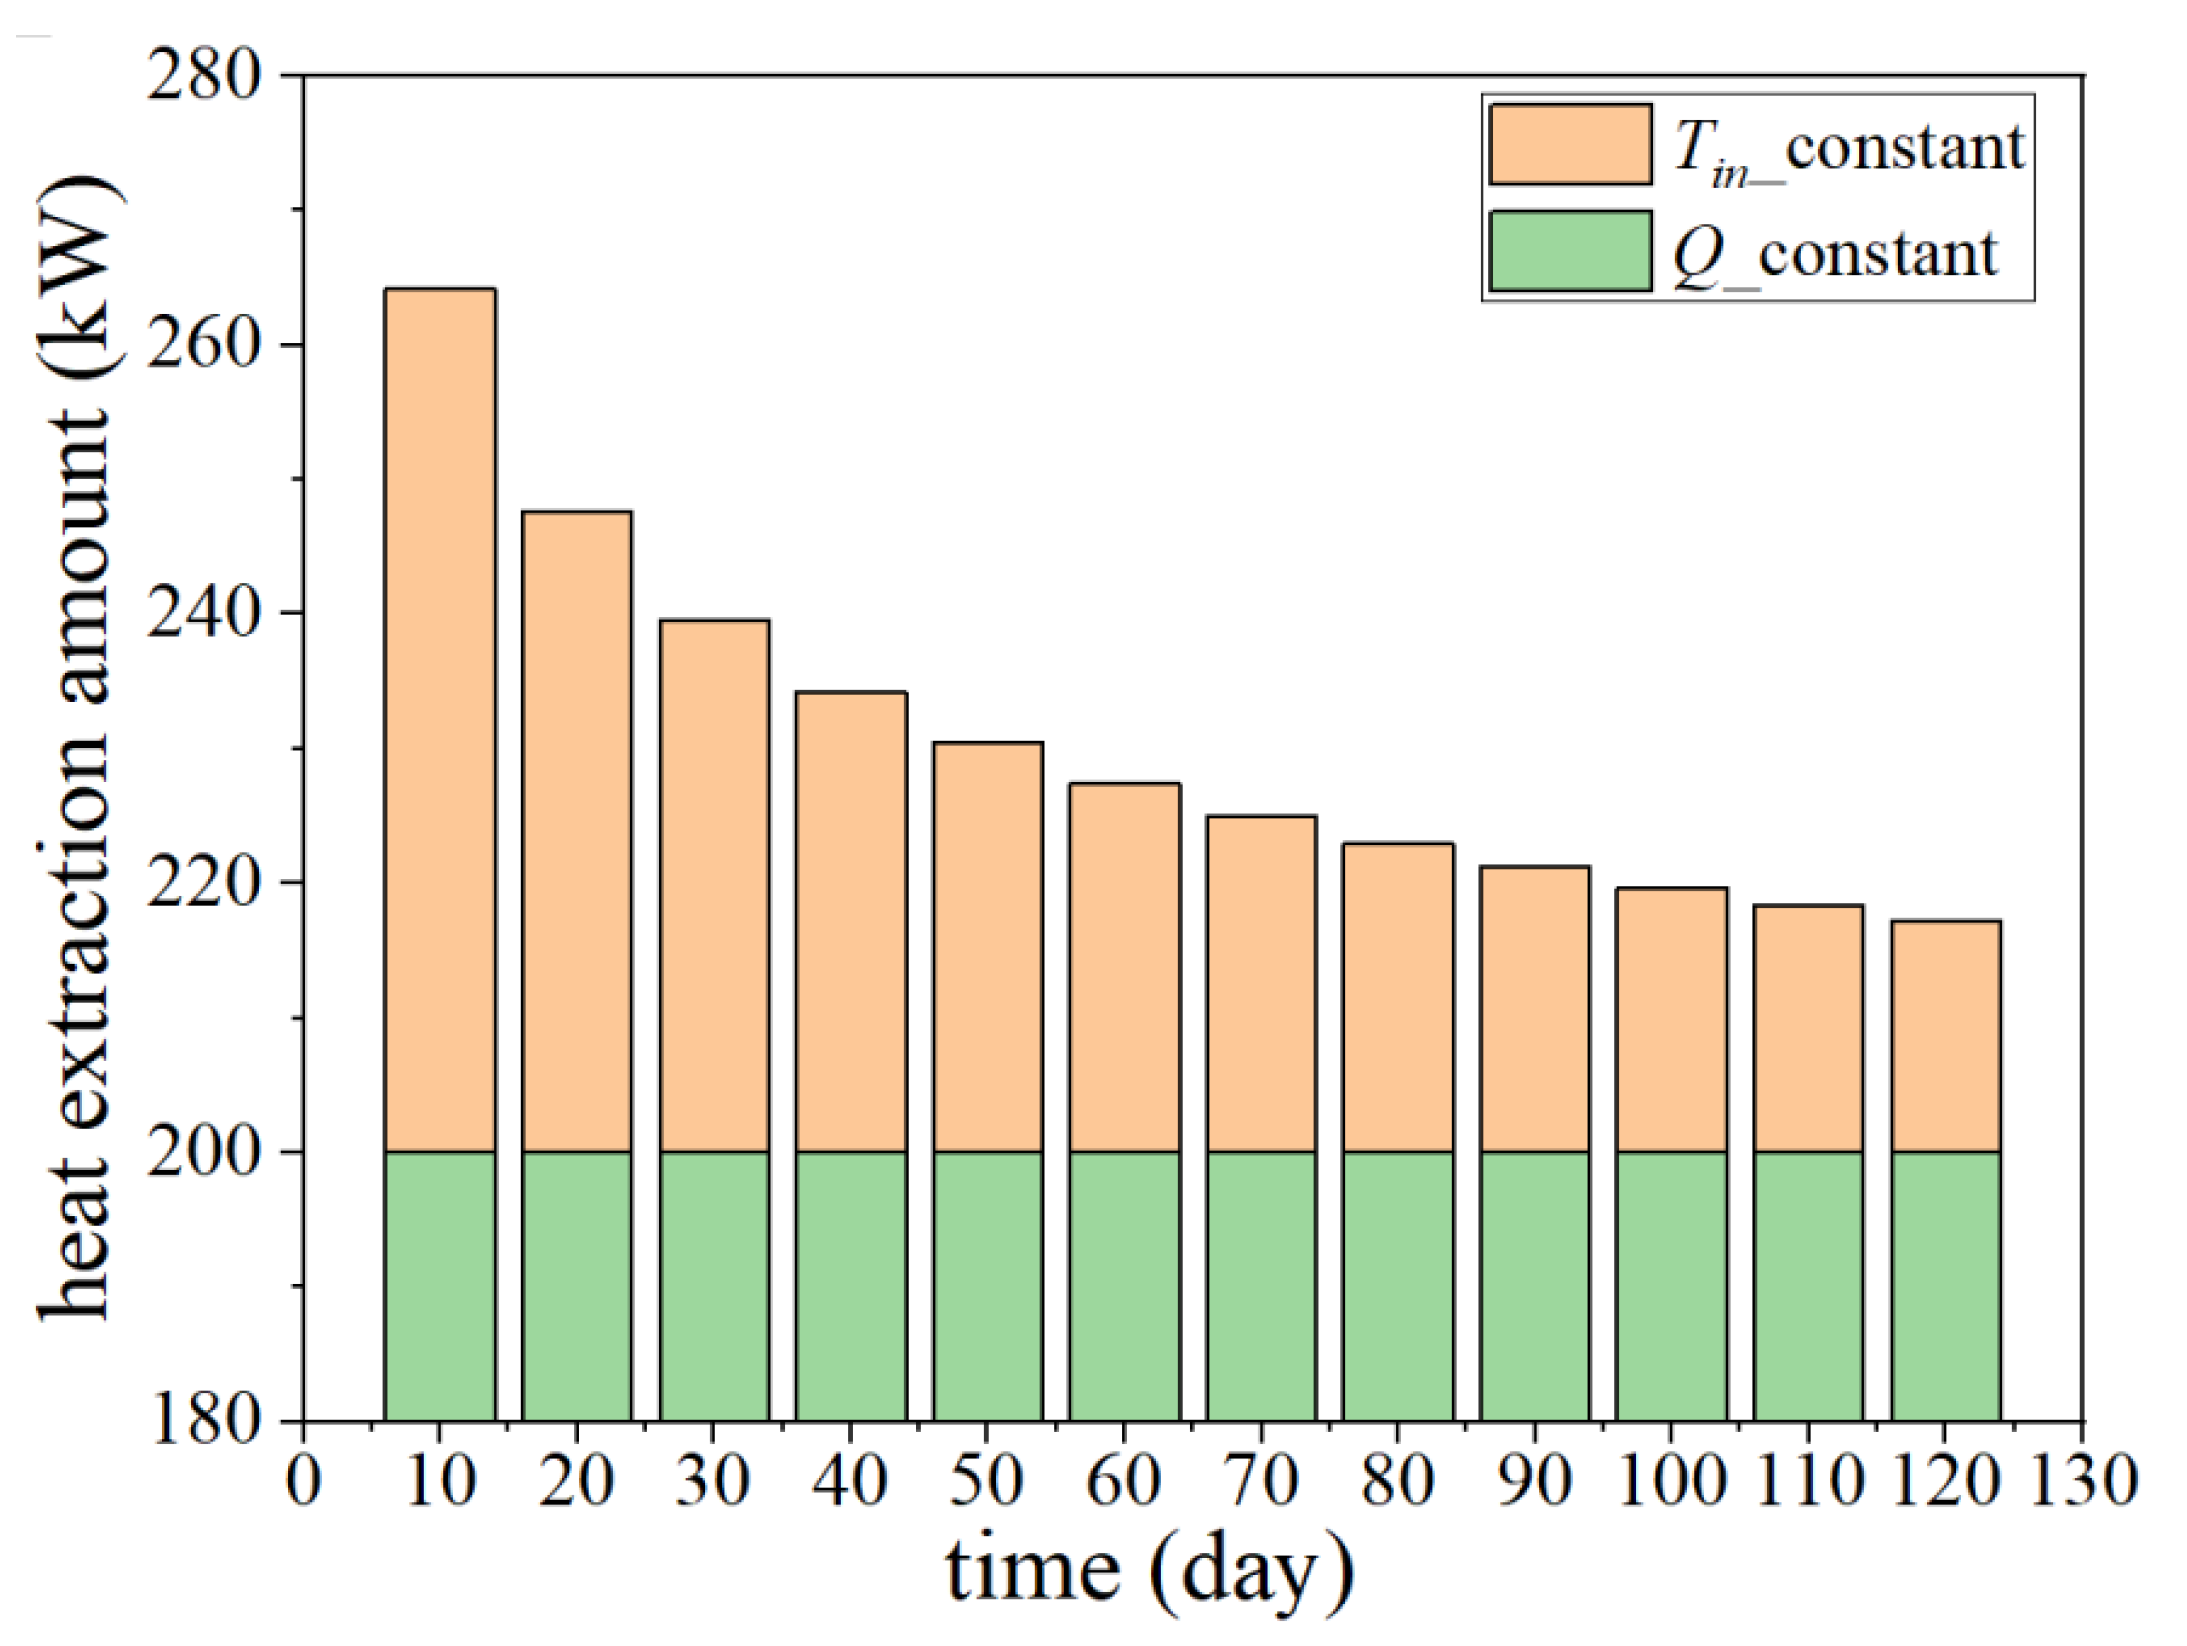
Compared to the constant heating power during the operation, the heat extraction amount of DBGHE under the constant inlet temperature varies over the operating time as shown in Figure 10. The heat extraction amounts at the constant inlet temperature are 64 kW and 39 kW higher than the constant heating power of 200 kW on the 10th day and 30th day, respectively; that is, the relative differences of the heat extraction amount between the two cases on the 10th day and 30th day are 32% and 19.5%, respectively. As the operation of DBGHE continues, the heat extraction amount decreases to 217 kW on the 120th day, which is only 8.4% higher than that at the constant heating power.
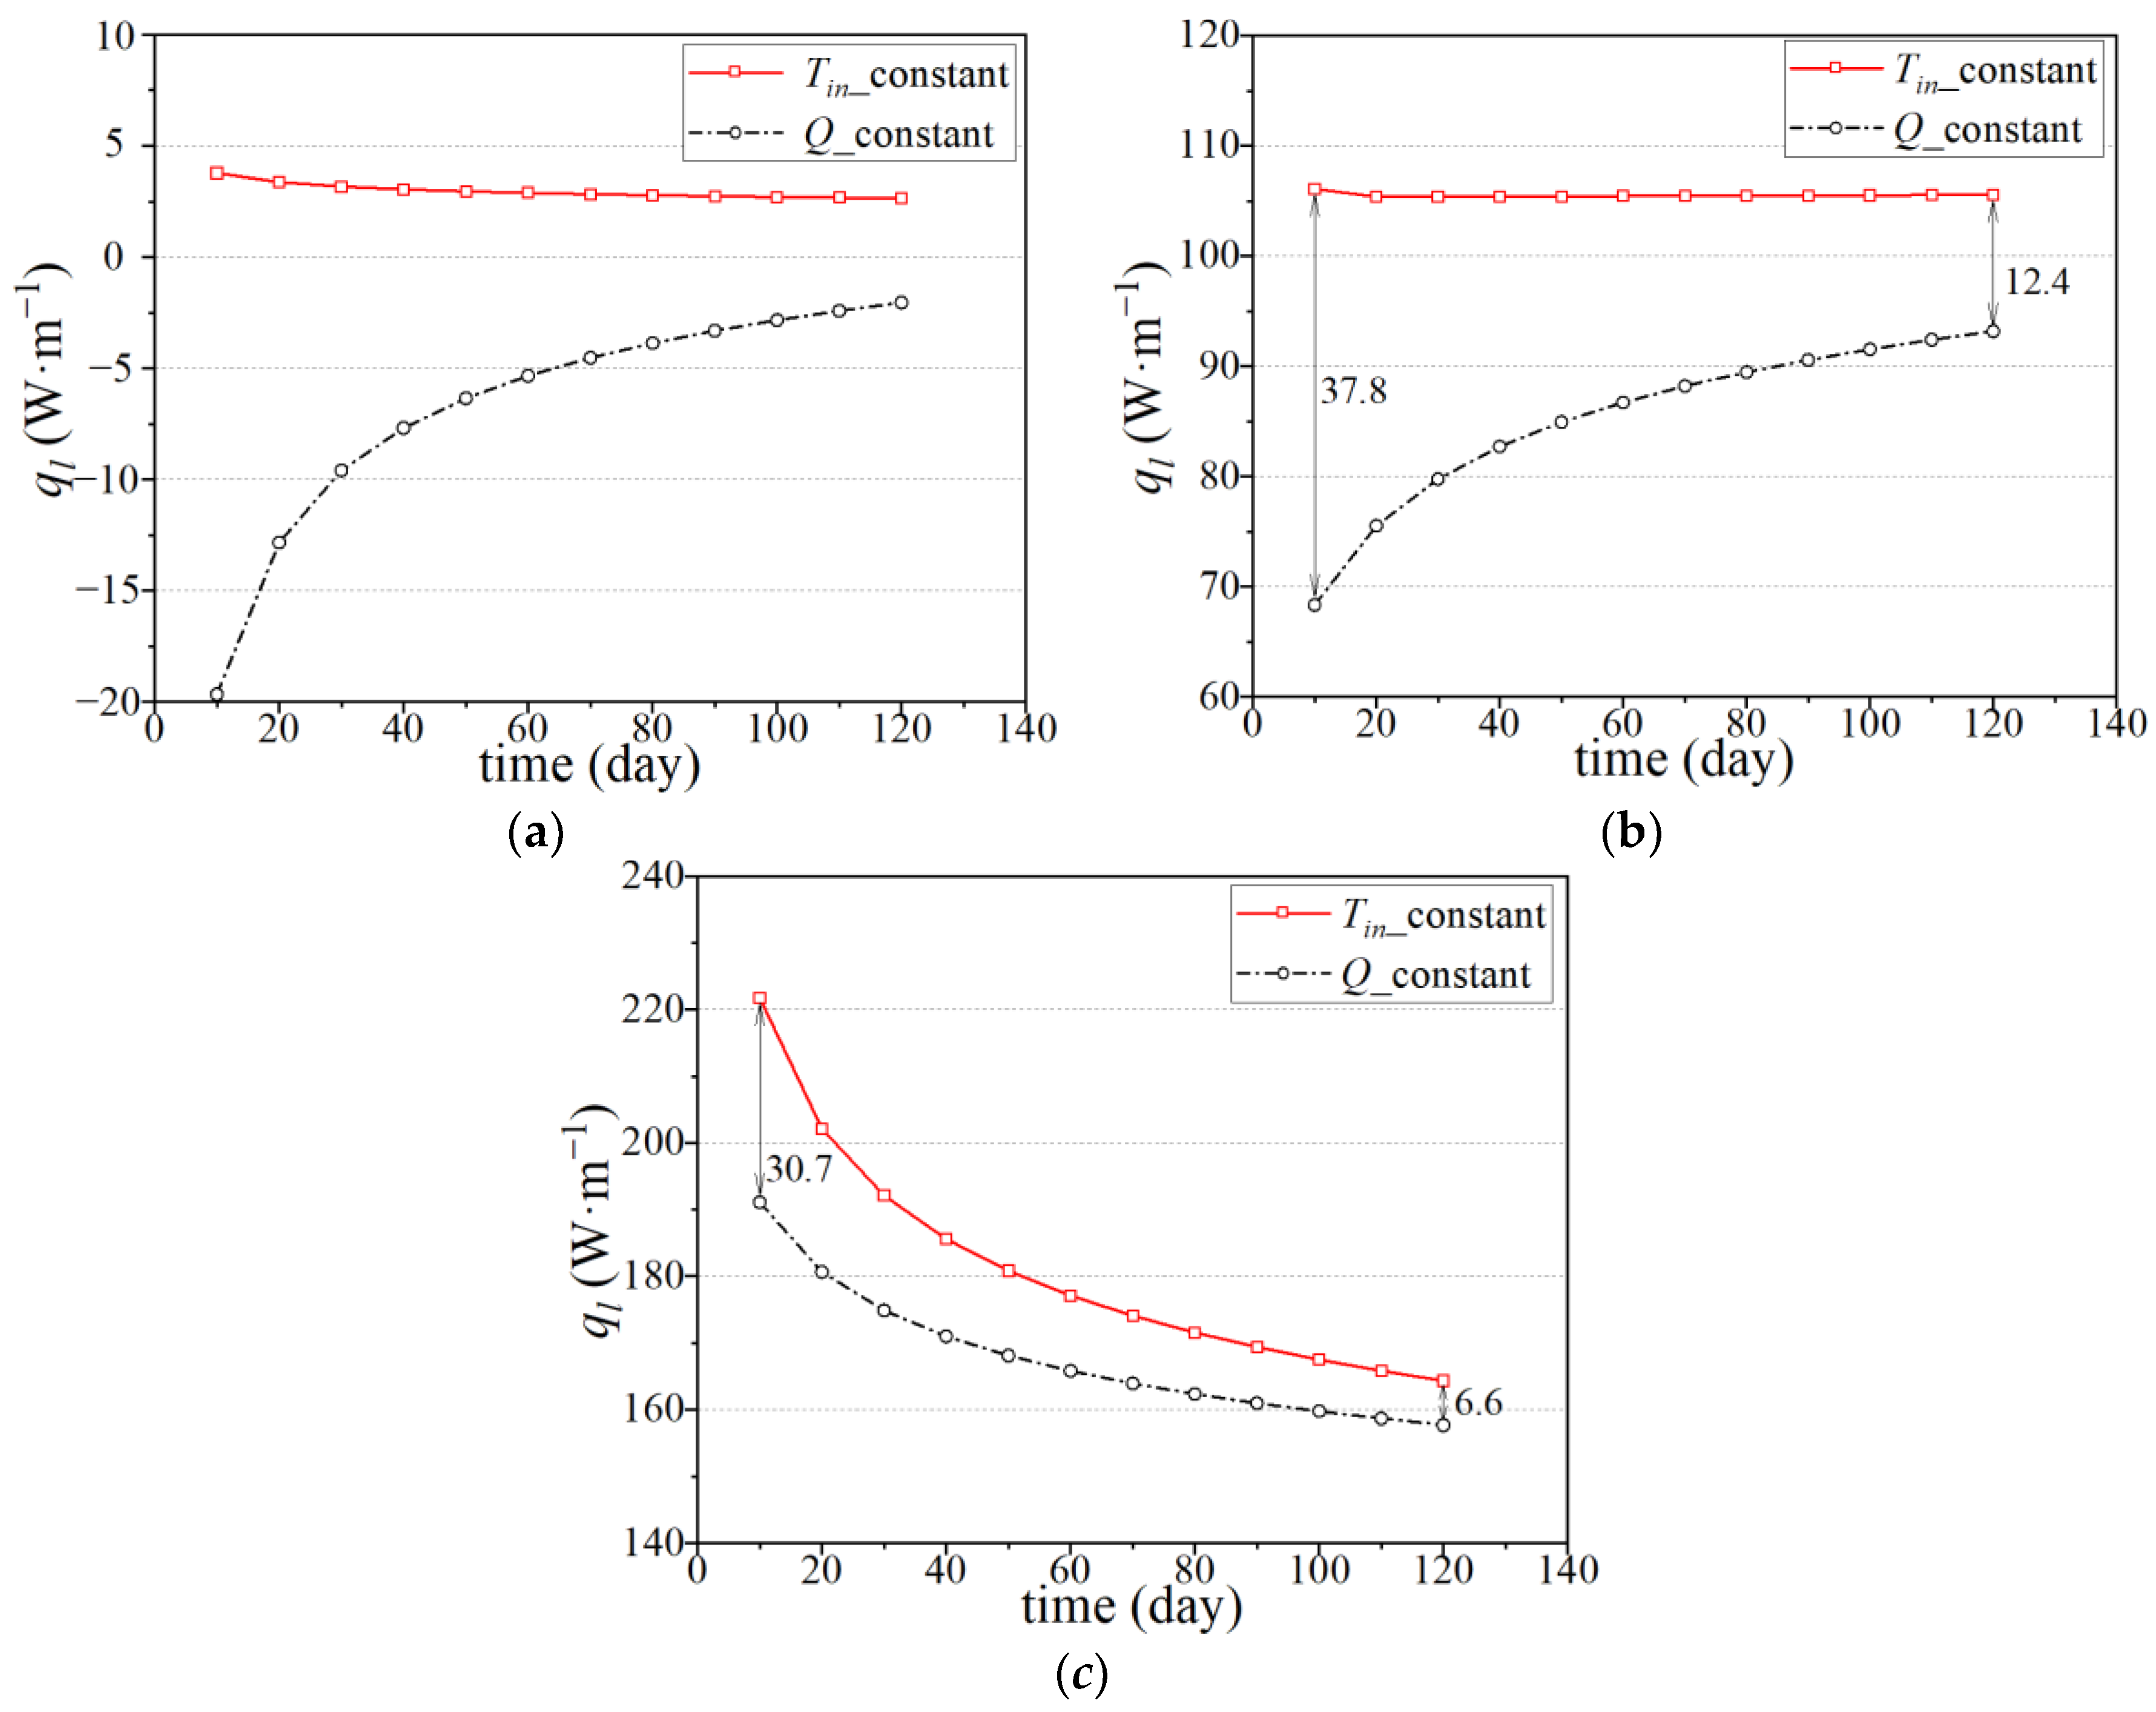
To further analyze the different effects caused by inlet boundary conditions, the heat exchange amounts per meter of DBGHE for different geological layers are presented in Figure 11. The heat exchange amount per meter in the upper aquifuge layer decreases slightly over time under a constant inlet temperature, whereas at a constant heating power, the heat exchange amount per meter is less than zero, suggesting heat loss from the DBGHE to the soil. The heat loss of the upper aquifuge layer decreases when the DBGHE operation resumes. In the middle aquifer layer, the heat exchange amount per meter of DBGHE increases over time at a constant heating power but does not change at a constant inlet temperature. The heat exchange amount per meter is 37.8 W·m−1 larger than that at a constant heating power on the 10th day. The difference in the heat exchange amount per meter caused by the two inlet boundaries decreases to 12.4 W·m−1 on the 120th day. In the lower aquifuge layer, the difference in the heat exchange amount per meter caused by the two cases decreases from 30.7 W·m−1 to 6.6 W·m−1 with the extension of operating time. The results illustrate that the differences in the heat exchange amounts of DBGHE caused by two inlet boundary conditions are closely related to the operation time of DBGHE. The differences in the heat extracted amount resulting from the two inlet boundaries are relatively larger when the operation time of DBGHE is short. The differences between the two cases are gradually reduced with the increase in operating time.

3.1.2. Borehole Temperature

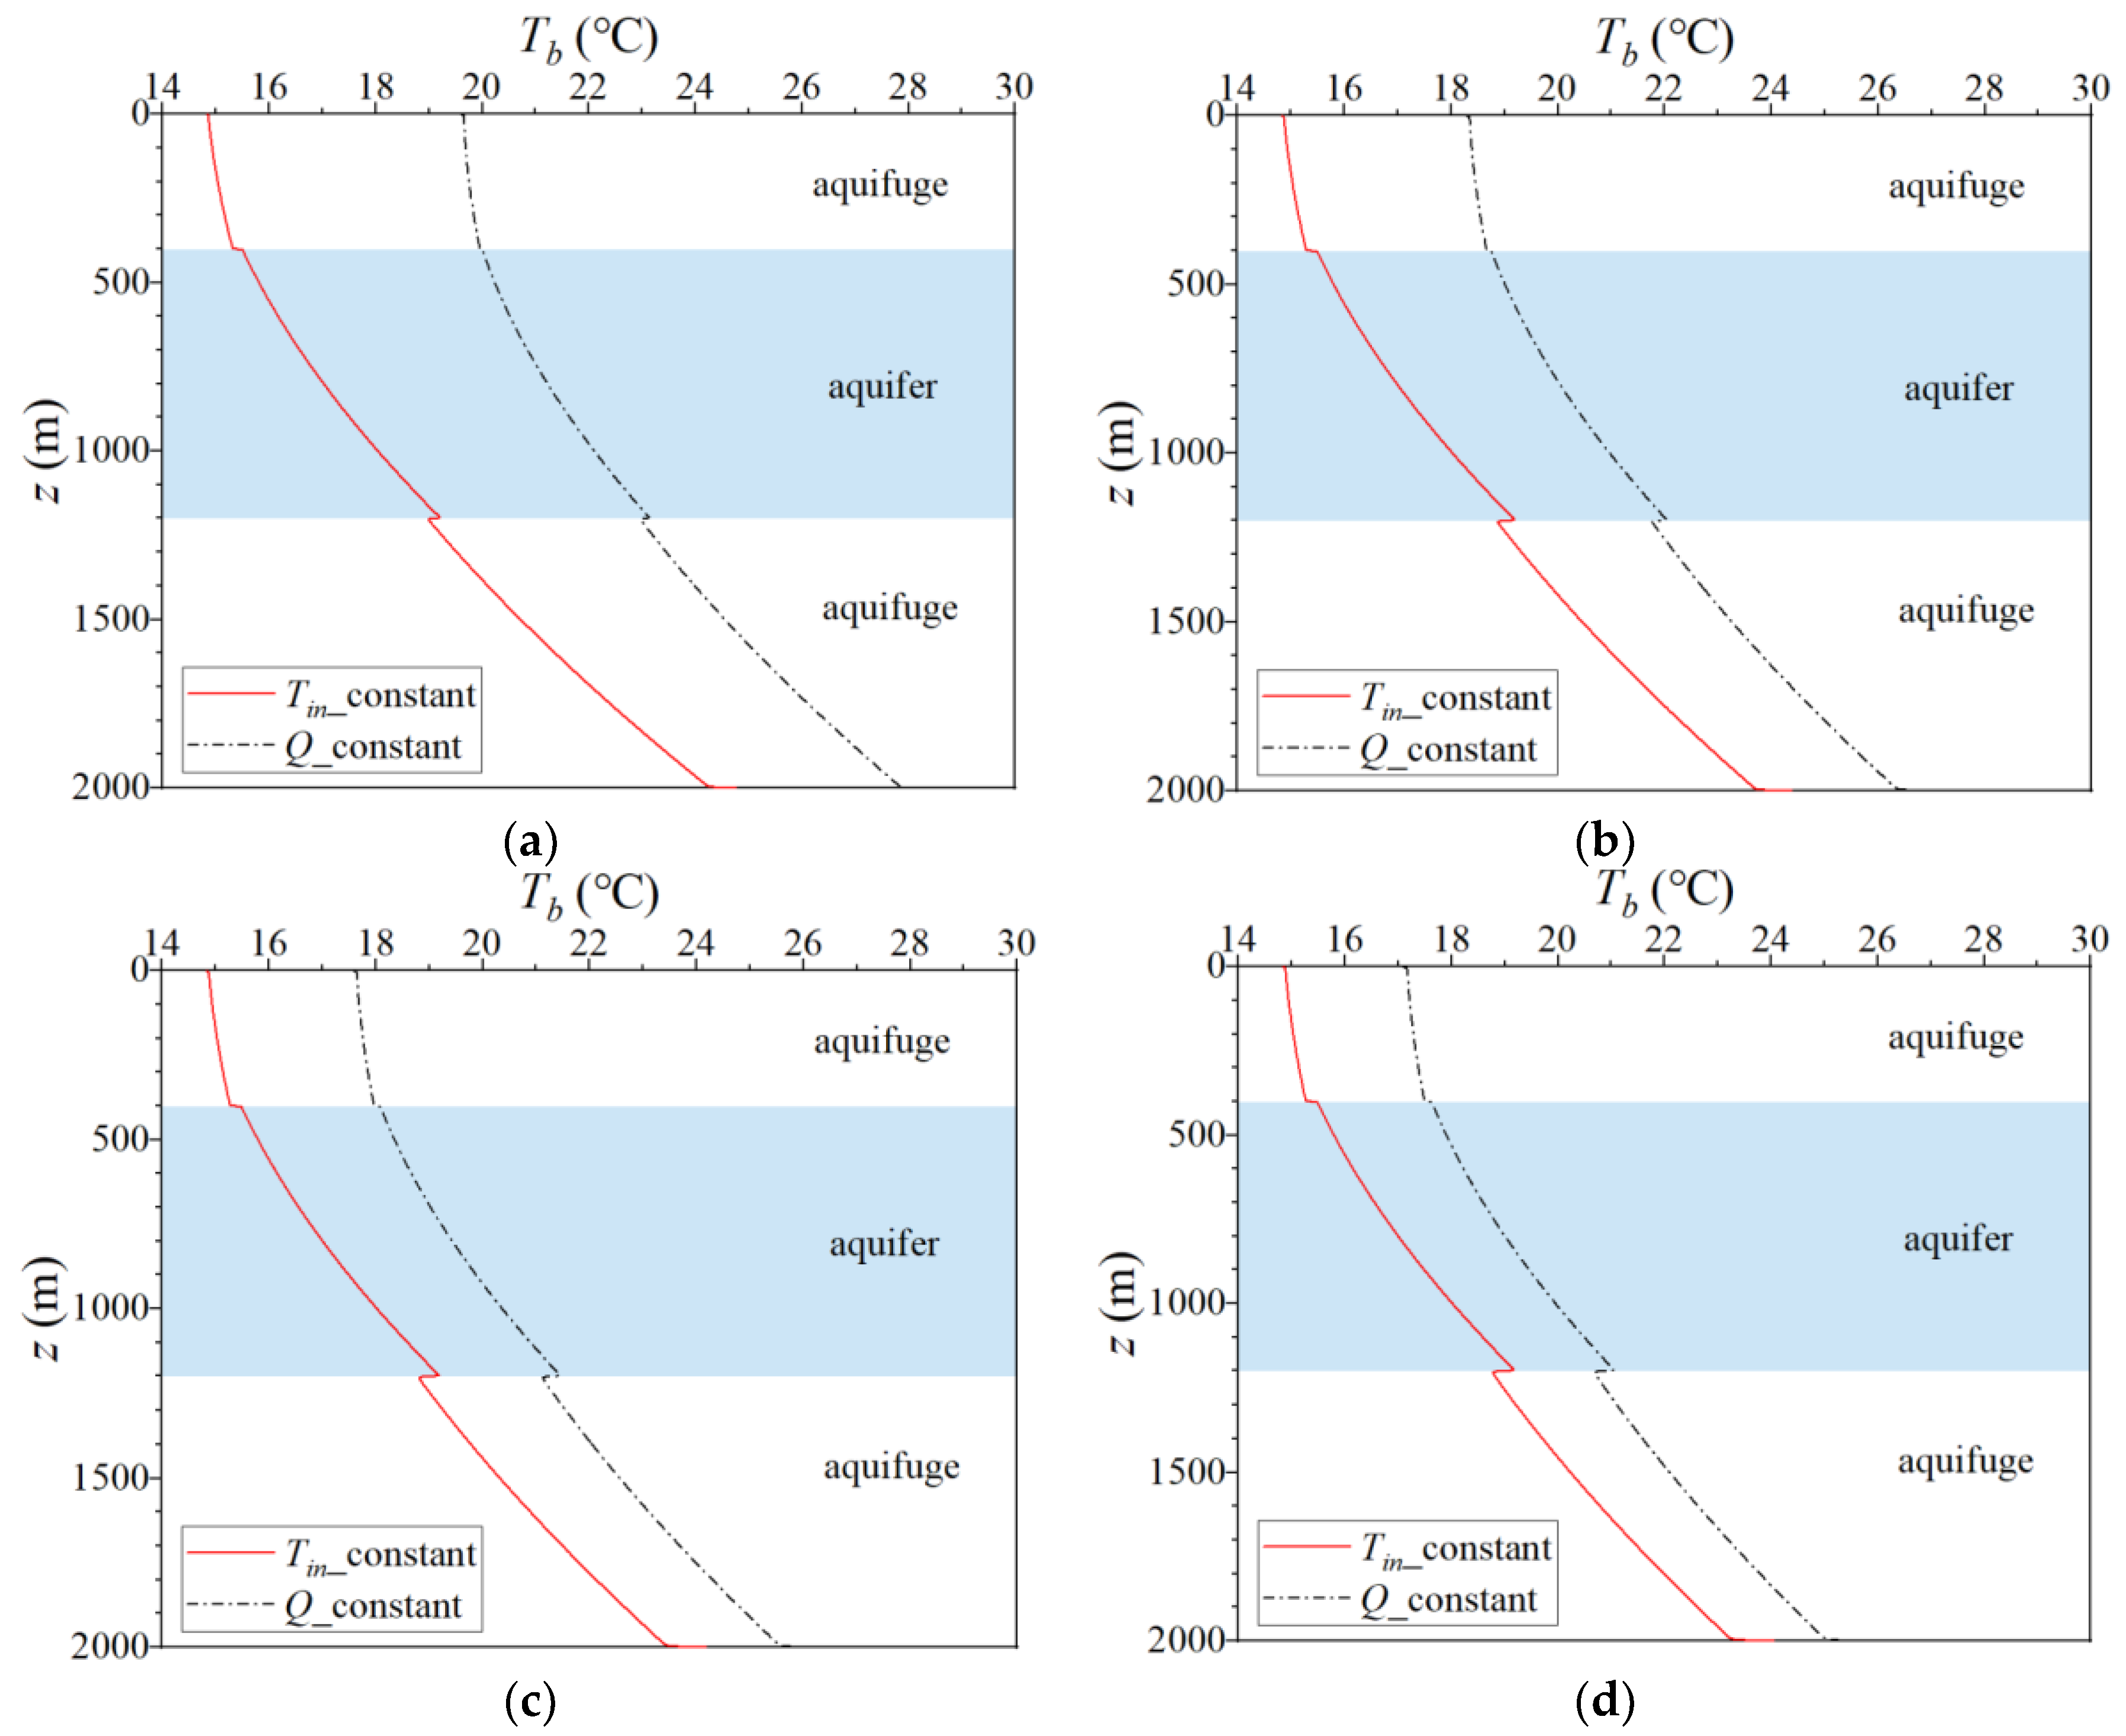
Borehole temperatures can reflect the influences of DBGHE heat extraction on the surrounding rocks and soil. The borehole temperatures along different depths are shown in Figure 12. It can be seen from the figure that the differences in the borehole temperature caused by the two inlet boundaries decrease with the increase of DBGHE depth. Small jumps in the interface between the aquifer and aquifuge layers are caused by the different heat transfer model in the two layers. The heat transfer processes in the aquifer layer involve convection and conduction while only conduction is involved in the heat transfer process in the aquifuge layer. The differences peak at the surface due to the differences in the inlet temperatures between the two conditions. The differences in average borehole temperatures along the depths caused by the constant heating power and the constant inlet temperature boundaries are about 4.1 °C on the 30th day. As the operation of DBGHE continues, the differences in the average borehole temperature along the depths resulting from the two inlet boundaries decrease to about 2.0 °C on the 120th day. In other words, the average borehole temperatures at the constant inlet temperature on the 30th day and 120th day are 18.3% and 9.9% higher than those at the constant heating power, respectively. This is because the differences in inlet temperatures between the two cases also decrease as the operation of DBGHE continues.

3.1.3. Thermal Influence Radius

With the increase in the distance from DBGHE, the influence of DBGHE heat extraction on the ground temperature field gradually decreases. The distance where rock-soil temperature is not influenced by the DBGHE is defined as the thermal influence radius. The thermal influence radius (Rthermal) can be calculated by
T ( t ) | r = R t h e r m a l T ( 0 ) δ
The white line in Figure 13 is the isothermal of T(t) = T(0) − δ (δ = 0.5℃) at a depth of z = 800 m. Note that Rthermal, x+, Rthermal, y, and Rthermal, x represent downstream (x+), perpendicular (y), and upstream (x−) thermal influence radii, respectively.
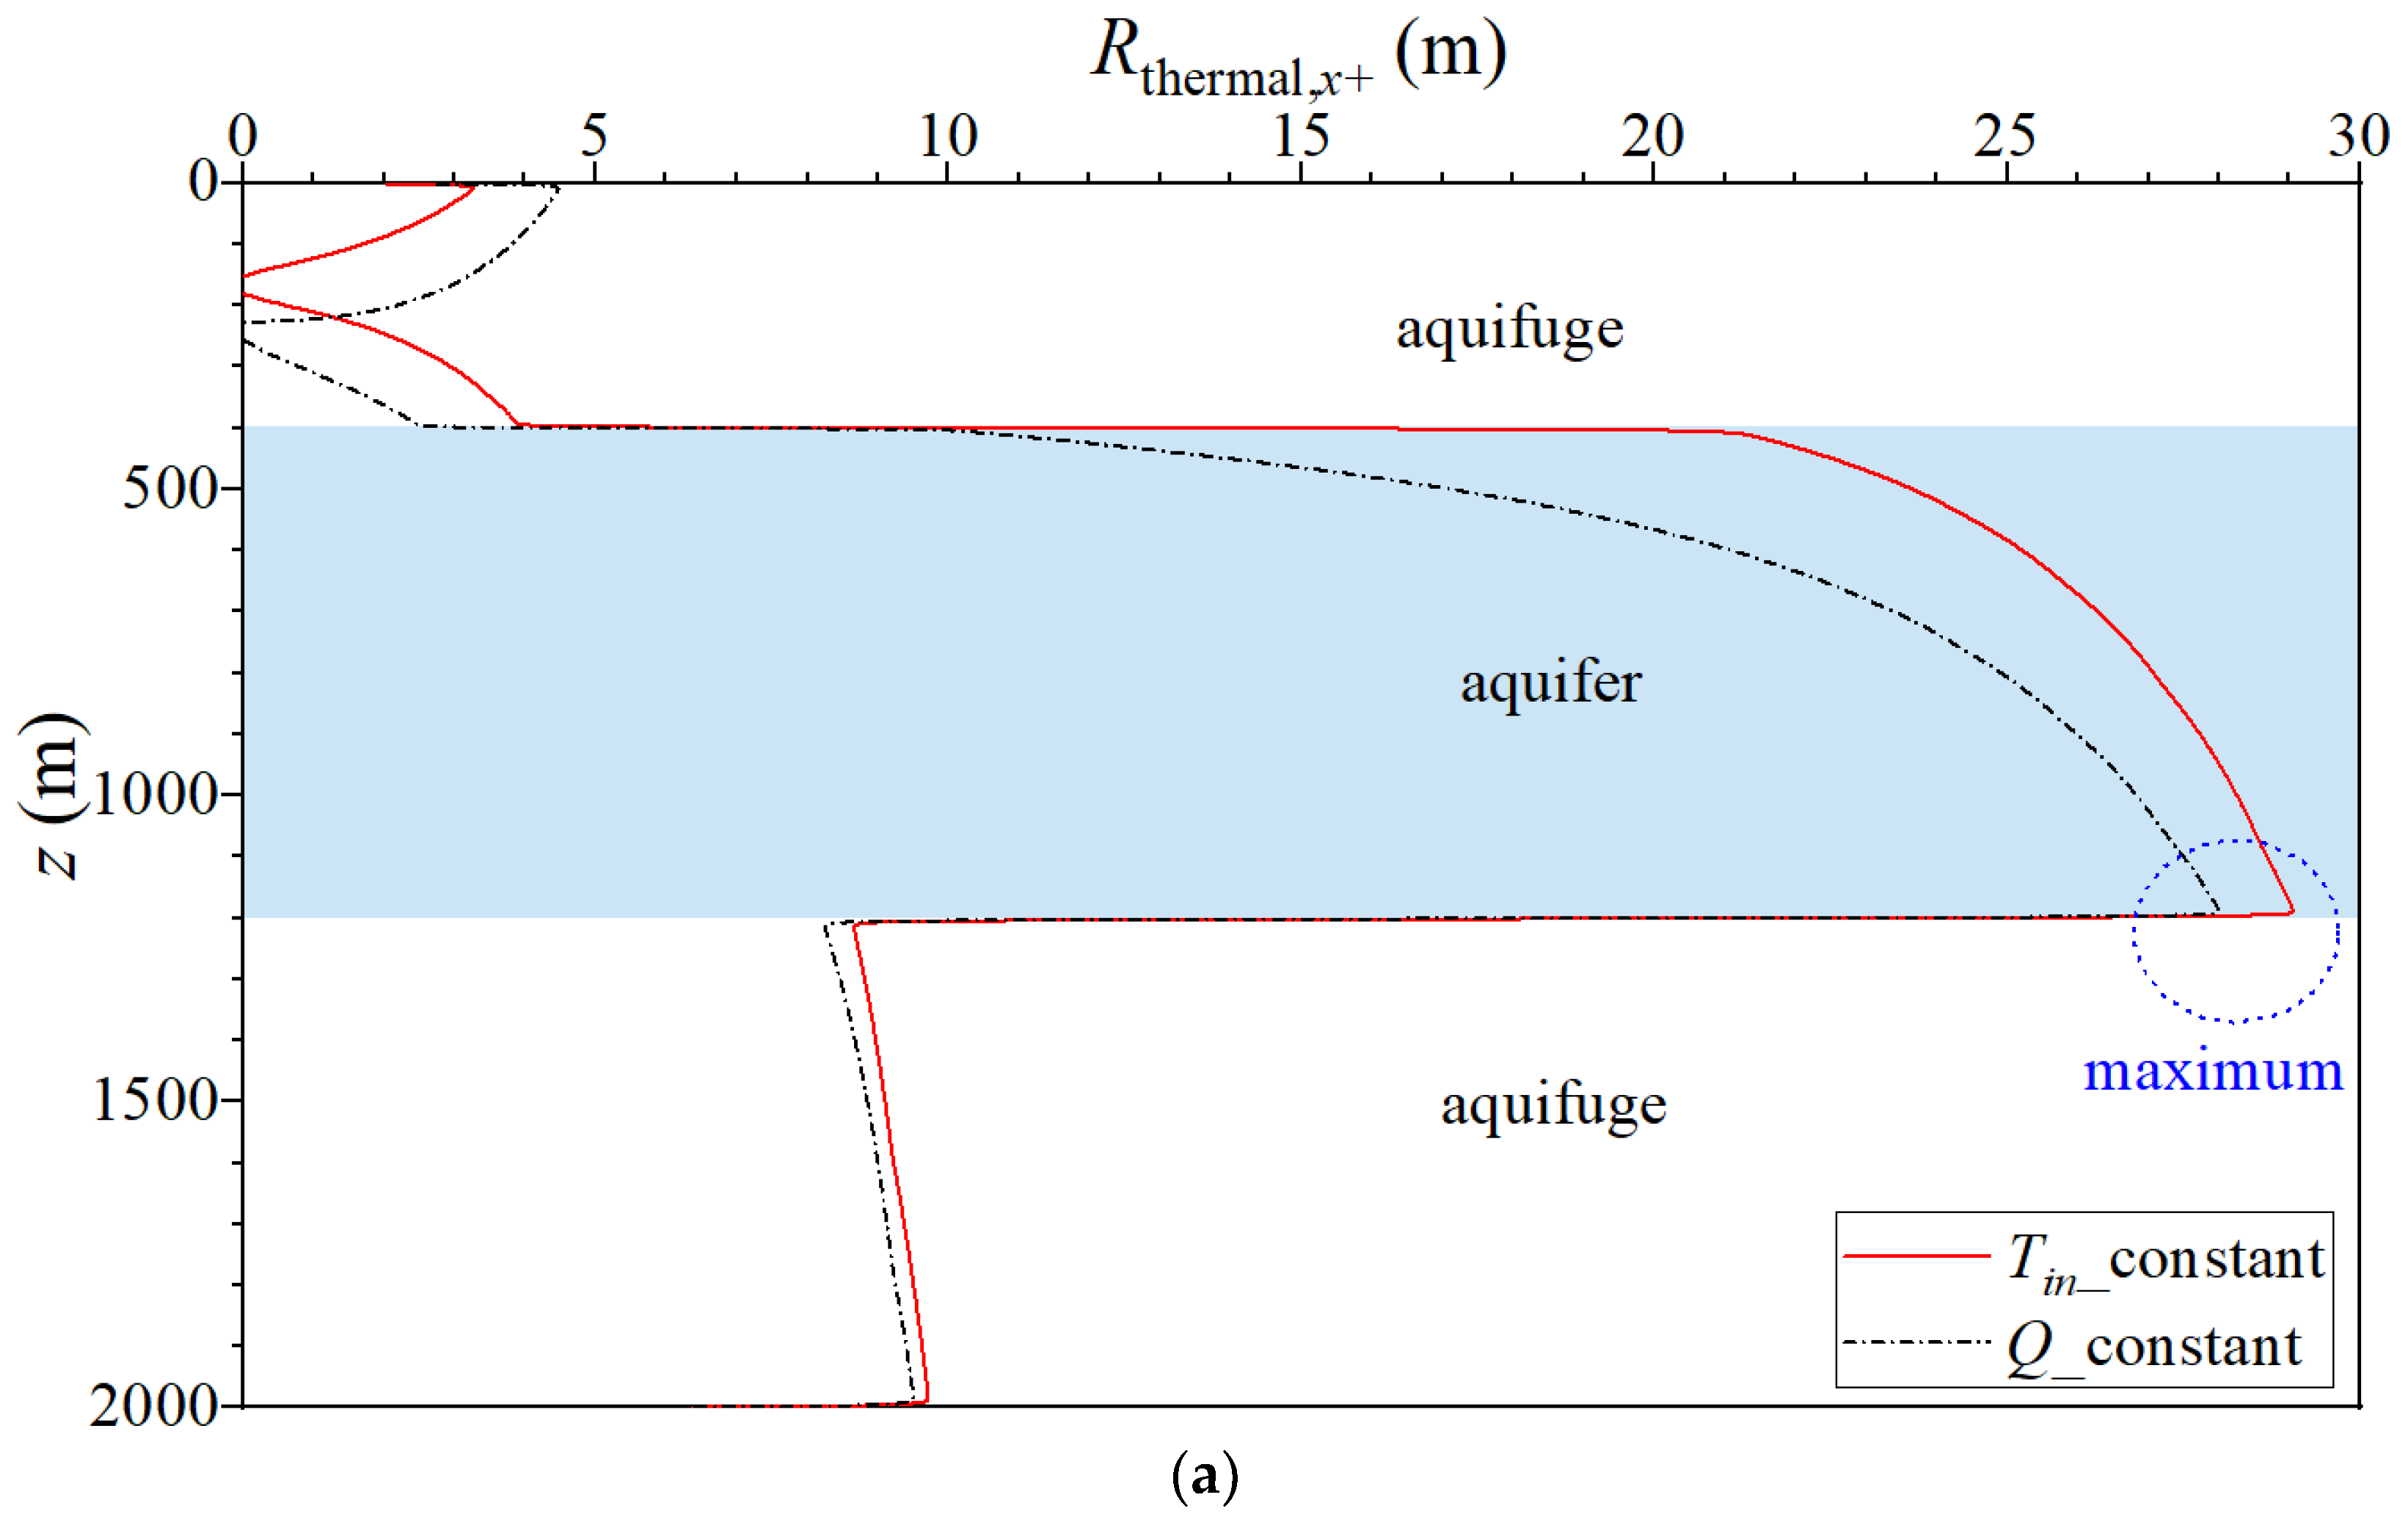
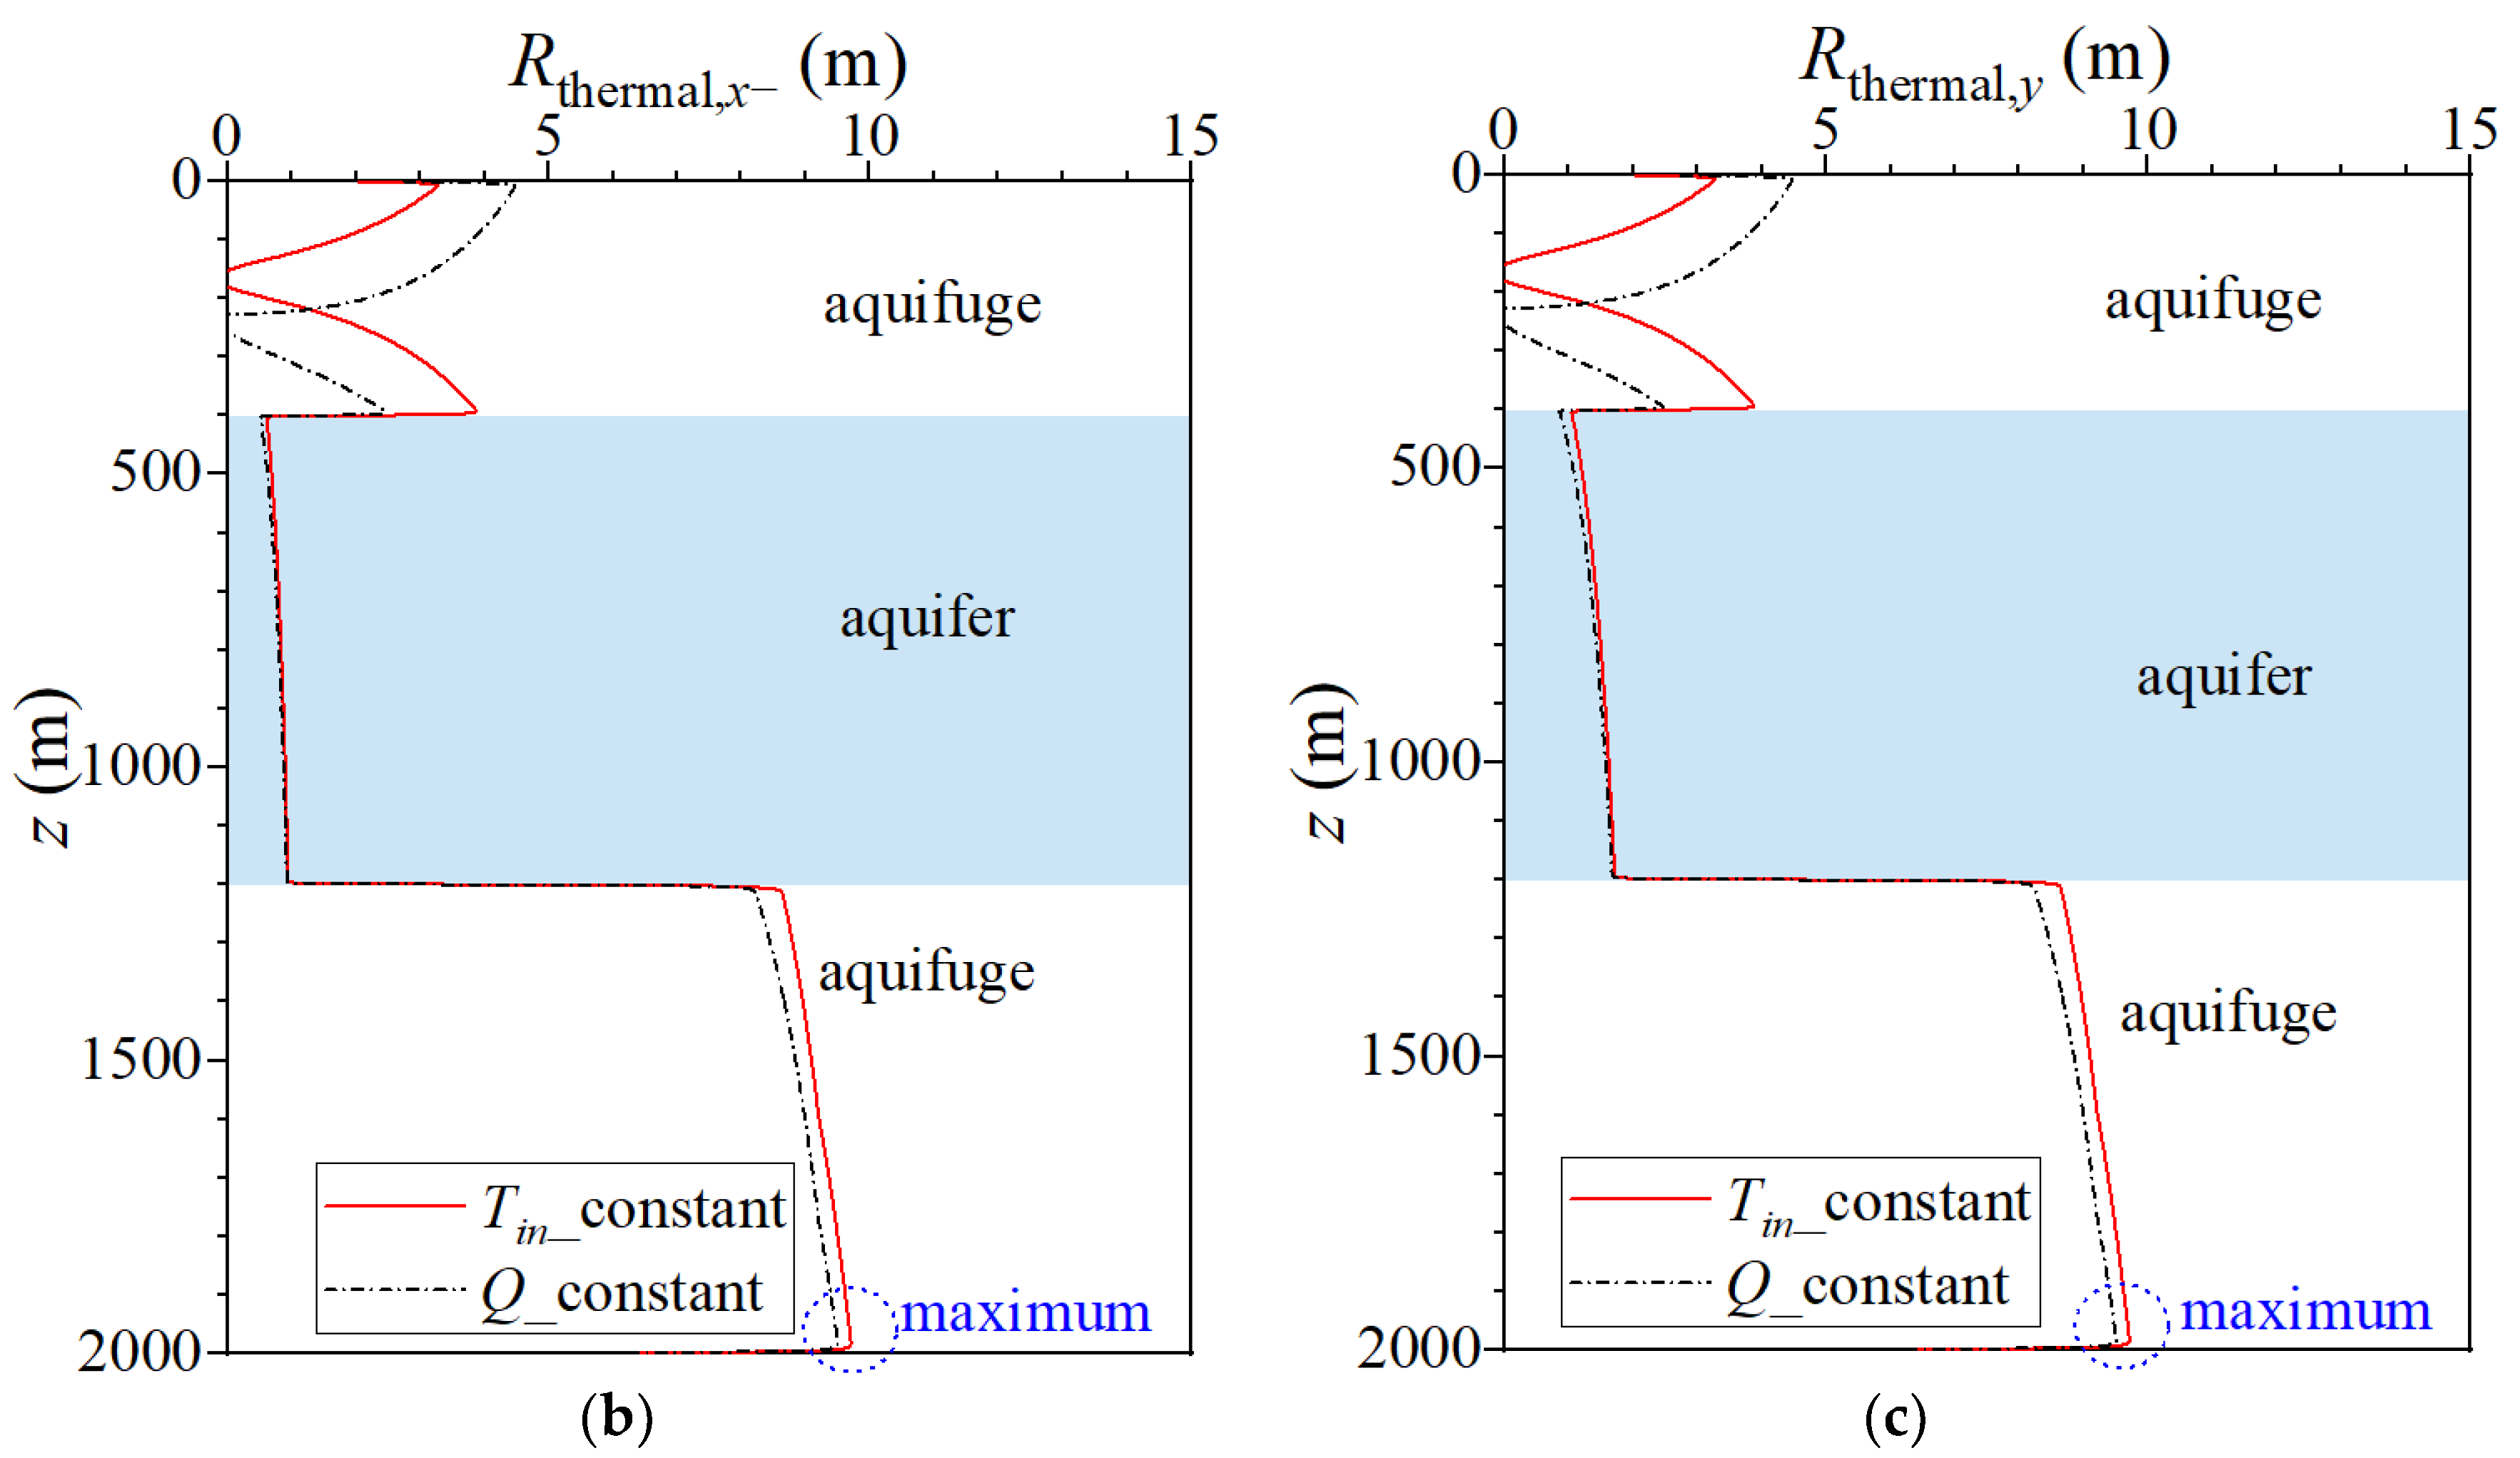
Figure 14 shows the downstream (x+), upstream (x−), and perpendicular (y) thermal influence radii under different inlet boundaries. The largest thermal influence radii in the downstream direction are 29.1 m and 28.0 m at a constant inlet temperature and a constant heating power, respectively, which are at the interface between the lower aquifuge and the middle aquifer. The groundwater flow leads to a larger downstream range influenced by the heat extraction of DBGHE in the aquifer layer. In the upstream and perpendicular directions, the largest thermal influence radii are 9.7 m and 9.5 m at a constant inlet temperature and a constant heating power, respectively, which are at the bottom of the rock-soil domain. The reason for this is that the thermal influence radii of the aquifer in these two directions become less affected by the groundwater flow. The DBGHE extracts more heat from the lower aquifuge layer than from the upper aquifuge layer due to the larger thermal conductivity and the higher ground temperature in the lower aquifuge layer, as discussed in Section 3.1.1. Thus, the thermal influence radius peaks at the bottom of the lower aquifuge layer. The thermal influence radii at a constant inlet temperature are larger than those at a constant heating power due to higher heating power.

3.1.4. Variation with Groundwater Velocities

From the above discussions, the performance of DBGHE varies with inlet boundary conditions. The effects of inlet boundary conditions on the analysis of the groundwater flow effects need to be further investigated because the DBGHE performance is affected by groundwater velocity, according to the introduction.
The outlet temperatures and heat extraction amount at the groundwater velocities of 1 × 10⁻⁸ m·s−1, 1 × 10⁻⁶ m·s−1, and 5 × 10⁻⁶ m·s−1, after a short operation of 10 days, are shown in Figure 15. When groundwater velocity increases from 1 × 10⁻⁸ m·s−1 to 1 × 10⁻⁶ m·s−1, the outlet temperatures and heat extraction amount at the two inlet conditions slightly change. In contrast, the outlet temperatures obviously vary as the groundwater velocity changes from 1 × 10⁻⁶ m·s−1 to 5 × 10⁻⁶ m·s−1, and are applied to investigate inlet boundaries within a complete operation cycle.
Figure 16 presents the outlet temperatures and heat extraction amount at the groundwater velocities of 1 × 10⁻⁶ m·s−1 and 5 × 10⁻⁶ m·s−1 within 120 days. The results illustrate that at a constant inlet temperature, outlet temperatures vary by less than 1 °C as the groundwater velocity changes from 1 × 10⁻⁶ m·s−1 to 5 × 10⁻⁶ m·s−1; however, those at a constant heating power increase from 1.9 °C to 3.7 °C with time. The constant inlet temperatures increase from 187.7–216.2 kW to 217.1–239.5 kW while the heat extraction amount is constant under the constant heating power.
Figure 17 shows the maximum thermal influence radii in the downstream, upstream, and perpendicular directions under different groundwater velocities. The results demonstrate that under a constant inlet temperature and heating power, with the groundwater velocity increasing from 1 × 10⁻⁶ m·s−1 to 5 × 10⁻⁶ m·s−1, the maximum thermal influence radii in the downstream direction increase by 18.8 m and 18.0 m, respectively. In the upstream and perpendicular directions, maximum thermal influence radii are slightly reduced with the increase of the groundwater velocity. This is because the thermal influence radii peak at the bottom of the rock-soil domain, which belongs to the aquifuge layer. Thus, thermal influence radii are affected slightly by groundwater flow in the aquifer.
The differences in the variations of outlet temperature with the increase of groundwater velociy caused by the two inlet boundary conditions on the 120th day are up to 2.7 °C. The constant inlet temperature boundary is more appropriate than the constant heating power when being used to estimate aquifer effects on the DBGHE performance. The thermal influence radii change similarly under two inlet boundary conditions.

3.2. Effects of Boundary Conditions of Rock-Soil Domain

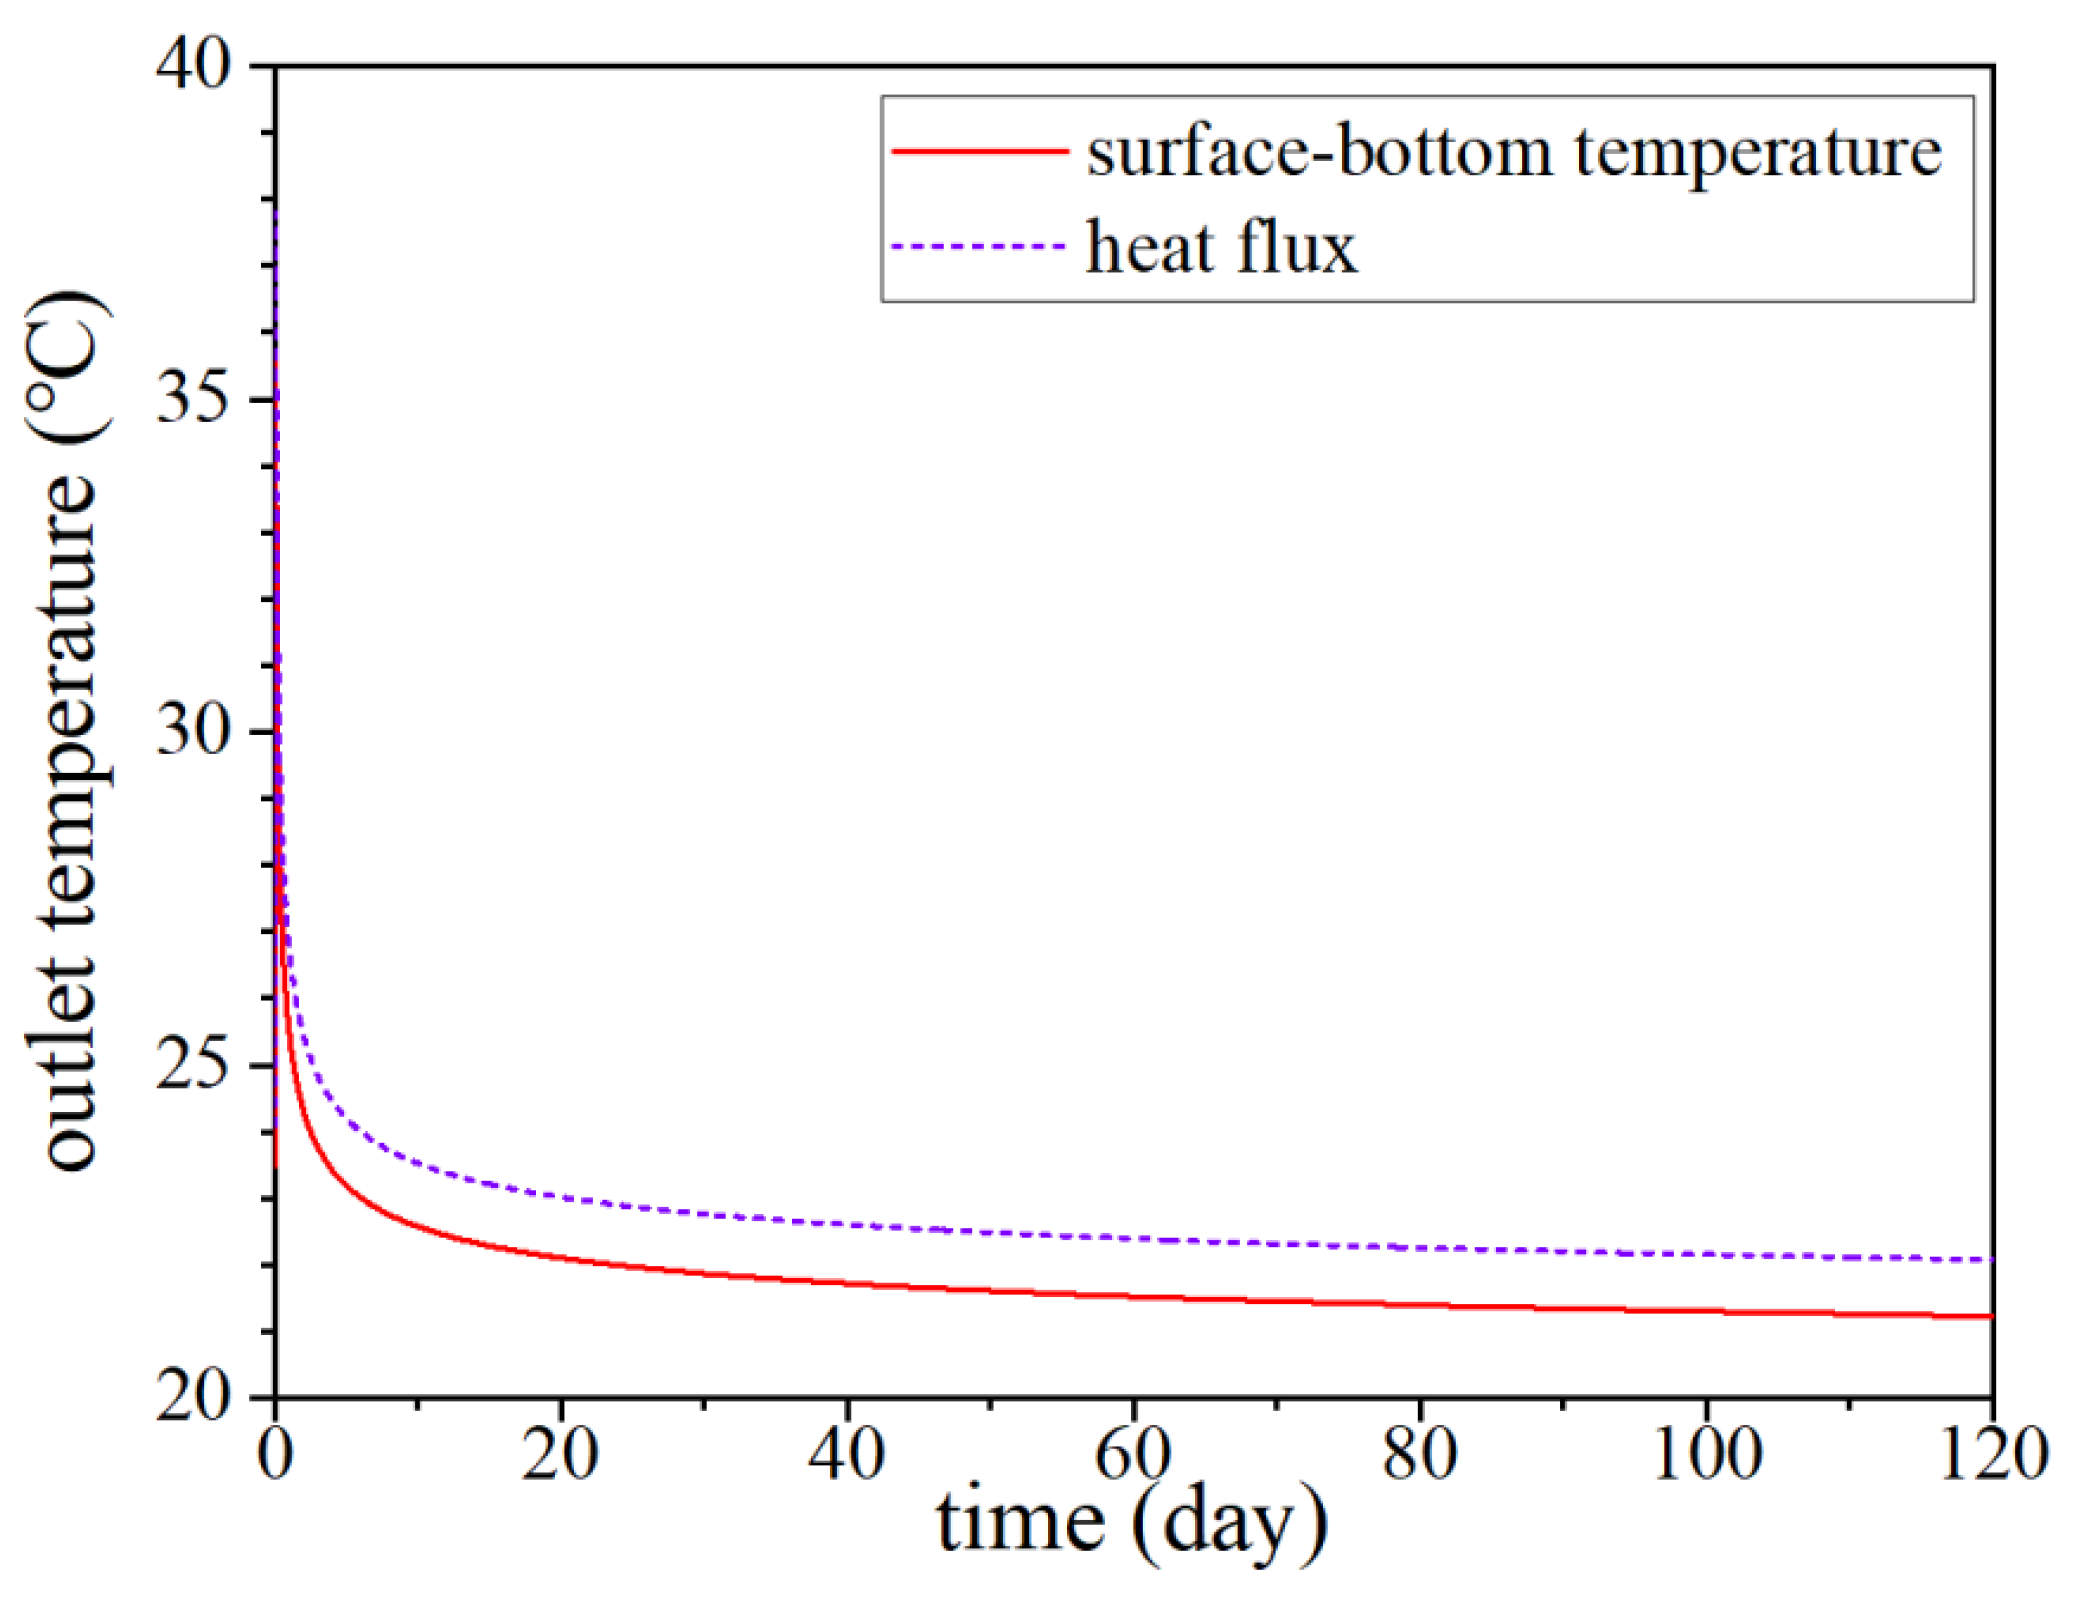
The boundary conditions of the rock-soil domain are also a critical component of the numerical simulations of heat transfer through the DBGHE and ground. As shown in Equations (9) and (10), two common boundary conditions of the rock-soil domain are discussed. The first kind of boundary condition is the constant temperature on the surface and bottom of rocks and soil. The other kind of boundary condition is the convective boundary and heat flux boundary on the surface and bottom of the rock-soil domain, respectively. The two kinds of boundary conditions are called the surface–bottom temperature boundary and the heat flux boundary in the following discussions. The different rock-soil boundary conditions cause the initial and far-field temperatures at the same depth under the surface–bottom temperature boundary to be lower than those under the heat flux boundary, as presented in Figure 2. Table 4 gives the setting of cases discussed in Section 3.2.

3.2.1. Outlet Temperatures and Heat Exchange Amount

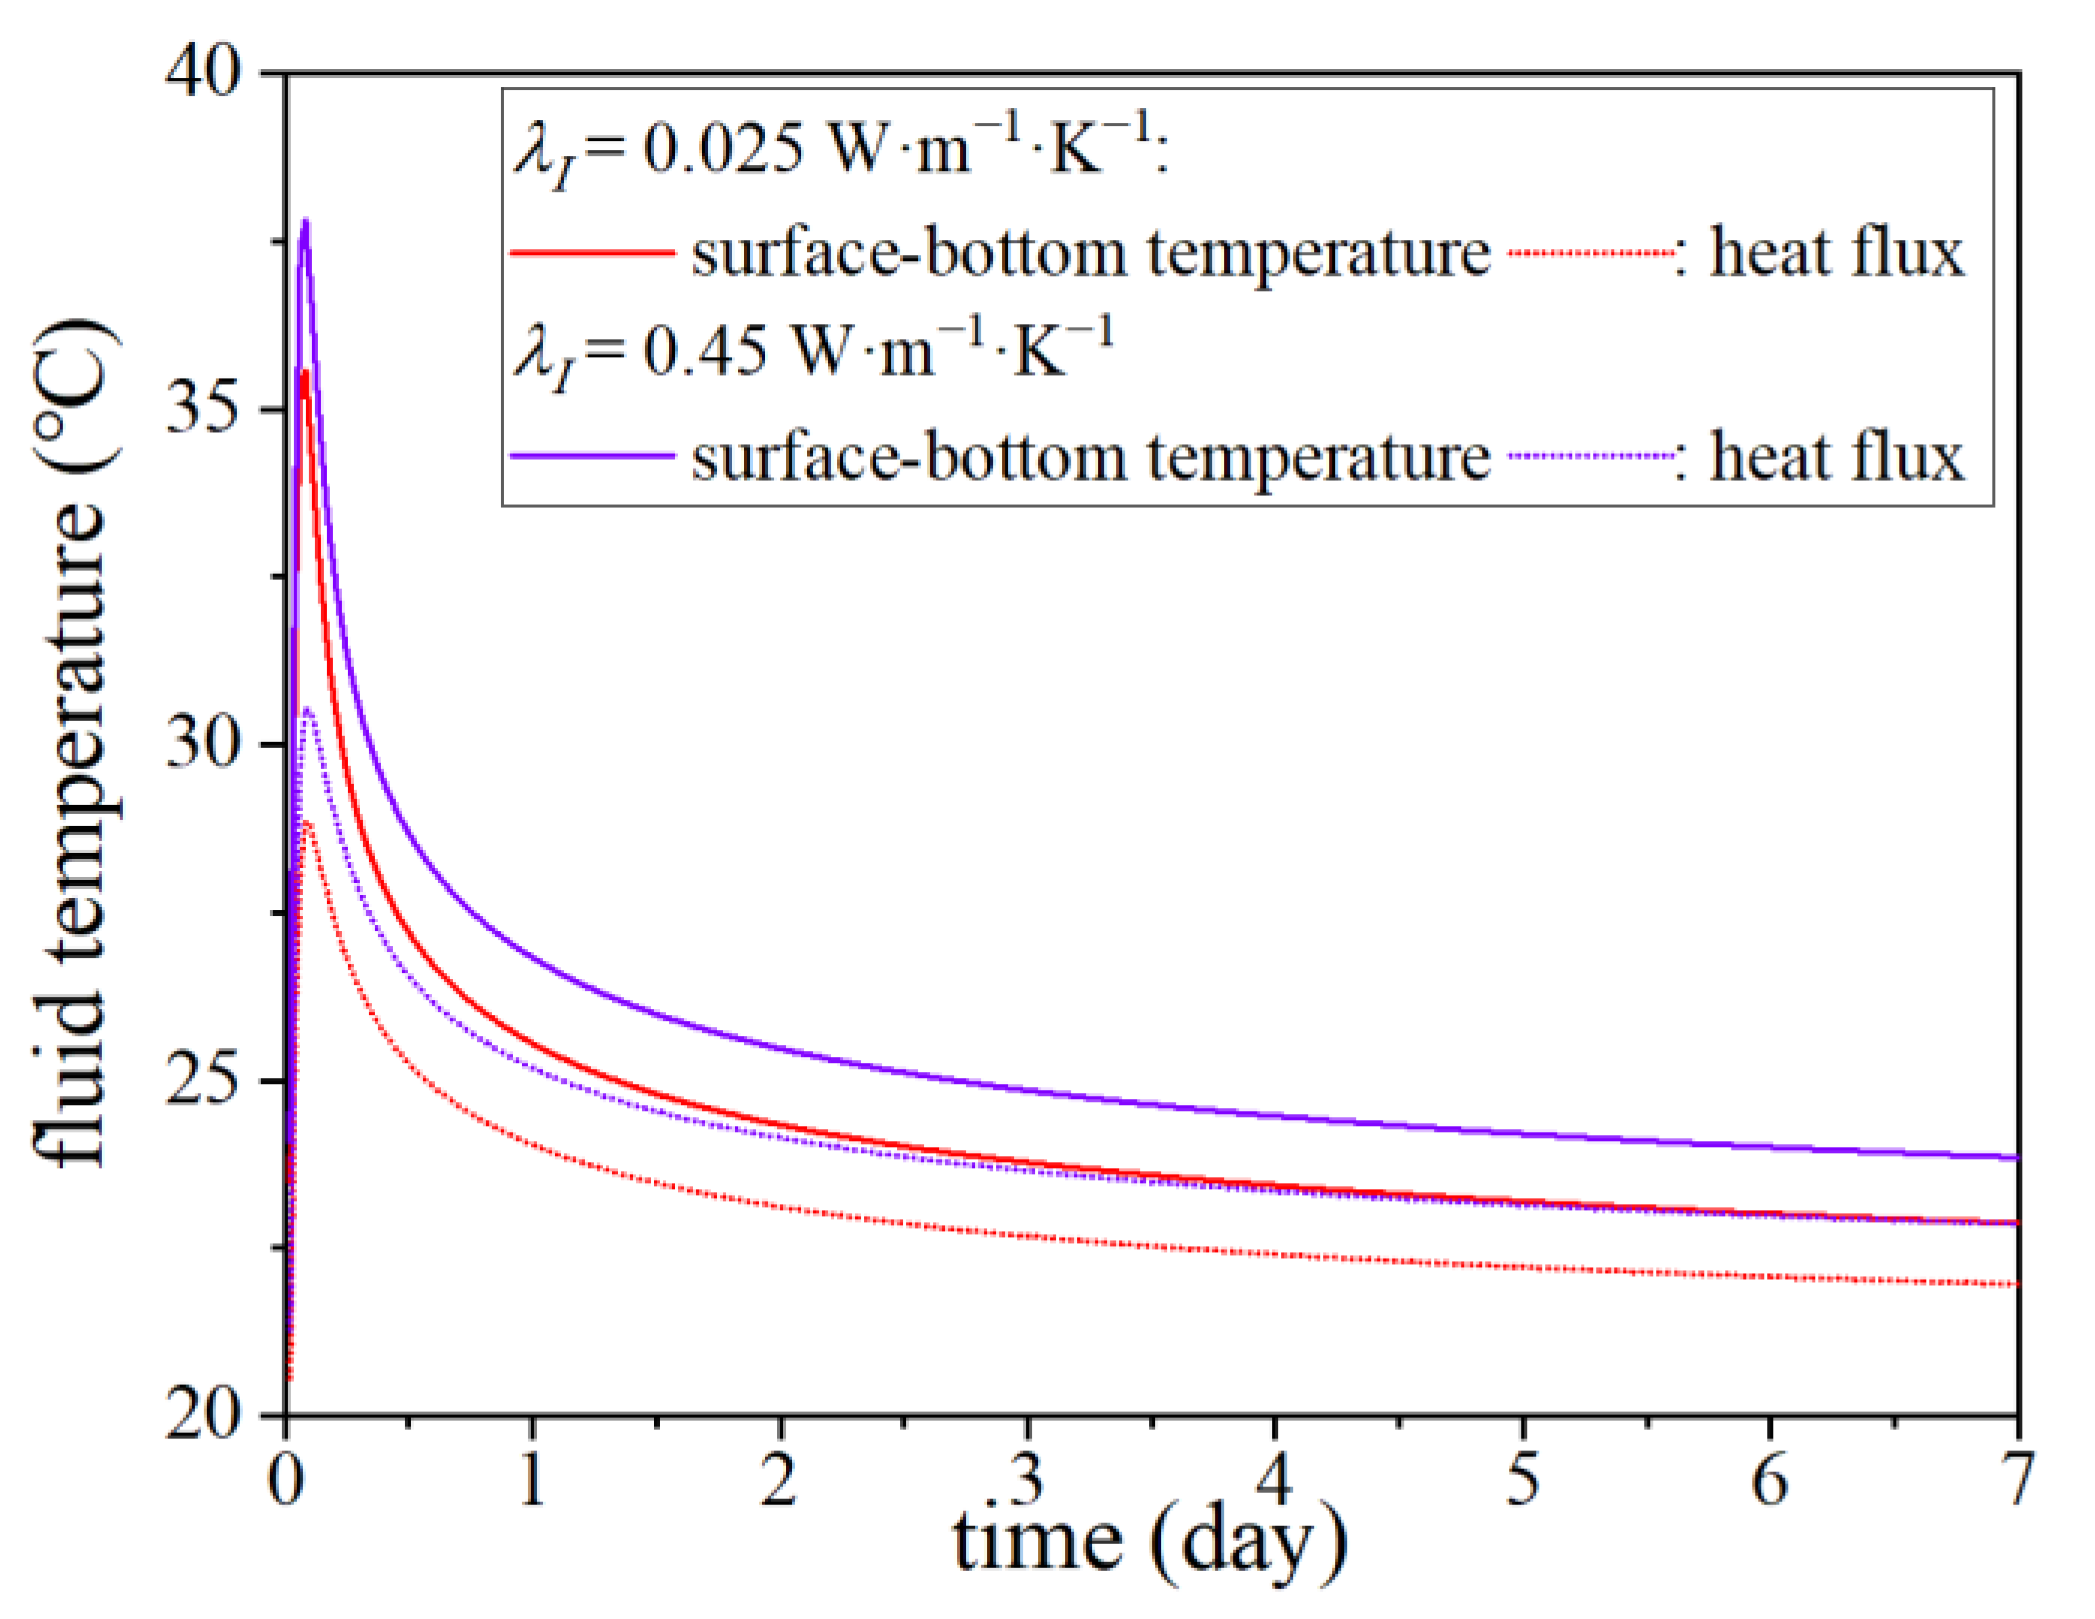
The outlet temperatures with different inner pipe thermal conductivities under different rock-soil boundaries are also discussed, as shown in Figure 18. It can be seen from the figure that under the two thermal conductivities, the outlet temperatures obtained by the heat flux boundary are higher than those obtained by the surface–bottom temperature boundary. The lower the thermal conductivity, the higher the outlet temperatures, and the larger the heat extraction amount. An inner pipe with better insulation is the future development trend. Therefore, the thermal conductivity is set as 0.025 W·m−1·K−1 for discussing the effects of rock-soil boundary conditions in the following sections.
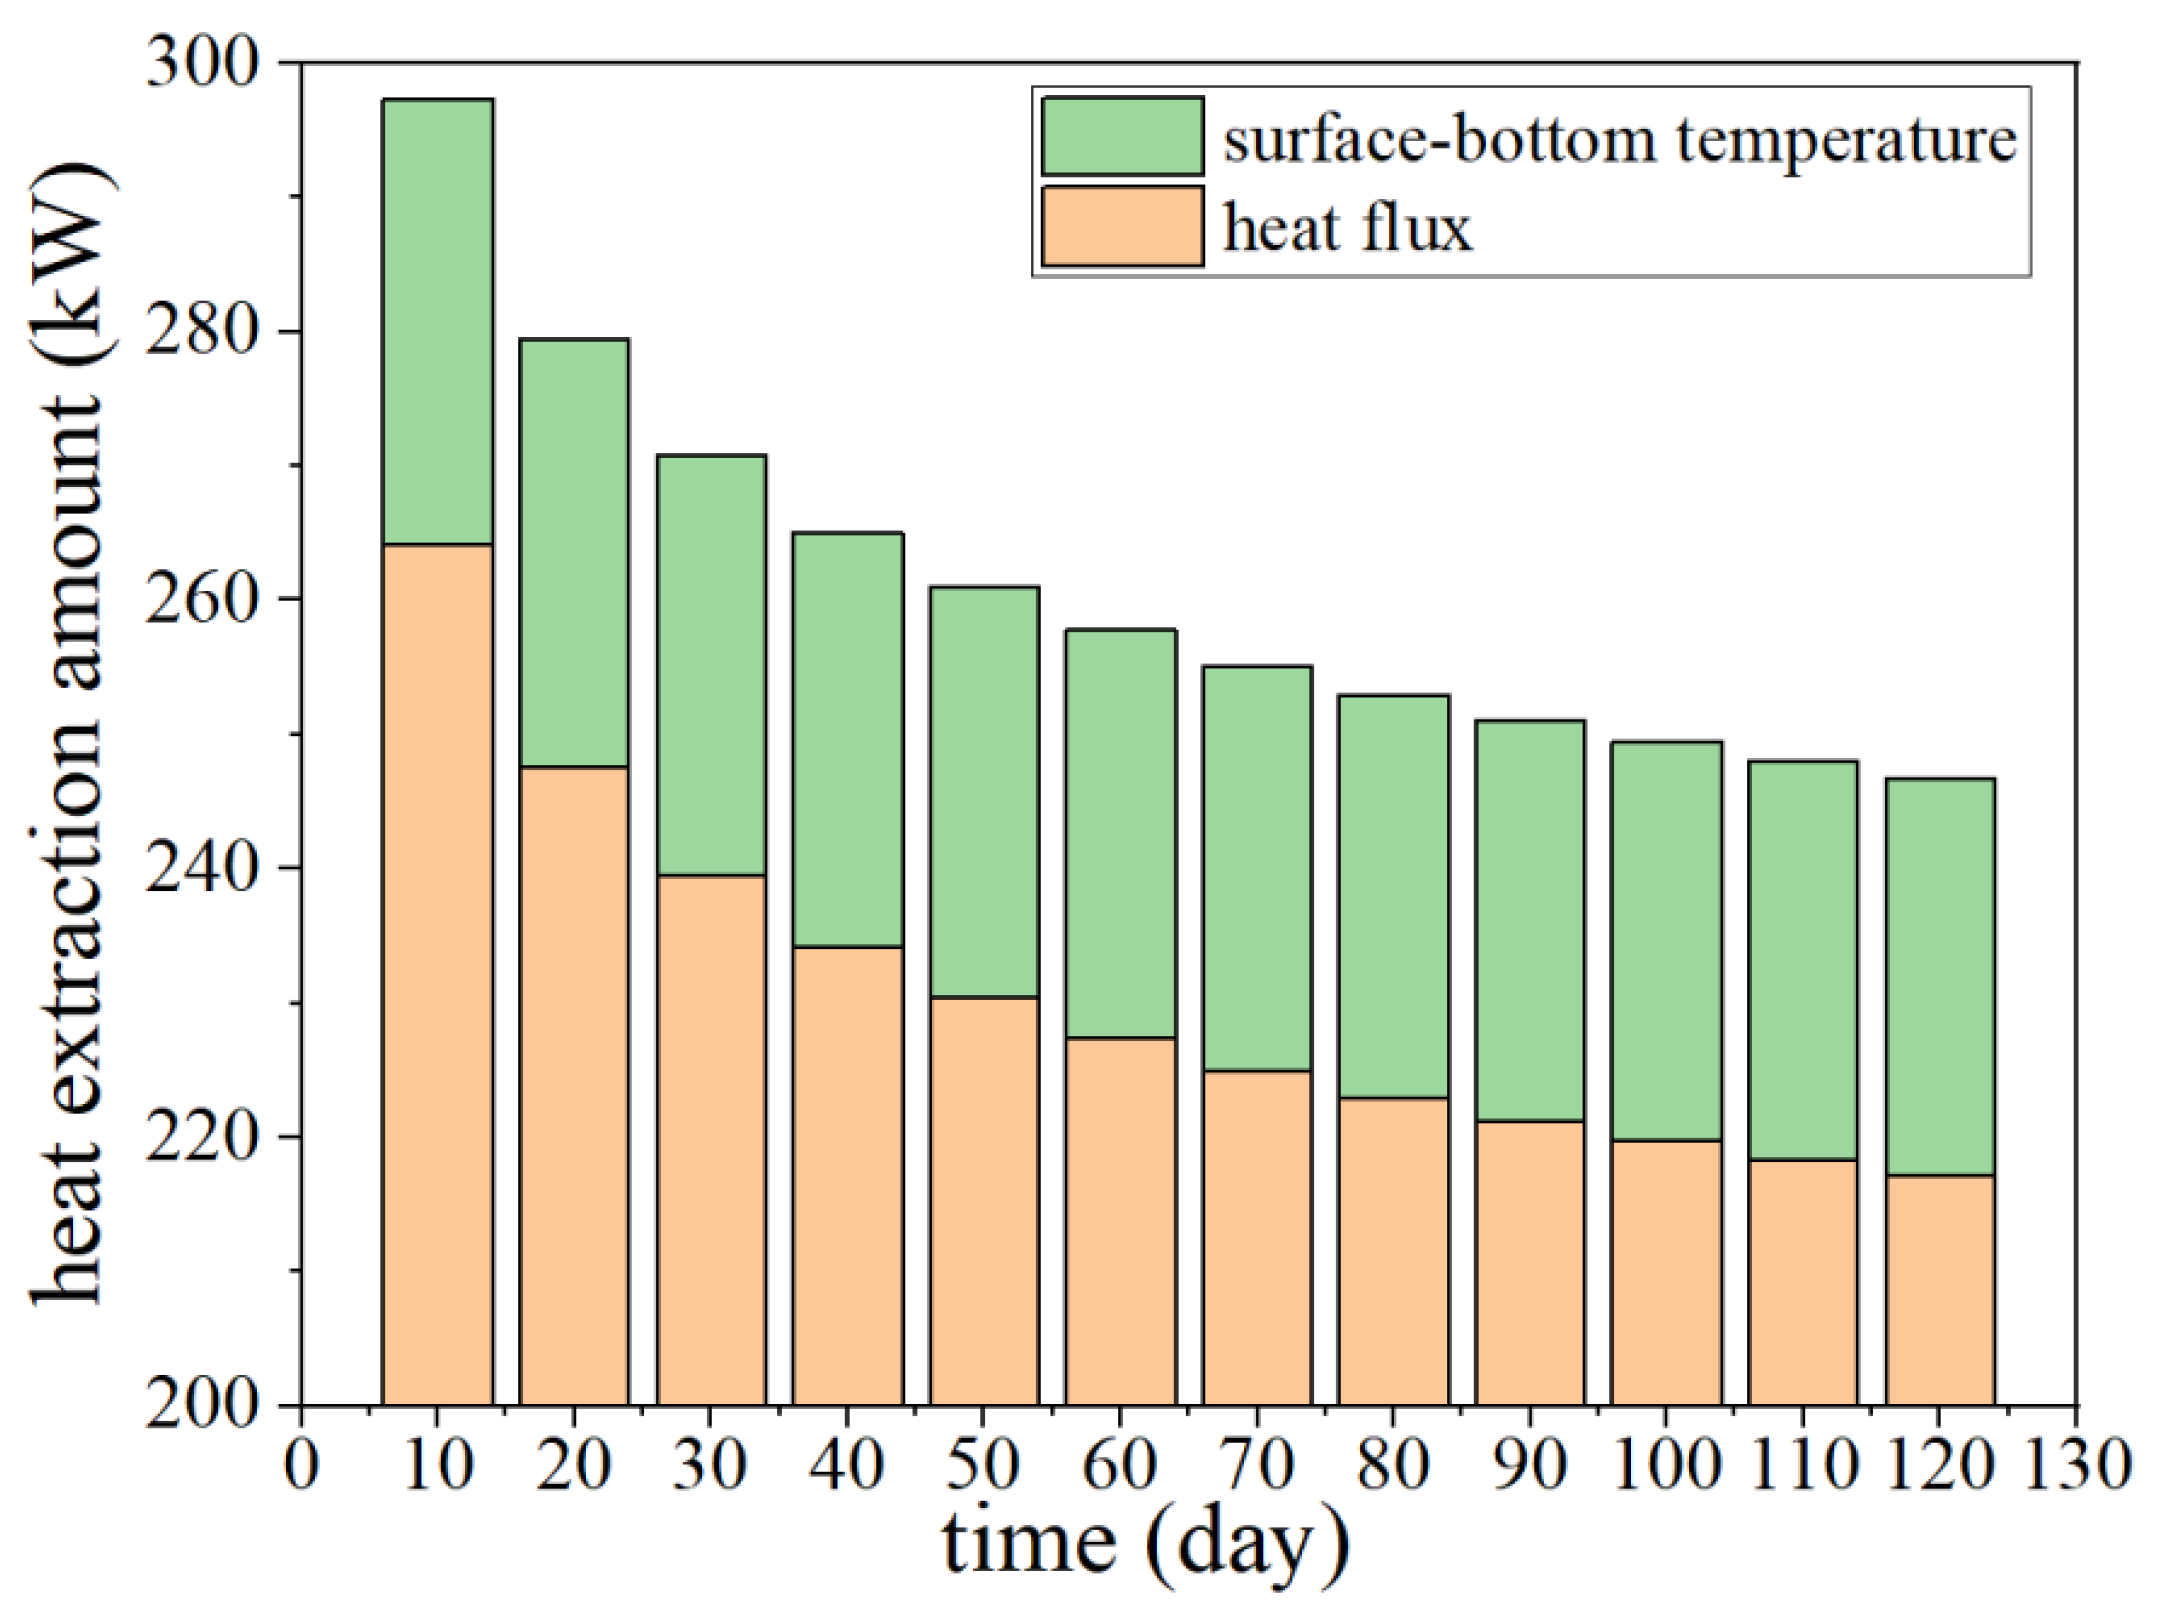
The outlet temperatures of DBGHE within 120 days under the surface–bottom temperature boundary and heat flux boundary are given in Figure 19. The results demonstrate that under the surface–bottom temperature boundary, the outlet temperatures are about 0.9 °C lower than those under the heat flux boundary, mainly because of the differences in the initial and far-field temperatures caused by these two boundaries. Thus, the heat extraction amounts of DBGHE under the heat flux boundary are about 29.6–33.2 kW larger than those under the surface–bottom temperature boundary, as shown in Figure 20. In other words, the relative differences in the heat extraction amount caused by the two cases are about 12.6% and 13.6%.
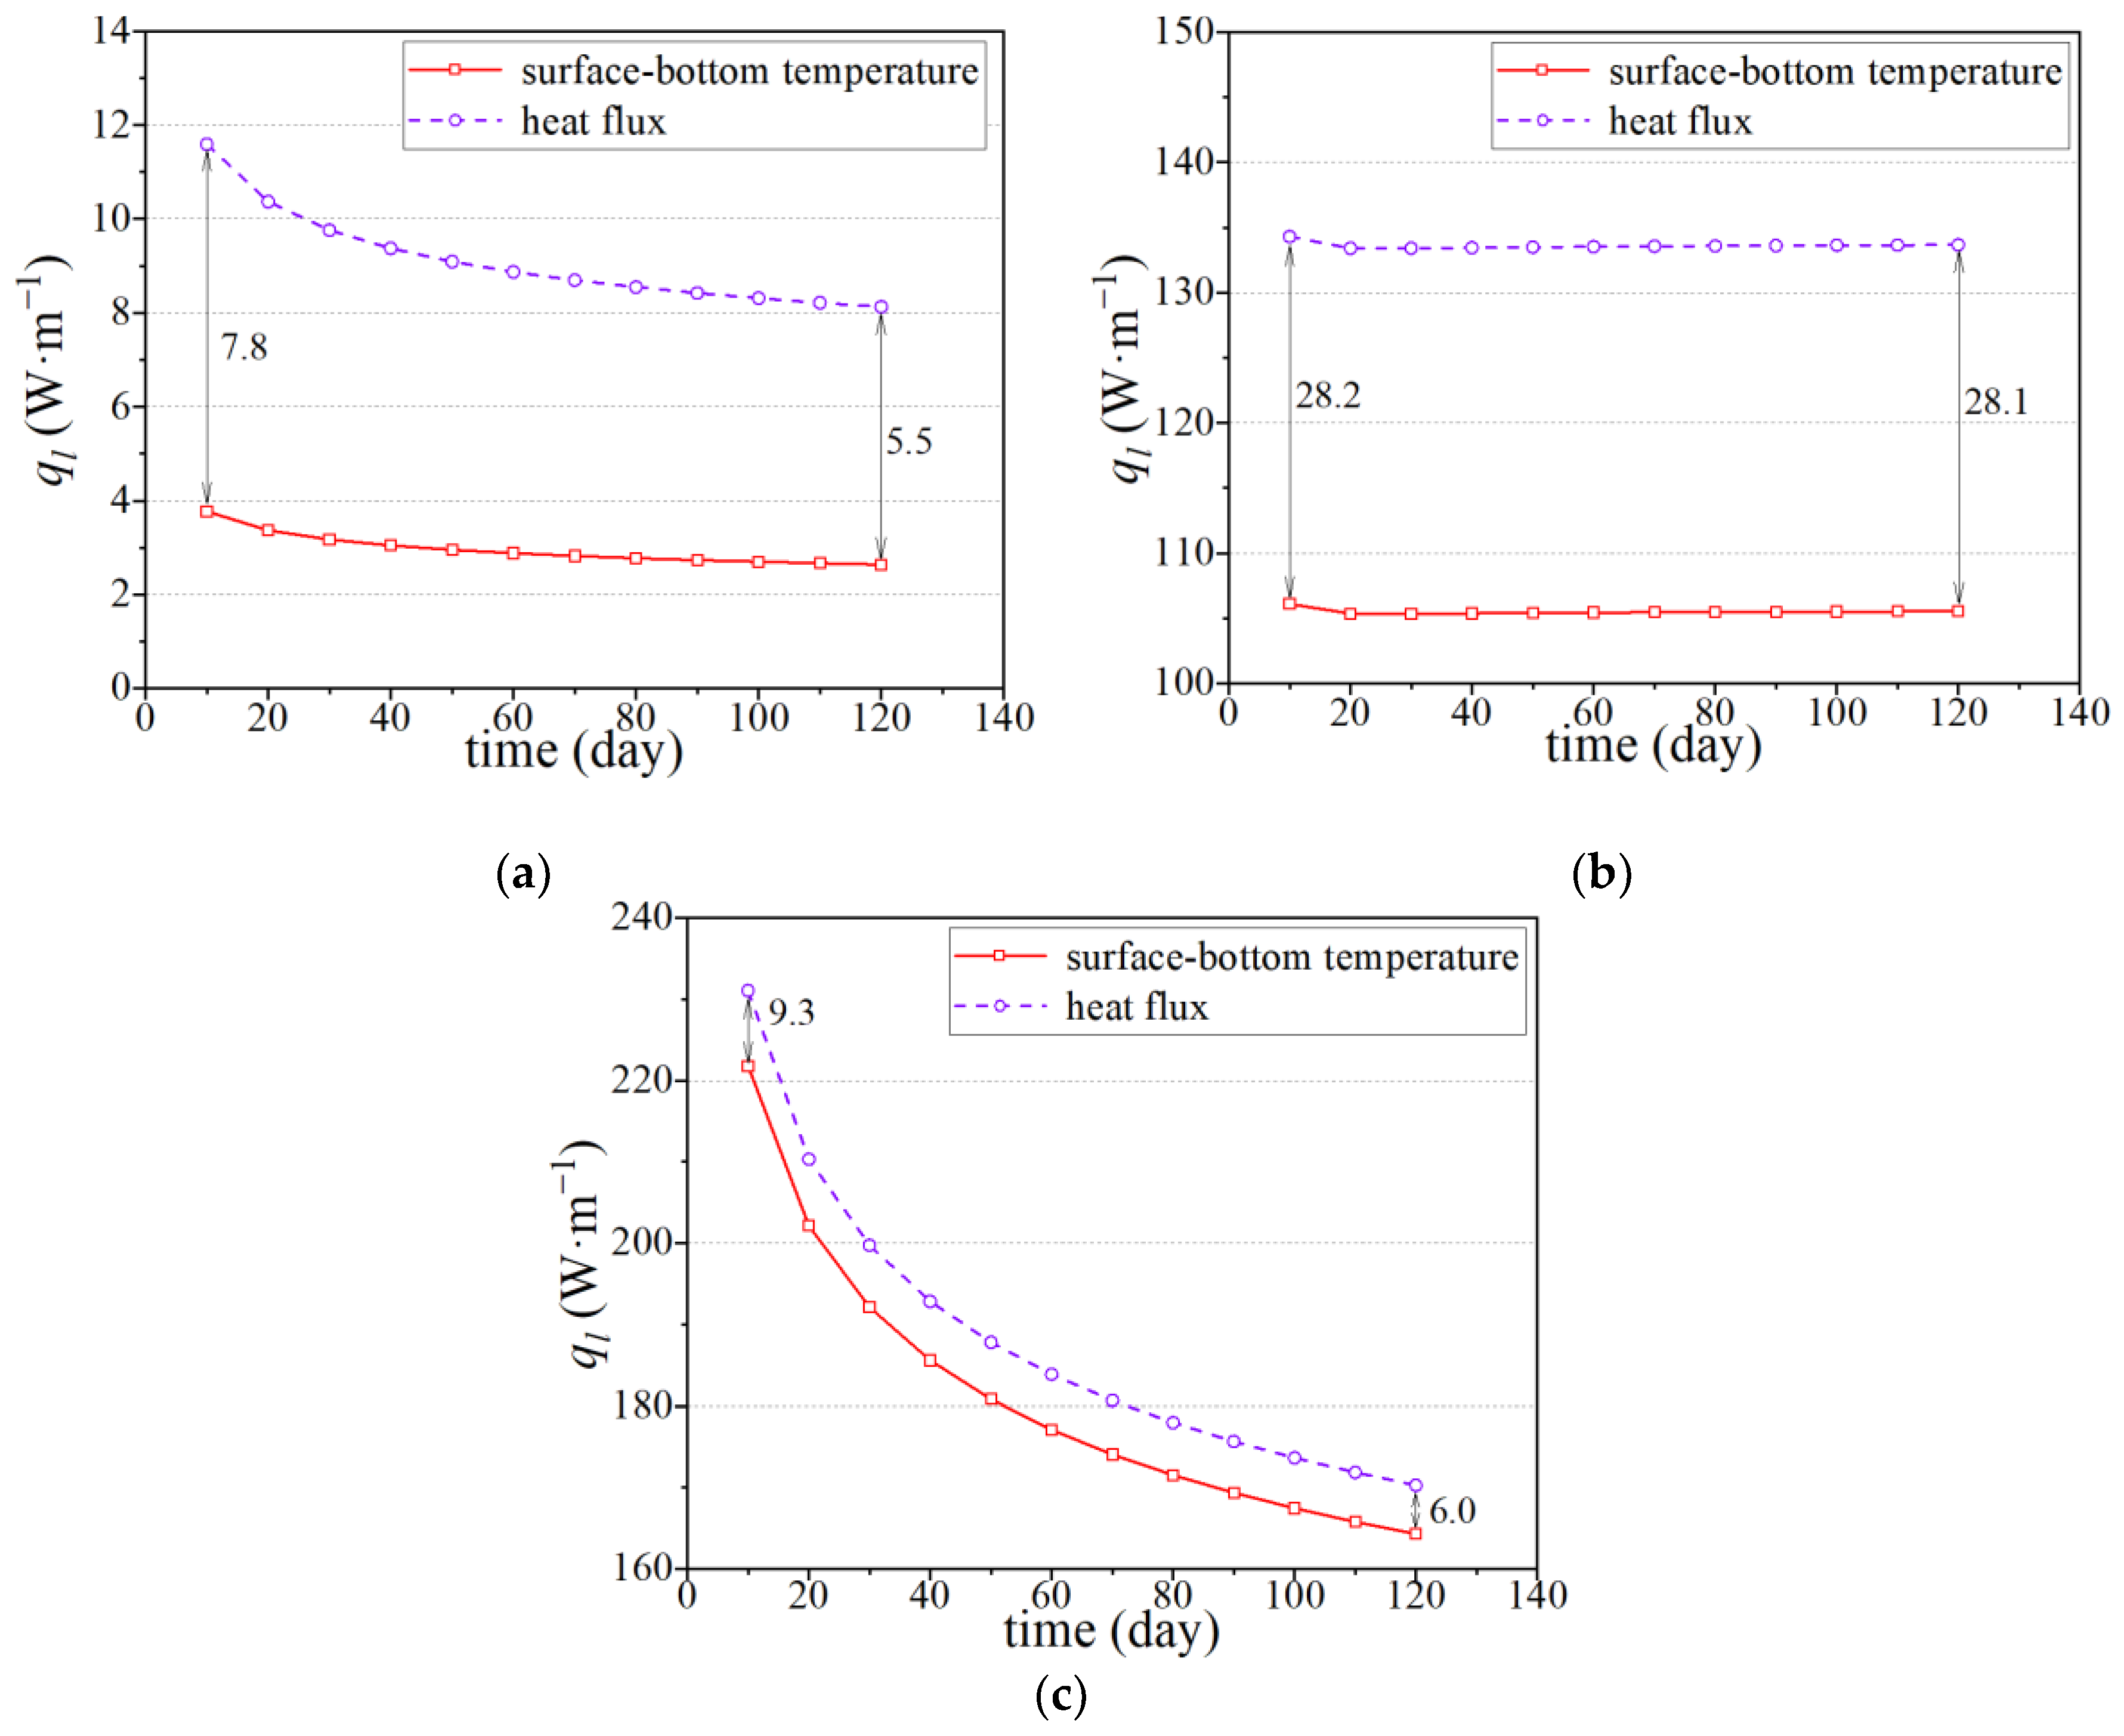
As shown in Figure 21, the variation trends of the heat exchange amount per meter over time under the two rock-soil boundary conditions are similar. The rock-soil boundary conditions only affect the values of DBGHE heat exchange amounts per meter in three rock-soil layers. Moreover, the differences in the heat exchange amount per meter of upper aquifuge and lower aquifuge layers resulting from the two boundaries decrease from 7.8 W·m−1 and 9.3 W·m−1 to 5.5 W·m−1 and 6.0 W·m−1, respectively. In contrast, the differences in the heat exchange amount per meter of the aquifer layer caused by the two boundary conditions fluctuate at 28.1~28.2 W·m−1 within a heating season.

3.2.2. Borehole Temperature

Due to the difference in the initial rock-soil temperature between the surface–bottom temperature boundary and the heat flux boundary, the differences between the transient temperature and the initial rock-soil temperature are discussed in this section, calculated as
ΔTb = Tb (t) − Tg (0)
The transient temperature differences can reflect the influence of the DBGHE heat extraction. The transient temperature differences of less than zero mean that the DBGHE extracts heat from the rocks and soil.
The values of ΔTb along the depths on the 30th day, 60th day, 90th day, and 120th day are shown in Figure 22. The absolute values of ΔTb under the heat flux boundary are larger than those under the surface–bottom temperature boundary condition within most depths, which suggests that more heat is extracted from the strata under the heat flux boundary. At the bottom of the rock-soil domain, under the heat flux boundary, less heat is extracted than that under the surface–bottom temperature boundary. Moreover, the differences in ΔTb caused by the two rock-soil boundary conditions basically remained unchanged over time, with a maximum difference of about 5.1 °C.

3.2.3. Thermal Influence Radius

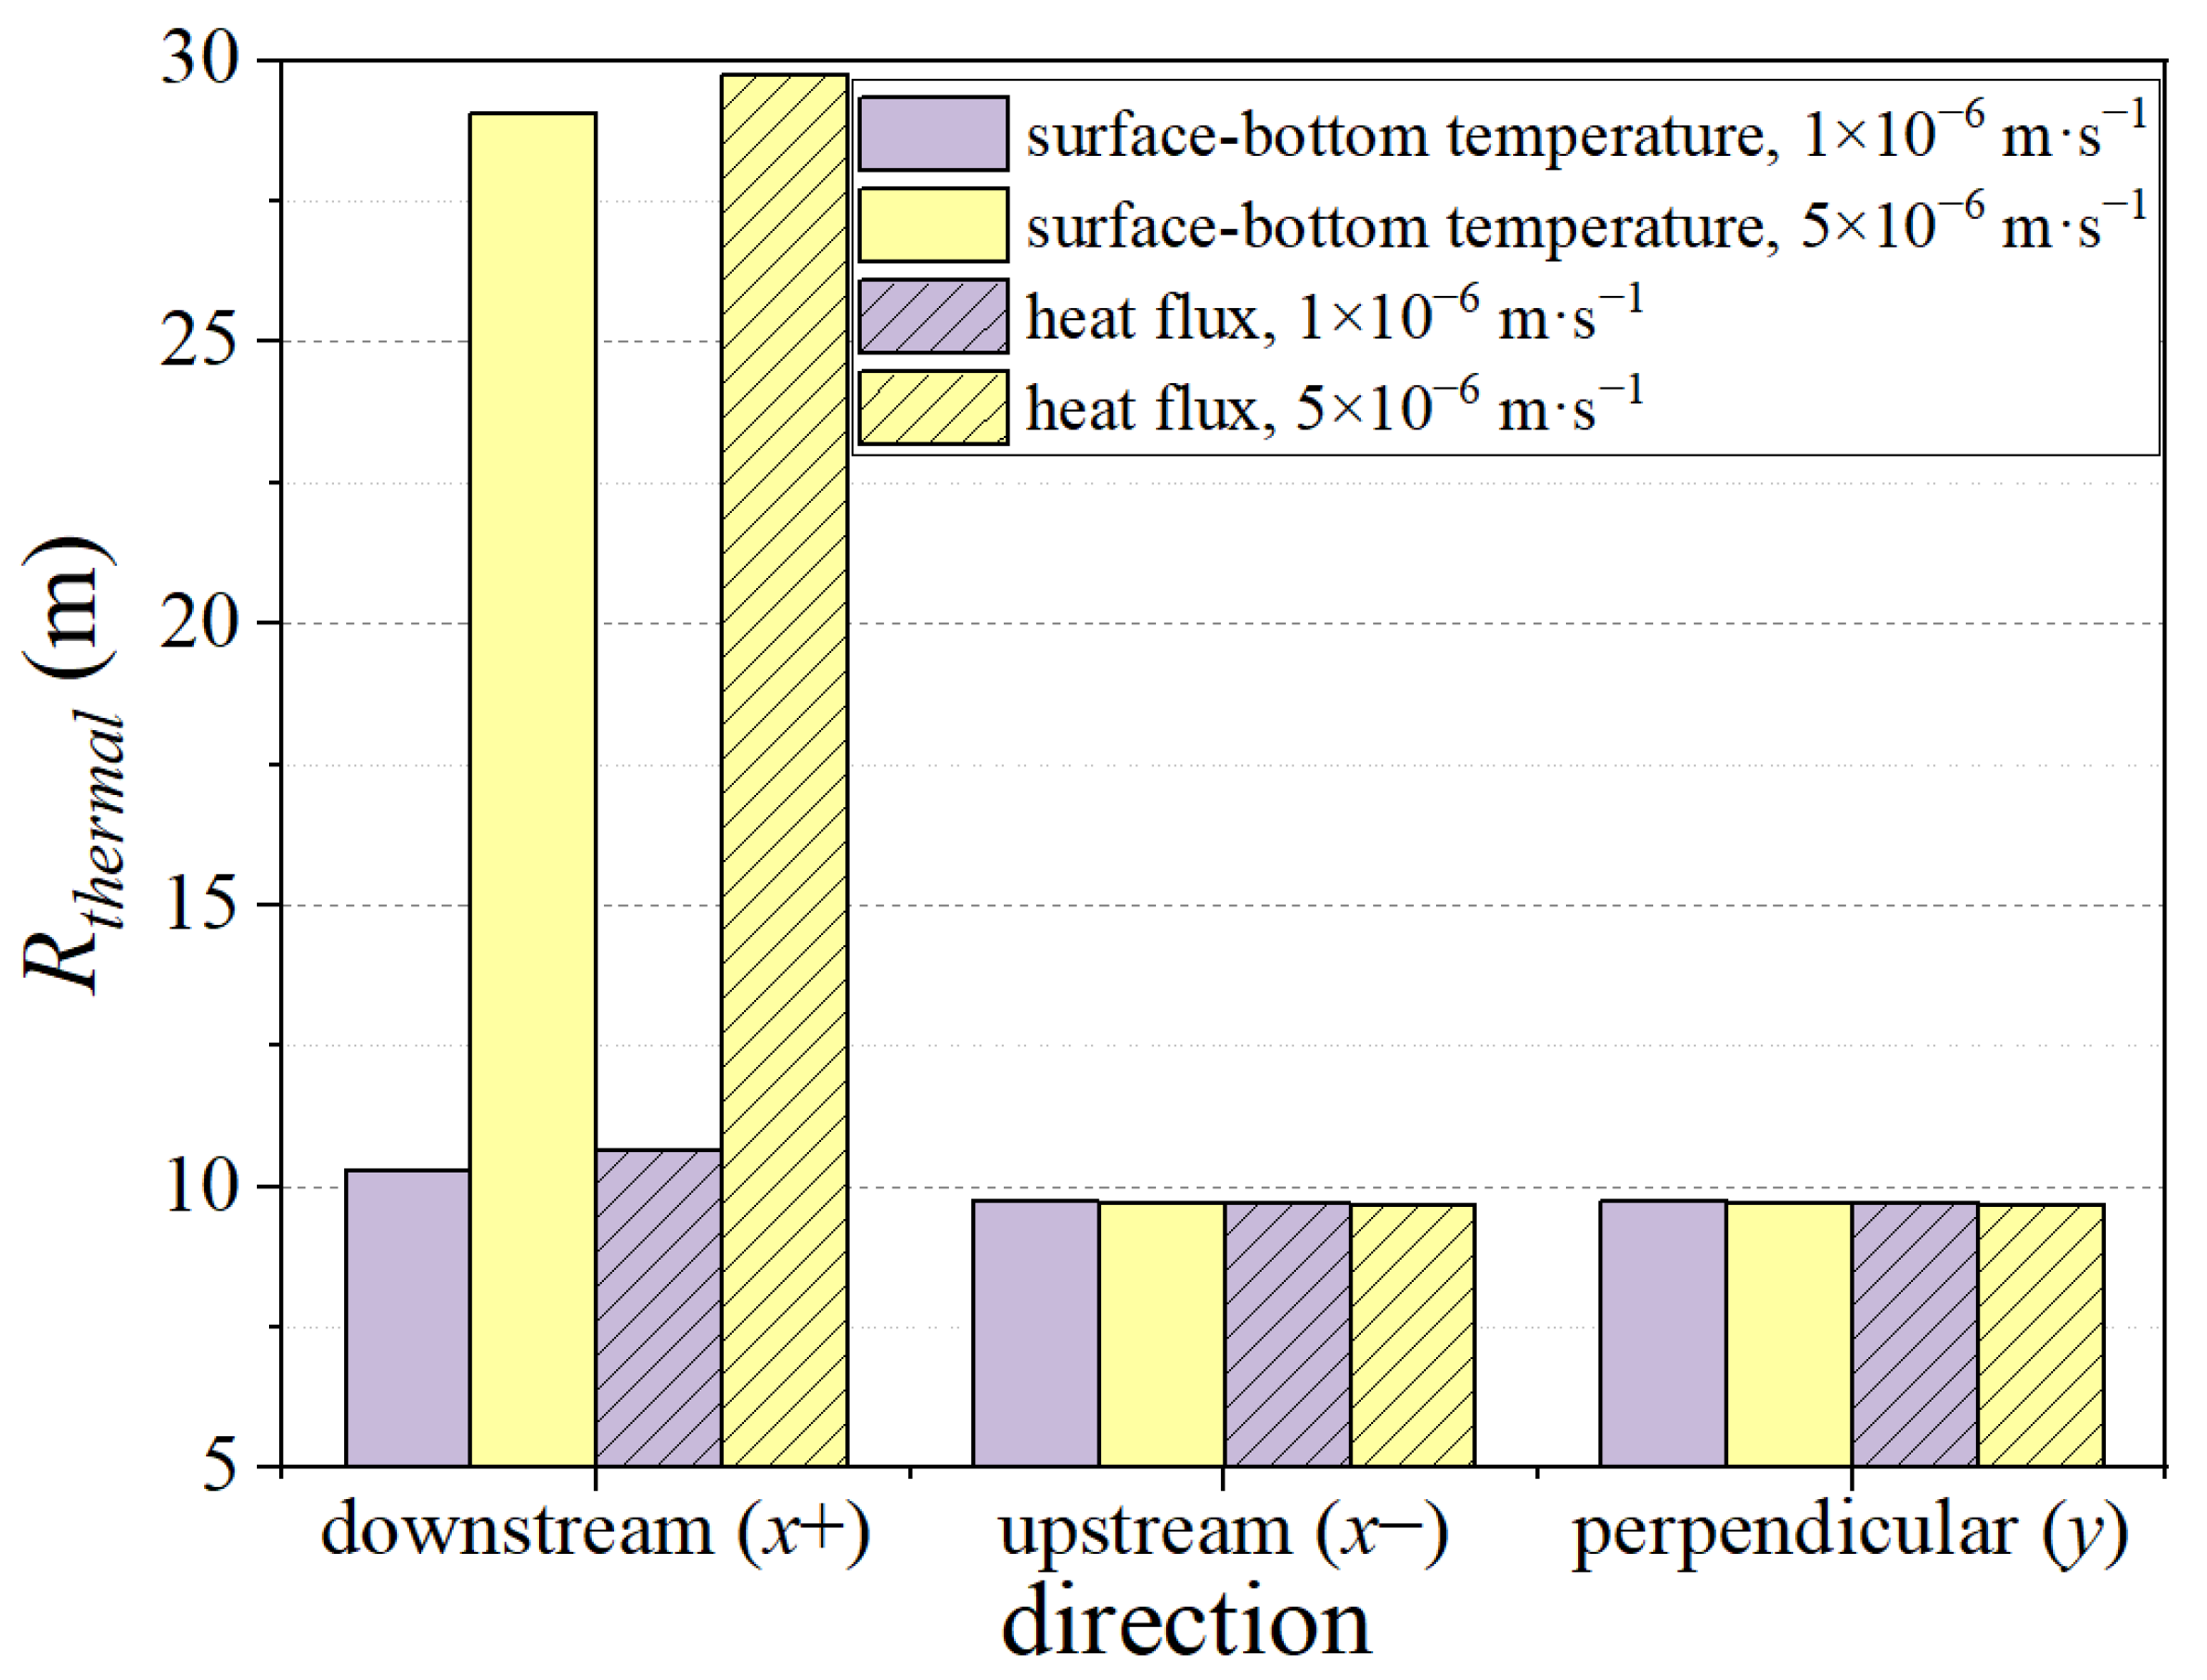
As given in Figure 23, the thermal influence radii under the surface–bottom temperature boundary and heat flux boundary on the 120th day are further analyzed. In the downstream direction, the largest thermal influence radii under the surface–bottom temperature boundary and heat flux boundary are 29.1 m and 29.7 m, respectively, which are at the interface between the middle aquifer and the lower aquifuge. This is because groundwater flow contributes to a larger downstream range influenced by the DBGHE heat extraction in the aquifer layer. In the upstream and perpendicular directions, the thermal influence radii under the two rock-soil boundary conditions peak at 9.7 m, which is at the bottom of the rock-soil domain. The results illustrate that the rock-soil boundary conditions also have little effect on the thermal influence radii at the end of a heating season.

3.2.4. Variation with Groundwater Velocities

The effects of rock-soil boundary conditions on the variations of outlet temperatures, heat extraction amount, and thermal influence radii with the increase of groundwater velocity are further analyzed. It can be seen from Figure 24 that under the two rock-soil boundary conditions, the outlet temperatures and heat extraction amount vary slightly as the groundwater velocity changes from 1 × 10⁻⁸ m·s−1 to 1 × 10⁻⁶ m·s−1 but they change relatively significantly as the groundwater velocity increases from 1 × 10⁻⁶ m·s−1 to 5 × 10⁻⁶ m·s−1. In the subsequent simulations, the groundwater velocities of 1 × 10⁻⁶ m·s−1 and 5 × 10⁻⁶ m·s−1 are selected to further estimate the effects of rock-soil boundaries within a complete operation cycle.
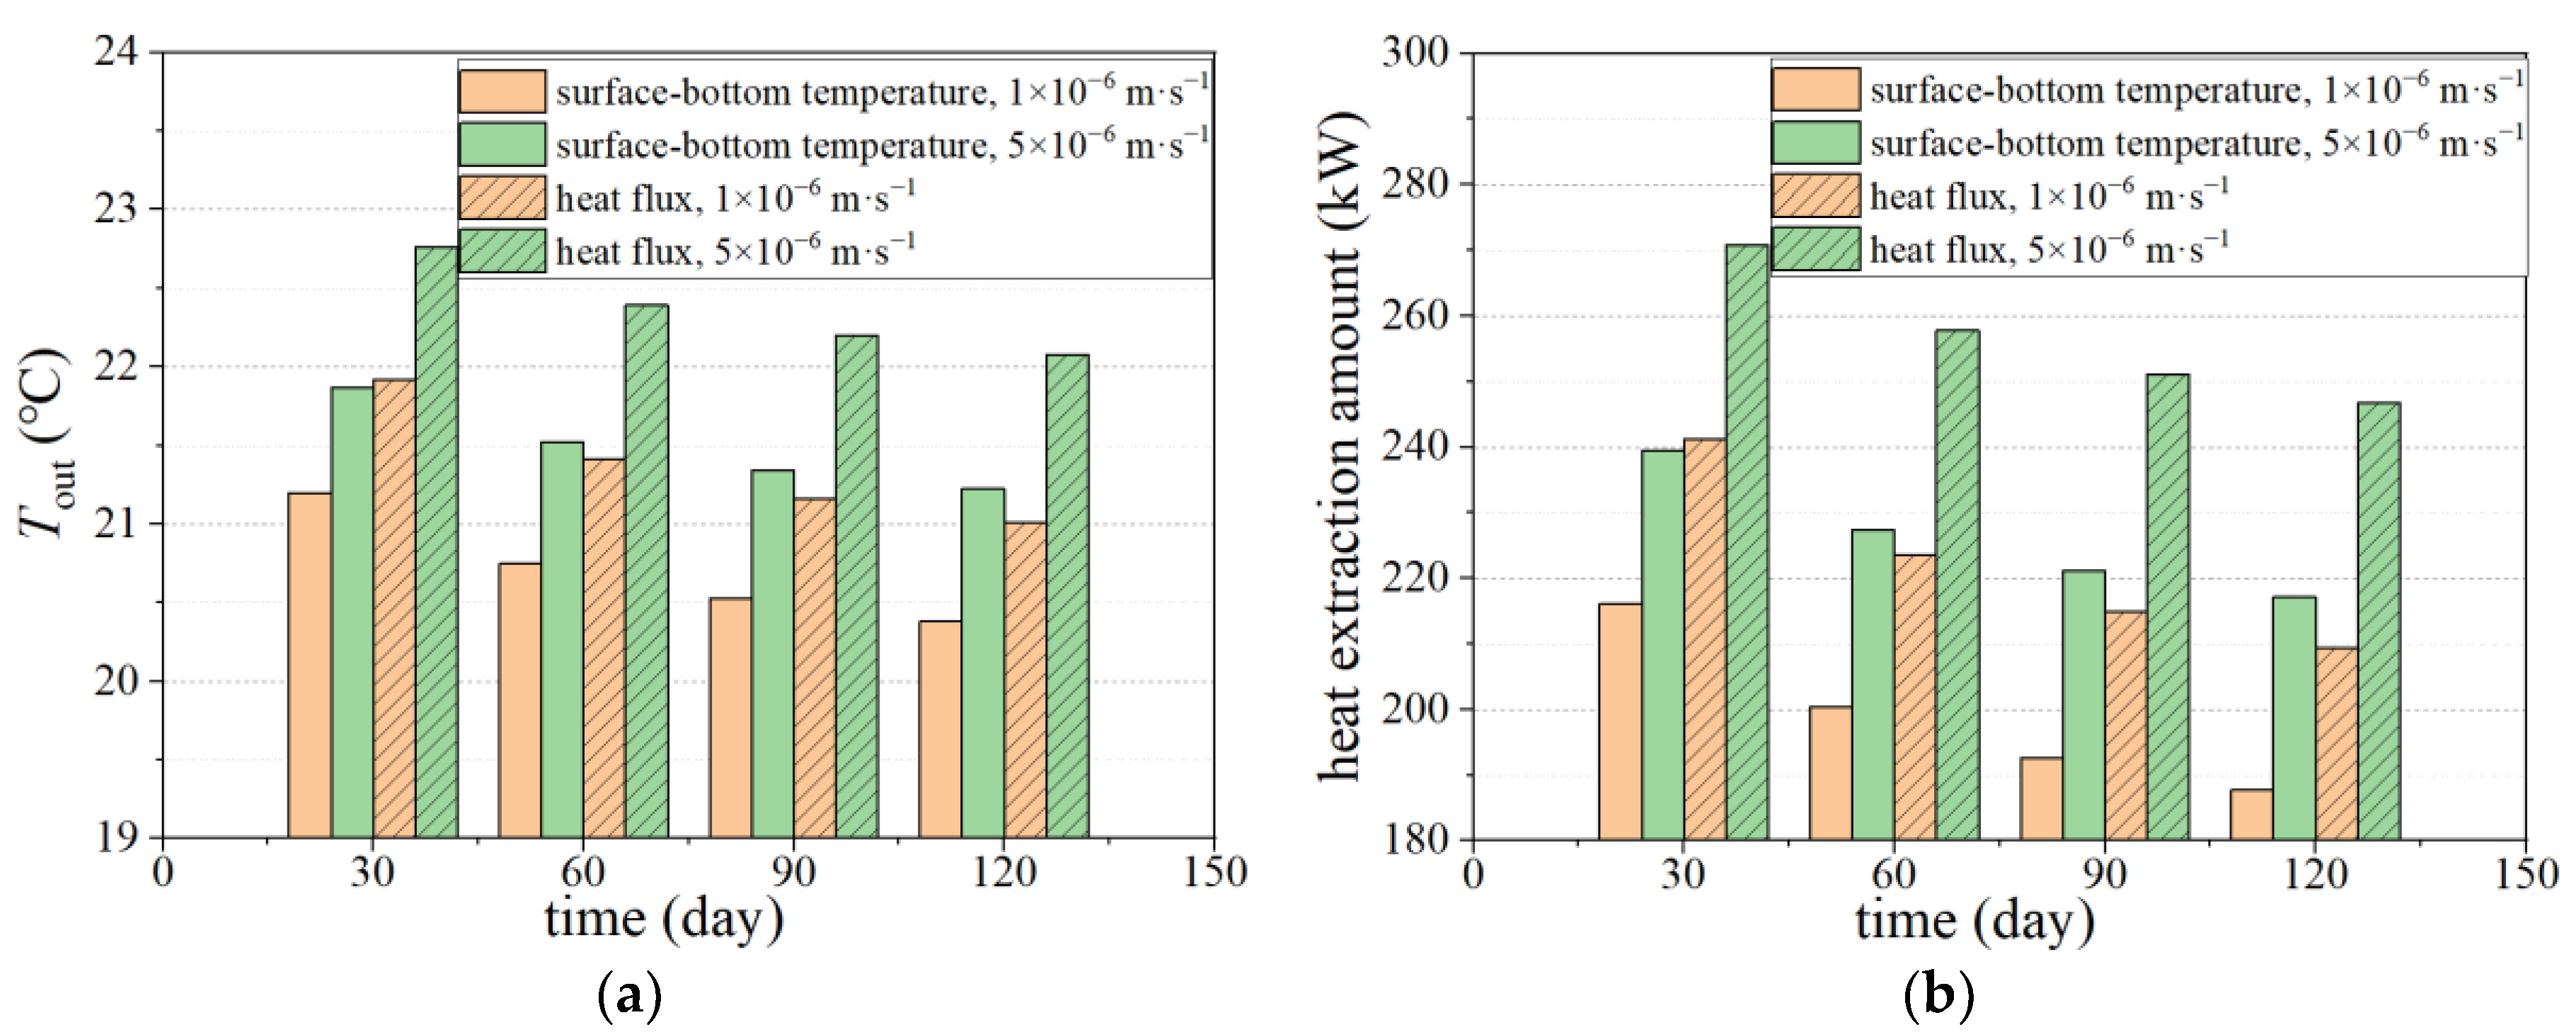
As shown in Figure 25a, with the velocity of groundwater increasing from 1 × 10⁻⁶ m·s−1 to 5 × 10⁻⁶ m·s−1, the outlet temperature increases by less than 1 °C under the surface–bottom temperature boundary but by 0.8–1.1 °C under the heat flux boundary. The heat extraction amounts under the two cases increase by 23.3–29.4 kW and 29.5–37.3 kW, respectively. The relative difference in the increase of heat extraction amounts on the 120th day caused by the rock-soil boundary conditions reaches 26.6%. The results demonstrate that under the surface–bottom temperature boundary, the variations of heat extraction amount and outlet temperatures with the increase of groundwater velocity are slightly smaller than those under the heat flux boundary due to a higher far-field temperature.
Figure 26 gives the maximum thermal influence radii in the downstream, upstream, and perpendicular directions under different groundwater velocities on the 120th day. It can be seen from the figure that under the surface–bottom temperature boundary and heat flux boundary, the maximum thermal influence radii in the downstream direction increase by 18.8 m and 19.1 m, respectively, as the groundwater velocity changes from 1 × 10⁻⁶ m·s−1 to 5 × 10⁻⁶ m·s−1. In the upstream and perpendicular directions, the maximum thermal influence radii are also reduced slightly when the groundwater velocity increases. The analysis illustrates that the thermal influence radii are slightly affected by rock-soil boundary conditions.

4. Conclusions

A three-dimensional full-scale model of DBGHE involving the conductive and convective heat transfer between the DBGHE and the aquifuge and aquifer layers was established in this paper. The influences of inlet and rock-soil boundary conditions on the prediction of DBGHE performance were investigated in detail. The differences in the variations of outlet temperatures, heat exchange amounts, and thermal influence radii with the increase of groundwater velocity caused by different inlet and rock-soil boundary conditions were compared. A numerical study was performed on the DBGHE at a depth of 2000 m with a typical geological formation considering the aquifer layer in this study. The various boundary conditions in DBGHE and rock-soil domains were discussed to provide a reference for selecting appropriate boundary conditions in predicting the performance of DBGHE. The obtained conclusions are as follows:
  • The differences in performance predictions caused by different DBGHE inlet boundary conditions are closely related to the system’s operation time. The differences in the DBGHE performance caused by the constant inlet temperature and constant heating power conditions are relatively larger when the operation time of DBGHE is short. At the end of a heating season, the differences in outlet temperature, heat extraction amount, and the average borehole temperature between the two cases decrease to 17 kW and 2.0 °C, respectively. The inlet boundary conditions have little influence on the thermal influence radii.
  • As the groundwater velocity changes from 1 × 10⁻⁶ m·s−1 to 5 × 10⁻⁶ m·s−1, the outlet temperatures under both the constant inlet temperature and the constant heating power increase. However, the heat extraction amount changes only at the constant inlet temperature and does not change at the constant heating power. Thus, the constant inlet temperature boundary is more appropriate to investigate the effects of aquifer effects and other factors on the performance of DBGHE than the constant heating power condition. When the heat extraction amount is determined, the constant heating power boundary can be used to investigate outlet and inlet temperatures and the surrounding rock-soil temperature to design the operation of DBGHE.
  • The differences in the performance of DBGHE caused by the surface–bottom temperature and heat flux rock-soil boundary conditions decrease slightly with the increase in the operation time of DBGHE. The differences in the heat extraction amounts of DBGHE, the borehole temperature, and the variations of DBGHE’s performance with groundwater velocity under the two rock-soil boundaries are caused by the rock-soil boundary condition results in the different far-field and initial ground temperatures. Thus, it is necessary to set the far-field and initial ground temperatures closest to the actual situation by the rock-soil boundary conditions.

Author Contributions

Conceptualization, Z.M. and L.J.; methodology, Z.M.; software, Z.M. and S.Q.; validation, Z.M. and S.Q.; formal analysis, Z.M.; investigation, Z.M. and S.Q.; resources, G.J.; data curation, Z.M. and G.J.; writing—original draft preparation, Z.M.; writing—review and editing, G.J. and L.J.; visualization, Z.M. and S.Q.; supervision, Y.Z., W.-H.C. and L.J.; project administration, G.J.; funding acquisition, Y.Z. and C.C. All authors have read and agreed to the published version of the manuscript.

Funding

The authors are grateful for support from the Key Laboratory of Coal Resources Exploration and Comprehensive Utilization, Ministry of Natural Resources, China (KF2021-2), Key Research and Development Projects of Shaanxi Province (Program No. 2023-GHZD-54), and Shaanxi Qinchuangyuan Scientist + Engineer Team Construction Project (2022KXJ-049).

Data Availability Statement

The data presented in this study are available on request from the corresponding author.

Conflicts of Interest

The authors declare no conflict of interest.

Nomenclature

Latin Symbols
acoefficient
Acoefficient matrix
Bcoefficient matrix
cpspecific heat capacity (J·kg−1·°C−1)
ffluid
GGgeothermal gradient (°C·m−1)
hconvective heat transfer coefficient (W·m−2·°C−1)
Haquifer/aquifuge thickness (m)
m ˙ mass flow rate (kg·s−1)
nnumber of nodes
qheat flux (W·m−2)
qlheat transfer per meter (W·m−1)
Qheating power (W)
rradius, coordinate, thermal influence radius (m)
Rthermal resistance (K·W−1)
Scross-sectional area (m2)
ttime (s)
Ttemperature (°C)
ugroundwater velocity (m·s−1)
vfluid velocity (m·s−1)
xcoordinate (m)
zcoordinate (m)
Greek Symbols
δdifference of temperature (°C)
θcoordinate
λthermal conductivity (W·m−1·°C−1)
ρdensity (kg·m−3)
Subscripts
aannular
bbackfill
ccentral
gground
ininlet
iinner pipe, number
Iinner surface
jnumber
knumber
mmedia
oouter pipe
Oouter surface
outoutlet
ssoil
sursurface
wwater
0initial
Abbreviation
DBGHEdeep-buried ground heat exchanger
FLSfinite line source
FCSfinite cylinder source
FVM finite volume method
GHEground heat exchanger
MFLSmoving finite line source
MILSmoving infinite line source
SFCSsegmented finite cylinder source
SFLSsegmented finite line source

References

  1. Alimonti, C. Technical Performance Comparison between U-Shaped and Deep Borehole Heat Exchangers. Energies 2023, 16, 1351. [Google Scholar] [CrossRef]
  2. Jia, G.S.; Ma, Z.D.; Zhang, Y.P.; Zhao, M.; Meng, X.Z.; Zhang, L.Y.; Jin, L.W. Series-Parallel Resistance Method Based Thermal Conductivity Model for Rock-Soil with Low or High Porosity. Geothermics 2020, 84, 101742. [Google Scholar] [CrossRef]
  3. Holmberg, H.; Acuña, J.; Næss, E.; Sønju, O.K. Thermal Evaluation of Coaxial Deep Borehole Heat Exchangers. Renew. Energy 2016, 97, 65–76. [Google Scholar] [CrossRef]
  4. Li, C.; Guan, Y.; Wang, X.; Zhou, C.; Xun, Y.; Gui, L. Experimental and Numerical Studies on Heat Transfer Characteristics of Vertical Deep-Buried U-Bend Pipe in Intermittent Heating Mode. Geothermics 2019, 79, 14–25. [Google Scholar] [CrossRef]
  5. Renaud, T.; Verdin, P.; Falcone, G. Numerical Simulation of a Deep Borehole Heat Exchanger in the Krafla Geothermal System. Int. J. Heat Mass Transf. 2019, 143, 118496. [Google Scholar] [CrossRef]
  6. Deng, J.; Wei, Q.; He, S.; Liang, M.; Zhang, H. Simulation Analysis on the Heat Performance of Deep Borehole Heat Exchangers in Medium-Depth Geothermal Heat Pump Systems. Energies 2020, 13, 754. [Google Scholar] [CrossRef] [Green Version]
  7. Luo, Y.; Guo, H.; Meggers, F.; Zhang, L. Deep Coaxial Borehole Heat Exchanger: Analytical Modeling and Thermal Analysis. Energy 2019, 185, 1298–1313. [Google Scholar] [CrossRef]
  8. Luo, Y.; Yu, J.; Yan, T.; Zhang, L.; Liu, X. Improved Analytical Modeling and System Performance Evaluation of Deep Coaxial Borehole Heat Exchanger with Segmented Finite Cylinder-Source Method. Energy Build. 2020, 212, 109829. [Google Scholar] [CrossRef]
  9. Huang, X.; Yao, Z.; Cai, H.; Li, X.; Chen, H. Performance Evaluation of Coaxial Borehole Heat Exchangers Considering Ground Non-Uniformity Based on Analytical Solutions. Int. J. Therm. Sci. 2021, 170, 107162. [Google Scholar] [CrossRef]
  10. Jia, G.S.; Ma, Z.D.; Xia, Z.H.; Zhang, Y.P.; Xue, Y.Z.; Chai, J.C.; Jin, L.W. A Finite-Volume Method for Full-Scale Simulations of Coaxial Borehole Heat Exchangers with Different Structural Parameters, Geological and Operating Conditions. Renew. Energy 2022, 182, 296–313. [Google Scholar] [CrossRef]
  11. Morita, K.; Bollmeier, W.S.; Mizogami, H. Analysis of the Results from the Downhole Coaxial Heat Exchanger (DCHE) Experiment in Hawaii. 1992 Annu. Meet. Geotherm. Resour. Counc. 1992, 16, 17–23. [Google Scholar]
  12. Bu, X.; Ran, Y.; Zhang, D. Experimental and Simulation Studies of Geothermal Single Well for Building Heating. Renew. Energy 2019, 143, 1902–1909. [Google Scholar] [CrossRef]
  13. Fang, L.; Diao, N.; Shao, Z.; Zhu, K.; Fang, Z. A Computationally Efficient Numerical Model for Heat Transfer Simulation of Deep Borehole Heat Exchangers. Energy Build. 2018, 167, 79–88. [Google Scholar] [CrossRef]
  14. Liu, J.; Wang, F.; Cai, W.; Wang, Z.; Wei, Q.; Deng, J. Numerical Study on the Effects of Design Parameters on the Heat Transfer Performance of Coaxial Deep Borehole Heat Exchanger. Int. J. Energy Res. 2019, 43, 6337–6352. [Google Scholar] [CrossRef]
  15. Liu, J.; Wang, F.; Gao, Y.; Zhang, Y.; Cai, W.; Wang, M.; Wang, Z. Influencing Factors Analysis and Operation Optimization for the Long-Term Performance of Medium-Deep Borehole Heat Exchanger Coupled Ground Source Heat Pump System. Energy Build. 2020, 226, 110385. [Google Scholar] [CrossRef]
  16. Dai, C.; Li, J.; Shi, Y.; Zeng, L.; Lei, H. An Experiment on Heat Extraction from a Deep Geothermal Well Using a Downhole Coaxial Open Loop Design. Appl. Energy 2019, 252, 113447. [Google Scholar] [CrossRef]
  17. Li, J.; Xu, W.; Li, J.; Huang, S.; Li, Z.; Qiao, B.; Yang, C.; Sun, D.; Zhang, G. Heat Extraction Model and Characteristics of Coaxial Deep Borehole Heat Exchanger. Renew. Energy 2021, 169, 738–751. [Google Scholar] [CrossRef]
  18. Song, X.; Wang, G.; Shi, Y.; Li, R.; Xu, Z.; Zheng, R.; Wang, Y.; Li, J. Numerical Analysis of Heat Extraction Performance of a Deep Coaxial Borehole Heat Exchanger Geothermal System. Energy 2018, 164, 1298–1310. [Google Scholar] [CrossRef]
  19. Ma, Z.D.; Jia, G.S.; Cui, X.; Xia, Z.H.; Zhang, Y.P.; Jin, L.W. Analysis on Variations of Ground Temperature Field and Thermal Radius Caused by Ground Heat Exchanger Crossing an Aquifer Layer. Appl. Energy 2020, 276, 115453. [Google Scholar] [CrossRef]
  20. Ma, Z.D.; Zhang, Y.P.; Saw, L.H.; Cui, X.; Jia, G.S.; Jin, L.W. Investigation on Local Geothermal Energy Attenuation after Long-Term Operation of Ground Heat Exchanger with Considering Aquifer Effect. Geothermics 2023, 107, 102608. [Google Scholar] [CrossRef]
  21. You, T.; Li, X.; Cao, S.; Yang, H. Soil Thermal Imbalance of Ground Source Heat Pump Systems with Spiral-Coil Energy Pile Groups under Seepage Conditions and Various Influential Factors. Energy Convers. Manag. 2018, 178, 123–136. [Google Scholar] [CrossRef]
  22. Wang, S.; Gao, J.; Zhang, X.; Wang, Y.; Cai, X. Experimental and Numerical Investigations on the Thermal Behavior of Ground Heat Exchanger in Stratified Soils across Unsaturated and Saturated Layers. Appl. Therm. Eng. 2021, 195, 117163. [Google Scholar] [CrossRef]
  23. Song, X.; Zheng, R.; Li, G.; Shi, Y.; Wang, G.; Li, J. Heat Extraction Performance of a Downhole Coaxial Heat Exchanger Geothermal System by Considering Fluid Flow in the Reservoir. Geothermics 2018, 76, 190–200. [Google Scholar] [CrossRef]
  24. Brown, C.S.; Doran, H.; Kolo, I.; Banks, D.; Falcone, G. Investigating the Influence of Groundwater Flow and Charge Cycle Duration on Deep Borehole Heat Exchangers for Heat Extraction and Borehole Thermal Energy Storage. Energies 2023, 16, 2677. [Google Scholar] [CrossRef]
  25. Nian, Y.L.; Cheng, W.L.; Yang, X.Y.; Xie, K. Simulation of a Novel Deep Ground Source Heat Pump System Using Abandoned Oil Wells with Coaxial BHE. Int. J. Heat Mass Transf. 2019, 137, 400–412. [Google Scholar] [CrossRef]
  26. Huang, Y.; Zhang, Y.; Xie, Y.; Zhang, Y.; Gao, X.; Ma, J. Long-Term Thermal Performance Analysis of Deep Coaxial Borehole Heat Exchanger Based on Field Test. J. Clean. Prod. 2021, 278, 123396. [Google Scholar] [CrossRef]
  27. Brown, C.S.; Kolo, I.; Falcone, G.; Banks, D. Investigating Scalability of Deep Borehole Heat Exchangers: Numerical Modelling of Arrays with Varied Modes of Operation. Renew. Energy 2023, 202, 442–452. [Google Scholar] [CrossRef]
  28. Zhang, Y.; Yang, X.; Liu, J.; Liu, B.; Tang, F.; Nowamooz, H. Long-Term Investigation of a Borehole Heat Exchanger (BHE) Array with the Influence of Same Inlet Temperature (SIT) and Same Heat Load (SHL) Boundaries. Adv. Civ. Eng. 2023, 2023, 3232062. [Google Scholar] [CrossRef]
  29. Bu, X.; Ma, W.; Li, H. Geothermal Energy Production Utilizing Abandoned Oil and Gas Wells. Renew. Energy 2012, 41, 80–85. [Google Scholar] [CrossRef]
  30. Bu, X.; Ma, W.; Gong, Y. Electricity Generation from Abandoned Oil and Gas Wells. Energy Sources Part A Recover. Util. Environ. Eff. 2014, 36, 999–1006. [Google Scholar] [CrossRef]
  31. Galoppi, G.; Biliotti, D.; Ferrara, G.; Carnevale, E.A.; Ferrari, L. Feasibility Study of a Geothermal Power Plant with a Double-Pipe Heat Exchanger. Energy Procedia 2015, 81, 193–204. [Google Scholar] [CrossRef]
  32. Fang, L.; Diao, N.; Shao, Z.; Wang, Z.; Fang, Z. Study on Thermal Resistance of Coaxial Tube Boreholes in Ground-Coupled Heat Pump Systems. Procedia Eng. 2017, 205, 3735–3742. [Google Scholar] [CrossRef]
  33. Pan, A.; Lu, L.; Cui, P.; Jia, L. A New Analytical Heat Transfer Model for Deep Borehole Heat Exchangers with Coaxial Tubes. Int. J. Heat Mass Transf. 2019, 141, 1056–1065. [Google Scholar] [CrossRef]
  34. Zhao, Y. Study on Medium-Deep Geothermal HeatExtraction System and Heat Transfer Model; Hebe University of Engineering: Handan, China, 2019. [Google Scholar]
  35. Wu, S.; Shao, R. Analysis of the Conditions of Geothermal Resources in Middle and Deep Layers in Gaoling District. Ground Water 2018, 40, 39–77. [Google Scholar] [CrossRef]
  36. Lin, W.; Cuiling, W.; Jingli, S.; Haonan, G.; Xianfeng, T. Distribution and Exploration of Hot Dry Rock Resources in China:Progress and Inspiration. Acta Geol. Sin. 2021, 95, 1366–1381. [Google Scholar] [CrossRef]
  37. Angelotti, A.; Alberti, L.; La Licata, I.; Antelmi, M. Energy Performance and Thermal Impact of a Borehole Heat Exchanger in a Sandy Aquifer: Influence of the Groundwater Velocity. Energy Convers. Manag. 2014, 77, 700–708. [Google Scholar] [CrossRef]
  38. Guan, Y.; Zhao, X.; Wang, G.; Dai, J.; Zhang, H. 3D Dynamic Numerical Programming and Calculation of Vertical Buried Tube Heat Exchanger Performance of Ground-Source Heat Pumps under Coupled Heat Transfer inside and Outside of Tube. Energy Build. 2017, 139, 186–196. [Google Scholar] [CrossRef]
  39. Chen, C.; Shao, H.; Naumov, D.; Kong, Y.; Tu, K.; Kolditz, O. Numerical Investigation on the Performance, Sustainability, and Efficiency of the Deep Borehole Heat Exchanger System for Building Heating. Geotherm. Energy 2019, 7, 18. [Google Scholar] [CrossRef] [Green Version]
  40. Tian, X.; Liu, C.; Li, K. Modeling of Geothermal Power Generation from Abandoned Oil Wells Using In-Situ Combustion Technology. In Proceedings of the 43rd Workshop on Geothermal Reservoir Engineering, Stanford, CA, USA, 12–14 February 2018; pp. 1–14. [Google Scholar]
  41. Cai, W.; Wang, F.; Liu, J.; Wang, Z.; Ma, Z. Experimental and Numerical Investigation of Heat Transfer Performance and Sustainability of Deep Borehole Heat Exchangers Coupled with Ground Source Heat Pump Systems. Appl. Therm. Eng. 2019, 149, 975–986. [Google Scholar] [CrossRef]
  42. Santa, G.D.; Galgaro, A.; Sassi, R.; Cultrera, M.; Scotton, P.; Mueller, J.; Bertermann, D.; Mendrinos, D.; Pasquali, R.; Perego, R.; et al. An Updated Ground Thermal Properties Database for GSHP Applications. Geothermics 2020, 85, 101758. [Google Scholar] [CrossRef]
  43. Tao, W. Numerical Heat Transfer, 2nd ed.; Xi’an Jiaotong University Press: Xi’an, China, 2001. [Google Scholar]
  44. Li, C.; Guan, Y.; Jiang, C.; Wang, J.; Shi, J.; Cao, H. Study on Heat Transfer Characteristics of the Deep-Buried Ground Heat Exchanger under Different Multi-Pipe Layouts. Geothermics 2022, 100, 102343. [Google Scholar] [CrossRef]
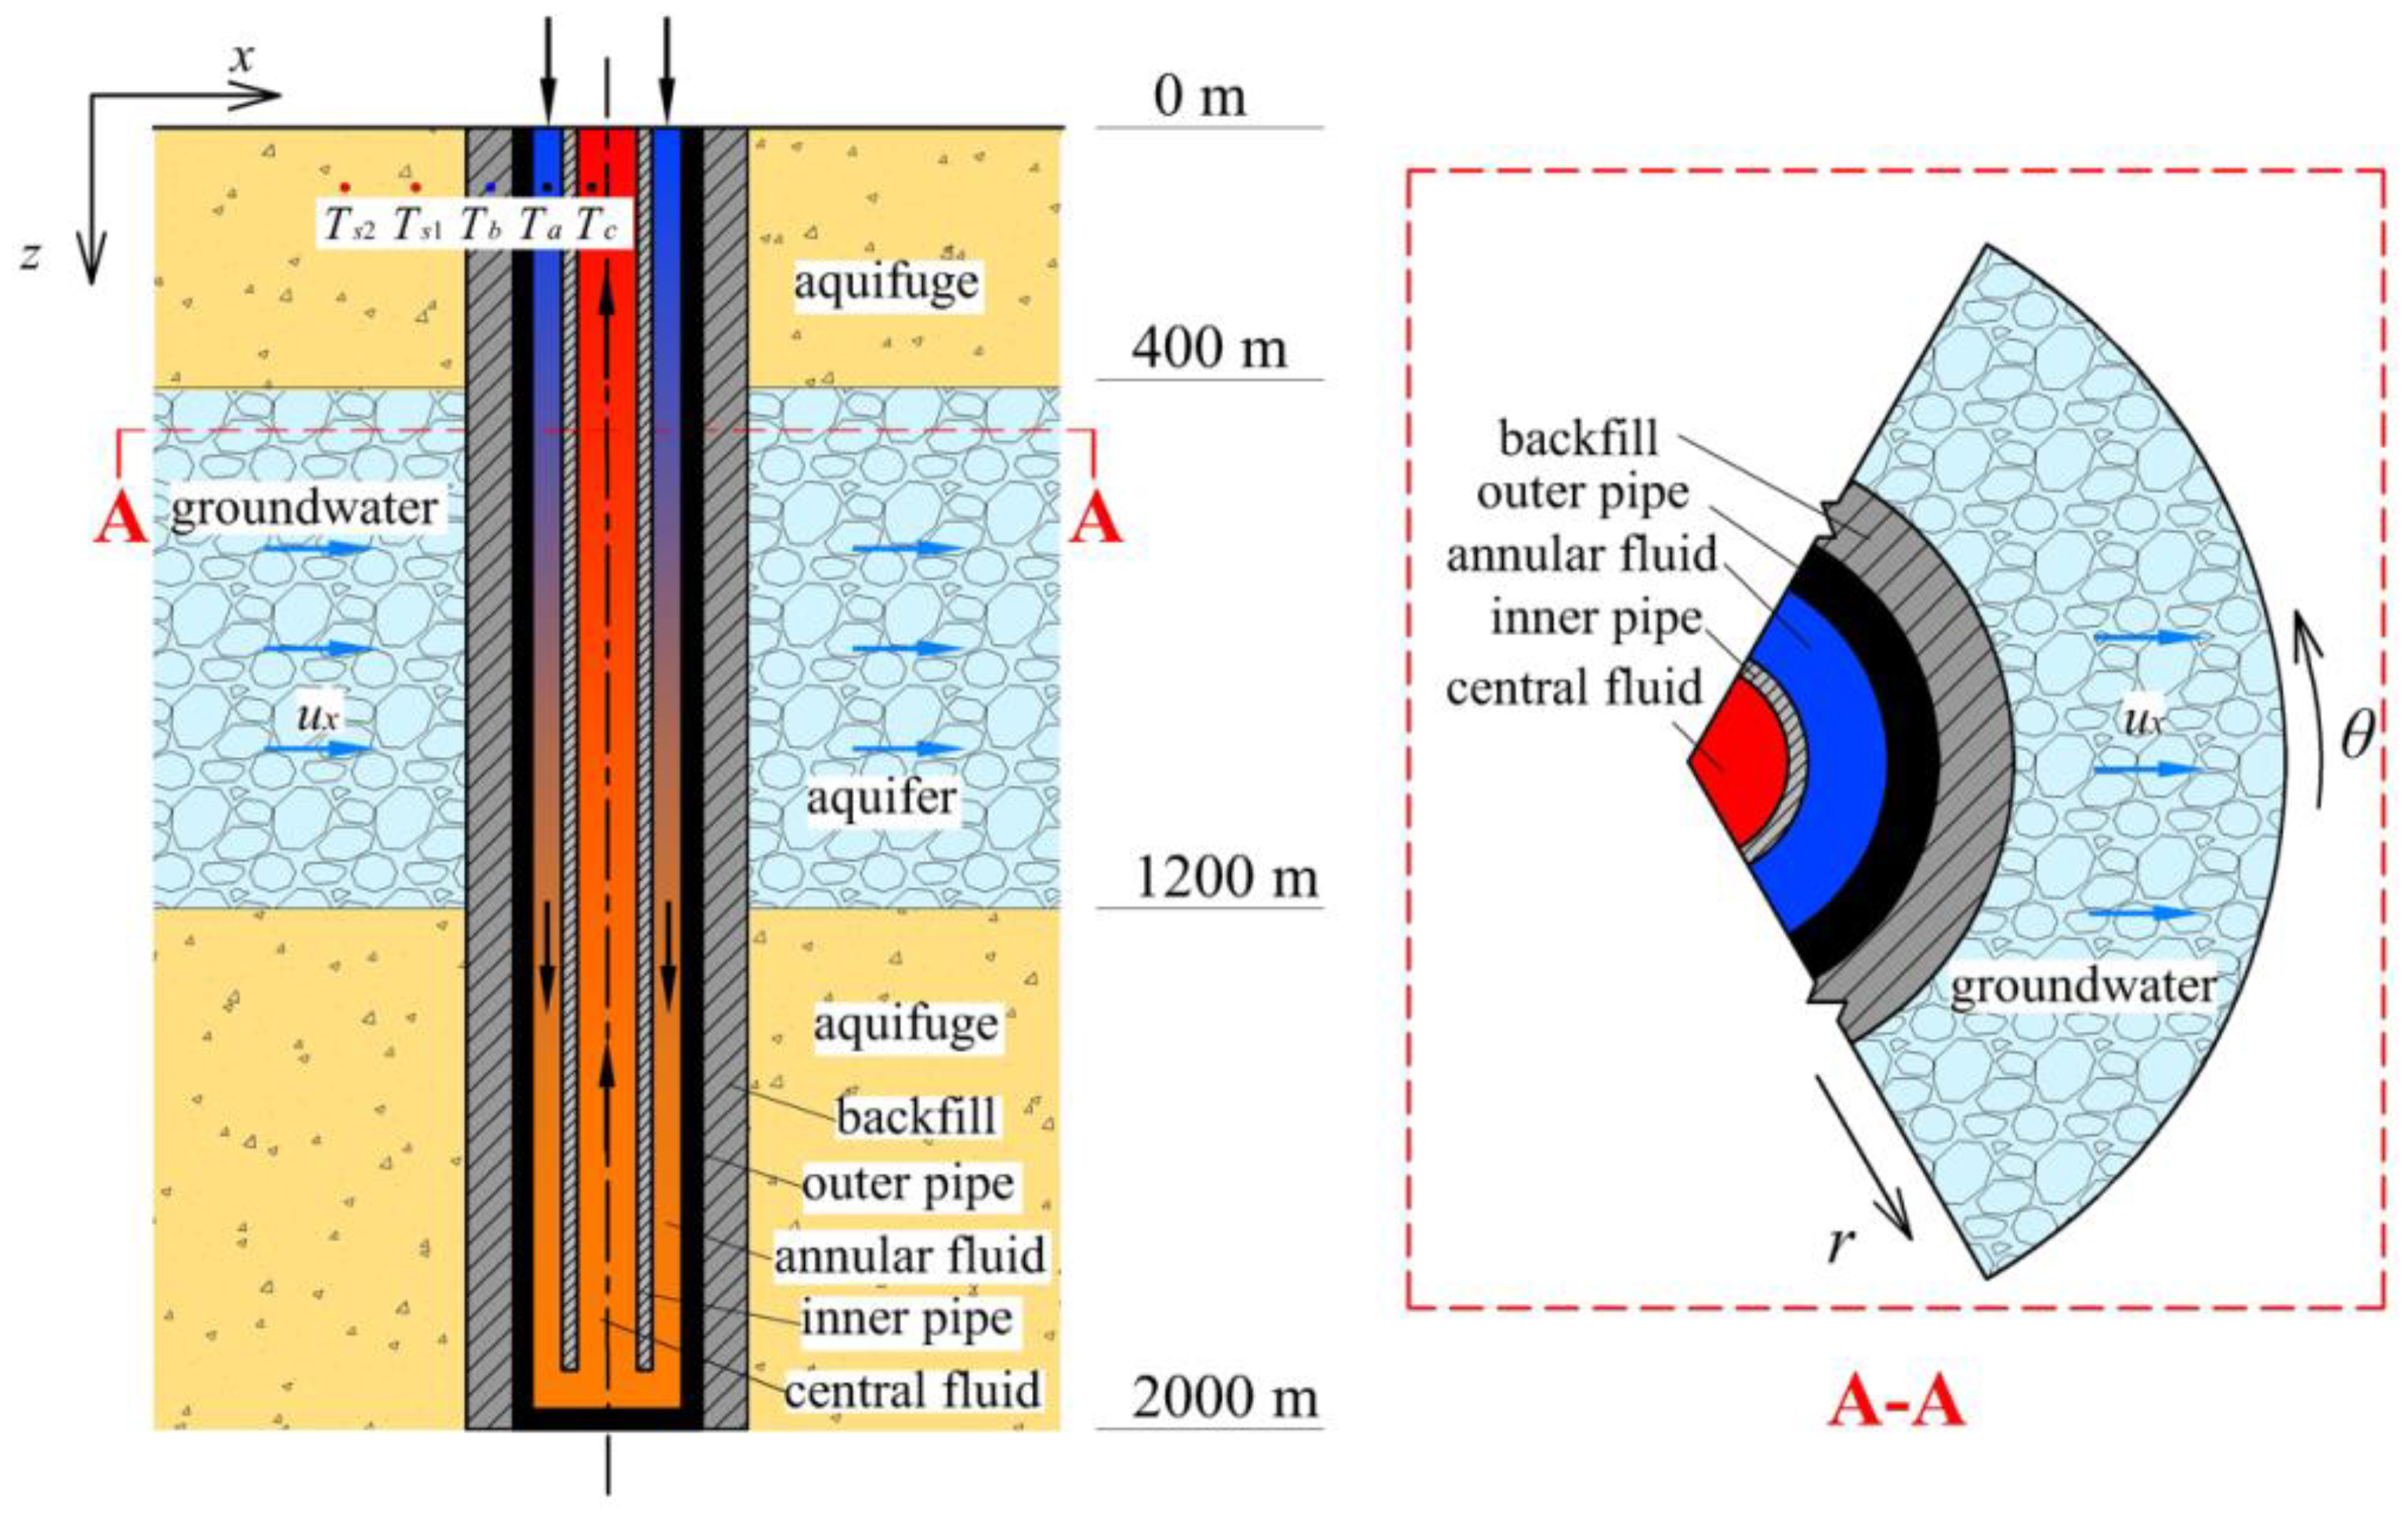
Figure 1. Schematic of the established full-scale DBGHE model and the horizontal plane of aquifer (A-A).
Energies 16 04874 g001
Figure 2. Two kinds of boundary conditions in the soil domain. (a) first kind of thermal boundary condition (b) second kind of temperature boundary condition.
Energies 16 04874 g002
Figure 3. Flow chart of the calculation.
Energies 16 04874 g003
Figure 4. Comparison of inlet and outlet temperatures in the simulation and reference [39].
Energies 16 04874 g004
Figure 5. Ooutlet temperatures on the 10th day, 20th day, and 30th day under mesh amounts of 3.7312 × 10⁶, 6.66 × 10⁶, and 1.0656 × 10⁷.
Energies 16 04874 g005
Figure 6. (a) Outlet and inlet temperatures and (b) heat extraction amounts at a constant inlet temperature with different volumetric flow rates.
Energies 16 04874 g006
Figure 7. Outlet and inlet temperatures at a constant heating power with different volumetric flow rates.
Energies 16 04874 g007
Figure 8. Outlet and inlet temperatures during a short period of 7 days with different inlet temperature conditions under the inner pipe thermal conductivities of (a) 0.45 W·m−1·K−1 and (b) 0.025 W·m−1·K−1.
Energies 16 04874 g008
Figure 9. Outlet and inlet temperatures during a period of 120 days with different inlet temperature conditions.
Energies 16 04874 g009
Figure 10. Heat extraction amount of the DBGHE during a period of 120 days with different inlet temperature conditions.
Energies 16 04874 g010
Figure 11. Heat exchange amount per meter of the DBGHE during a period of 120 days with different inlet temperature conditions in the (a) upper aquifuge layer, (b) middle aquifer layer, and (c) lower aquifuge layer.
Energies 16 04874 g011
Figure 12. Average borehole temperatures along the depths under different inlet temperature conditions on the (a) 30th day, (b) 60th day, (c) 90th day, and (d) 120th day.
Energies 16 04874 g012
Figure 13. Typical example of downstream (x+), perpendicular (y), and upstream (x−) thermal influence radii under the groundwater velocity of 5 × 10⁻⁶ m·s−1.
Energies 16 04874 g013
Figure 14. Thermal influence radii in the (a) downstream direction, (b) upstream direction, and (c) perpendicular direction on the 120th day with different inlet temperature conditions.
Energies 16 04874 g014aEnergies 16 04874 g014b
Figure 15. (a) Outlet temperatures and (b) heat extraction amounts for different groundwater velocities on the 10th day.
Energies 16 04874 g015
Figure 16. (a) Outlet temperatures and (b) heat extraction amounts for different groundwater velocities.
Energies 16 04874 g016
Figure 17. Maximum thermal influence radii in the downstream direction, upstream direction, and perpendicular direction under different groundwater velocities on the 120th day.
Energies 16 04874 g017
Figure 18. Outlet temperatures during a short period of 7 days with different boundary conditions of the rock-soil domain under the inner pipe thermal conductivities of 0.45 W·m−1·K−1 and 0.025 W·m−1·K−1.
Energies 16 04874 g018
Figure 19. Outlet temperatures during a period of 120 days with different boundary conditions of the rock-soil domain.
Energies 16 04874 g019
Figure 20. Heat extraction amount of the DBGHE during a period of 120 days with different boundary conditions of the rock-soil domain.
Energies 16 04874 g020
Figure 21. Heat exchange amount per meter of the DBGHE during a period of 120 days with different boundary conditions of the rock-soil domain in the (a) upper aquifuge layer, (b) middle aquifer layer, and (c) lower aquifuge layer.
Energies 16 04874 g021
Figure 22. Average borehole temperatures along the depths under different rock-soil boundary conditions on the (a) 30th day, (b) 60th day, (c) 90th day, and (d) 120th day.
Energies 16 04874 g022
Figure 23. Thermal influence radii in the (a) downstream direction, (b) upstream direction, and (c) perpendicular direction on the 120th day with different inlet temperature conditions.
Energies 16 04874 g023
Figure 24. (a) Outlet temperatures and (b) heat extraction amount for different groundwater velocities on the 10th day.
Energies 16 04874 g024
Figure 25. (a) Outlet temperatures and (b) heat extraction amount for different groundwater velocities.
Energies 16 04874 g025
Figure 26. Thermal influence radii of the downstream direction, upstream direction, and perpendicular direction for different groundwater velocities on the 120th day.
Energies 16 04874 g026
Table 1. Parameters of the DBGHE.
ParameterValue
inner diameter of inner pipe (2rI,i)95.32 mm
outer diameter of inner pipe (2rI,o)110.00 mm
inner diameter of outer pipe (2rO,i)166.26 mm
outer diameter of outer pipe (2rO,o)178.00 mm
diameter of backfill (2rb)216.00 mm
diameter of soil (2rs)100 m
length (H)2000 m
Table 2. Thermal physical properties of materials in the model [34,40,41,42].
Materialλ (W·m1·K1)cp (J·kg1·K1)ρ (kg·m3)
inner pipe0.025
outer pipe60
backfill2.0014002500
clay1.5914331760
sandstone2.0013442124
limestone2.887932800
Table 3. Setting of cases discussed in Section 3.1.
CaseInlet BoundaryRock-Soil BoundaryGroundwater Velocity (m·s−1)Volumetric Flow Rate (m3·h−1)Inner Pipe’s Thermal Conductivity (W·m−1·K−1)Section
1Constant inlet temperatureSurface–bottom temperature5 × 10−6200.0253.1.1
25 × 10−6300.0253.1.1–3.1.4
35 × 10−6400.0253.1.1
45 × 10−6300.453.1.1
51 × 10−6300.0253.1.4
61 × 10−8300.0253.1.4
7Constant heating powerSurface–bottom temperature5 × 10−6200.0253.1.1
85 × 10−6300.0253.1.1–3.1.4
95 × 10−6400.0253.1.1
105 × 10−6300.453.1.1
111 × 10−6300.0253.1.4
121 × 10−8300.0253.1.4
Table 4. Setting of cases discussed in Section 3.2.
CaseInlet BoundaryRock-Soil BoundaryGroundwater Velocity (m·s−1)Volumetric Flow Rate (m3·h−1)Inner Pipe Thermal Conductivity (W·m−1·K−1)Section
1Constant inlet temperatureSurface–bottom temperature5 × 10−6300.0253.2.1–3.2.4
25 × 10−6300.453.2.1
31 × 10−6300.0253.2.4
41 × 10−8300.0253.2.4
5Constant inlet temperatureHeat flux5 × 10−6300.0253.2.1–3.2.4
65 × 10−6300.453.2.1
71 × 10−6300.0253.2.4
81 × 10−8300.0253.2.4
Disclaimer/Publisher’s Note: The statements, opinions and data contained in all publications are solely those of the individual author(s) and contributor(s) and not of MDPI and/or the editor(s). MDPI and/or the editor(s) disclaim responsibility for any injury to people or property resulting from any ideas, methods, instructions or products referred to in the content.