Article

Carbon Inequality Embodied in Inter-Provincial Trade of China’s Yangtze River Economic Belt

1
Business School, Hohai University, Nanjing 211100, China
2
Yangtze Institute for Conservation and Development, Hohai University, Nanjing 211100, China
*
Author to whom correspondence should be addressed.
Energies 2023, 16(13), 4942; https://doi.org/10.3390/en16134942
Submission received: 27 May 2023 / Revised: 19 June 2023 / Accepted: 23 June 2023 / Published: 25 June 2023
(This article belongs to the Section B1: Energy and Climate Change)

Abstract

:
Regional trade leads to carbon transfer, which in turn raises the issue of carbon inequality. However, less existing research has focused on carbon inequality within megaregions. Combining multi-regional input-output analysis, carbon Gini coefficients and carbon deviation coefficients, this paper presents a comprehensive analysis of carbon equity in inter-provincial trade in the Yangtze River Economic Belt (YEB) from the perspective of economic benefits and environmental pressure. The results show that: (1) Carbon emissions from the production and consumption sides of the 11 provinces in the YEB vary considerably. (2) Significant carbon inequality exists in the YEB region. This is manifested in the unequal relationship between the transfer of embodied carbon emissions and economic benefits, as well as the difference in carbon deviation coefficients. Based on the results of our research, this paper can help provide theoretical support and decision-making reference for implementing a differentiated carbon emission reduction responsibility mechanism and establishing a coordinated carbon emission reduction responsibility system.

1. Introduction

Global warming has become one of the greatest challenges facing human society [1]. Reducing the emission of greenhouse gases (GHG), especially carbon dioxide, has become a consensus among countries around the world to combat global warming [2,3]. Since the reform and opening, with the rapid economic development, China’s carbon emissions have been rising dramatically. Since 2006, China has surpassed the United States as the world’s largest carbon emitter, with 9.899 billion tons of carbon emissions in 2020, accounting for 30.7% of global carbon emissions [4]. In the context of global carbon emission reduction and domestic ecological civilization construction, China solemnly promises to take more effective policy measures to achieve the carbon peak by 2030 and the carbon-neutral goal by 2060 (double carbon). To achieve the “double carbon” target, it is necessary to refine the responsibility of carbon emission reduction to individual provinces and cities. However, the heterogeneity of socio-economic and demographic characteristics of different regions in terms of the development stage, resource endowment, and industrial structure means that the responsibility for carbon emission reduction and low-carbon pathways is heterogeneous across regions.
Due to the differences in their development stages and endowment structures, different countries [5] and regions [6] have comparative advantages in producing goods and services at different stages, which in turn give rise to interregional trade activities. As the frequency of interregional trade increases, it is also necessary to further consider the transfer of carbon emissions embodied in interregional trade, in addition to direct carbon emissions, when determining the carbon emission reduction responsibilities of provinces and cities [7].
The current research on embodied carbon emission transfer is mainly carried out from three aspects. The first is the research on the carbon transfer embodied in international trade. Andrew and Peters [8] reveal that embodied carbon emissions from international trade account for about a quarter of global carbon emissions, and developed countries indirectly export carbon emissions to developing countries through international trade [9]. As the world’s largest carbon emitter, many scholars focus on the study of carbon transfer between China and its international trading partners [10,11,12,13]. The results show that China is a net carbon transfer-in country [14,15], and developed countries, as major international trade partners, reduce carbon emissions by importing Chinese products and services [16,17]. The second is the research on the carbon transfer embodied in interregional trade [18]. Studies focusing on China show that eight regions in China increase carbon emissions through interregional imports and exports [19,20], with the eastern coastal region being the largest net carbon transfer-out region and the northwest region being the largest net carbon transfer-in region in China [14]. In interprovincial trade, the economically developed eastern Chinese regions are the net carbon transfer out to the less developed central and western regions [21,22,23]. The third is the study of embodied carbon emission transfer between industries. Ning et al. [20] point out that the energy industry and heavy industry are the “big producers” of CO2 emissions in China. Sun et al. [24] find that metal smelting and rolling processing, electricity, heat production and supply, petroleum processing, coking, and nuclear fuel processing contribute to most of the carbon transfer in all regions of China. In terms of research methodology, the existing research on carbon embodied in trade mainly uses the input-output (IO) analysis method, which has gone through a range from the single-region input-output (SRIO) model [13,25] to the multi-regional input-output (MRIO) model [26,27,28]. The MRIO model has now become a major analytical tool for studying the embodied carbon emissions in trade between countries or regions because it can incorporate the IO relationships between sectors in multiple regions into the model and more accurately calculate the carbon emissions caused by the trade in intermediate and final products in each region [29]. Reviewing the relevant studies on embodied carbon emission transfer at home and abroad, the existing literature is less focused on the interprovincial trade within the extra-large region.
Trade has led to an unequal relationship between carbon emissions and economic benefits, which has drawn more attention from the academic community to the issue of carbon inequality in related activities [30]. Current studies have mainly focused on measuring carbon inequality in international trade by comparing the relationship between economic development and carbon emissions [31], while relatively few studies have been conducted on interprovincial trade within regions. Hubacek et al. [32] argue that there is a large carbon inequality between developed and developing countries. China suffers greater environmental losses per dollar of value added through exports than almost all of its trading partners [33]. In addition, scholars have applied economic tools to the field of carbon equality, with the Gini coefficient and Theil index being the most widely used [34]. Heil and Wodon [35] first used the Gini index to measure carbon inequality across countries and discussed the relationship between carbon inequality and gross domestic product (GDP) per capita. Since then, the measurement of international carbon inequality has received increasing attention from scholars at home and abroad. Scholars have mostly used the Gini index and Lorenz curves to test the inequality of carbon emissions among countries [36,37] and Chinese provinces [38,39]. Hedenus et al. [40] used the Atkinson index to measure the inequality of per capita emissions across countries. Padilla and Serrano [41] applied the Theil index to emissions inequality and showed that global inequality in per capita emissions is mainly due to inequality in per capita income across countries. Clarke-Sather et al. [42] use the coefficient of variation, the Gini index, and the Theil index to investigate inter-provincial inequality in CO2 emissions within China in 1997–2007. Han et al. [43] determined the decoupling relationship between economic development and carbon emissions based on the Tapio decoupling model and analyzed the inequality of per capita carbon emissions in countries and regions along the Belt and Road using the Thiel index. However, the current studies on carbon inequality using tools such as the Gini coefficient, Theil index, and Atkinson index mainly focus on the inequality of the spatial distribution of carbon emissions per capita from the perspective of the income distribution, while relatively few studies discuss carbon inequality from the perspective of differences in the spatial distribution of population.
Carbon inequality is a global issue, not unique to a particular country or region. The Yangtze River is the world’s largest inland waterway in terms of freight volume, and the Yangtze River Economic Belt (YEB) is a globally influential inland waterway economic belt, but it also brings high carbon emission problems. As one of the most important industrial corridors in China, the YEB emitted 5965.01 Mt CO2 in 2017, accounting for 63.29% of the country’s total CO2 emissions. With the global carbon reduction target, considering regional synergistic carbon reduction in the YEB is important for China to achieve its “double carbon targets. However, the development within the YEB is uneven. The lower reach is growing faster, contributing 24.1% of the total national GDP, while the upper reach and middle reach areas only account for 92.7% of the total GDP of the upper reach. Therefore, the formulation and implementation of regional collaborative carbon emission reduction policies need to consider carbon inequality within the YEB.
The following research gaps have been identified: (1) Current studies related to the embodied carbon transfer in China mainly focus on national and provincial levels. However, there is a lack of relevant studies in macroregions, such as the Pearl River Delta, Yangtze Economic Belt, or Bohai Economic Rim. (2) Current research on carbon inequality is mainly based on the relative amounts of economic benefits and carbon emissions. However, the pressure on the population to emit carbon is an important basis for assessing carbon inequality [44].
To bridge the above research gap, the objective of this paper is to examine carbon inequality within the YEB region at two levels: economic benefits and the pressure on the population to emit carbon. This study mainly answers the following questions: (1) How does inter-provincial trade within the YEB region lead to embodied carbon and value added transfer? (2) How does the carbon deviation coefficient behave within the YEB region? (3) Does carbon inequality exist within the YEB region? Answers to these questions will provide policymakers with theoretical support and references to develop differentiated regional carbon reduction policies.
The remainder of the paper is organized as follows: Section 2 sheds light on the methods and data sources used in the study; Section 3 displays the results; Section 4 presents the discussion and illustrates the policy implications; and Section 5 draws some conclusions.

2. Materials and Methods
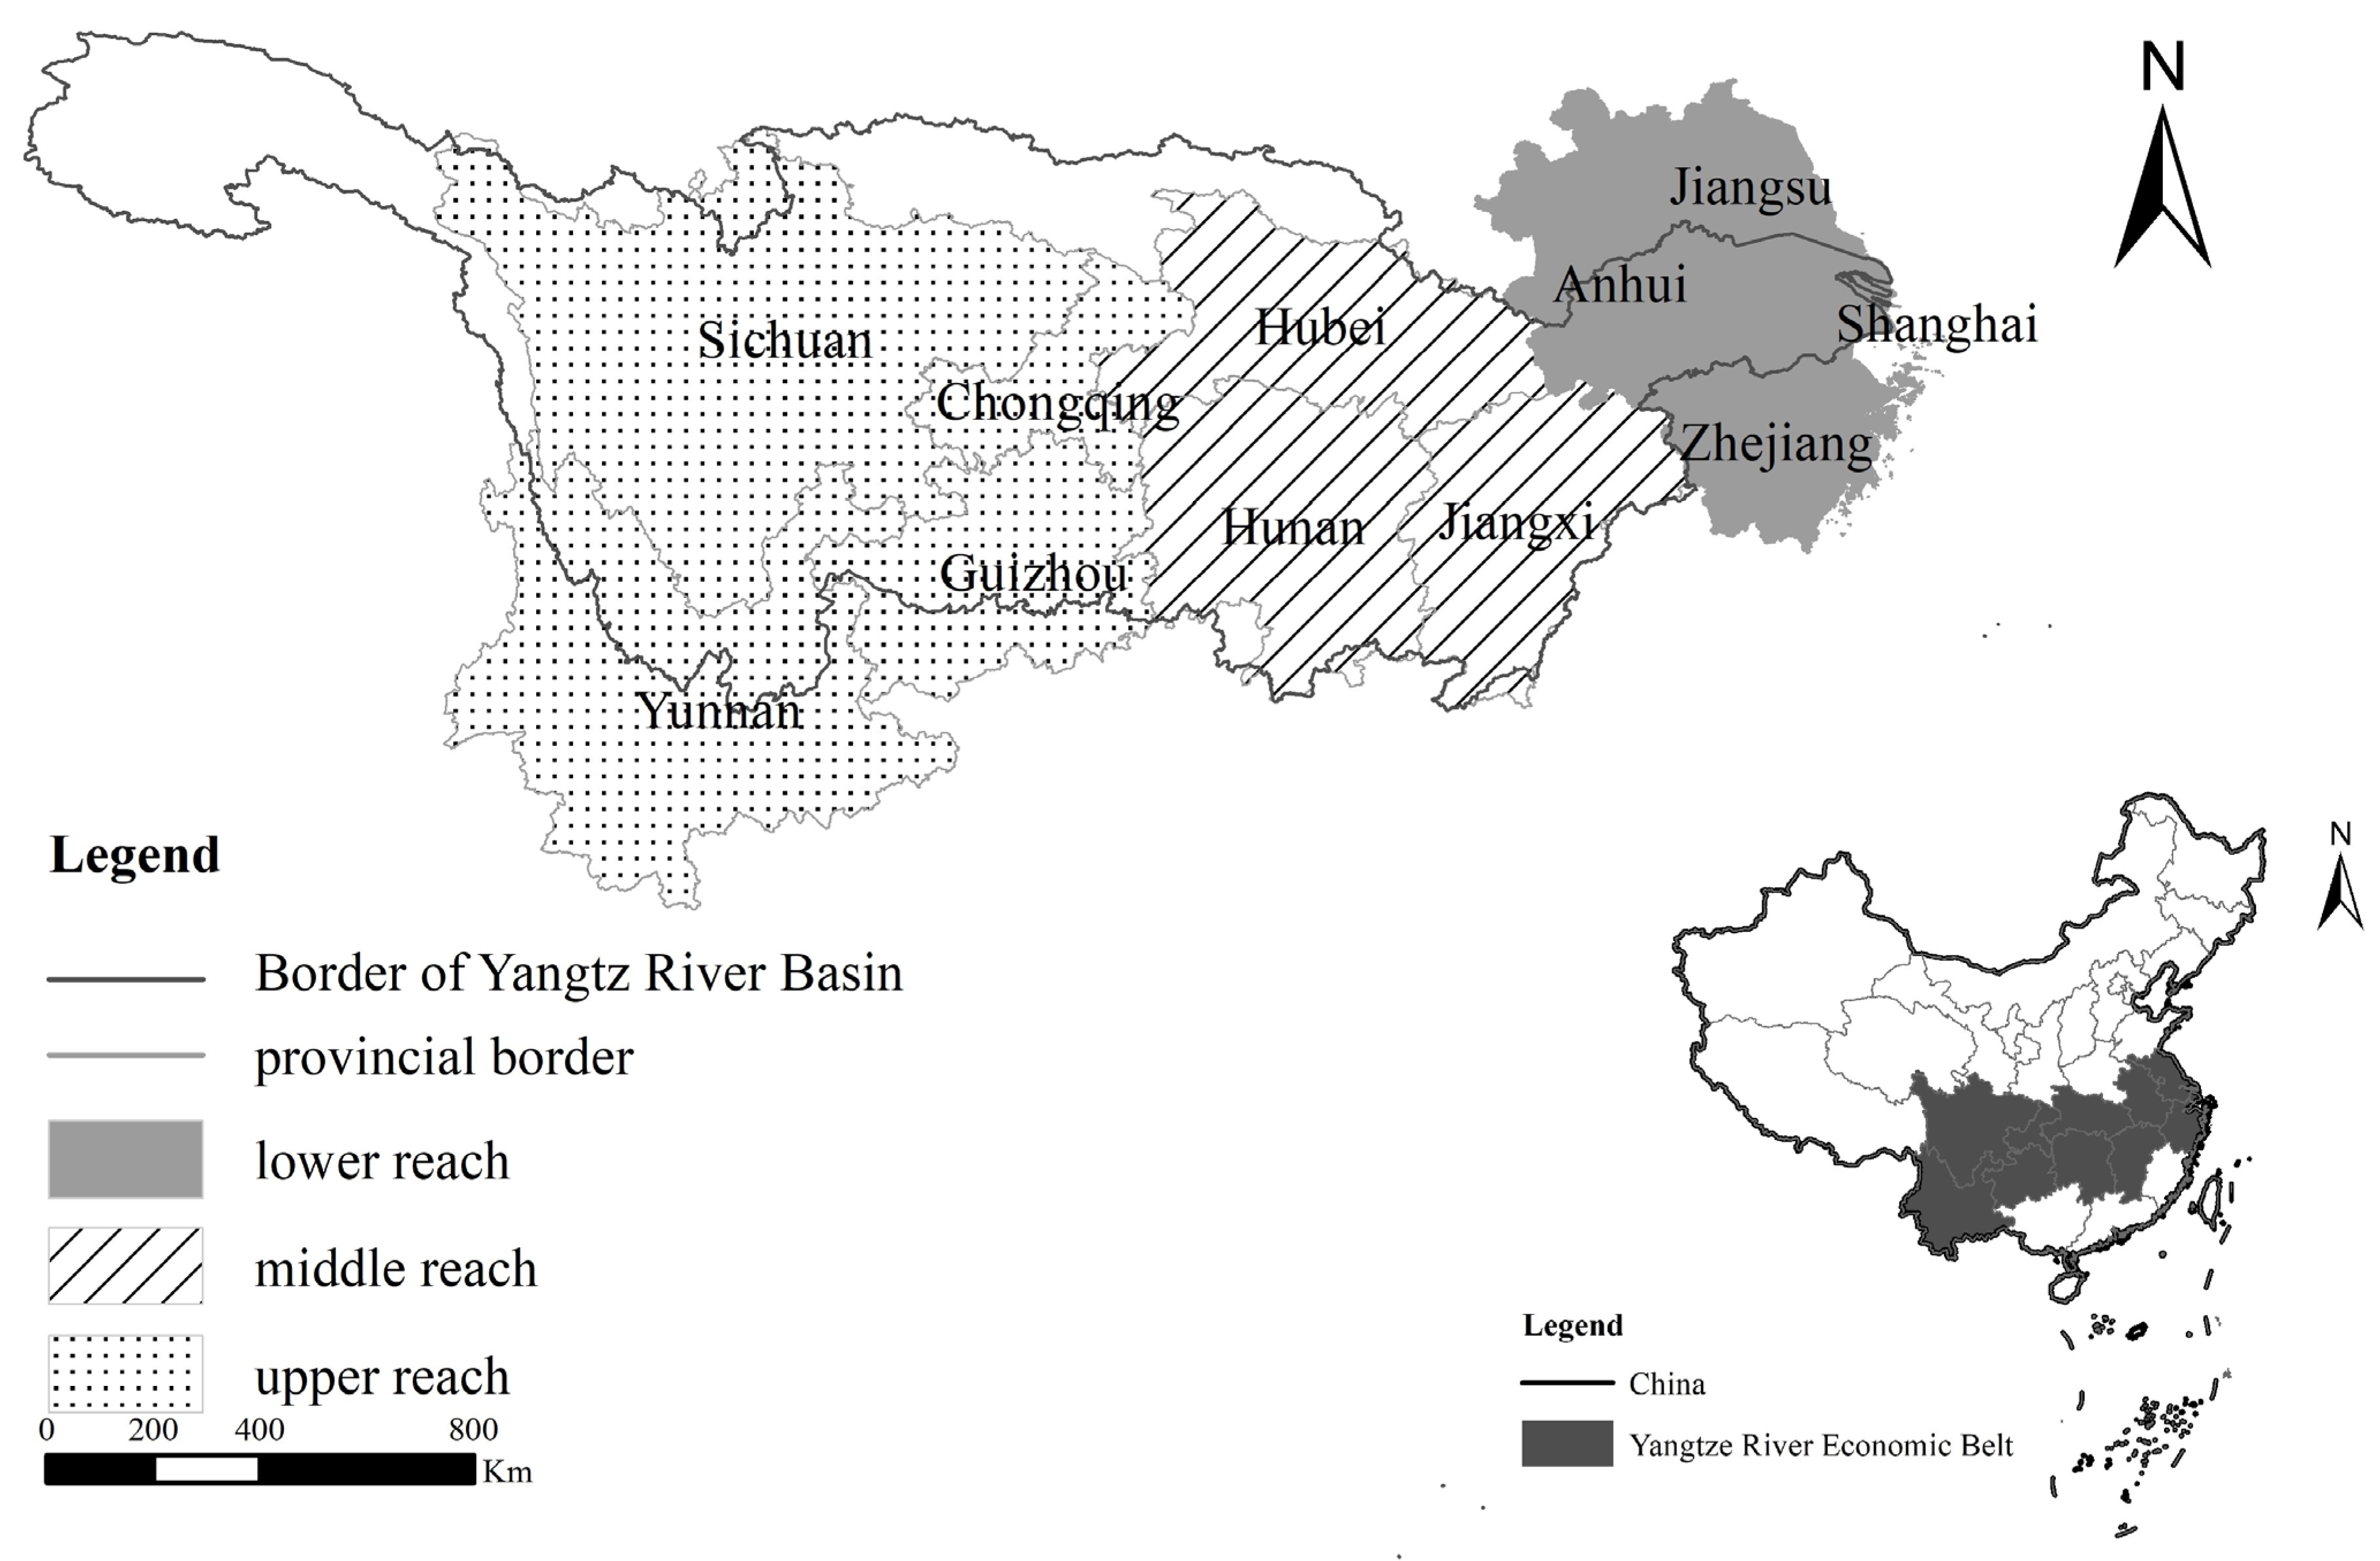
2.1. Study Area

The Yangtze River is the longest river in China and the third-largest in the world. It is a so-called ‘golden waterway’ that ranks first in the world in terms of freight volume on inland rivers. The YEB is one of the major national strategic development regions in China. The YEB covers 11 provinces, including Shanghai, Jiangsu, Zhejiang, Anhui, Jiangxi, Hubei, Hunan, Chongqing, Sichuan, Guizhou, and Yunnan (see Figure 1). The YEB spans China’s eastern, central, and western regions and is an important transportation hub and economic link between northern and southern China. It is not only a high-density economic corridor but also one of the most important industrial corridors in China. Along with rapid economic growth, the YEB is facing increasingly severe environmental pressures.

2.2. Methodology

2.2.1. YEB-MRIO Table Compilation

Based on the MRIO table for 31 Chinese provinces and cities (C-MRIO table) in 2017, This paper constructs the YEB-MRIO in 2017 (see Table 1). Since the C-MRIO table contains G regions and N socioeconomic sectors (G = 31, N = 42), we consider the 20 regions in the C-MRIO table except YEB as one region (Region 12), aggregate the intermediate inputs, intermediate demand, and final demand of these 20 regions to obtain the relevant values for Region 12, and compile the YEB-MRIO table (G = 12, N = 42). The results of processing tests on the YEB-MRIO table show that the total input still equals the total output.
where, Z rs is the matrix of intermediate product flows between Region R and Region S as a 42 × 42 matrix. Y rs is the matrix of final product supplied by Region R to Region S, E r and X r represent the exports and total output of Region R, respectively, both as 42 × 1 column vectors. M s and V s represent imports and value added of Region S, respectively, both as 1 × 42 row vectors.
According to Leontief [45], the basic equation containing G regions and N sectors of the MRIO table (without exports) is:
A 11 A 12 A 1 G A 21 A 22 A 2 G A G 1 A G 2 A G G X 1 X 2 X G + Y 1 Y 2 Y G = X 1 X 2 X G
where, the technical coefficient matrix A rs is defined as A rs = Z rs / X s , and the sequence of subscripts represents the flow direction, which is N × N matrices. Y r = s = 1 G Y rs is the final demand of Region R, X r is the total output of Region R, both are N × 1 column vectors.

2.2.2. Embodied Carbon and Value Added Transfer Calculation

This paper focuses on the carbon inequality within the YEB region, so the calculation excludes the import and export volumes and carbon embodied in inter-regional trade outside the YEB region. Referring to Chen et al. [46], the production-based carbon emissions (PBEs) of Region R, namely the carbon emissions generated by Region R to meet the final demand of local and other regions, are calculated as follows:
C P R = S = 1 11 ε R ^ I A 1 Y S ^
where, C p R is the PBEs of Region R. ε R ^ denotes the carbon emission of each region due to one unit of total output within Region R, and is the diagonal matrix of complete consumption coefficient of carbon emission of Region R. A , I A 1 , and Y S ^ represent the matrix of direct consumption coefficient, Leontief inverse matrix, and diagonal matrix of final demand of Region S, respectively, all of which are GN × GN matrices.
The consumption-based carbon emissions (CBEs) of Region R, namely the carbon emissions of Region R and other regions due to meeting the final demand in Region R, are calculated by the following equation:
C C R = S = 1 11 ε S ^ I A 1 Y R ^
where, C C R is the CBEs of Region R. ε S ^ denotes the carbon emissions of each region caused by one unit of total output in Region S, and is the diagonal matrix of the complete consumption factor of carbon emissions of Region S. Y R ^ is the diagonal matrix of final demand of Region R, and is the GN × GN matrix.
The net transfer of carbon emissions from Region R to Region S ( C net R ) is the difference between the CBEs and PBEs of Region R, as shown in Equation (4). When C net R is positive, carbon emission pollution is transferred from Region R to Region S (favorable to Region R). Otherwise, carbon emissions are transferred from Region S to Region R; that is, Region R bears part of the carbon emissions for other regions (unfavorable to Region R).
C n e t R = E C R E P R
In inter-regional trade, carbon emissions and economic gains are two indicators moving in opposite directions. The embodied value added transfer is calculated as follows:
V n e t R = S = 1 11 D S ^ I A 1 Y R ^ S = 1 11 D R ^ I A 1 Y S ^
where, D S ^ = V s / X s is the diagonal matrix of value added coefficients for Region S and D R ^ = V R / X R is the diagonal matrix of value added coefficients for Region R. D S ^ I A 1 Y R ^ represents the amount of value added growth in Region R and other regions due to final demand consumption in Region R, and D R ^ I A 1 Y S ^ represents the amount of value added growth in Region R due to final demand consumption in Region R and other regions. V net R being positive means that Region R becomes an embodied value added exporter through inter-provincial trade (unfavorable to Region R), otherwise value added is transferred from Region S to Region R (favorable to Region R).

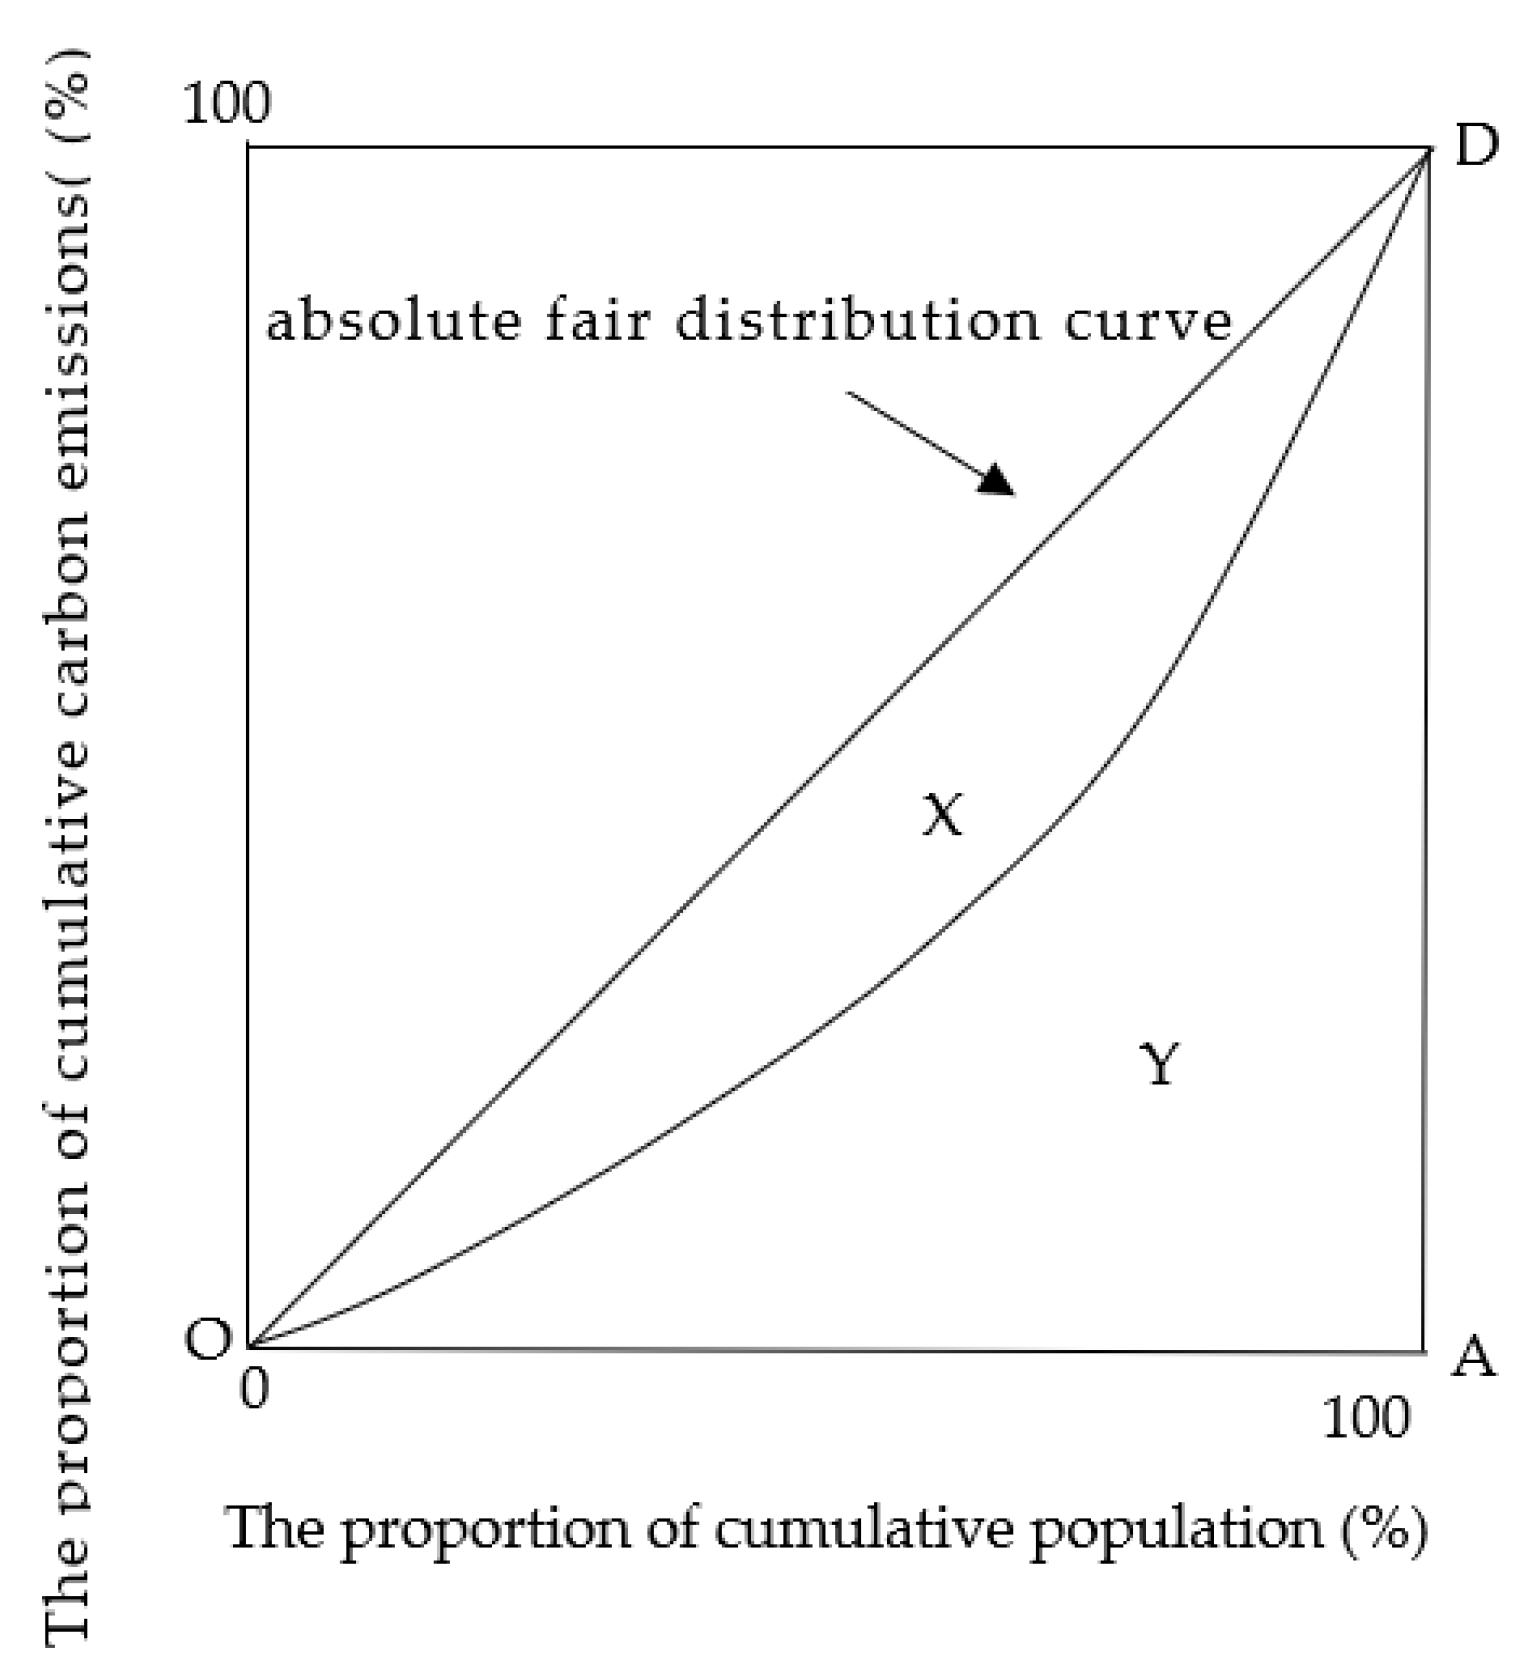
2.2.3. Carbon Gini Coefficient and Deviation Coefficient Calculation

From the perspective of the spatial distribution of carbon emissions, the relationship between carbon emissions and population distribution can be analyzed by the carbon Gini coefficient. Based on the Lorentz curve, the per capita PBEs and CBEs of eleven provinces are ranked from smallest to largest, then the horizontal axis and the vertical axis indicate the cumulative population share and cumulative carbon emission share, and the points where each province and city is located in the coordinate system are connected by a smooth curve to obtain the carbon Lorenz curve (see Figure 2). The diagonal line OD represents the absolute fair distribution curve and the arc OD represents the actual distribution curve. The more the actual distribution curve deviates from the absolute fair distribution curve, the more inequitable the distribution is. Let the area between the actual distribution curve and the absolute fair distribution curve be X, and the area to the lower right of the actual distribution curve be Y. The quotient of X divided by (X+Y) represents the degree of inequality, i.e. the carbon Gini coefficient. The regional OAD is divided into eleven small trapezoids according to the points where each province is located, and the sum of the trapezoid areas is used to approximate the value of Y instead. Since X + Y = 5000 , its calculation formula is as follows:
G = 1 0.0001 n = 1 11 X n X n 1 Y n + Y n 1
where, G is the carbon Gini coefficient, X n and Y n represent the proportion of cumulative population and cumulative carbon emissions, respectively, when n = 1 ,   X n 1 = 0 ,   Y n 1 = 0 .
From the perspective of the difference in the spatial distribution of carbon emissions among the population, the carbon deviation coefficient can indicate the difference in the pressure of carbon emissions on people. The carbon deviation coefficient ( PC ) of each province and city is the ratio of each province and city’s share of carbon emissions ( C n ) in the YEB to its share of the population ( P n ). If it is greater than 1, the share of carbon emissions in the YEB is greater than the share of the population; that is, the local population bears more carbon emission pressure; otherwise, the opposite is true. Its calculation formula is as follows.
P C = C n P n

2.3. Data Source

In this paper, we use three main types of datasets: the IO table, CO2 emissions and value added, and demographic data. (1) The YEB-MRIO in this paper is based on the MRIO table for China [47]. We obtained the MRIO table for 31 provinces of China (except Taiwan Province, Hong Kong Special Administrative Region, and Macao Special Administrative Region) with 42 industrial sectors (Table A1, Appendix A) from the Carbon Emission Accounts and Datasets for Emerging Economics (CEADs, https://www.ceads.net.cn/, accessed on 17 June 2023) [48]. (2) CO2 emissions and value added for the 11 provinces in the YEB in 2017 were obtained from the CEADs (https://www.ceads.net.cn/, accessed on 17 June 2023) and are shown in Table A2 and Table A3, Appendix B. (3) The demographic data of 11 provinces in YEB in 2017 (Table A4, Appendix C) were obtained based on the China Statistical Yearbook-2018 (http://www.stats.gov.cn/sj/ndsj/2018/indexch.htm, accessed on 17 June 2023). As China’s MRIO table is only updated every five years, this paper uses the most recent 2017 data currently available.

3. Results

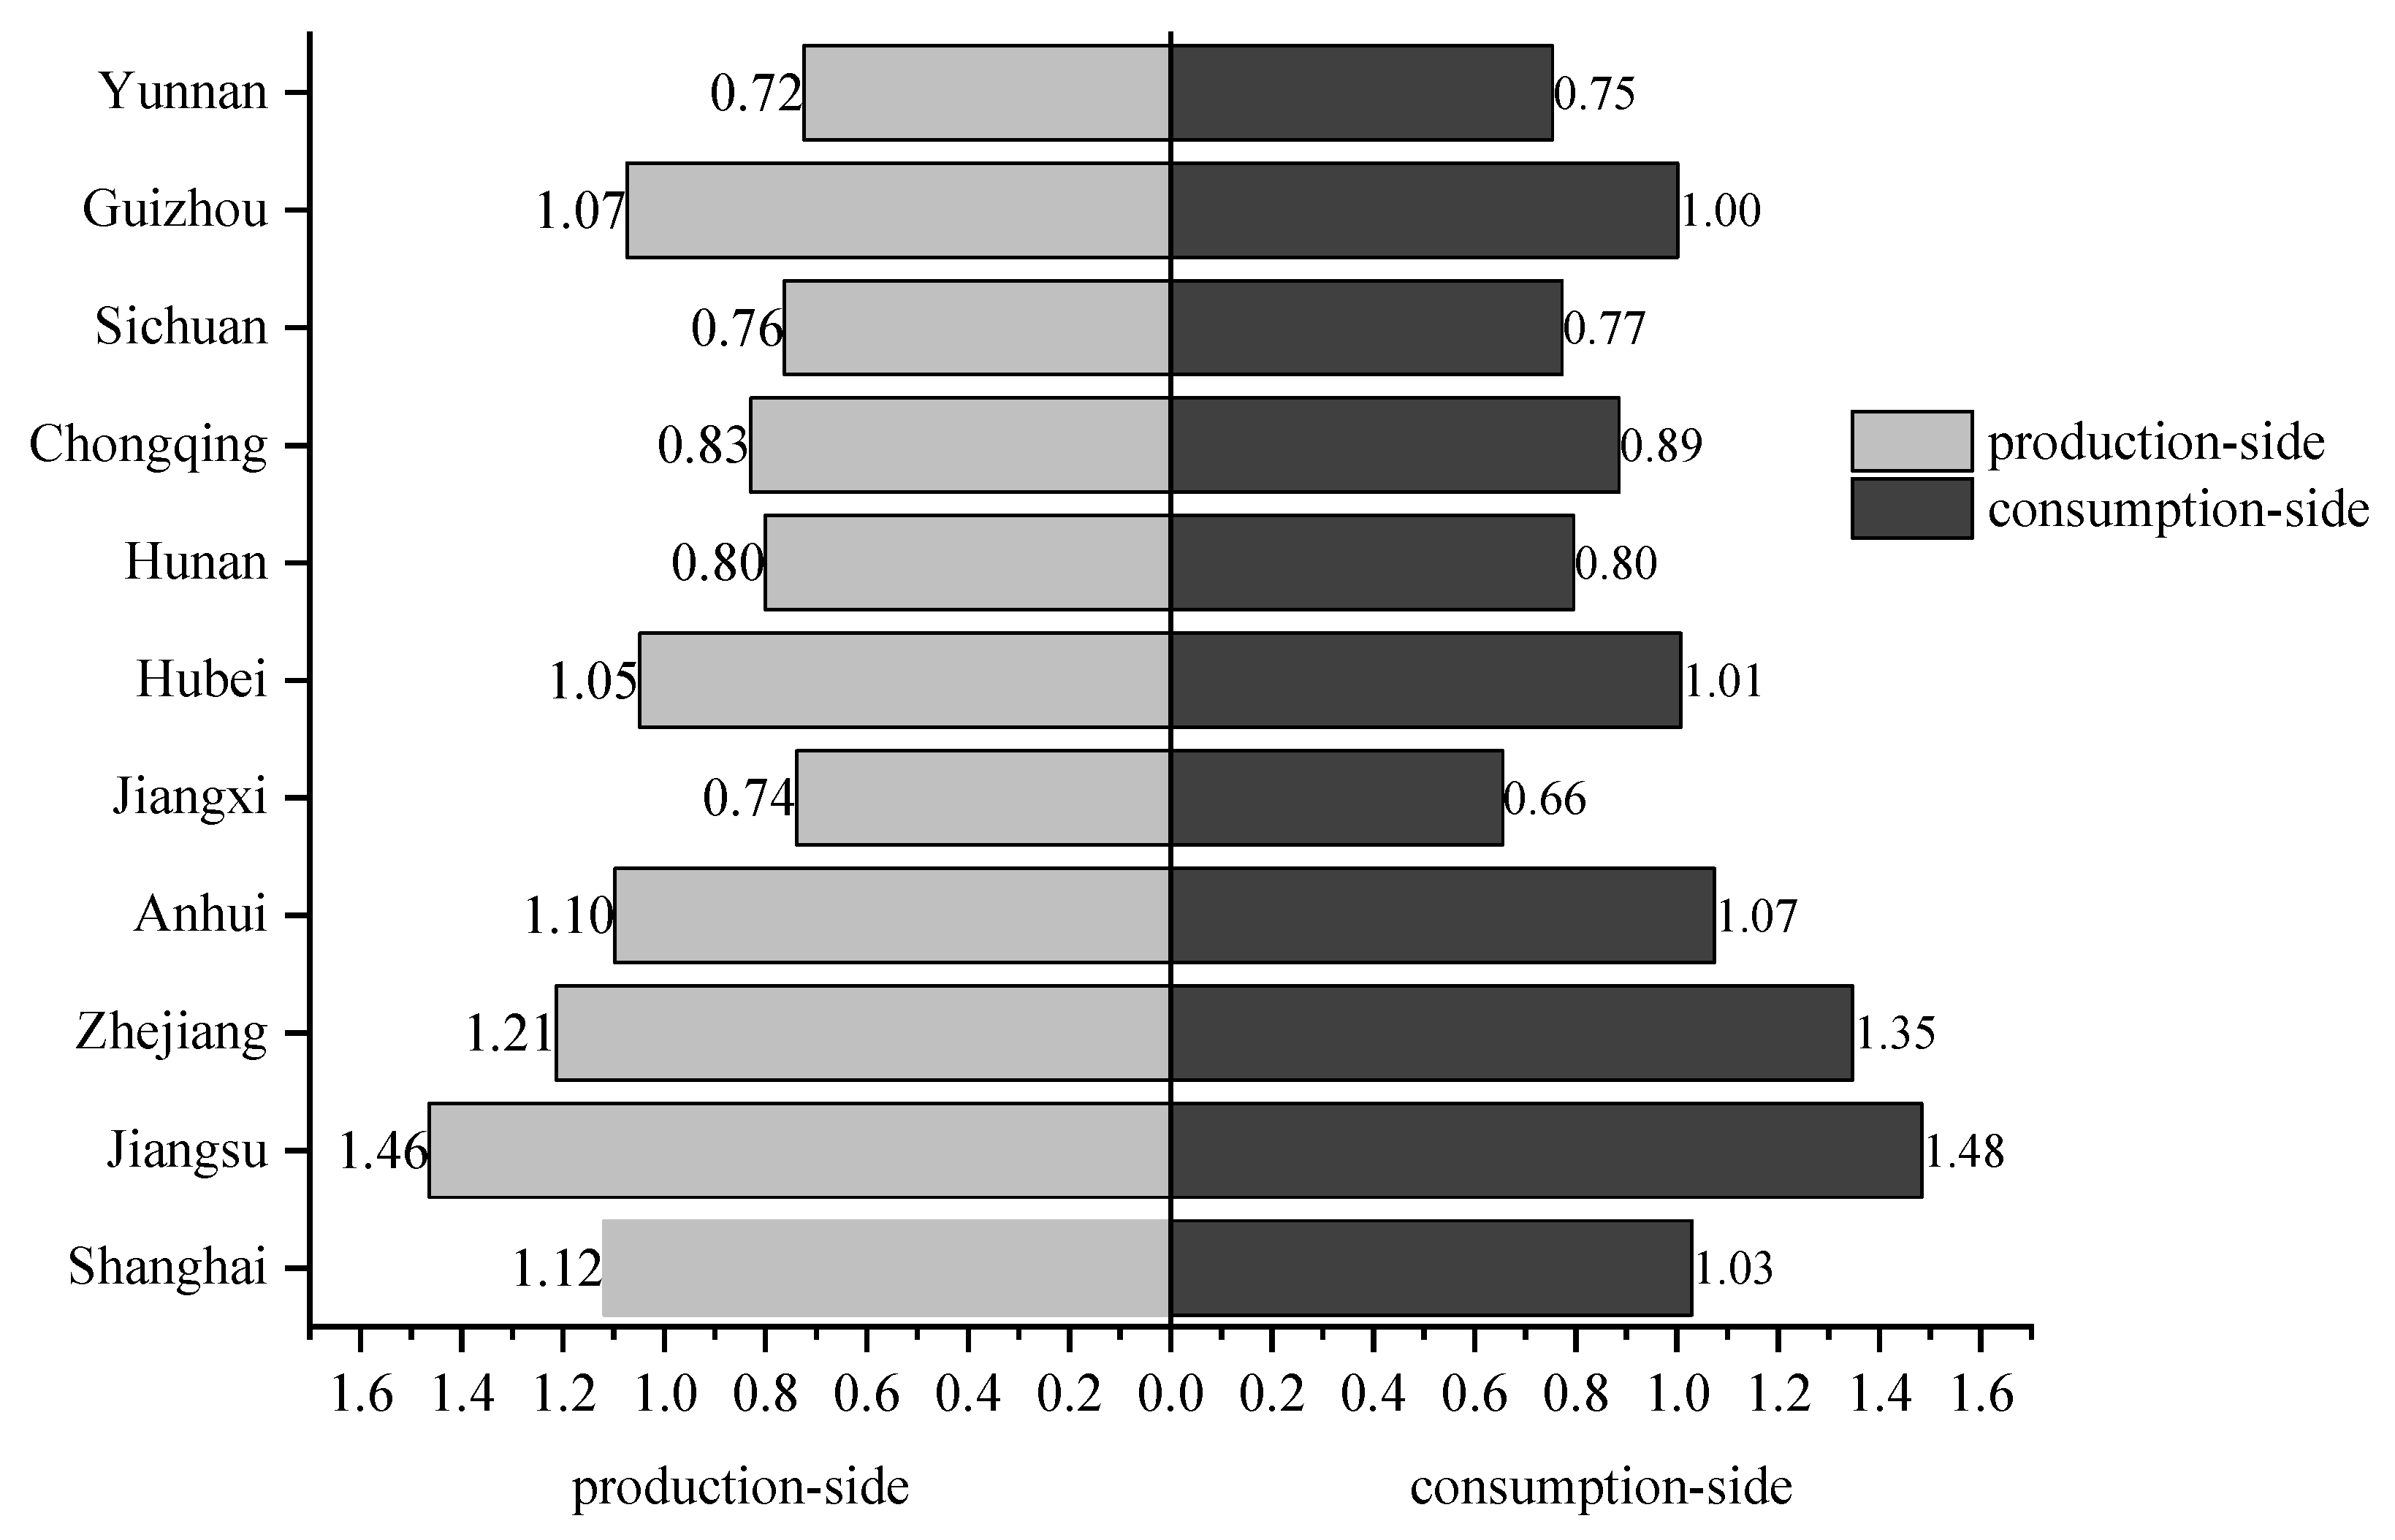
3.1. Production-Based versus Consumption-Based Carbon Emissions and Value Added

Figure 3a shows the production-side and consumption-side carbon emissions of the 11 provinces in the YEB in 2017. Carbon emissions vary widely among the 11 provinces in the YEB. Jiangsu has the highest carbon emissions, accounting for approximately 20% of the total carbon emissions of the 11 provinces in the YEB. Zhejiang, Anhui, Hubei, Hunan, and Sichuan are in the second tier, with the combined emissions of these five provinces accounting for more than half of the total carbon emissions in the YEB. Among the remaining five provinces, Shanghai and Chongqing have the lowest carbon emissions, with the combined emissions of these two provinces accounting for less than 10% of the total carbon emissions in the YEB. In addition, the relative amounts of carbon emissions on both sides of the YEB varies greatly among the 11 provinces. Six provinces—Zhejiang, Anhui, Hubei, Hunan, and Guizhou—produce more high carbon-emitting products, resulting in their production-side carbon emissions being higher than their consumption-side carbon emissions. Conversely, five provinces—Jiangsu, Zhejiang, Chongqing, Sichuan and Yunnan—consume more high carbon-emitting products, which leads to their production-side carbon emissions being lower than their consumption-side carbon emissions.
Figure 3b shows the production-side and consumption-side value added of the 11 provinces in the YEB in 2017. The value added varies widely among the 11 provinces in the YEB. The value added on both the production and consumption sides of Jiangsu is the highest, at 6.97 trillion CNY and 6.88 trillion CNY, respectively. The value added on both the production and consumption sides of Guizhou is the lowest, at 1.08 trillion CNY and 1.06 trillion CNY, respectively. At the same time, there is also a large difference in the relative amount of value added on both sides of the 11 provinces in the YEB. Six provinces—Shanghai, Anhui, Jiangxi, Hubei, Hunan, and Guizhou—have higher value added on the production side than on the consumption side; they gain economically by producing more high-value added products. However, the remaining five provinces have higher value added on their consumption side due to paying more economically to purchase more high-value added products.
The differences in carbon emissions and value added accounting between the production and consumption sides suggest that carbon emission transfers and value added transfers are prevalent in inter-provincial trade in the YEB. The imbalance in the ratio of carbon emissions to value added flows between different provinces hints at the existence of latent carbon inequality driven by inter-provincial trade, as further evidenced by the analysis below.

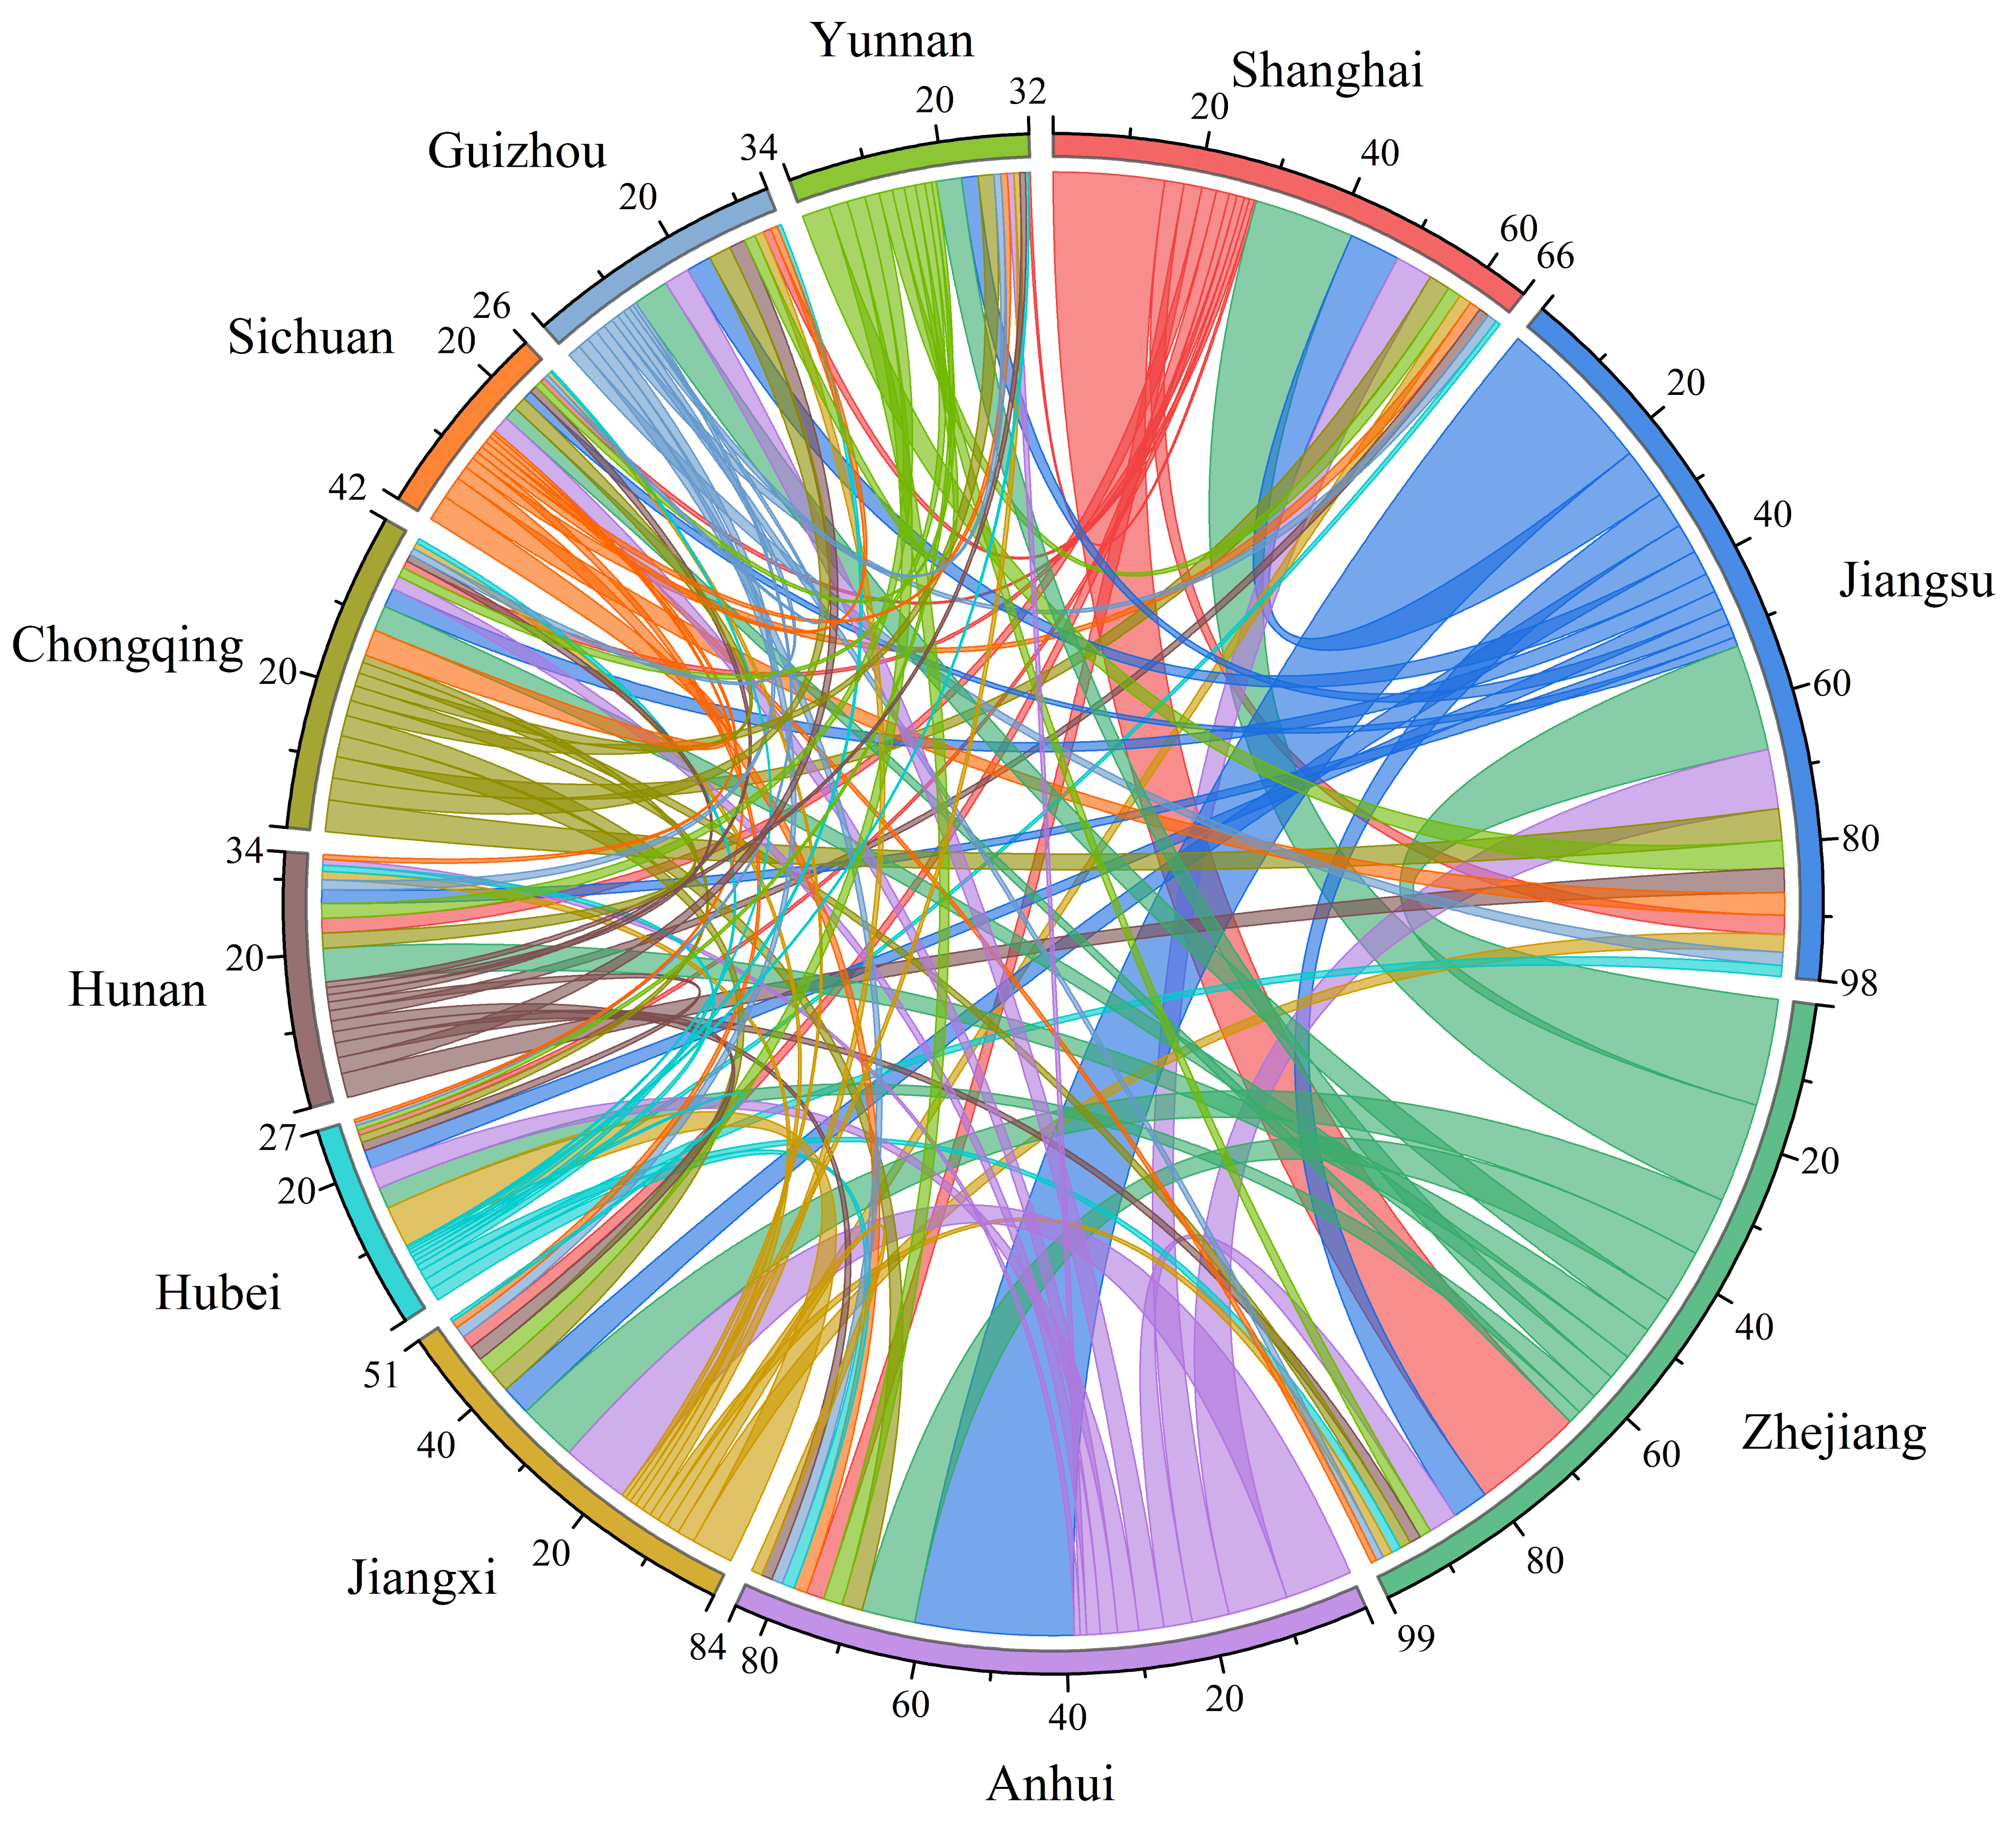
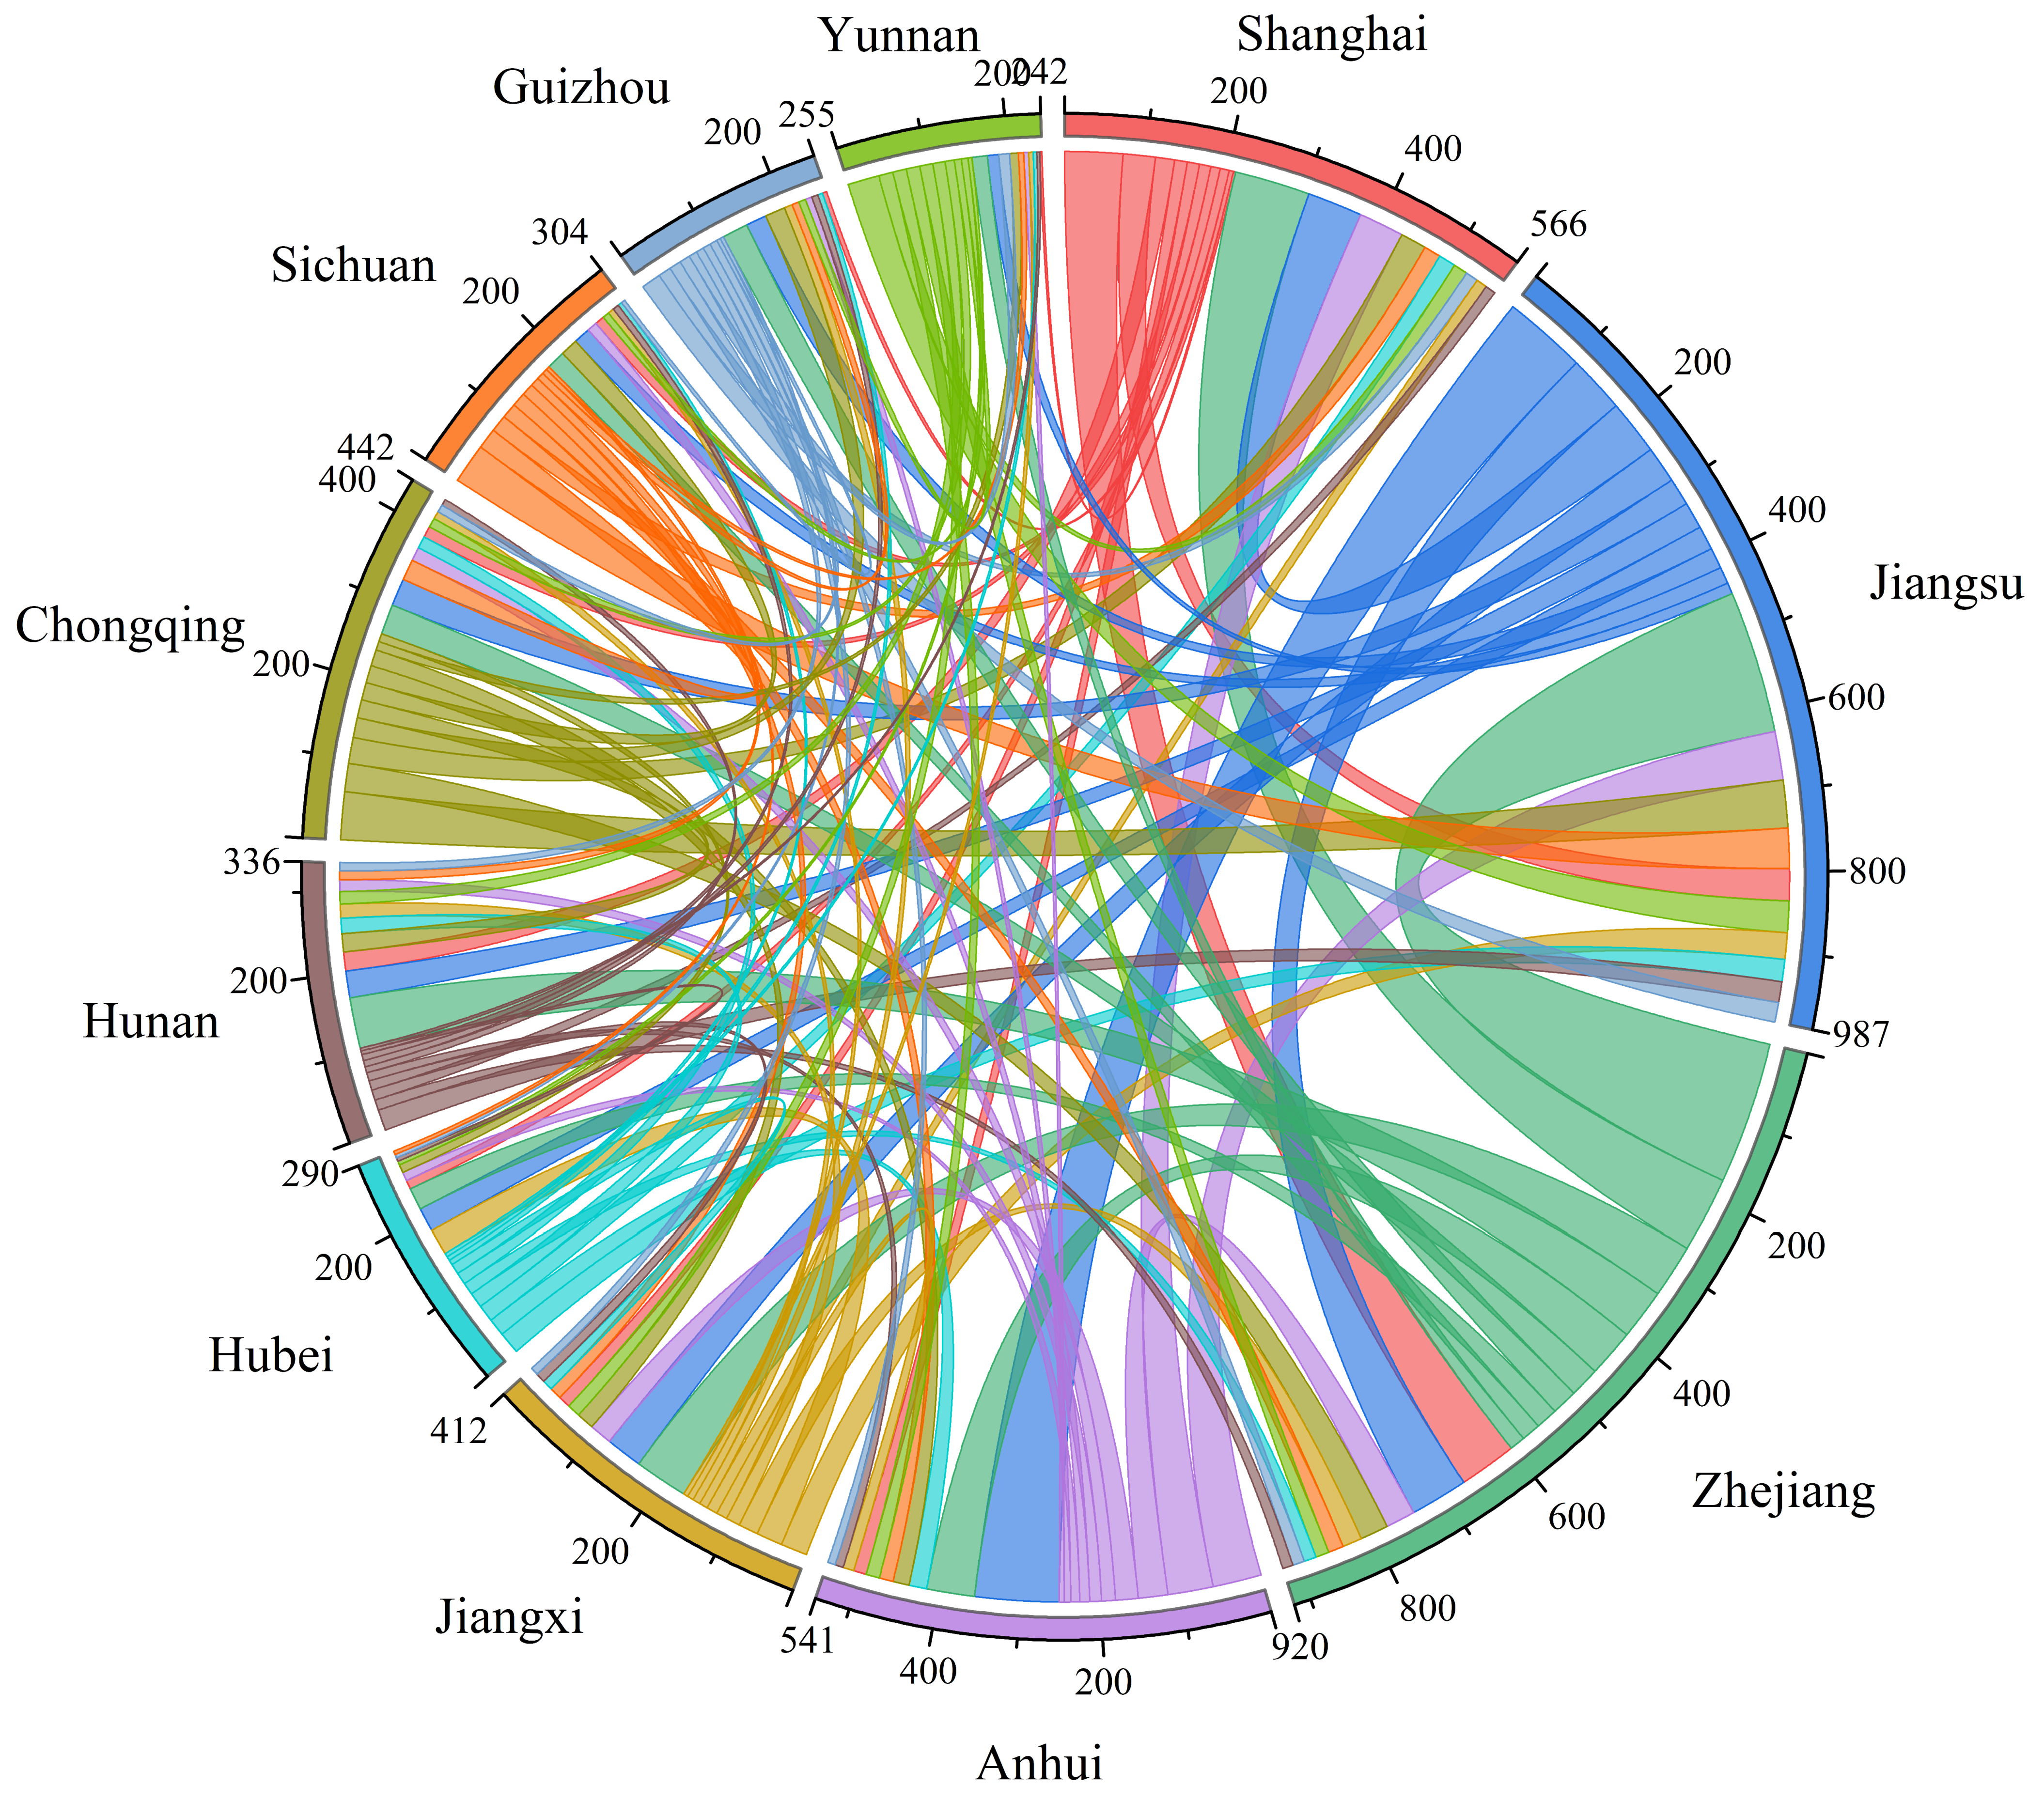
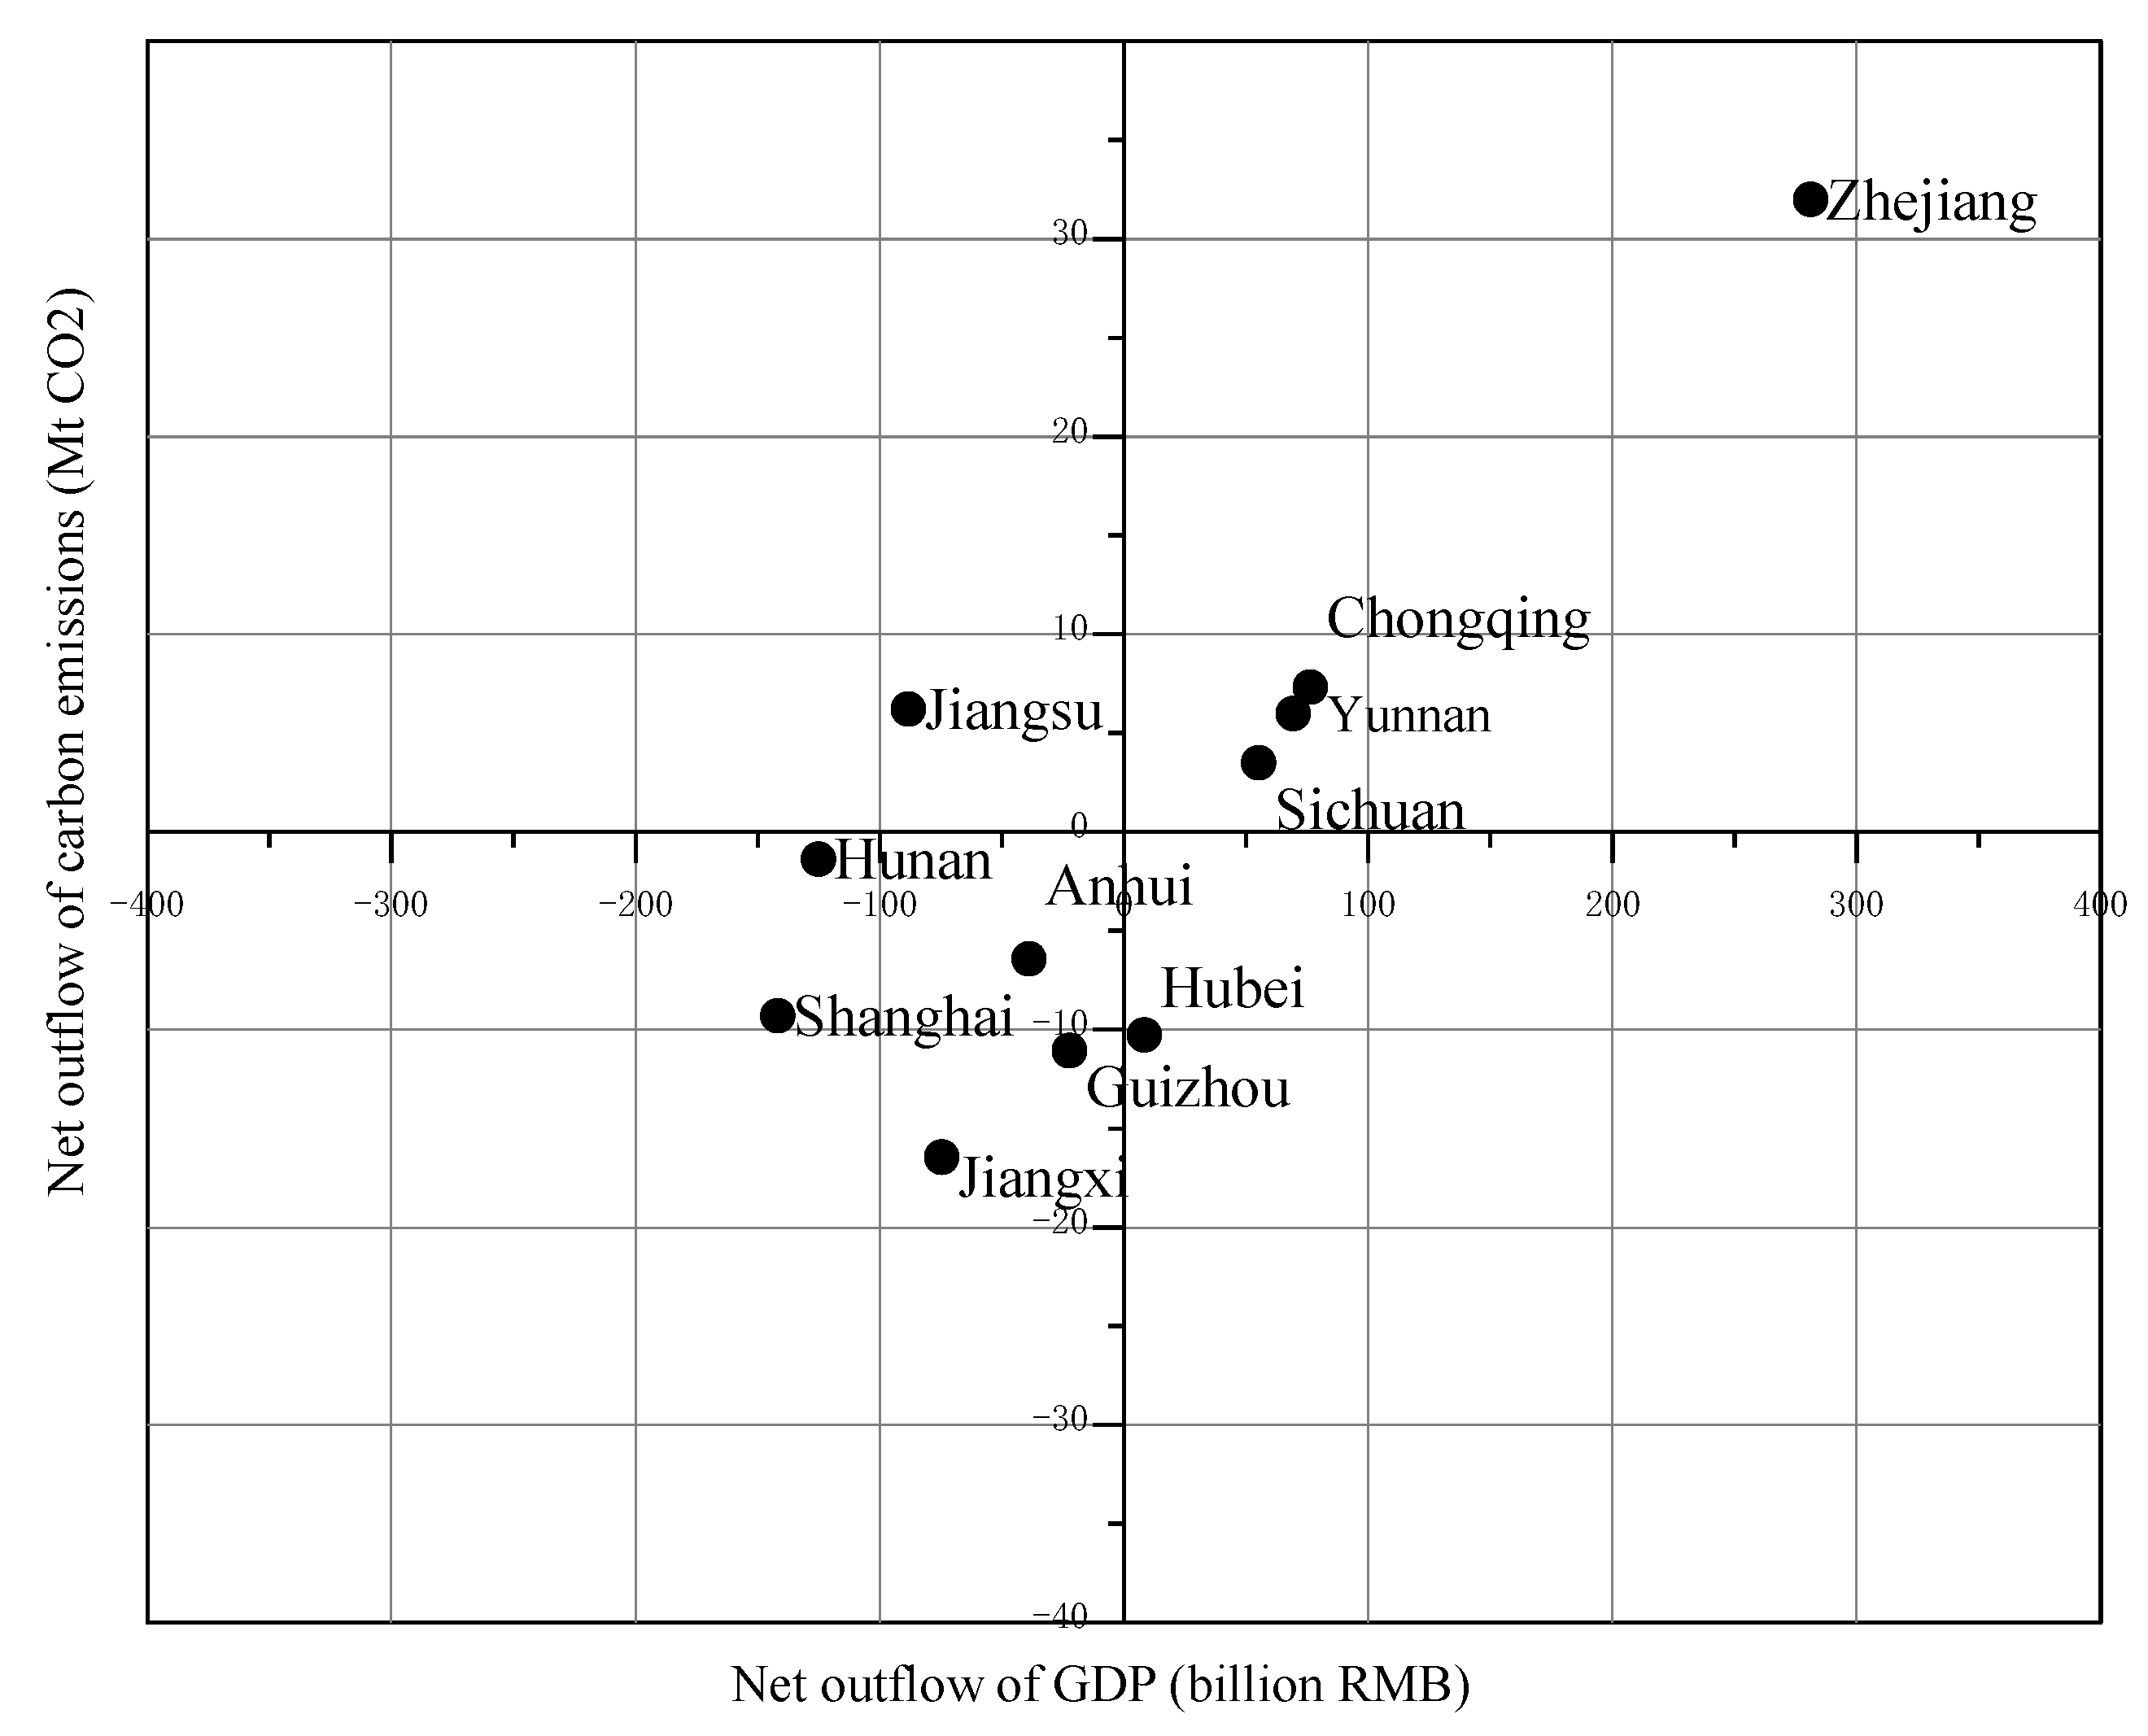
3.2. Characteristics of Embodied Carbon Emission and Value Added Flow Relationship

Figure 4 shows the net transfer of embodied carbon and embodied value added generated by inter-provincial trade in the YEB. Taking Figure 4a as an example, the length of the outer arc indicates the total embodied carbon transfer within each region, and the line with the same colour as the arc indicates the carbon transfer out of the region. Take the embodied carbon transfer from Jiangsu to Anhui as an example, the arc of Jiangsu shows blue colour, while the arc of Anhui shows purple colour. The blue line connecting Jiangsu and Anhui indicates that Jiangsu transfers embodied carbon to Anhui through trade, and the width of the blue line represents this transfer amount, which is 21.96 Mt CO2. The purple arc connecting Jiangsu and Anhui indicates that Anhui transfers 8.22 Mt CO2 embodied carbon to Jiangsu through trade.
In the net embodied carbon transfer among the 11 provinces in the YEB (Figure 4a), five provinces, Jiangsu, Zhejiang, Chongqing, Sichuan, and Yunnan, are net embodied carbon emission exporting regions, transferring carbon emission reduction responsibilities to others. Among them, Zhejiang transferred 31.98 Mt CO2 out and was the largest net carbon emission-transferring region. Shanghai, Anhui, Jiangxi, Hubei, Hunan, and Guizhou are net importers of embodied carbon emissions, taking on the responsibility for carbon reduction for the remaining provinces. Among them, Jiangxi has the highest net transfer of carbon emissions (16.45 Mt CO2). In the interprovincial trade between the 11 provinces in the YEB, Jiangsu transferred 13.74 Mt CO2 of carbon emissions to Anhui, the largest transfer of carbon emissions generated by trade between the two provinces.
Among the net transfer of embodied value added among the 11 provinces in the YEB (Figure 4b), five provinces—Zhejiang, Hubei, Chongqing, Sichuan, and Yunnan—were net embodied value added export regions, transferring value added out to the remaining provinces. Of these, Zhejiang had the largest net value added transfer out of the region (281.23 billion CNY). Shanghai, Jiangsu, Anhui, Jiangxi, Hunan, and Guizhou were net importers of embodied value added and gained economically from inter-provincial trade. Among them, Shanghai gained 141.64 billion CNY through inter-provincial trade and had the highest net transfer of value added. In the interprovincial trade between the 11 provinces in the YEB, Jiangsu received 105.47 billion CNY in economic gains from Zhejiang, the largest net transfer of value added in the interprovincial trade.
A net carbon transfer-out region means that carbon reduction responsibility can be transferred through regional trade and cause environmental degradation in net carbon transfer-in regions. When it pays insufficient economic compensation or gains economic benefits through regional trade, it can hinder the sustainable development of its trading partners, in which case regional trade triggers carbon inequality. Figure 5 shows the amount and direction of the net transfer of embodied carbon and value added generated by inter-provincial trade in the YEB in 2017, which more visually represents the carbon inequality relationship.
Based on the information in the four quadrants, the 11 provinces in the YEB are divided into four groups. The first group is located in the first quadrant and includes Zhejiang, Chongqing, Yunnan, and Sichuan, which means they are all net exporter regions of carbon emissions and value added; that is, these four provinces pay economic costs while transferring some of their net carbon emissions to other provinces. The second group, located in the second quadrant, includes Jiangsu, which implies that Jiangsu is in the most favorable position among the 11 provinces and cities not only to gain net economic benefits from other provinces through inter-provincial trade but also to transfer net carbon emissions to other provinces by consuming energy-intensive and high carbon products from other provinces while exporting high-value added products and services. The third group, located in the third quadrant, includes Hunan, Anhui, Guizhou, Shanghai, and Jiangxi, which means they are all net importers of carbon emissions and value added; that is, these five provinces receive economic compensation while taking on some of the carbon emissions of other provinces. The fourth group is located in the fourth quadrant and includes Hubei, implying that Hubei is a net transfer-in of carbon emissions and a net transfer-out of value added. This implies that it is at a relative disadvantage in terms of supplying energy-intensive or high carbon products and services to other provinces in trade and importing low-value added products and services from other provinces. In summary, the results show that there is significant carbon inequality in inter-provincial trade among the 11 provinces in the YEB.

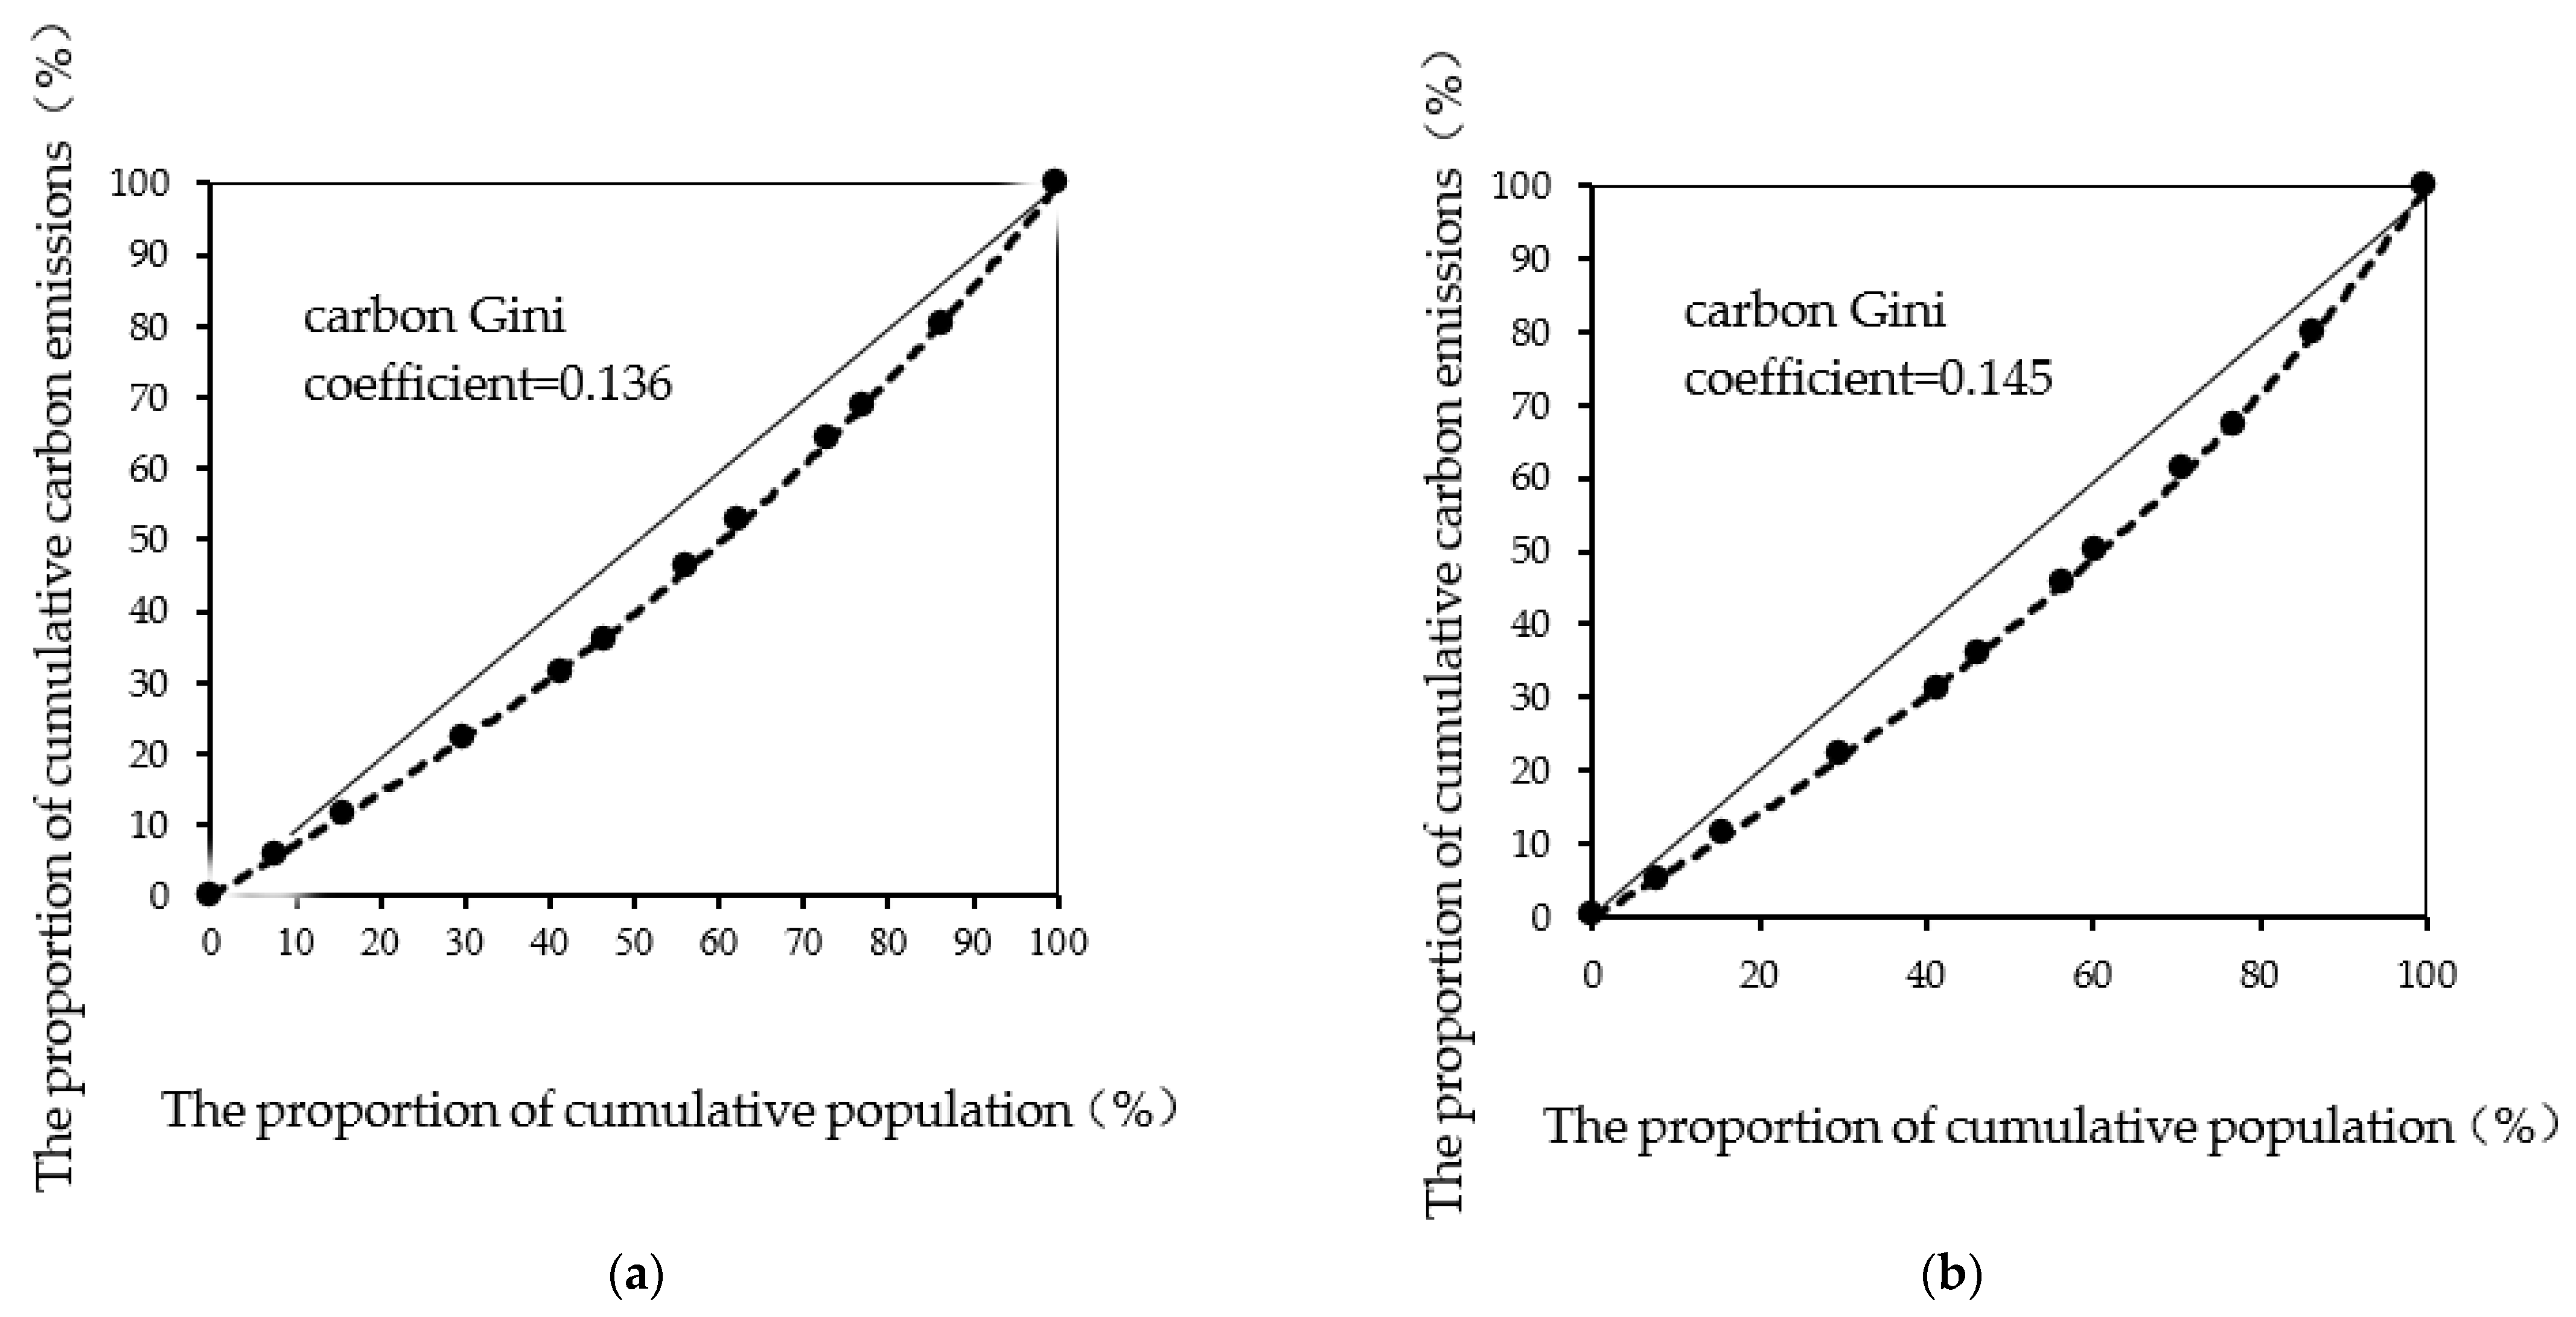
3.3. Quantitative Analysis of Carbon Inequality from the Carbon Gini Coefficient and Deviation Coefficient

The carbon Lorentz curve and carbon Gini coefficient of the YEB based on the production and consumption sides in 2017 are obtained according to Equation (6), as shown in Figure 6. The deviation of the carbon Lorenz curve from the diagonal is not very different between the production and consumption sides of the YEB, with carbon Gini coefficients of 0.136 and 0.145, respectively. In contrast, there are six regions in the YEB where carbon emissions from the production side are higher than those from the consumption side, which gives a slight advantage to the even distribution of total carbon emissions across provinces from the producer responsibility perspective. Therefore, the production-side carbon Gini coefficient is slightly lower than the consumption-side carbon Gini coefficient in the YEB. The Gini coefficient is an indicator commonly used internationally to measure the degree of difference in income distribution among residents, and the relevant United Nations organizations stipulate that a Gini coefficient below 0.2 indicates a too-even distribution of income and 0.4–0.5 indicates a large difference in income distribution. Looking at the YEB as a whole, carbon emissions are relatively equitably distributed relative to the population.
The carbon deviation coefficients of the 11 provinces in the YEB are obtained according to Equation (7), as shown in Figure 7. The carbon deviation coefficient of the 11 provinces in the YEB can show the carbon emission pressure borne by the population of each province. Six provinces, namely Shanghai, Jiangsu, Zhejiang, Anhui, Hubei, and Guizhou, have carbon deviation coefficients greater than 1 for both the production and consumption sides, and their populations are under greater environmental pressure. Among them, Jiangsu has the highest carbon deviation coefficient on the production and consumption sides, at 1.46 and 1.48, respectively. Five provinces, namely Jiangxi, Hunan, Chongqing, Sichuan, and Yunnan, have production and consumption side deviation coefficients of less than 1, reflecting an “environmentally friendly carbon emission model” with a low population pressure. Yunnan has the smallest deviation coefficient on the production side (0.72), and Jiangxi has the smallest deviation coefficient on the consumption side (0.66). Therefore, in terms of the carbon pressure on the respective populations of the 11 provinces, carbon inequality exists between the provinces of the YEB.

4. Discussion

Growing regional trade has not only facilitated the exchange of goods and services but has also led to the transfer of carbon emissions. The unequal relationship between carbon emissions and economic benefits in trade has drawn the attention of the academic community to the issue of carbon inequality [30]. Carbon inequality also affects the division of responsibility for regional carbon reduction [49]. However, it is one-sided to study regional carbon inequality only in terms of the relationship between carbon emissions and economic benefits in regional trade, and demographic factors in each region should also be considered [44]. This study combines the MRIO model with the accounting of the carbon Gini coefficient and carbon deviation coefficient and analyzes the carbon inequality in inter-provincial trade in the YEB in 2017 from the perspective of both the production side and the consumption side, in terms of both economic returns and demographic factors. As there are no major changes in the regional trade structure in the short term, the conclusions obtained using the 2017 data are still relevant for policies related to carbon reduction. The study yielded some findings.
Firstly, there is a difference between carbon emissions and value added in the 11 provinces of the YEB. Shanghai and Jiangsu have the highest level of economic development in the region and are well endowed with a pool of highly skilled personnel and physical capital elements. However, Shanghai mainly produces and consumes low-carbon emission and high-value added products, while Jiangsu mainly produces and consumes high carbon emission and high-value added products. The main reason for this is that Shanghai, as China’s financial and trade center, has accelerated the transformation of old and new dynamics, and low carbon emission industries represented by new energy vehicles, biology, and new generation information technology are developing rapidly. Jiangsu, as a strong industrial province in China, has an industrial structure dominated by industries with high energy consumption and high carbon emissions, while presenting a coal-based and complementary energy consumption system [50]. Chongqing is rich in hydropower and tourism resources, but with a small working-age population and high labor costs, it mainly produces and consumes low carbon emissions and low value added products.
Secondly, inter-provincial trade in the YEB has led to a transfer of varying degrees of embodied carbon and value added. Jiangsu imports high carbon-emitting low value added products while producing low-carbon-emitting high-value added products through inter-provincial trade, thereby transferring responsibility for carbon emissions reduction while reaping economic benefits. However, Hubei, by producing high carbon-emitting low value added products while purchasing low-carbon-emitting high-value added products produced in other provinces, results in a local economic cost while bearing the carbon emission pressure for the others. Therefore, the reality of the unequal transfer of carbon emissions and economic benefits among the provinces in the YEB should be fully taken into account in the division of regional carbon emission reduction responsibility [51].
Finally, the carbon deviation coefficients of the 11 provinces in the YEB vary widely. Six provinces with a carbon deviation coefficient greater than 1 have a greater share of CO2 emissions than population, making carbon emissions more inequitable. The five provinces with a carbon deviation coefficient less than 1 have a smaller share of CO2 emissions than the population share, making carbon emissions more equitable. This is mainly due to the combination of the level of economic development [52] and the regional distribution of the population [44]. As China is in a phase of accelerated urbanization, there is a strong correlation between economic development and energy consumption over a certain period of time, so economically developed provinces such as Shanghai tend to be accompanied by higher carbon emissions. In addition, Shanghai is a municipality directly under the central government of China and is not as large or populous as other provinces. Therefore, the share of CO2 emissions in Shanghai is smaller than the share of population, and the carbon deviation factor is greater than 1.
Based on the above analysis, this paper puts forward the following policy recommendations to facilitate the development and implementation of a collaborative regional carbon reduction policy. To achieve its carbon emission reduction target, the YEB needs to promote a revolution in energy technology to reduce regional carbon emissions. The YEB emitted 5965.01 Mt CO2 in 2017, accounting for 63.29% of the country’s total CO2 emissions. High carbon emission regions such as Jiangsu should reduce their carbon emissions through measures such as energy transformation, the use of renewable energy, and the reduction of production and consumption of high carbon products. At the same time, local governments should seize the opportunity of regional economic integration rising to a national strategy to form synergies, improve the efficiency of production resources in terms of spatial layout and allocation, and broaden and tap the domestic market [53]. For example, consideration can be given to enabling regions with better endowments of clean energy resources, such as Yunnan and Sichuan, to support Jiangsu, while Jiangsu gives a certain amount of economic compensation, forming a win-win situation for economic development and ecological protection. In addition, in order to implement a differentiated carbon emission reduction responsibility mechanism, carbon inequality within the YEB should be fully considered. For example, Jiangsu gains value added while net transferring out carbon emissions, and thus, it should take relatively more responsibility for carbon emissions within the region.

5. Conclusions

The main objective of this study was to explore carbon inequality in inter-provincial trade in the YEB from the perspective of economic gains and environmental pressures on the population. It is found that there is obvious carbon inequality among the eleven provinces in the YEB. From the relationships between embodied carbon emissions and economic benefits. In the inter-regional trade of the YEB, Jiangsu is in the most dominant position to obtain net economic benefits from other provinces while making other provinces bear part of their carbon emissions. On the contrary, Hubei is in the most disadvantageous position when it undertakes part of the carbon emissions for other provinces and net transfers out economic benefits. In terms of the carbon pressure on the population in the 11 provinces of the YEB, six provinces—Shanghai, Jiangsu, Zhejiang, Anhui, Hubei, and Guizhou—have carbon deviation coefficients greater than one. Their populations are under greater environmental pressure and are at a disadvantage in inter-provincial trade. However, five provinces, namely Jiangxi, Hunan, Chongqing, Sichuan, and Yunnan, have carbon deviation coefficients less than one. Their populations are under less environmental pressure and are at an advantage in inter-provincial trade. The analysis of carbon inequality helps to clarify the carbon emission reduction responsibilities of each province and provides theoretical support for policymakers to establish a coordinated emission reduction mechanism and formulate a differentiated carbon emission reduction responsibility mechanism.
Meanwhile, this study also has some limitations. Carbon transfer between industries is not considered in this paper. Due to the geographical bias of industrial development policies, regions encouraged by industrial policies tend to welcome the inward migration of foreign industries, while regions restricted by industrial policies face the outward migration of local industries. The current economic structural transformation and industrial shift in China’s regions will lead to carbon transfer [54]. Therefore, the regional spatial impact of industrial relocation on carbon emissions will be further explored in future studies.

Author Contributions

Conceptualization, Q.B., Y.L. and G.T.; methodology, Q.B.; software, Q.B.; validation, G.T., Y.L., Z.W. and Q.X.; formal analysis, Q.B.; data curation, Q.B.; writing—original draft preparation, Q.B.; writing—review and editing, Y.L., Q.B., G.T., Z.W. and Q.X.; visualization, Q.B. and Q.X.; supervision, Y.L., G.T. and Z.W.; funding acquisition, Y.L. and G.T. All authors have read and agreed to the published version of the manuscript.

Funding

This research was funded by the National Social Science Fund of China (grant number: 19FJYB029), Humanities and Social Science General Program sponsored by the Ministry of Education of the People’s Republic of China (grant number: 21YJC790070), and the Fundamental Research Funds for the Central Universities (grant numbers: B230207060, B200204043, B210204012).

Institutional Review Board Statement

Not applicable.

Informed Consent Statement

Not applicable.

Data Availability Statement

Data will be made available on request.

Conflicts of Interest

The authors declare no conflict of interest.

Appendix A

Table A1. Forty-two industrial sectors in the input-output table.
Sector CodeSector Name
S1Agriculture, Forestry, Animal Husbandry, and Fishery
S2Mining and washing of coal
S3Extraction of petroleum and natural gas
S4Mining and processing of metal ores
S5Mining and processing of nonmetals and other ores
S6Food and tobacco processing
S7Textile industry
S8Manufacture of leather, fur, feather, and related products
S9Processing of timber and furniture
S10Manufacture of paper, printing, and articles for culture, education, and sport activity
S11Processing of petroleum, coking, and processing of nuclear fuel
S12Manufacture of chemical products
S13Manufacture of non-metallic mineral products
S14Smelting and processing of metals
S15Manufacture of metal products
S16Manufacture of general-purpose machinery
S17Manufacture of special-purpose machinery
S18Manufacture of transport equipment
S19Manufacture of electrical machinery and equipment
S20Manufacture of communication equipment, computers, and other electronic equipment
S21Manufacture of measuring instruments
S22Other manufacturing and waste resources
S23Repair of metal products, machinery, and equipment
S24Production and distribution of electric power and heat power
S25Production and distribution of gas
S26Production and distribution of tap water
S27Construction
S28Wholesale and retail trades
S29Transport, storage, and postal services
S30Accommodation and catering
S31Information transfer, software, and information technology services
S32Finance
S33Real estate
S34Leasing and commercial services
S35Scientific research
S36Polytechnic services
S37Administration of water, environment, and public facilities
S38Resident, repair, and other services
S39Education
S40Health care and social work
S41Culture, sports, and entertainment
S42Public administration, social insurance, and social organizations

Appendix B

Table A2. Yangtze River Economic Belt CO2 inventory in 2017 (Unit: ton).
SectorShanghaiJiangsuZhejiangAnhuiJiangxiHubeiHunanChongqingSichuanGuizhouYunnan
S11.007.757.323.692.118.439.131.715.583.024.95
S20.004.600.2322.726.830.7913.4413.8114.8312.4217.09
S30.000.160.000.000.000.360.090.228.200.000.00
S40.000.230.030.170.410.280.790.285.210.101.21
S50.000.350.240.260.741.140.820.351.200.020.35
S60.961.830.760.710.833.051.460.533.710.290.70
S70.742.543.730.070.070.400.020.051.180.000.04
S80.440.640.650.050.140.130.500.030.380.000.00
S90.200.480.250.040.110.091.880.020.410.010.02
S100.982.631.710.630.830.836.310.901.740.100.30
S116.914.975.701.455.633.014.605.4018.613.225.22
S124.3311.416.3413.480.5919.4713.804.049.682.114.42
S133.1262.6540.5248.2941.8541.1668.7330.7761.4430.9134.55
S1430.01145.6020.6039.8844.4739.043.0122.9072.0512.3932.39
S150.771.170.870.170.080.430.310.320.810.490.03
S166.165.001.520.540.183.210.360.172.750.030.05
S170.270.750.340.130.131.640.170.031.340.010.03
S181.471.141.090.320.240.710.071.111.640.080.19
S190.380.870.730.260.180.140.190.100.780.000.02
S200.320.740.260.050.050.020.140.040.280.000.00
S210.020.130.110.000.010.030.080.090.040.000.00
S220.040.040.100.020.010.030.060.030.050.010.09
S230.030.050.090.210.080.030.070.010.030.000.11
S240.040.040.100.020.010.030.060.030.050.010.09
S2556.70386.94220.03176.0679.26112.4183.3844.4850.63100.9335.49
S262.722.260.020.040.210.030.010.080.380.340.20
S270.010.010.010.000.040.010.030.000.060.000.00
S281.880.765.802.850.616.105.751.801.871.462.48
S292.710.552.831.120.904.824.241.174.319.132.00
S3020.9719.6114.519.976.9214.6513.398.939.627.2710.22
S312.710.552.831.120.904.824.241.174.319.132.00
S3220.9719.6114.519.976.9214.6513.398.939.627.2710.22
S330.930.120.370.320.170.691.040.110.712.010.23
S340.930.120.370.320.170.691.040.110.712.010.23
S350.930.120.370.320.170.691.040.110.712.010.23
S360.930.120.370.320.170.691.040.110.712.010.23
S370.930.120.370.320.170.691.040.110.712.010.23
S380.930.120.370.320.170.691.040.110.712.010.23
S390.930.120.370.320.170.691.040.110.712.010.23
S400.930.120.370.320.170.691.040.110.712.010.23
S410.930.120.370.320.170.691.040.110.712.010.23
S420.930.120.370.320.170.691.040.110.712.010.23
Table A3. Yangtze River Economic Belt value added inventory in 2017 (Unit: hundred million CNY).
SectorShanghaiJiangsuZhejiangAnhuiJiangxiHubeiHunanChongqingSichuanGuizhouYunnan
S1115.914345.032137.782725.871911.913716.393187.661312.734395.972155.102405.44
S20.00149.742.18590.9228.0421.34115.9397.68274.43822.26180.37
S32.8465.120.000.000.0024.380.00114.41486.410.000.00
S40.0043.2211.55270.16162.46176.52195.8455.06319.4679.38226.20
S50.0047.78125.89126.72121.48408.02206.5077.80233.24356.8448.12
S6982.011800.70962.361088.24733.961905.811887.40550.762000.191182.881422.32
S736.831159.041348.76177.19186.63533.53152.1328.03148.312.565.52
S862.50959.70963.72259.22382.15210.69210.0866.5182.3018.165.58
S989.90539.71556.75246.73177.44194.43287.3975.34211.7325.7123.29
S10160.60963.431005.41252.57300.69333.10376.57167.65230.1824.0387.95
S11303.81521.21489.47162.01127.54281.89175.1517.95221.3220.4061.12
S121298.364838.202712.931183.191128.001534.601200.39616.961151.05445.75326.25
S13134.821231.13669.31917.84729.811273.411073.47489.98845.67102.91189.04
S14242.052693.90686.44697.141073.75611.901261.20332.02588.19302.29493.10
S15229.701318.88871.68436.90148.93515.02404.66193.38370.4025.1225.46
S16491.861722.951387.96447.81141.81333.62365.98225.80387.7532.1015.42
S17281.291378.77658.68341.03131.09307.47679.65103.90306.2215.1414.36
S181377.022102.66991.04516.56254.631388.32712.511387.01695.8074.4758.11
S19346.752455.781165.26779.92430.24360.22290.80175.25250.2332.5018.33
S20515.063130.99560.67487.51265.55232.39431.86522.18736.6337.9827.46
S2179.53767.97264.8161.6528.3855.0444.9347.2131.767.756.59
S2259.60146.751583.64200.12436.82383.67148.7869.55303.77106.9042.47
S2339.582.7516.318.520.2712.6816.942.522.670.954.19
S24339.601433.781225.92572.39385.63788.54308.67271.09907.84579.46664.60
S2540.86126.3051.8338.4129.9349.9328.6159.9796.7112.3944.80
S2621.59102.1979.4733.3450.6955.1447.9731.9258.098.8217.56
S27974.084732.533226.351948.951842.462468.012286.372009.202847.961173.432130.87
S284246.537412.036466.234273.311363.112592.572577.581546.322487.74785.581515.39
S291530.013524.973179.22992.53943.931615.891702.371071.671480.231217.85417.16
S30306.941047.251165.11375.61347.69606.08525.09316.98981.06326.94389.76
S312028.673140.081833.47543.95628.971411.61985.60666.571759.18396.78525.71
S324717.765971.002496.681430.87970.322337.281425.201609.162809.33697.311057.34
S332550.716831.501475.611892.731218.152237.401388.151430.992924.43385.46470.50
S341394.512982.972464.83910.79379.59949.03719.90654.21667.68213.75325.26
S35311.30415.24148.7937.8858.06105.89424.9621.99176.0110.5647.35
S36894.74662.391327.50267.05226.22362.63391.96254.62383.8790.28264.50
S37117.67494.77245.68141.1176.9996.84158.37125.54109.1321.4781.09
S38280.981421.77422.32332.09353.54604.301500.85361.42764.70266.76162.87
S391010.322753.88544.04801.87461.35790.801253.40484.991024.79378.03770.23
S40694.281804.861197.16479.79247.15439.96739.81365.52705.05151.04474.26
S41189.76643.20425.81258.43357.61560.72728.34110.71448.00109.99127.32
S42674.392933.172120.93842.31816.881404.391971.19451.441425.64871.07959.20

Appendix C

Table A4. Total population of the YEB in 2017 (Unit: ten thousand people).
ProvincePopulation
Shanghai2418
Jiangsu8029
Zhejiang5657
Anhui6255
Jiangxi4622
Hubei5902
Hunan6860
Chongqing3075.
Sichuan8302
Guizhou3580
Yunnan4801

References

  1. Qian, Y.K.; Zheng, H.R.; Meng, H.R.; Meng, J.; Shan, Y.L.; Zhou, Y.; Guan, D.B. Large inter-city inequality in consumption-based CO2 emissions for China’s pearl river basin cities. Resour. Conserv. Recycl. 2022, 176, 105923. [Google Scholar] [CrossRef]
  2. Moser, S.C. Communicating climate change: History, challenges, process and future directions. WIREs Clim. Chang. 2010, 1, 31–53. [Google Scholar] [CrossRef]
  3. Patz, J.A.; Frumkin, H.; Holloway, T.; Vimont, D.J.; Haines, A. Climate change: Challenges and opportunities for global health. JAMA J. Am. Med. Assoc. 2014, 312, 1565–1580. [Google Scholar] [CrossRef]
  4. BP Statistical Review of World Energy. Available online: https://www.bp.com/en/global/corporate/energy-economics/statistical-review-of-world-energy.html (accessed on 19 April 2023).
  5. Koopman, R.; Wang, Z.; Wei, S.J. Tracing value-added and double counting in gross exports. Am. Econ. Rev. 2014, 104, 459–494. [Google Scholar] [CrossRef] [Green Version]
  6. Wang, Y.B.; He, Y.P. Responsibility allocation of China’s provincial net carbon transfer from the perspective of value-added. China Popul. Resour. Environ. 2021, 31, 15–25. [Google Scholar]
  7. Shao, L.; Li, Y.; Feng, K.S.; Meng, J.; Shan, Y.L.; Guan, D.B. Carbon emission imbalances and the structural paths of Chinese regions. Appl. Energy 2018, 215, 396–404. [Google Scholar] [CrossRef] [Green Version]
  8. Andrew, R.M.; Peters, G.P. A multi-region input-output table based on the global trade analysis project database (GTAP-MRIO). Econ. Syst. Res. 2013, 25, 99–121. [Google Scholar] [CrossRef]
  9. Gavrilova, O.; Jonas, M.; Erb, K.; Haberl, H. International trade and Austria’s livestock system: Direct and hidden carbon emission flows associated with production and consumption of products. Ecol. Econ. 2010, 69, 920–929. [Google Scholar] [CrossRef]
  10. Kankesu, J.; Liu, Y. Bi-lateral CO2 emissions embodied in Australia-China trade. Energy Policy 2016, 92, 205–213. [Google Scholar] [CrossRef] [Green Version]
  11. Yu, Y.; Chen, F.F. Research on carbon emissions embodied in trade between China and South Korea. Atmos. Poll. Res. 2017, 8, 56–63. [Google Scholar] [CrossRef]
  12. Liu, Y.; Chen, S.; Chen, B.; Yang, W. Analysis of CO2 emissions embodied in China’s bilateral trade: A non-competitive import input-output approach. J. Clean. Prod. 2017, 163, S410–S419. [Google Scholar] [CrossRef]
  13. Mi, Z.F.; Meng, J.; Green, F.; Coffman, D.M.; Guan, D.B. China’s “exported carbon” peak: Pattern, drivers, and implications. Geophys. Res. Lett. 2018, 45, 4309–4318. [Google Scholar] [CrossRef] [Green Version]
  14. Wu, S.M.; Wu, Y.R.; Lei, Y.L.; Li, S.T.; Li, L. Chinese provinces’CO2 emissions embodied in imports and exports. Earth’s Future 2018, 6, 867–888. [Google Scholar] [CrossRef]
  15. Wu, S.M.; Li, S.T.; Lei, Y.L.; Li, L. Temporal changes in China’s production and consumption-based CO2 emissions and the factors contributing to changes. Energy Econ. 2020, 89, 104770. [Google Scholar] [CrossRef]
  16. Liu, B.Q.; Sun, C.W. Evaluating carbon dioxide emissions in international trade of China. Energy Policy 2010, 38, 613–621. [Google Scholar] [CrossRef]
  17. Wu, R.; Geng, Y.; Dong, H.J.; Fujita, T.; Tian, X. Changes of CO2 emissions embodied in China-Japan trade: Drivers and implications. J. Clean. Prod. 2016, 112, 4151–4158. [Google Scholar] [CrossRef]
  18. Chen, G.Q.; Chen, B. Tracking inter-regional carbon flows: A hybrid network model. Environ. Sci. Technol. 2016, 50, 4731–4741. [Google Scholar] [CrossRef] [PubMed]
  19. Zhang, Z.K.; Guo, J.E.; Hewing, G.J.D. The effects of direct trade within China on regional and national CO2 emissions. Energy Econ. 2014, 46, 161–175. [Google Scholar] [CrossRef]
  20. Ning, Y.; Miao, L.; Ding, T.; Zhang, B. Carbon emission spillover and feedback effects in China based on a multiregional input-output model. Resour. Conserv. Recycl. 2019, 141, 211–218. [Google Scholar] [CrossRef]
  21. Meng, L.; Guo, J.E.; Chai, J.E.; Zhang, Z.K. China’s regional CO2 emissions: Characteristics, inter-regional transfer and emission reduction policies. Energy Policy 2011, 39, 6136–6144. [Google Scholar] [CrossRef]
  22. Guo, J.E.; Zhang, Z.K.; Meng, L. China’s provincial CO2 emissions embodied in international and interprovincial trade. Energy Policy 2012, 42, 486–497. [Google Scholar] [CrossRef]
  23. Feng, K.S.; Steven, J.D.; Sun, L.X.; Li, X.; Guan, D.B.; Liu, W.D.; Liu, Z.; Hubacek, K. Outsourcing CO2 within China. Proc. Natl. Acad. Sci. USA 2013, 110, 11654–11659. [Google Scholar] [CrossRef] [Green Version]
  24. Sun, L.C.; Qin, L.; Taghizadeh-Hesary, F.; Zhang, J.J.; Mohsin, M.; Chaudhry, I.S. Analyzing carbon emission transfer network structure among provinces in China: New evidence from social network analysis. Environ. Sci. Poll. Res. 2020, 27, 23281–23300. [Google Scholar] [CrossRef]
  25. Guan, D.B.; Hubacek, K.; Weber, C.L.; Peters, G.P.; Reiner, D.M. The drivers of Chinese CO2 emissions from 1980 to 2030. Glob. Environ. Change 2008, 18, 626–634. [Google Scholar] [CrossRef] [Green Version]
  26. Lenzen, M.; Pade, L.L.; Munksgaard, J. CO2 multipliers in multi-region input-output models. Econ. Syst. Res. 2004, 16, 391–412. [Google Scholar] [CrossRef]
  27. Su, B.; Ang, B.W. Multi-region input-output analysis of CO2 emissions embodied in trade: The feedback effects. Ecol. Econ. 2011, 71, 42–53. [Google Scholar] [CrossRef]
  28. Wiebe, K.S.; Bruckner, M.; Giljum, S.; Lutz, C.; Polzin, C. Carbon and materials embodied in the international trade of emerging economies a multiregional input-output assessment of trends between 1995 and 2005. J. Indust. Ecolog. 2012, 16, 636–646. [Google Scholar] [CrossRef]
  29. Brizga, J.; Feng, K.S.; Hubacek, K. Household carbon footprints in the Baltic States: A global multi-regional input-output analysis from 1995 to 2011. Appl. Energy 2017, 189, 780–788. [Google Scholar] [CrossRef]
  30. Wang, Y.H.; Xiong, S.Q.; Ma, X.M. Carbon inequality in global trade: Evidence from the mismatch between embodied carbon emissions and value added. Ecol. Econ. 2022, 195, 107398. [Google Scholar] [CrossRef]
  31. Steinberger, J.K.; Roberts, J.T.; Peters, G.P.; Baiocchi, G. Pathways of human development and carbon emissions embodied in trade. Nat. Clim. Change 2012, 2, 81–85. [Google Scholar] [CrossRef]
  32. Hubacek, K.; Baiocchi, G.; Feng, K.; Castillo, R.M.; Sun, L.X.; Xue, J.J. Global carbon inequality. Energy Ecol. Environ. 2017, 2, 361–369. [Google Scholar] [CrossRef] [Green Version]
  33. Duan, Y.W.; Yan, B.Q. Economic gains and environmental losses from international trade: A decomposition of pollution intensity in China’s value-added trade. Energy Econ. 2019, 83, 540–554. [Google Scholar] [CrossRef]
  34. Lu, M.J.; Chen, H.M. Review of research on carbon emission inequality. Resour. Sci. 2013, 35, 1617–1624. [Google Scholar]
  35. Heil, M.T.; Wodon, Q.T. Inequality in CO2 emissions between poor and rich countries. J. Environ. Dev. 1997, 6, 426–452. [Google Scholar] [CrossRef]
  36. Groot, L. Carbon Lorenz curves. Resour. Energy Econ. 2010, 32, 45–64. [Google Scholar] [CrossRef]
  37. Pan, X.Z.; Teng, F.; Wang, G. A comparison of carbon allocation schemes: On the equity-efficiency tradeoff. Energy 2014, 74, 222–229. [Google Scholar] [CrossRef]
  38. Teng, F.; He, K.J.; Pan, X.Z.; Zhang, C. How to measure carbon equity: Carbon Gini index based on historical cumulative emission per capita. Clim. Change Res. 2010, 6, 449–455. [Google Scholar] [CrossRef] [Green Version]
  39. Yang, B.C.; Li, X.T.; Su, Y.P.; Liu, C.Z.; Xue, F.Z. Carbon quota allocation at the provincial level in China under principles of equity and efficiency. Carbon. Manag. 2020, 11, 11–23. [Google Scholar] [CrossRef]
  40. Hedenus, F.; Azar, C. Estimates of trends in global income and resource inequalities. Ecol. Econ. 2005, 55, 351–364. [Google Scholar] [CrossRef]
  41. Padilla, E.; Serrano, A. Inequality in CO2 emissions across countries and its relationship with income inequality: A distributive approach. Energy Policy 2006, 34, 1762–1772. [Google Scholar] [CrossRef] [Green Version]
  42. Clarke-Sather, A.; Qu, J.S.; Wang, Q.; Zeng, J.J.; Li, Y. Carbon inequality at the sub-national scale: A case study of provincial-level inequality in CO2 emissions in China 1997–2007. Energy Policy 2011, 39, 5420–5428. [Google Scholar] [CrossRef]
  43. Han, M.Y.; Lao, J.M.; Yao, Q.H.; Zhao, B.; Meng, J. Carbon inequality and economic development across the Belt and Road regions. J. Environ. Manag. 2020, 262, 110250. [Google Scholar] [CrossRef] [PubMed]
  44. Song, D.Y.; Liu, X.P. Study on spatial allocation of carbon emissions among provinces in China. China Popul. Resour. Environ. 2013, 23, 7–13. [Google Scholar] [CrossRef]
  45. Leontief, W. Environmental repercussions and the economic structure: An input-output approach. Rev. Econ. Stat. 1970, 52, 262–271. [Google Scholar] [CrossRef]
  46. Chen, H.; Wen, J.; Pang, J.; Chen, Z.; Wei, Y.S. Research on the carbon transfer and carbon equity at provincial level of China based on MRIO model of 31 provinces. China Environ. Sci. 2020, 40, 5540–5550. [Google Scholar] [CrossRef]
  47. Cao, T.; Wang, S.G.; Chen, B. Virtual water analysis for the Jing-Jin-Ji region based on multi-regional input-output model. Acta Ecol. Sin. 2018, 38, 788–799. [Google Scholar] [CrossRef]
  48. Zheng, H.R.; Zhang, Z.K.; Wei, W.D.; Song, M.L.; Dietzenbacher, E.; Wang, X.Y.; Meng, J.; Shan, Y.L.; Ou, J.M.; Guan, D.B. Regional determinants of China’s consumption-based emissions in the economic transition. Environ. Res. Lett. 2020, 15, 074001. [Google Scholar] [CrossRef]
  49. He, K.; Hertwich, E.G. The Flow of Embodied Carbon Through the Economies of China, the European Union, and the United States. Resour. Conserv. Recycl. 2019, 145, 190–198. [Google Scholar] [CrossRef]
  50. Yue, S.J.; Wang, X.L. Differences in energy consumption of manufacturing in Yangzi River Delta: A study from the perspective of Industry segmentation. J. Southeast. Univ. (Philos. Soc. Sci.) 2014, 16, 38–43, 134–135. [Google Scholar] [CrossRef]
  51. Li, Y.M.; Niu, M.M.; Zhang, H.L. Comparison of economic benefits and embodied carbon emissions of intraregional valueadded trade in the Beijing-Tianjin-Hebei region. Resour. Sci. 2019, 41, 1619–1629. [Google Scholar] [CrossRef]
  52. Wang, M.; Feng, C. Tracking the inequalities of global per capita carbon emissions from perspectives of technological and economic gaps. J. Environ. Manag. 2022, 315, 115144. [Google Scholar] [CrossRef] [PubMed]
  53. Wang, Y. New Opportunities and Challenges for China’s Industrial Upgrading in the 14th Five-YearPlan Period: A New Struc-tural Economics Perspective. Int. Econ. Rev. 2021, 151, 56–75+5. [Google Scholar]
  54. Song, C.Y.; Zhang, Z.M.; Xu, W.H.; Elshkaki, A. The spatial effect of industrial transfer on carbon emissions under firm location decision:A carbon neutrality perspective. J. Environ. Manag. 2023, 330, 117139. [Google Scholar] [CrossRef] [PubMed]
Figure 1. Location map of the Yangtze River Economic Belt. Note: Compiled and obtained by the authors.
Energies 16 04942 g001
Figure 2. Carbon Lorentz curve.
Energies 16 04942 g002
Figure 3. Production- and consumption-based emissions and value added of eleven provinces in the YEB in 2017. (a) Production- and consumption-based carbon emissions (Unit: Mt CO2); (b) Production- and consumption-based value added (Unit: trillion CNY). Note: Compiled and obtained by the authors.
Energies 16 04942 g003
Figure 4. Net transfer of carbon emissions and economic benefits embodied in interprovincial trade of the YEB in 2017. (a) Net carbon emission transfer in the YEB (unit: Mt CO2); (b) Net value added transfer in the YEB (unit: billion CNY). Note: Compiled and obtained by the authors.
Energies 16 04942 g004aEnergies 16 04942 g004b
Figure 5. Relationships between the net transfer of embodied carbon emissions and value added of eleven provinces in the YEB. Note: Compiled and obtained by the authors.
Energies 16 04942 g005
Figure 6. Carbon Lorentz curve of the YEB from the bilateral perspective in 2017. (a) Carbon Lorentz curve from the production perspective; (b) Carbon Lorentz curve from the consumption perspective. Note: Compiled and obtained by the authors.
Energies 16 04942 g006
Figure 7. Carbon deviation coefficient of eleven provinces in the YEB from the bilateral perspective in 2017. Note: Compiled and obtained by the authors.
Energies 16 04942 g007
Table 1. YEB-MRIO table.
Intermediate DemandFinal DemandExportTotal
Output
Region
1
Region 11Region 12Region 1 Region 11Region 12
Intermediate
input
Region 1 Z 11 Z 1   11 Z 1   12 Y 11 Y 1   11 Y 1   12 E 1 X 1
Region 2 Z 21 Z 2   11 Z 2   12 Y 21 Y 2   11 Y 2   12 E 2 X 2
Region 11 Z 11   1 Z 11   11 Z 11   12 Y 11   1 Y 11   11 Y 11   12 E 11 X 11
Region 12 Z 12   1 Z 12   11 Z 12   12 Y 12   1 Y 12   11 Y 12   12 E 12 X 12
Import M 1 M 11 M 12
Value added V 1 V 11 V 12
Total input X 1 X 2 X 12
Disclaimer/Publisher’s Note: The statements, opinions and data contained in all publications are solely those of the individual author(s) and contributor(s) and not of MDPI and/or the editor(s). MDPI and/or the editor(s) disclaim responsibility for any injury to people or property resulting from any ideas, methods, instructions or products referred to in the content.

