Abstract
The 2030 zero-net emission target in the E.U. demands a significant improvement in the energy performance of the building stock. This study analyses the adoption of connected thermostats and Home energy-management system solutions (HEMS) as an effective means to tackle the residential energy footprint. It reviews the main features of HEMS systems in terms of technology, cross-study performances, and the obstacles to widespread adoption; the study adopts the case-study methodology to examine the impact on the Italian real estate stock at a regional level. A matrix of adoption scenarios assesses the potential benefits of global residential energy savings, weighted by local climatic variations, dimension, number of single dwellings, and average primary energy reduction per household. Results demonstrate that all adoption scenarios dramatically reduce residential energy consumption, outperforming the E.U. targets for Italy by 2030.
1. Introduction
1.1. EU 2030 Targets on Building Efficiency and Residential Energy Consumption
Vast empirical evidence in single-country and multi-country studies from developed and developing countries found energy consumption to be the primary source of carbon emission [1], showing that energy intensity has a unidirectional [2,3] and bidirectional, casual relationship [4,5] to the rise of per-capita CO2 emissions.
To tackle this environmental and social issue, the European Union (E.U.) 2030 agenda was set to meet the Sustainable Development Goals (SDGs) with the commitment to reduce energy consumption by more than 20% by 2020 and 32.5% by 2030 [6]. However, energy consumption values Gini coefficients indicate a moderately high concentration in the five largest 27 EU economies: Germany, France, Italy, Spain, and Poland [7].
Among these five countries, the final energy consumption per capita of the three leading European industrial powerhouses are visually displayed in Figure 1.
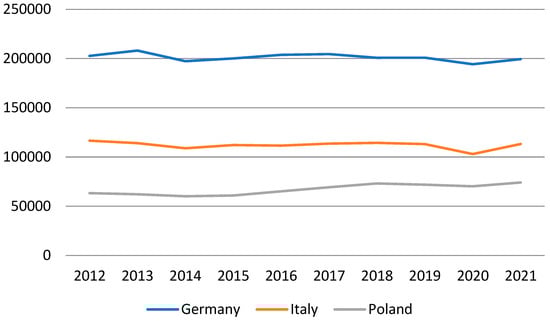
Figure 1.
Final energy consumption in thousand tonnes of oil equivalent. Source: own elaboration based on EUROSTAT [8].
In the time series while Germany’s economy has seen a stable or slightly declining energy consumption the equally dynamic Polish economy significantly increased energy consumption.
These differences might be explained by the Environmental Kuznets Curve (EKC) hypothesis extensively tested globally. According to the EKC, the relationship between income level and carbon emissions, which is causally linked to energy consumption, presents an “inverted U-shaped” curve [9]. Energy intensity may decrease with economic growth because of the technical changes in energy efficiency that accompany economic development [7].
Urbanisation level is another explaining variable causing a positive correlation between economic growth and ecological footprint [10]. The complex causal relationship between economic growth, energy consumption, urbanisation, and carbon footprint is underlined in the highly urbanised European environment: 40% of energy consumption and 36% of the E.U.’s carbon emissions derive from the building sector [11].
In fact, the European building stock is tending to obsolescence as 75% of it in the E.U. cannot be considered energy efficient as only 3% is classified as “EPC class A” or “very efficient”. However, 85–95% of it will last longer than 2050, thus ushering in need for massive continental renovation programs [12].
The 2019 Green Deal program led to a broad Renovation Wave strategy, aiming to revamp 35 million buildings by 2030, bringing an estimated EUR 291bn in environmental, economic, and social benefits related to energy poverty reduction [13]. A complete overhaul of the E.U. stock would necessitate ‘deep’ renovation, meaning more than 60% savings in energy consumption for 70% of the buildings [14].
The first issue is the cleavage, visually displayed in Figure 2, between Western/Northern EU countries, where energy efficiency programs have been in place for decades, and Eastern/Southern European member states, where the building stock is outdated and highly inefficient.
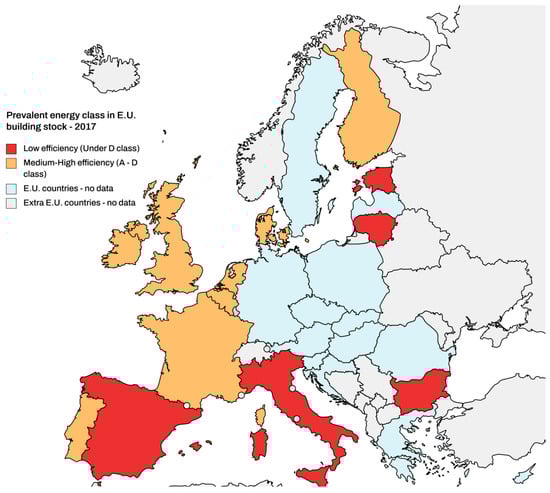
Figure 2.
European map with the prevalence of building stock within two categories: low efficiency (under D class) and medium-high efficiency (A–D class). Source: map created by authors with Mapchart.net based on BPIE data [14].
The Renovation Wave strategy presents significant technical and social obstacles [15] to achieve its ambitious goals, given the need to raise the annual deep renovation rates to 3% by 2030 [13]. Still, the major impediment would be the massive financial burden of such programs, even in affluent countries like Germany [16].
Consequently, enhancing the energetic performance with light and low-cost alternatives to deep renovation works is necessary, especially for late-comer countries forced to catch up on sustainable buildings. European legislative policies have recently backed up this option suggesting Home energy-management system solutions (HEMS) as a viable choice.
The E.U. Directive 2018/844 recommends member countries adopt Smart Readiness Indicators (SRIs) [17], a framework evaluating the capability of buildings to employ information and communication technologies (ICTs), to improve the lives of the tenants and to be integrated into the broader urban grid [18].
The cornerstone of the European legislative framework currently in place is the Energy Efficiency Directive (EED) [19], following which national governments are required to submit and periodically update National Energy Efficiency Action Plans (NEEAPs) [20].
In compliance with art. 7 of the Energy Efficiency Directive, every country has to present a National Energy Efficiency Action Plan. In 2018, the Italian government introduced the National Integrated Plan for Energy and Climate targeting a decrease in final energy consumption to approx. 9.3 Mtoe/year. Most of the forecasted reduction in energy consumption, about 5.7 Mtoe, is planned to be achieved in the civil sector, namely in the residential realm [21].
However, decarbonisation technologies, such as transport and heating electrification, are energy intensive. The Italian energy utility Terna projected two national scenarios derived from Italian and European ENTSO scenarios [22]:
- (1)
- Fit-for-55 (FF55): reaching E.U. emission goals for 2030 which imply a significant electrification process in transportation and residential heating.
- (2)
- “Late Transition” scenario: reaching E.U. emission target five years late.
In Italy, energy-saving policies in the residential sector are primarily driven by tax detraction and credit-based government incentives, such as Ecobonus, and, more recently, Superbonus. Ecobonus featured a 65% tax detraction on building automation installations and has a decade-long track record. Therefore, it has been used as a reference in this paper [22].
1.2. Smart Home/HEMS Definition, Components, and Technologies
Several definitions apply to smart-home environments starting from popularising the term in the early 2010s. Smart homes are defined as residences equipped with an IoT-integrated network linking sensors and domestic devices or appliances, whose features can be remotely monitored, accessed, or controlled to provide services to the inhabitants for a better quality of living in terms of safety, comfort, and energy saving [23].
The convergence of technological developments on energy efficiency and heightened ecological sensibility led to the concept of home energy-management systems (HEMS): a network of IoT devices helping to manage energy consumption Connected devices allow users to control appliance usage and schedule power cycles without human intervention, enabling home control and monitoring from afar [24].
Users can control and monitor smart-home appliances remotely through the home energy-management system (HEMS), essentially a remote monitoring system employing telecommunication technology and sensors [25].
The literature on the social dynamics of energy consumption suggests that feedback on usage data enables energy savings through rational behavioural changes [26,27]. HEMS systems include devices ranging from connected thermostats, smart meters, and energy-monitoring tools to automated lighting, heating, and cooling controls.
Blurry boundaries separate the concept of home automation and smart building; therefore, energy efficiency systems can extend to smart plugs and plug load automation [28], connected P.V. panels for renewable energy production [29], smart building controls [30], and building energy assessment [31].
There are hundreds of HEMS devices on the market able to implement energy savings through both behavioural and operational changes [32] but for a functional scope. This research is mainly limited to the benchmark HEMS technologies presented by Urban et al. [33] summarized in Table 1 and implemented in residential housing, but the field is rapidly expanding.

Table 1.
Selected HEMS approaches by technology. Source: Urban et al., “Energy savings from five home automation technologies: A scoping study of technical potential.” Boston, MA, Fraunhofer USA Center for Sustainable Energy Systems (2016) [33].
Most of these technologies optimise the power consumption of heating, ventilation, and cooling (HVAC) appliances, the largest source of residential energy utilisation. A quantitative study conducted by Noro et al. [34] in 2023 on the most effective residential primary energy savings actions confirms that the focus of interventions should be the heating/cooling generation system.
Many interesting developments are taking place in energy efficiency. Integration with artificial intelligence through the deployment of sensors collects data for machine learning techniques [35], allows the algorithm to learn the users’ consumption habits, and generates consumption predictions [36]. A.I. allows data-driven predictive control via methods like time-series forecasting (TSF) and reinforcement learning (RL) [30].
As HVAC efficiency improves but the ICT devices’ mass diffusion continues, the energy consumption of plug loads is set to become the highest factor. To face this issue, experimental IoT-based occupancy-driven plug load management systems can potentially reduce user burden through smart automation and load monitoring [28].
ICT diffusion can be leveraged by offering innovative digital services interoperable with existing geographic web-service infrastructures, supporting energy efficiency at the urban and building level. These platforms could enable automatic large-scale assessment of building energy behaviour based on data available from public services [31].
The communication protocols connecting the devices are also expanding and evolving. Technology providers employ a range of protocols, such as Z-Wave [37], Zigbee [38], Wi-Fi [39], IPv6 [40], Lorawan [41], and Bluetooth [42,43,44], combining the features of fast connectivity, low frequency, long-distance communication, and flexibility. Smart building applications use different automation protocols like KNX, En-Ocean, 1-wire, BACnet, C-Bus, CC-link, and DALI [45] but data protection studies also proposed blockchain-based smart homes [46].
1.3. HEMS Social Barriers, ICT Penetration, and Adoption Rate
HEMS systems have been on the market for quite a long time as part of the growing “Internet of Things”, but the adoption rate of these technologies is lagging behind expectations, with significant differences among geographies.
A survey on individual adoption in the E.U. countries, illustrated in Figure 3, is evidence of the spread between early adopters in Northern Europe and the rest. Interviews in Denmark, Ireland, Estonia, and Sweden claim an adoption rate nearing or surpassing the 15% threshold, while the Netherlands is a positive outlier with a 65% adoption rate.
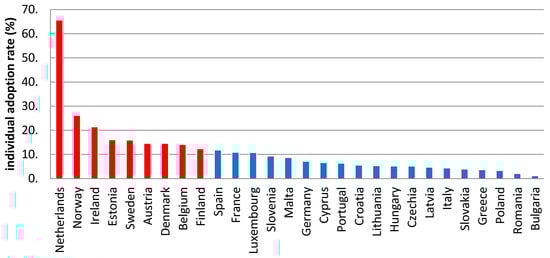
Figure 3.
Individuals use internet-connected thermostats, utility meters, lights, plug-ins, or other internet-connected solutions for energy management for their home. Early adopters in Northern and Western Europe are marked in red for didascalic purposes, while late comers in Southern, Central and Eastern Europe are marked in blue. Source: own elaboration based on EUROSTAT [47].
Italy and its peers in Southern and Eastern Europe are positioned among the technological latecomers at the lower end of the adoption spectrum. Data on smart home penetration in the Italian market, which has only seen an acceleration in recent years, as seen in Figure 4, is backing the need for a technological catch-up.
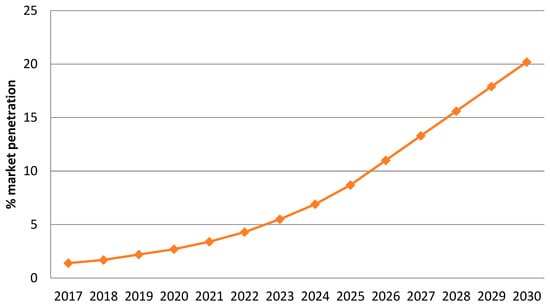
Figure 4.
Smart home market penetration projection in the Italian market. Source: own elaboration based on Statista data [48].
This abysmal diffusion of smart homes in Italy could be related to environmental and social factors. Real estate data reports 75.2% of Italian households living in owner-occupied dwellings; therefore, the adoption choice lies in the subjective perception, sometimes conditioned by a lack of awareness of the single tenant, ignoring potential energy benefits [49].
Another decisive factor is the scarce competencies of users and installers (e.g., awareness and technical training), which are essential for any sustainable development initiative to succeed [50]. In a survey interrogating construction companies conducted by Politecnico di Milano, 42% denounced the difficulty of hiring tech-savvy and skilled collaborators as the major obstacle to realizing smart buildings [51].
The COVID effect on technology adoption could explain the increased growth rate detected in a 2021 study asserting that smart home systems’ social acceptance heightened as a consequence of the social disruptions, policy changes, and activities of organizations [52]. In this timeframe, data consistently show growing internet access, a critical smart home enabler, facilitating citizens’ empowerment for better-informed decision-making on energy management [53].
This global trend is confirmed by Figure 5, displaying drastic improvement in internet access during the COVID years. Rural areas in the Italian South, like Calabria and Molise, saw a considerable 10–15% increase. Still, regions in the North also improved across the board, leading to national ICT coverage per household of up to 91% by the end of 2022.
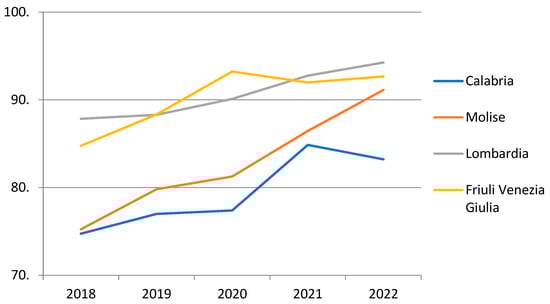
Figure 5.
Households with access to the internet at home in selected Italian NUTS 2 regions. Source: own elaboration based on EUROSTAT [54].
Anyhow, effective residential energy management takes much more than simple ICT penetration. Smart homes and buildings require citizens, public administrators, and energy managers, since the attitude towards energy saving in the public sphere, the technical skills and the privacy practices regarding energy consumption and management are as crucial as the technology itself [55]. Without directed policies, the critical variable in future scenarios is the citizens’ participation rate, which is strictly connected to IoT acceptance levels in the population [56].
Consumers are aware of the smart home’s potential to support energy management. Still, they are not persuaded by the trade-off with benefits like security, comfort, and convenience, which could imply increased energy consumption [57]. Table 2 outlines the literature regarding benefits and risk factors influencing consumers’ IoT acceptance and mentions the sociological models proposed to assess the perception of these technologies.
Table 2.
Sociological studies and influence factor on IoT acceptance. Source: literature review.
The matrix of influence factors in Table 2 illustrates that energetic performance expectancy has been mentioned in multiple pieces of research as the leading adoption benefit. These findings relate to survey data drawn from the U.K., the leading smart home adopter in Europe, by Sovacool et al., where energy management and energy consumption reduction are considered the most important benefit of smart homes [63].
On the other side, privacy, which is the perceived risk directly related to trust, security, and technological uncertainty, emerges as hurting adoption. To operationalize these qualitative findings, we could assume that the perceived risk would cause a 10% refusal to occur in adoption scenarios even if national policies were in place.
However, before delving into the technology’s pros and cons, the lack of awareness and the intangibility of services remains a primary obstacle. Interestingly, similar benefits and risk factors also appear when the environment changes: findings from an extensive mixed-methods analysis of the smart energy management systems adoption in the workplace suggest educating employees on the system features as they are unaware of their potential and offer assurances about their data usage [64].
Given the abovementioned theoretical framework, the present research aims to examine the capacity of Home Energy Management Systems adoption to significantly improve the energy efficiency in outdated building stocks enough to reach the Sustainable Development Goals (SDGs) targets. The results are fine-tuned accounting variables such as social impact factors, housing features, and local climatic variations to obtain a more realistic overview of the issue.
Few studies have systematically investigated HEMS adoption at the national level. The only complete field studies available in the literature have been conducted in the USA [34] where IoT penetration is extensive, and the present work would like to enrich the empirical literature with results from Europe.
In Europe, however, cross-country comparative research is undermined by the scattering of data among national agencies. Therefore, the authors consider the case study approach the most effective and innovative to gain insight into energy efficiency policies leaving the possibility to scale up in future investigations with a larger scope.
Extensive energy monitoring data from its building automation intervention in renovation works, significant territorial differences, and regular cadastral updates made Italy a good candidate for a case study in Europe.
2. Methods and Materials
2.1. Building Stock and Energy-Saving Data
Although smart technologies can collect granular use data in real-time, making it possible to precisely determine the energy impact of HEMS systems, validate savings, and set up performance baselines is often challenging [65]. Results fluctuate widely, although not unexpectedly since literature emphasizes the impact of household behaviour responding to energy feedback highly individually [66].
Taking into consideration the smart thermostat, the most typical energy device in households, energy savings estimates range from 5.7% in single-family houses and 7.7% in apartments [16] up to 28% when occupancy-based smart thermostat algorithms are deployed [35]. In a large-scale simulation study on smart thermostat in 40 American cities, with different building foundations, energy classifications, and heating source savings, reaching 30% of energy consumption [67]. Energy-saving claims by smart home industry proponents and academic researchers are criticised, arguing that they are based on trials in carefully controlled laboratory conditions rather than in real-life settings [68].
Given the inconsistency in estimates, this study refers to estimations by the U.S. Department of Energy, where the average savings approximate 10% [69], and a cross-study review conducted by the USA Fraunhofer Institute, indicating 9–13% overall savings [33]. For the Italian case study, the only performance assessment of HEMS performance available is published by Politecnico di Milano, highlighting savings of up to 20% in electricity and 23% in heating on average per household. These assessments are summarised in Table 3 for operational use [51].
Table 3.
Reduction in relevant primary energy by technology and average savings. Sources: Urban et al., “Energy savings from five home automation technologies: A scoping study of technical potential.”, Boston, MA, Fraunhofer USA Center for Sustainable Energy Systems (2016); Politecnico di Milano, L’evoluzione del mercato smarthome nel 2022.
2.2. Climatic Variations Impacting Performance
Micro-climatic variations are critical factors impacting energy performance because they affect user preferences for heating and cooling systems, the most energy-consuming component in households [70]. HEMS system behaviour studies concerning seasonal changes and outside temperatures have been conducted mainly for smart thermostats.
Results are not conclusive; while a study points out hot-humid and cold climate zones to have the highest potential for significant savings [71], another indicates temperate climates to be more energy-efficient because of the low discrepancy between indoor and outdoor temperatures, leading to more substantial reductions in HVAC run times and savings [63].
Italy could be considered an ideal test field to assess these assumptions since its latitudinal extension causes the formation of local micro-climates. This study evaluated the average heating and cooling days as the primary marker to illustrate the Köppen climates dividing the peninsula. With over ~3.500 heating degree days in the northernmost regions of Valle d’Aosta and Bolzano Province down to less than ~1000 in Sardegna and the southern Italian regions; Figure 6 indicates a clear pattern connecting geography and local climate.
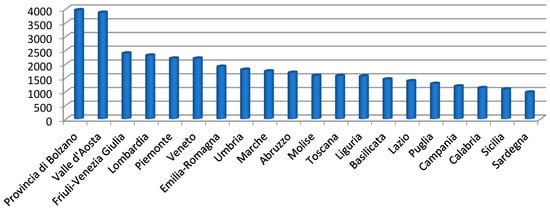
Figure 6.
Cooling and heating degree days by NUTS 3 regions—annual data 2020. Source: own elaboration based on EUROSTAT [72].
Then, climatic data can be correlated with the building automation savings drawn from the estimations of renovation works carried out on the Italian building stock between 2014 and 2020, as indicated in Figure 7.
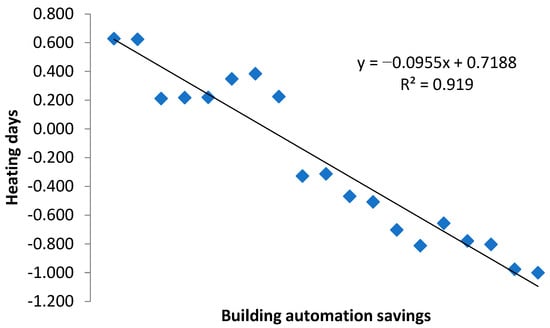
Figure 7.
Correlation index between heating days per region and building automation savings per region in 2020 Ecobonus data. Source: own elaboration based on EUROSTAT [72] and ENEA [73] data.
High R2 indicates that average heating days are strictly correlated to building automation savings, explaining most of the variation in the response variable around its mean. Data about seasonal associations are limited. However, the results are consistent with seminal research by the National Research Council Canada, where Canadian homes exhibit a higher saving of 13% with thermostat setback in winter and set up of 11% in summer [74].
Table 4 estimates HEMS savings based on a regional correlation between building automation installation savings and heating days per year (Si).
Table 4.
Estimated HEMS energy savings by region Source: own elaboration based on Figure 7 data.
These energy savings must be applied to the current Italian building stock’s actual condition in terms of ownership, dimension, and number. The gross area of Italian dwellings is about 4 billion square meters; the average dwelling dimension is 117.42 square meters per household [75]. As outlined in Figure 8, the northern regions’ dwellings (Valle d’Aosta, Piemonte, Liguria, and Lombardia) tend to be smaller, reducing the heating dispersion and reinforcing the overall energy savings by HEMS.
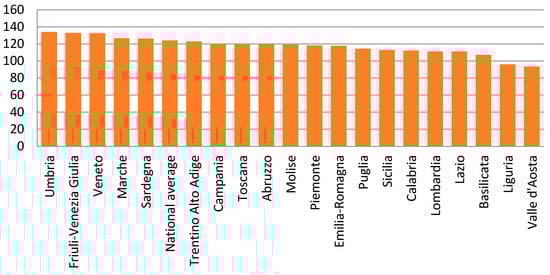
Figure 8.
Regional distribution of average area. Source: Own elaboration from Ministery of Finance data [75].
The average dwelling dimension in sqm is calculated as
where At presents the total gross area of dwelling; N the total number of A group housing units per region.
Di = At/N,
The real estate stock surveyed in the Italian cadastral archives, as of 31 December 2021, consists of more than 77 million properties [73], of which more than half belong to A Group: 35,379,685. This figure encompasses all kinds of residential properties and offices [76], the spaces more likely to be equipped with smart home solutions, due to the limitations of radio communication technologies to connect long distances.
The methodology adopted to estimate the local climatic effect on HEMS saving in the Italian regions can be applied elsewhere to better weigh regional environmental discrepancies in national contexts with high climatic variance, where national averages are not meaningful for policy or research purposes.
To the author’s knowledge, it appears to be the first study to weigh into the savings calculation of the average house dimension at the regional level, allowing to assess local discrepancies in the housing stock, e.g., between urban and rural areas.
As most field studies have been carried out in limited areas and cases, this approach could extend the quantitative assessment of HEMS behaviours in larger spatial contexts without losing empirical detail.
3. Results
This study examines a matrix of four possible scenarios to assess the global energy impact of HEMS adoption and their effectiveness in reaching the European emission target, which applies in the framework of residential energy consumption in Italy in 2030, whose trend is outlined in Figure 9.
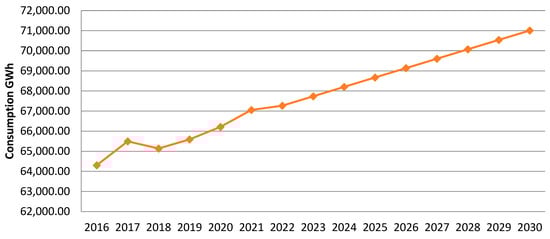
Figure 9.
Actual and projected residential consumption in Italy 2016–2030. Source: own elaboration on Terna historical data and linear projection [77].
If the economic environment is not subjected to other external shocks like in 2022, the trend will likely remain steady until 2030. Although the linear projection estimates a significant increase in overall residential consumption, Table 5 shows that Fit-for-55 and Late Transition scenarios forecast an even higher growth rate in energy consumption based on the electrification wave in heating and other related factors.
Table 5.
2030 energetic residential consumption scenarios. Source: own elaboration and ENEA data [73].
Regional energy consumption data is available at TERNA statistical archives using the parameters issued by the Italian statistical institute to analyse the economic activity by different user categories [77].
Given the national and regional residential consumption data, the effect of HEMS and smart-thermostat adoption scenarios can be laid out in these hypotheses:
- (1)
- A high adoption scenario pushed by a hypothetic national policy is limited only by the boundaries of ICT territorial penetration and individual rejection thresholds.
- (2)
- A low adoption scenario follows private households’ current adoption trend without governmental intervention.
Then, both scenarios are weighted by adopting full HEMS or smart thermostat-only systems in households, whose values are assessed in Section 2.1. Table 6 visually illustrates the matrix.
Table 6.
Adoption and technology scenario matrix Source: own elaboration.
Given the scarcity of large-scale assessments of HEMS adoption, especially outside the U.S., the analysis was based on the conceptual and operational framework proposed by York et al. (2015), one of the few systematic investigations currently available.
In York et al. (2015), global energy savings were calculated by multiplying the % end use attributable to the technology, average savings, ratio of net savings to gross savings, and participation rate. Subsequently, the resulting savings were divided by the projected 2030 U.S. electricity consumption to estimate how much each measure could reduce total U.S. 2030 electricity usage (end use) on a percentage basis [33].
In this investigation, the compound was prepared by adapting the procedure York et al. (2015) used to include features like climatic variations, housing stock, and dwelling dimension on a regional level and transpose variables such as the end user per technology into the overall residential energy consumption. The formula for the average yearly saving per region in residential electric consumption is as follows.
ESPi = [(Si) × (Di) × (Ni)].
ESPi represents the energy saving potential in GWh per region; Si denotes average estimated HEMS savings per sqm weighted by regional disparities; D indicates average dwelling dimension in sqm per region; Ni suggests the number of primary dwellings per region by a scenario where the variable changes according to the various adoption scenarios.
- N1: 90% adoption rate HEMS (Scenario 1) per A group building stock.
- N2: 20% adoption rate HEMS (Scenario 2) per A group building stock.
- N3: 90% adoption rate of smart thermostats only (Scenario 3) per A group building stock.
- N4: 20% adoption rate of smart thermostats only (Scenario 4) per A group building stock.
Calculations on home energy savings refer to 2022 data, while real estate estimates date back to 2016 when a general cadastral survey was carried out. The study assumes that dwelling dimension and the number of primary dwellings per region remain invariant over time, given the declining trend of the Italian demographics, which will lead to lower occupancy rates, even if the overall building stock increases in number, thus decreasing the general HEMS usage [78].
RCi = RCp − ESPi.
RCi represents the 2030 residential consumption projection in GWh per region and per adoption scenario, and RCp stands for the 2030 residential consumption projection in GWh per region, giving the projected 2030 saving per region (Sp):
Sp = ESPi/RCp × 100.
Figure 10 illustrates the impact of energy savings on each Italian region’s projected 2030 residential primary energy consumption in the four scenarios concerning different adoption degrees and technologies.
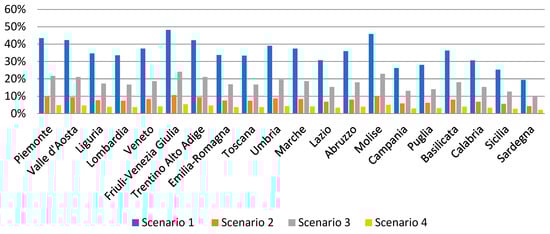
Figure 10.
Regional energy savings percentage by the scenario in 2030. Source: own elaboration.
Finally, Figure 11 provides a visual overview of the national HEMS adoption scenarios and compares them to the European energy consumption target scenarios: ∑R.C.(i).
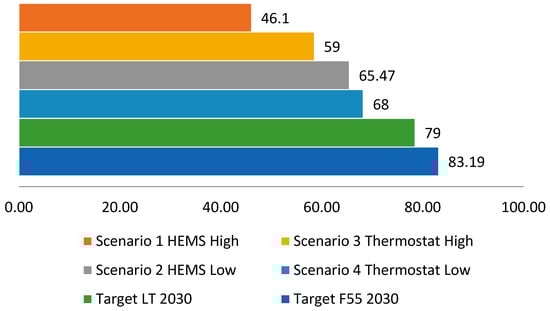
Figure 11.
2030 Global residential consumption in Italy by the scenario in TWh. Source: own elaboration.
4. Discussion
This study set out to assess the importance of HEMS in energy consumption reduction, and the findings broadly support the work of other studies in this area linking the HEMS adoption rate to effective global energy consumption reduction.
Although in a simulation study in Sweden during the early days of the pandemic, the building energy (lighting and appliances) slightly surpassed the HVAC energy consumption [79], the findings by Noro et al. (2023) [34] and the effectiveness of thermostat-only interventions to slash residential energy consumption confirm that HVAC efficiency is the primary enabler of home energy management.
Moreover, the results have practical implications for various players: policy-makers, energy and telecom utilities, manufacturers, and end users. Provided that technical prerequisites are needed to get the full potential of HEMS technology.
Telecom and Energy public utilities would need to integrate single HEMS into Smart city projects with different layers of the Internet of Things communicating by 5G technologies, allowing energy-saving operations on a large scale and complete interconnection with the broader infrastructure [80].
The widespread deployment of Smart home technologies would allow the adoption of a new strategy for energy trading in distributed energy systems [81].
The user’s worry about compatibility and technological uncertainty means that manufacturers, infrastructure providers, and public stakeholders should consider interoperability between their systems and networks. As many players converge towards the Matter platform in the smart home segment, creating a coherent IoT infrastructure is necessary to ensure that hardware and software are externally compatible with communications providers, energy suppliers, or system operators, especially during peak usage [82].
Interconnectedness is crucial to maximizing benefits but privacy risks as a significant impediment to HEMS and smart home adoption. All those single risk points converge to the general lack of trust in this technology or, more likely, the perceived unwillingness by manufacturers and providers to face the users’ concerns convincingly.
Generally speaking, to bring forward technology acceptance in late-comer countries, much higher cooperation among the industry stakeholders is required, as problems such as trust, regulations, lack of technical competencies, and product awareness need different actors’ concerted efforts to overcome.
Throughout the literature, the main perceived utility of HEMS adoption is energy performance and the risks/expectations connected to it. Stakeholders should clarify the value proposition with more real-world estimations of energy saving per device or system installation, providing concrete case studies to the public.
Regarding this factor, perhaps the most critical finding of the study was the positive correlation between building automation energy savings and heating days, consistent with the analysis of seasonal energy efficiency fluctuations by Manning et al. (2007) [74].
This finding implies that policymakers could plan targeted energy renovation interventions according to the local climatic conditions rather than adopting country-wide, inefficient, and costly solutions. Following this direction, there is ample room for further progress in determining which HEMS technology is more cost-effective in each climatic condition.
For this goal, urban-scale “ecomaps” suited for planning activities and large-scale energy pre-certification purposes can be created by transforming HEMS digital platform into a smart service platform accessible from both a web-based client and Apps [31].
Digital technologies might mitigate the lack of perceived usefulness and service intangibility for end users outlined by Hong et al. (2020) [61] and Shuhaiber et al. (2019) [62]. Young users can be effectively engaged by appealing to social influence and hedonic values. A study among Millennials and Gen Zers on energy-efficient app usage intentions found the positive effect of adopting energy-saving attitudes developed during COVID-19 and heightened environmental knowledge [83].
For a more mature audience, policymakers creating energy conservation plans for the residential sector could leverage the demonstrated strong association between energy saving and the intelligence of the built environment [84].
From an assessment of COVID-19’s impact on energy consumption and CO2 emissions, it is evident that the path between households and other economic sectors diverged both in comparative multi-country studies and single-dwelling case studies. While residential consumption increased, industry, services, and transport energy footprint declined [85]. Similarly, an agent-based model tested in a Canadian building showed that the “during COVID-19 scenario energy consumption was higher by 29% compared with the “before COVID-19″scenario [86].
Therefore, the overall reduction effect on energy consumption does not affect the trajectory in the long run [87], and to enforce an effective sustainability policy [88,89,90], policymakers should continue implementing energy management measures horizontally from civil construction to transportation [91,92] and industry [93,94,95].
5. Conclusions
The present research suggests that the widespread adoption of HEMS technologies would play a significant role in achieving 2030 European energy targets. Even in the worst-case scenario (thermostat-only, low adoption rate), the residential energy consumption in Italy would largely remain under the threshold of European targets. In the best-case scenario, full-scale adoption would lower by 44.5%.
The data collection process emerged, energy and housing data are more likely to be accurate and reliable at the national level in Europe. Therefore, only the single-country case-study approach can effectively be scientifically employed to estimate the HEMS system adoption scenarios.
Given this assumption, this methodology presents significant drawbacks to generalizing its conclusions. Sources of uncertainty like the features of national databases (e.g., time and space discrepancies of cadastral surveys), the measurements of microclimatic variations potentially affecting the device’s performances, and the technological differentiation on the consumer market, made possible only a partial generalization of the results.
Another impediment is the relative shortage of real-world experimental studies because industry-standard savings calculation methods are not unanimously established and compare the single estimations is troubling [33]. If simulation-based analyses could oversimplify user behaviour, large-scale randomized field studies are only possible in early adopter countries in North America and Western Europe. On one side, technological evolution, user behaviour, location, and device category could highly impact the results but on the other side, small-scale studies provide only general indications.
In conclusion, the present study aims to lay the groundwork for future research on energy performance data across device categories, climatic regions, and household types. To the best of our knowledge, it is the first effort to evaluate the impact of HEMS adoption scenarios on overall energy consumption in a European context. However, to determine if HEMS performances and global energy savings forecasted for the Italian case also apply on a European scale further modelling work will have to be carried out in future assessments.
Author Contributions
Conceptualisation, F.G. and A.K.; methodology, F.G.; software, F.G.; validation, F.G. and A.K.; formal analysis, F.G.; investigation, F.G.; resources, F.G.; data curation, F.G.; writing—original draft preparation, F.G. and A.K.; writing—review and editing, A.K.; visualisation, F.G. and A.K.; supervision, A.K.; project administration, A.K. All authors have read and agreed to the published version of the manuscript.
Funding
The research received funding via the research subsidy of the Department of Applied Social Sciences of the Faculty of Organization and Management of the Silesian University of Technology in Poland for 2023, grant number 13/020/BK_23/0081. Publication supported by the pro-quality grant of the rector of the Silesian University of Technology, grant number: 13/020/RGJ22/0071.
Data Availability Statement
The data used for the research come from the sources indicated in the article. Data supporting the findings of this study are available from the corresponding author, F.G., upon reasonable request.
Conflicts of Interest
F.G., at the moment of the writing, is a consultant of the company eQ-3 A.G. However, no funding, guidance, interpretation, data, or any other contribution has been offered or received from the company and influenced the study’s conduct.
References
- Waheed, R.; Sarwar, S.; Wei, C. The Survey of Economic Growth, Energy Consumption and Carbon Emission. Energy Rep. 2019, 5, 1103–1115. [Google Scholar] [CrossRef]
- Li, R.; Wang, Q.; Liu, Y.; Jiang, R. Per-Capita Carbon Emissions in 147 Countries: The Effect of Economic, Energy, Social, and Trade Structural Changes. Sustain. Prod. Consum. 2021, 27, 1149–1164. [Google Scholar] [CrossRef]
- Ang, J.B. CO2 Emissions, Energy Consumption, and Output in France. Energy Policy 2007, 35, 4772–4778. [Google Scholar] [CrossRef]
- Shabestari, N.B. Energy Consumption, CO2 Emissions and Economic Growth: Sweden’s Case. Södertörn University, Huddinge, Sweden. 2018. Available online: https://urn.kb.se/resolve?urn=urn:nbn:se:sh:diva-35502 (accessed on 15 May 2023).
- Yifei, C.; Sam, C.Y.; Chang, T. Nexus between Clean Energy Consumption, Economic Growth and CO2 Emissions. J. Clean. Prod. 2018, 182, 1001–1011. [Google Scholar] [CrossRef]
- E.U. Council. Executive Conclusions—Building a Sustainable Europe by 2030—Progress Thus Far and Next Steps. 2019. Available online: https://www.consilium.europa.eu/media/41693/se-st14835-en19.pdf (accessed on 23 April 2023).
- Tahir, M.; Eatzaz, A. The Relationship of Energy Intensity with Economic Growth: Evidence for European Economies. Energy Strategy Rev. 2018, 20, 90–98. [Google Scholar] [CrossRef]
- Eurostat. Final Energy Consumption by Sector. Available online: https://ec.europa.eu/eurostat/databrowser//product/view/TEN00124 (accessed on 10 May 2023).
- Wang, Q.; Zhang, F.; Li, R. Revisiting the Environmental Kuznets Curve Hypothesis in 208 Counties: The Roles of Trade Openness, Human Capital, Renewable Energy and Natural Resource Rent. Environ. Res. 2023, 216, 114637. [Google Scholar] [CrossRef] [PubMed]
- Wang, Q.; Wang, X.; Li, R. Does Urbanisation Redefine the Environmental Kuznets Curve? An Empirical Analysis of 134 Countries. Sustain. Cities Soc. 2022, 76, 103382. [Google Scholar] [CrossRef]
- European Commission. New Rules for Greener and Smarter Buildings Will Increase Quality of Life for All Europeans. Available online: https://commission.europa.eu/news/new-rules-greener-and-smarter-buildings-will-increase-quality-life-all-europeans-2019-04-15_en (accessed on 2 May 2023).
- Communication from the Commission to the European Parliament, The Council, The European Economic and Social Committee and the Committee of the Regions A Renovation Wave for Europe—Greening Our Buildings, Creating Jobs, Improving Lives. 2020. Available online: Https://Eur-Lex.Europa.Eu/Legal-Content/EN/TXT/?Uri=CELEX:52020DC0662 (accessed on 22 April 2023).
- Euractiv. The Housing Renovation Plan Will Be the ‘Flagship’ of the European Green Deal. Available online: https://www.euractiv.com/section/energy-environment/news/housing-renovation-plan-will-be-flagship-of-european-green-deal/ (accessed on 2 May 2023).
- Buildings Performance Institute Europe. 97% of Buildings in the E.U. Need to Be Upgraded > BPIE—Buildings Performance Institute Europe. Available online: https://www.bpie.eu/publication/97-of-buildings-in-the-eu-need-to-be-upgraded/ (accessed on 7 May 2023).
- D’Oca, S.; Ferrante, A.; Ferrer, C.; Pernetti, R.; Gralka, A.; Rizal, S.; Op‘t Veld, P. Technical, Financial, and Social Barriers and Challenges in Deep Building Renovation: Integration of Lessons Learned from the H2020 Cluster Projects. Buildings 2018, 8, 174. [Google Scholar] [CrossRef]
- Schäuble, D.; Marian, A.; Cremonese, L. Conditions for a Cost-Effective Application of Smart Thermostat Systems in Residential Buildings. Appl. Energy 2020, 262, 114526. [Google Scholar] [CrossRef]
- Directive (E.U.) 2018/844 of the European Parliament and of the Council of 30 May 2018 Amending Directive 2010/31/E.U. on the Energy Performance of Buildings and Directive 2012/27/E.U. on Energy Efficiency (Text with EEA Relevance), 156 OJ L §. 2018. Available online: http://data.europa.eu/eli/dir/2018/844/oj/eng (accessed on 22 April 2023).
- Varsami, V.; Burman, E. An Evaluation of the Smart Readiness Indicator Proposed for Buildings. Build. Simul. IBPSA 2021, 17, 573–580. [Google Scholar] [CrossRef]
- Eur Lex. Directive 2012/27/E.U. of the European Parliament and Commission. Available online: https://eur-lex.europa.eu/EN/legal-content/summary/energy-efficiency.html (accessed on 2 May 2023).
- European Commission. Energy Efficiency Directive. Available online: https://energy.ec.europa.eu/topics/energy-efficiency/energy-efficiency-targets-directive-and-rules/energy-efficiency-directive_en (accessed on 7 May 2023).
- Italian Ministry of Economic Development. La Situazione Energetica Nazionale nel 2018. p. 55. Available online: https://www.gse.it/documenti_site/Documenti%20GSE/Rapporti%20statistici/Relazione_annuale_situazione_energetica_nazionale_dati_2018.pdf (accessed on 22 April 2023).
- Terna. Documento di Descrizione degli Scenari. 2022. Available online: https://download.terna.it/terna/Documento_Descrizione_Scenari_2022_8da74044f6ee28d.pdf (accessed on 21 April 2023).
- Balta-Ozkan, N.; Amerighi, O.; Boteler, B. A Comparison of Consumer Perceptions towards Smart Homes in the UK, Germany, and Italy: Reflections for Policy and Future Research. Technol. Anal. Strateg. Manag. 2014, 26, 1176–1195. [Google Scholar] [CrossRef]
- Robles, R.J.; Kim, T.-h. A Review on Security in Smart Home Development. Int. J. Adv. Sci. Technol. 2010, 15, 13–22. [Google Scholar]
- Makhadmeh, S.N.; Khader, A.T.; Al-Betar, M.A.; Naim, S.; Abasi, A.K.; Alyasseri, Z.A.A. Optimization Methods for Power Scheduling Problems in Smart Home: Survey. Renew. Sustain. Energy Rev. 2019, 115, 109362. [Google Scholar] [CrossRef]
- Hargreaves, T.; Nye, M.; Burgess, J. Keeping Energy Visible? Exploring How Householders Interact with Feedback from Smart Energy Monitors in the Longer Term. Energy Policy 2013, 52, 126–134. [Google Scholar] [CrossRef]
- Darby, S.J.; McKenna, E. Social Implications of Residential Demand Response in Cool Temperate Climates. Energy Policy 2012, 49, 759–769. [Google Scholar] [CrossRef]
- Tekler, Z.D.; Low, R.; Yuen, C.; Blessing, L. Plug-Mate: An IoT-Based Occupancy-Driven Plug Load Management System in Smart Buildings. Build. Environ. 2022, 223, 109472. [Google Scholar] [CrossRef]
- Zhou, B.; Li, W.; Chan, K.W.; Cao, Y.; Kuang, Y.; Liu, X.; Wang, X. Smart Home Energy Management Systems: Concept, Configurations, and Scheduling Strategies. Renew. Sustain. Energy Rev. 2016, 61, 30–40. [Google Scholar] [CrossRef]
- Zhuang, D.; Gan, V.J.L.; Tekler, Z.D.; Chong, A.; Tian, S.; Shi, X. Data-Driven Predictive Control for Smart HVAC System in IoT-Integrated Buildings with Time-Series Forecasting and Reinforcement Learning. Appl. Energy 2023, 338, 120936. [Google Scholar] [CrossRef]
- Schrenk, M.; Wasserburger, W.W.; Mušič, B.; Dörrzapf, L. SUNSHINE: Smart UrbaN ServIces for Higher eNergy Efficiency; Verlag der Österreichischen Akademie der Wissenschaften: Wien, Austria, 2013; Volume 1, pp. 18–24. [Google Scholar] [CrossRef]
- Ford, R.; Pritoni, M.; Sanguinetti, A.; Karlin, B. Categories and Functionality of Smart Home Technology for Energy Management. Build. Environ. 2017, 123, 543–554. [Google Scholar] [CrossRef]
- Urban, B.; Roth, K.; Harbor, C.D. Energy Savings from Five Home Automation Technologies: A Scoping Study of Technical Potential; Fraunhofer USA Center for Sustainable Energy Systems: Boston, MA, USA, 2016. [Google Scholar]
- Noro, M.; Busato, F. Energy Saving, Energy Efficiency or Renewable Energy: Which Is Better for the Decarbonization of the Residential Sector in Italy? Energies 2023, 16, 3556. [Google Scholar] [CrossRef]
- Lu, J.; Sookoor, T.; Srinivasa, V.; Gao, G.; Holben, B.; Stankovi, J.; Field, E.; Whitehouse, K. The smart thermostat: Using occupancy sensors to save energy in homes. In Proceedings of the 8th ACM Conference on Embedded Networked Sensor Systems, SenSys ’10, New York, NY, USA, 3 November 2010; Association for Computing Machinery: Las Vegas, NV, USA, 2010; pp. 211–224. [Google Scholar] [CrossRef]
- Rodríguez Fernández, M.; García, A.C.; Alonso, I.G.; Casanova, E.Z. Using the Big Data Generated by the Smart Home to Improve Energy Efficiency Management. Energy Effic. 2016, 9, 249–260. [Google Scholar] [CrossRef]
- Yan, D.; Dan, Z. ZigBee-based Smart Home system design. In Proceedings of the 2010 3rd International Conference on Advanced Computer Theory and Engineering(ICACTE), Chengdu, China, 20–22 August 2010; Volume 2, pp. V2-650–V2-653. [Google Scholar] [CrossRef]
- Zou, Z.; Li, K.-J.; Li, R.; Wu, S. Smart Home System Based on IPV6 and ZIGBEE Technology. Procedia Eng. CEIS 2011, 15, 1529–1533. [Google Scholar] [CrossRef][Green Version]
- Jiang, H.; Cai, C.; Ma, X.; Yang, Y.; Liu, J. Smart Home Based on Wi-Fi Sensing: A Survey. IEEE Access 2018, 6, 13317–13325. [Google Scholar] [CrossRef]
- Liu, Z.; Cao, Q.; Pan, Y.; Chen, G. Security and Privacy Protection of Smart Home Based on IPv6; Atlantis Press: Amsterdam, The Netherlands, 2014; pp. 517–520. [Google Scholar] [CrossRef]
- Souifi, J.; Bouslimani, Y.; Ghribi, M.; Kaddouri, A.; Boutot, T.; Abdallah, H.H. Smart Home Architecture based on LoRa Wireless Connectivity and LoRaWAN® Networking Protocol. In Proceedings of the 2020 1st International Conference on Communications, Control Systems and Signal Processing (CCSSP), El Oued, Algeria, 16–17 May 2020; pp. 95–99. [Google Scholar] [CrossRef]
- Asadullah, M.; Ullah, K. Smart home automation system using Bluetooth technology. In Proceedings of the 2017 International Conference on Innovations in Electrical Engineering and Computational Technologies (ICIEECT), Karachi, Pakistan, 5–7 April 2017; pp. 1–6. [Google Scholar] [CrossRef]
- Kumar, S.; Lee, S.R. Android based smart home system with control via Bluetooth and internet connectivity. In Proceedings of the 18th IEEE International Symposium on Consumer Electronics (ISCE 2014), Jeju, Republic of Korea, 22–25 June 2014; pp. 1–2. [Google Scholar] [CrossRef]
- Smart Living Using Bluetooth-Based Android Smartphone|V.U. Research Repository|Victoria University|Melbourne Australia. Available online: https://vuir.vu.edu.au/40501/ (accessed on 24 April 2023).
- Toylan, M.Y.; Cetin, E. Design and Application of a KNX-Based Home Automation Simulator for Smart Home System Education. Comput. Appl. Eng. Educ. 2019, 27, 1465–1484. [Google Scholar] [CrossRef]
- Kuzior, A.; Sira, M. A Bibliometric Analysis of Blockchain Technology Research Using VOSviewer. Sustainability 2022, 14, 8206. [Google Scholar] [CrossRef]
- Eurostat, Internet of Things—Use—Individuals Used Internet-Connected Thermostats, Utility Meters, Lights, Plug-Ins, or Other Internet-Connected Solutions for Energy Management for Their Home. Available online: https://ec.europa.eu/eurostat/databrowser/view/isoc_iiot_use/default/table?lang=en (accessed on 9 April 2023).
- Statista, Smarthome Market Penetration Projection in the Italian Market. Available online: https://www.statista.com/forecasts/887731/smart-home-penetration-rate-per-segment-in-italy (accessed on 3 April 2023).
- Italian Ministry of Finance. Gli Immobili in Italia—Reddito, Ricchezza, Fiscalità Immobiliare. 2019. Available online: https://www.agenziaentrate.gov.it/portale/web/guest/gli-immobili-in-italia-20191 (accessed on 15 April 2023).
- Kuzior, A. Development of Competences Key to Sustainable Development. Zesz. Naukowe. Organ. I Zarządzanie 2014, 75, 71–81. [Google Scholar]
- La Smart Home Guarda al Futuro: Energia, Servizi, Ecosistemi. Osservatorio Internet of Things; Dipartimento di Ingegneria Gestionale Politecnico di Milano, Milan; Document Availably during the Smart Home Conference, 7 February 2023. Available online: https://www.osservatori.net/it/eventi/on-demand/convegni/smart-home-guarda-futuro-energia-servizi-ecosistemi-convegno (accessed on 30 May 2023).
- Umair, M.; Cheema, M.A.; Cheema, O.; Li, H.; Lu, H. Impact of COVID-19 on IoT Adoption in Healthcare, Smart Homes, Smart Buildings, Smart Cities, Transportation, and Industrial IoT. Sensors 2021, 21, 3838. [Google Scholar] [CrossRef]
- Vlachokostas, C. Smart buildings need smart consumers: The meet-in-the-middle approach towards sustainable management of energy sources. Int. J. Sustain. Energy 2020, 39, 648–658. [Google Scholar] [CrossRef]
- Eurostat. Households with Access to the Internet at Home in Selected Italian NUTS 3 Regions. Available online: https://ec.europa.eu/eurostat/databrowser/product/view/ISOC_R_IACC_H (accessed on 21 April 2023).
- Whitmarsh, L.; Upham, P.; Poortinga, W.; Darnton, A.; McLachlan, C.; Devine-Wright, P.; Sherry-Brennan, F. Public Attitudes to Low-Carbon Energy–Research Synthesis. RCUK. 2011. Available online: https://orca.cardiff.ac.uk/id/eprint/22753/1/EnergySynthesisFINAL20110124.pdf (accessed on 25 May 2023).
- York, D.; Nadel, S.; Rogers, E.; Cluett, R.; Sachs, H.; Amann, J.; Kelly, M. New Horizons for Energy Efficiency. Available online: https://tech-action.unepccc.org/wp-content/uploads/sites/3/2016/03/u1507.pdf (accessed on 14 April 2023).
- Sanguinetti, A.; Karlin, B.; Ford, R. Understanding the Path to Smart Home Adoption: Segmenting and Describing Consumers across the Innovation-Decision Process. Energy Res. Soc. Sci. 2018, 46, 274–283. [Google Scholar] [CrossRef]
- Mulcahy, R.; Letheren, K.; McAndrew, R.; Glavas, C.; Russell-Bennett, R. Are households ready to engage with smart home technology? J. Mark. Manag. 2019, 35, 1370–1400. [Google Scholar] [CrossRef]
- Wang, X.; McGill, T.J.; Klobas, J.E. I Want It Anyway: Consumer Perceptions of Smart Home Devices. J. Comput. Inf. Syst. 2020, 60, 437–447. [Google Scholar] [CrossRef]
- Aldossari, M.Q.; Sidorova, A. Consumer Acceptance of Internet of Things (IoT): Smart Home Context. J. Comput. Inf. Syst. 2020, 60, 507–517. [Google Scholar] [CrossRef]
- Hong, A.; Nam, C.; Kim, S. What Will Be the Possible Barriers to Consumers’ Adoption of Smart Home Services? Telecommun. Policy 2020, 44, 101867. [Google Scholar] [CrossRef]
- Shuhaiber, A.; Mashal, I. Understanding Users’ Acceptance of Smart Homes. Technol. Soc. 2019, 58, 101110. [Google Scholar] [CrossRef]
- Sovacool, B.K.; Furszyfer Del Rio, D.D. Smart Home Technologies in Europe: A Critical Review of Concepts, Benefits, Risks and Policies. Renew. Sustain. Energy Rev. 2020, 120, 109663. [Google Scholar] [CrossRef]
- Tekler, Z.D.; Low, R.; Blessing, L. User Perceptions on the Adoption of Smart Energy Management Systems in the Workplace: Design and Policy Implications. Energy Res. Soc. Sci. 2022, 88, 102505. [Google Scholar] [CrossRef]
- King, J. Energy Impacts of Smart Home Technologies. Report A1801. 2018. Available online: https://www.aceee.org/sites/default/files/publications/researchreports/a1801.pdf (accessed on 14 March 2023).
- Nilsson, A.; Wester, M.; Lazarevic, D.; Brandt, N. Smart Homes, Home Energy Management Systems and Real-Time Feedback: Lessons for Influencing Household Energy Consumption from a Swedish Field Study. Energy Build. 2018, 179, 15–25. [Google Scholar] [CrossRef]
- Pang, Z.; Chen, Y.; Zhang, J.; O’Neill, Z.; Cheng, H.; Dong, B. How Much HVAC Energy Could Be Saved from the Occupant-Centric Smart Home Thermostat: A Nationwide Simulation Study. Appl. Energy 2021, 283, 116251. [Google Scholar] [CrossRef]
- Tirado, H.; Nicholls, S.L.; Strengers, Y. Smart Home Technologies in Everyday Life: Do They Address Key Energy Challenges in Households? Curr. Opin. Environ. Sustain. 2018, 31, 65–70. [Google Scholar] [CrossRef]
- Energy.gov. Programmable Thermostats. Available online: https://www.energy.gov/energysaver/programmable-thermostats (accessed on 7 May 2023).
- Huchuk, B.; O’Brien, W.; Sanner, S. A Longitudinal Study of Thermostat Behaviors Based on Climate, Seasonal, and Energy Price Considerations Using Connected Thermostat Data. Build. Environ. 2018, 139, 199–210. [Google Scholar] [CrossRef]
- Moon, J.W.; Han, S.-H. Thermostat Strategies Impact on Energy Consumption in Residential Buildings. Energy Build. 2011, 43, 338–346. [Google Scholar] [CrossRef]
- Eurostat. Cooling and Heating Degree Days by NUTS 3 Regions—Annual Data. 2020. Available online: https://ec.europa.eu/eurostat/databrowser/product/view/NRG_CHDDR2_A (accessed on 18 April 2023).
- ENEA, Rapporto Annuale Efficienza Energetica, Analisi e Risultati Delle Policy di Efficienza Energetica del Nostro Paese. 2022. Available online: https://www.efficienzaenergetica.enea.it/component/jdownloads/?task=download.send&id=554&catid=9&Itemid=101 (accessed on 4 February 2023).
- Manning, M.M.; Swinton, M.C.; Szadkowski, F.; Gusdorf, J.; Ruest, K. The Effects of Thermostat Setback and Setup on Seasonal Energy Consumption, Surface Temperatures, and Recovery Times at the CCHT Twin House Research Facility. ASHRAE Trans. 2007, 113, 630–642. [Google Scholar]
- Analisi del Parco Immobiliare Nazionale, Consiglio Nazionale Geometri e Geometri Laureati. Available online: https://www.cngegl.it/wp-content/uploads/2023/01/2023_01_12_art_14.pdf (accessed on 23 February 2023).
- Gli Immobili in Italia. Edizione 2019. Ministero dell’Economia e delle Finanze, Dipartimento delle Finanze. A Class Buildings Thein Classification of the Italian Real Estate Registry Encompass: A/1 Abitazioni di tipo Signorile; A/2 Abitazioni di tipo civile; A/3 Abitazioni di tipo Economico; A/4 Abitazioni di tipo Popolare; A/5 Abitazioni di tipo Ultrapopolare; A/6 Abitazioni di tipo Rurale; A/7 Abitazioni in Villini; A/8 Abitazioni in ville; A/9 Castelli, Palazzi di Eminenti pregi Artistici o Storici; A/10 Uffici e studi Privati; A/11 Abitazioni ed alloggi tipici dei luoghi. Available online: https://www.finanze.gov.it/it/inevidenza/Gli-Immobili-in-Italia-edizione-2019/ (accessed on 30 March 2023).
- Terna. Historical Data—Complete Databases on the Yearly Regional Consumption by Economic Category Can Be Found on the Italian Language Version “Annuario Statistico”—“Statistiche Regionali—Year”. Available online: https://www.terna.it/en/electric-system/statistical-data-forecast/statistical-publications (accessed on 4 March 2023).
- McCann, P. Urban futures, population ageing, and demographic decline. Camb. J. Reg. Econ. Soc. 2017, 10, 543–557. [Google Scholar] [CrossRef]
- Zhang, X.; Pellegrino, F.; Shen, J.; Copertaro, B.; Huang, P.; Kumar, P.S.; Lovati, M. A Preliminary Simulation Study about the Impact of COVID-19 Crisis on Energy Demand of a Building Mix at a District in Sweden. Appl. Energy 2020, 280, 115954. [Google Scholar] [CrossRef]
- Skouby, K.E.; Lynggaard, P. Smart Home and Smart City Solutions enabled by 5G, IoT, AAI and CoT Services. In Proceedings of the 1st International Conference on Contemporary Computing Proceedings, Mysore, India, 27–29 November 2014; pp. 874–878. [Google Scholar] [CrossRef]
- Kim, H.; Choi, H.; Kang, H.; Jongbaek, A.; Yeom, S.; Hong, T. A Systematic Review of the Smart Energy Conservation System: From Smart Homes to Sustainable Smart Cities. Renew. Sustain. Energy Rev. 2021, 140, 110755. [Google Scholar] [CrossRef]
- Hargreaves, T.; Wilson, C. Conclusions and Implications for Industry, Policy and Research. In Smart Homes and Their Users; A cura di Tom Hargreaves e Charlie Wilson, 107–122 Human–Computer Interaction Series; Springer International Publishing: Cham, Switzerland, 2017. [Google Scholar] [CrossRef]
- Pop, R.A.; Dabija, D.K.; Pelău, C.; Dinu, V. Usage Intentions, Attitudes, and Behaviors towards Energy-Efficient Applications during the COVID-19 Pandemic. J. Bus. Econ. Manag. 2022, 23, 668–689. [Google Scholar] [CrossRef]
- Fokaides, P.A.; Christoforou, E.A.; Kalogirou, S.A. Legislation Driven Scenarios Based on Recent Construction Advancements towards the Achievement of Nearly Zero Energy Dwellings in the Southern European Country of Cyprus. Energy 2014, 66, 588–597. [Google Scholar] [CrossRef]
- Rokicki, T.; Jadczak, R.; Kucharski, A.; Bórawski, P.; Bełdycka-Bórawska, A.; Szeberényi, A.; Perkowska, A. Changes in Energy Consumption and Energy Intensity in EU Countries as a Result of the COVID-19 Pandemic by Sector and Area Economy. Energies 2022, 15, 6243. [Google Scholar] [CrossRef]
- Khalil, M.A.; Fatmi, M.R. How Residential Energy Consumption Has Changed Due to COVID-19 Pandemic? An Agent-Based Model. Sustain. Cities Soc. 2022, 81, 103832. [Google Scholar] [CrossRef]
- Ray, R.L.; Singh, V.P.; Singh, S.K.; Acharya, B.S.; He, Y. What Is the Impact of COVID-19 Pandemic on Global Carbon Emissions? Sci. Total Environ. 2021, 816, 151503. [Google Scholar] [CrossRef]
- Kwilinski, A.; Lyulyov, O.; Pimonenko, T. Inclusive Economic Growth: Relationship between Energy and Governance Efficiency. Energies 2023, 16, 2511. [Google Scholar] [CrossRef]
- Wolowiec, T.; Kolosok, S.; Vasylieva, T.; Artyukhov, A.; Skowron, L.; Dluhopolskyi, O.; Sergiienko, L. Sustainable Governance, Energy Security, and Energy Losses of Europe in Turbulent Times. Energies 2022, 15, 8857. [Google Scholar] [CrossRef]
- Kuzior, A.; Vakulenko, I.; Kolosok, S.; Saher, L.; Lyeonov, S. Managing the E.U. energy crisis and greenhouse gas emissions: Seasonal ARIMA forecast. Probl. Perspect. Manag. 2023, 21, 383–399. [Google Scholar] [CrossRef]
- Kuzior, A.; Staszek, M. Energy Management in the Railway Industry: A Case Study of Rail Freight Carrier in Poland. Energies 2021, 14, 6875. [Google Scholar] [CrossRef]
- Moradi, S.; Sierpiński, G.; Masoumi, H. System Dynamics Modeling and Fuzzy MCDM Approach as Support for Assessment of Sustainability Management on the Example of Transport Sector Company. Energies 2022, 15, 4917. [Google Scholar] [CrossRef]
- Schulze, M.; Nehler, H.; Ottosson, M.; Thollander, P. Energy Management in Industry—A Systematic Review of Previous Findings and an Integrative Conceptual Framework. J. Clean. Prod. 2016, 112, 3692–3708. [Google Scholar] [CrossRef]
- Samusevych, Y.; Lyeonov, S.; Artyukhov, A.; Martyniuk, V.; Tenytska, I.; Wyrwisz, J.; Wojciechowska, K. Optimal Design of Transport Tax on the Way to National Security: Balancing Environmental Footprint, Energy Efficiency and Economic Growth. Sustainability 2023, 15, 831. [Google Scholar] [CrossRef]
- Kuzior, A.; Sira, M.; Brozek, P. Using Blockchain and Artificial Intelligence in Energy Management as a Tool to Achieve Energy Efficiency. Virtual Econ. 2022, 5, 69–90. [Google Scholar] [CrossRef]


Disclaimer/Publisher’s Note: The statements, opinions and data contained in all publications are solely those of the individual author(s) and contributor(s) and not of MDPI and/or the editor(s). MDPI and/or the editor(s) disclaim responsibility for any injury to people or property resulting from any ideas, methods, instructions or products referred to in the content. |
© 2023 by the authors. Licensee MDPI, Basel, Switzerland. This article is an open access article distributed under the terms and conditions of the Creative Commons Attribution (CC BY) license (https://creativecommons.org/licenses/by/4.0/).