Article

Reservoir Characteristics and Development Model of Subaqueous Pyroclastic Rocks in a Continental Lacustrine Basin: A Case Study of the Chaganhua Subsag in the Changling Fault Depression, Songliao Basin

1
College of Earth Science, Jilin University, Changchun 130061, China
2
Northeast Oil and Gas Branch, SINOPEC, Changchun 130061, China
*
Author to whom correspondence should be addressed.
Energies 2023, 16(13), 4968; https://doi.org/10.3390/en16134968
Submission received: 6 May 2023 / Revised: 13 June 2023 / Accepted: 25 June 2023 / Published: 26 June 2023

Abstract

:
Industrial oil and gas eruptions underwater have been found in the pyroclastic rocks of the Huoshiling Formation in the continental lacustrine basin of the Changling fault depression, Songliao Basin. This paper investigates the reservoir space characteristics, physical characteristics, and pore structure differences of subaqueous pyroclastic reservoirs in the Huoshiling Formation, and the causes of physical property differences of different types of reservoirs and their formation and evolution processes are analyzed. (1) The content of volcanic glass in tuff is higher, the reservoir space is dominated by devitrification pores and dissolution pores, and the coarser the grain size, the more favorable the physical properties, with larger pore sizes and higher porosities. The content of clay minerals in sedimentary tuff is high, the pores between clay minerals are the main pores, and the physical properties of sedimentary tuff are poor. The content of soluble components such as feldspar, debris, and laumontite is high in tuffaceous sandstone, which is dominated by dissolution pores. (2) Primary pores are not developed in the pyroclastic reservoirs in the study area, and the reservoirs are relatively dense, with an average porosity of 2.43% and an average permeability of 0.076 mD. The coarse-grained tuff has the highest porosity, followed by tuffaceous sandstone and fine-grained tuff, and the sedimentary tuff has the least favorable physical properties. (3) Devitrification was an important cause of the high-porosity and ultralow permeability of tuff reservoirs. Two oil and gas charges in the middle diagenetic stage led to the organic acid dissolution of rocks. In addition, fractures can provide migration channels for organic acids and deep hydrothermal fluids, leading to late dissolution, and can connect various scattered dissolution pores to improve the effectiveness of the reservoir space. (4) Coarse-grained tuff reservoirs that developed in the proximal facies are favorable targets for hydrocarbon exploration.

1. Introduction

A gas reservoir was found in volcanic rocks of the Huoshiling Formation in the Chaganhua subsag, Changling fault depression, Songliao Basin. The reservoir was developed in the volcanic edifice of a tuff cone formed by subaqueous eruption in a continental lacustrine basin. The pyroclastic reservoir in the study area yielded high industrial gas production, with an average of 6.52 × 10⁴ m3 of gas per day from a single well during test production, proving that this subaqueous pyroclastic reservoir is promising for exploration and development. Physical tests show that the average porosity of the subaqueous pyroclastic rocks in the study area is 2.43%, corresponding to a low-porosity and ultralow-permeability reservoir. Therefore, there is an urgent need to characterize the micropores developed in different lithological reservoirs to explore the development pattern of the reservoir. There are few studies on subaqueous pyroclastic rock reservoirs formed by underwater eruptions worldwide, and the differences in the reservoir spaces of different lithologies have not been systematically studied.
Approximately 85% of global volcanic activity occurs underwater [1,2], but direct observation of modern explosive underwater volcanic eruptions is difficult due to the abrupt and unpredictable nature of their occurrence, and thus, they are less understood [3,4,5]. Underwater explosive eruptions [6] form mainly pyroclastic rocks [7,8,9,10,11,12,13]. The eruptive sequences of modern underwater eruptions and the interaction between eruptions and water have been studied in detail by previous authors, White [14], Mueller [15], and Kano [16], in their studies of modern subaqueous pyroclastic rock, suggesting that underwater eruptions in shallow water environments mainly produce explosive eruptions, while in deep water, overflow eruptions predominate due to the influence of considerable water pressures. Oil and gas exploration and development have been carried out in several tuff reservoirs, such as the Georgia Samgori field [17], the Jatibarang field [18] in NW Java Basin, Indonesia; the Yoshii–Dongbaisaki gas field [19] in Japan; and the Kora Volcano [20] in Taranaki Basin, New Zealand. The reservoir spaces in tuff reservoirs are mainly secondary pores, which are mainly at the micrometer–nano scale. There has also been some research on ancient subaqueous eruption volcanoes in continental lacustrine basins in China, and subaqueous eruption-produced volcanic clasts have been found in the Yingcheng Formation of the Songliao Basin [21,22,23], the carboniferous strata of the Santanghu Basin [24,25,26], the carboniferous strata of the Junggar Basin [27,28], and Permian volcanic rocks in Southwest Sichuan [29,30] in China. Previous studies on subaqueous pyroclastic rocks have mainly focused on discerning the cause of volcanic eruptive sedimentary palaeogeography by volcanic elemental geochemical methods [31,32,33,34,35,36,37,38]. Huang [39] and Tang [40] found that subaqueous pyroclastic reservoirs have unique characteristics, including the changing relationship between rock properties and petrographic zones, structural configuration, alteration features, and pore and seam development characteristics. The microstructure of subaqueous pyroclastic reservoirs in continental lacustrine basins and their formation and evolution have not yet been systematically studied.
Insufficient understanding of the pore structure of subaqueous pyroclastic reservoirs and the main control factors of the reservoirs has restricted the expansion of the exploration area and the breakthrough of hydrocarbon reserves in the study area. To further clarify the characteristics of volcanic rocks and reservoir control factors of underwater eruptions, the pyroclastic rocks of the Huoshiling Formation in the Chaganhua subsag, Changling fault depression, southern Songliao Basin, are studied in this paper. Based on drilling cores, logging and seismic data, and systematic reservoir experimental analysis, the reservoir types and reservoir microscopic characteristics of different lithologies are studied in relation to the spreading of reservoirs and phase zones to explore the control of the underwater eruption environment on the development of high-quality reservoirs of volcaniclastic rocks, to study the process of reservoir formation and evolution, and to explore the pattern of reservoir spatial development. This study can provide a theoretical basis for later research, exploration, and development of subaqueous pyroclastic rock and provide a reference for the study of tuff reservoirs in other similar areas.

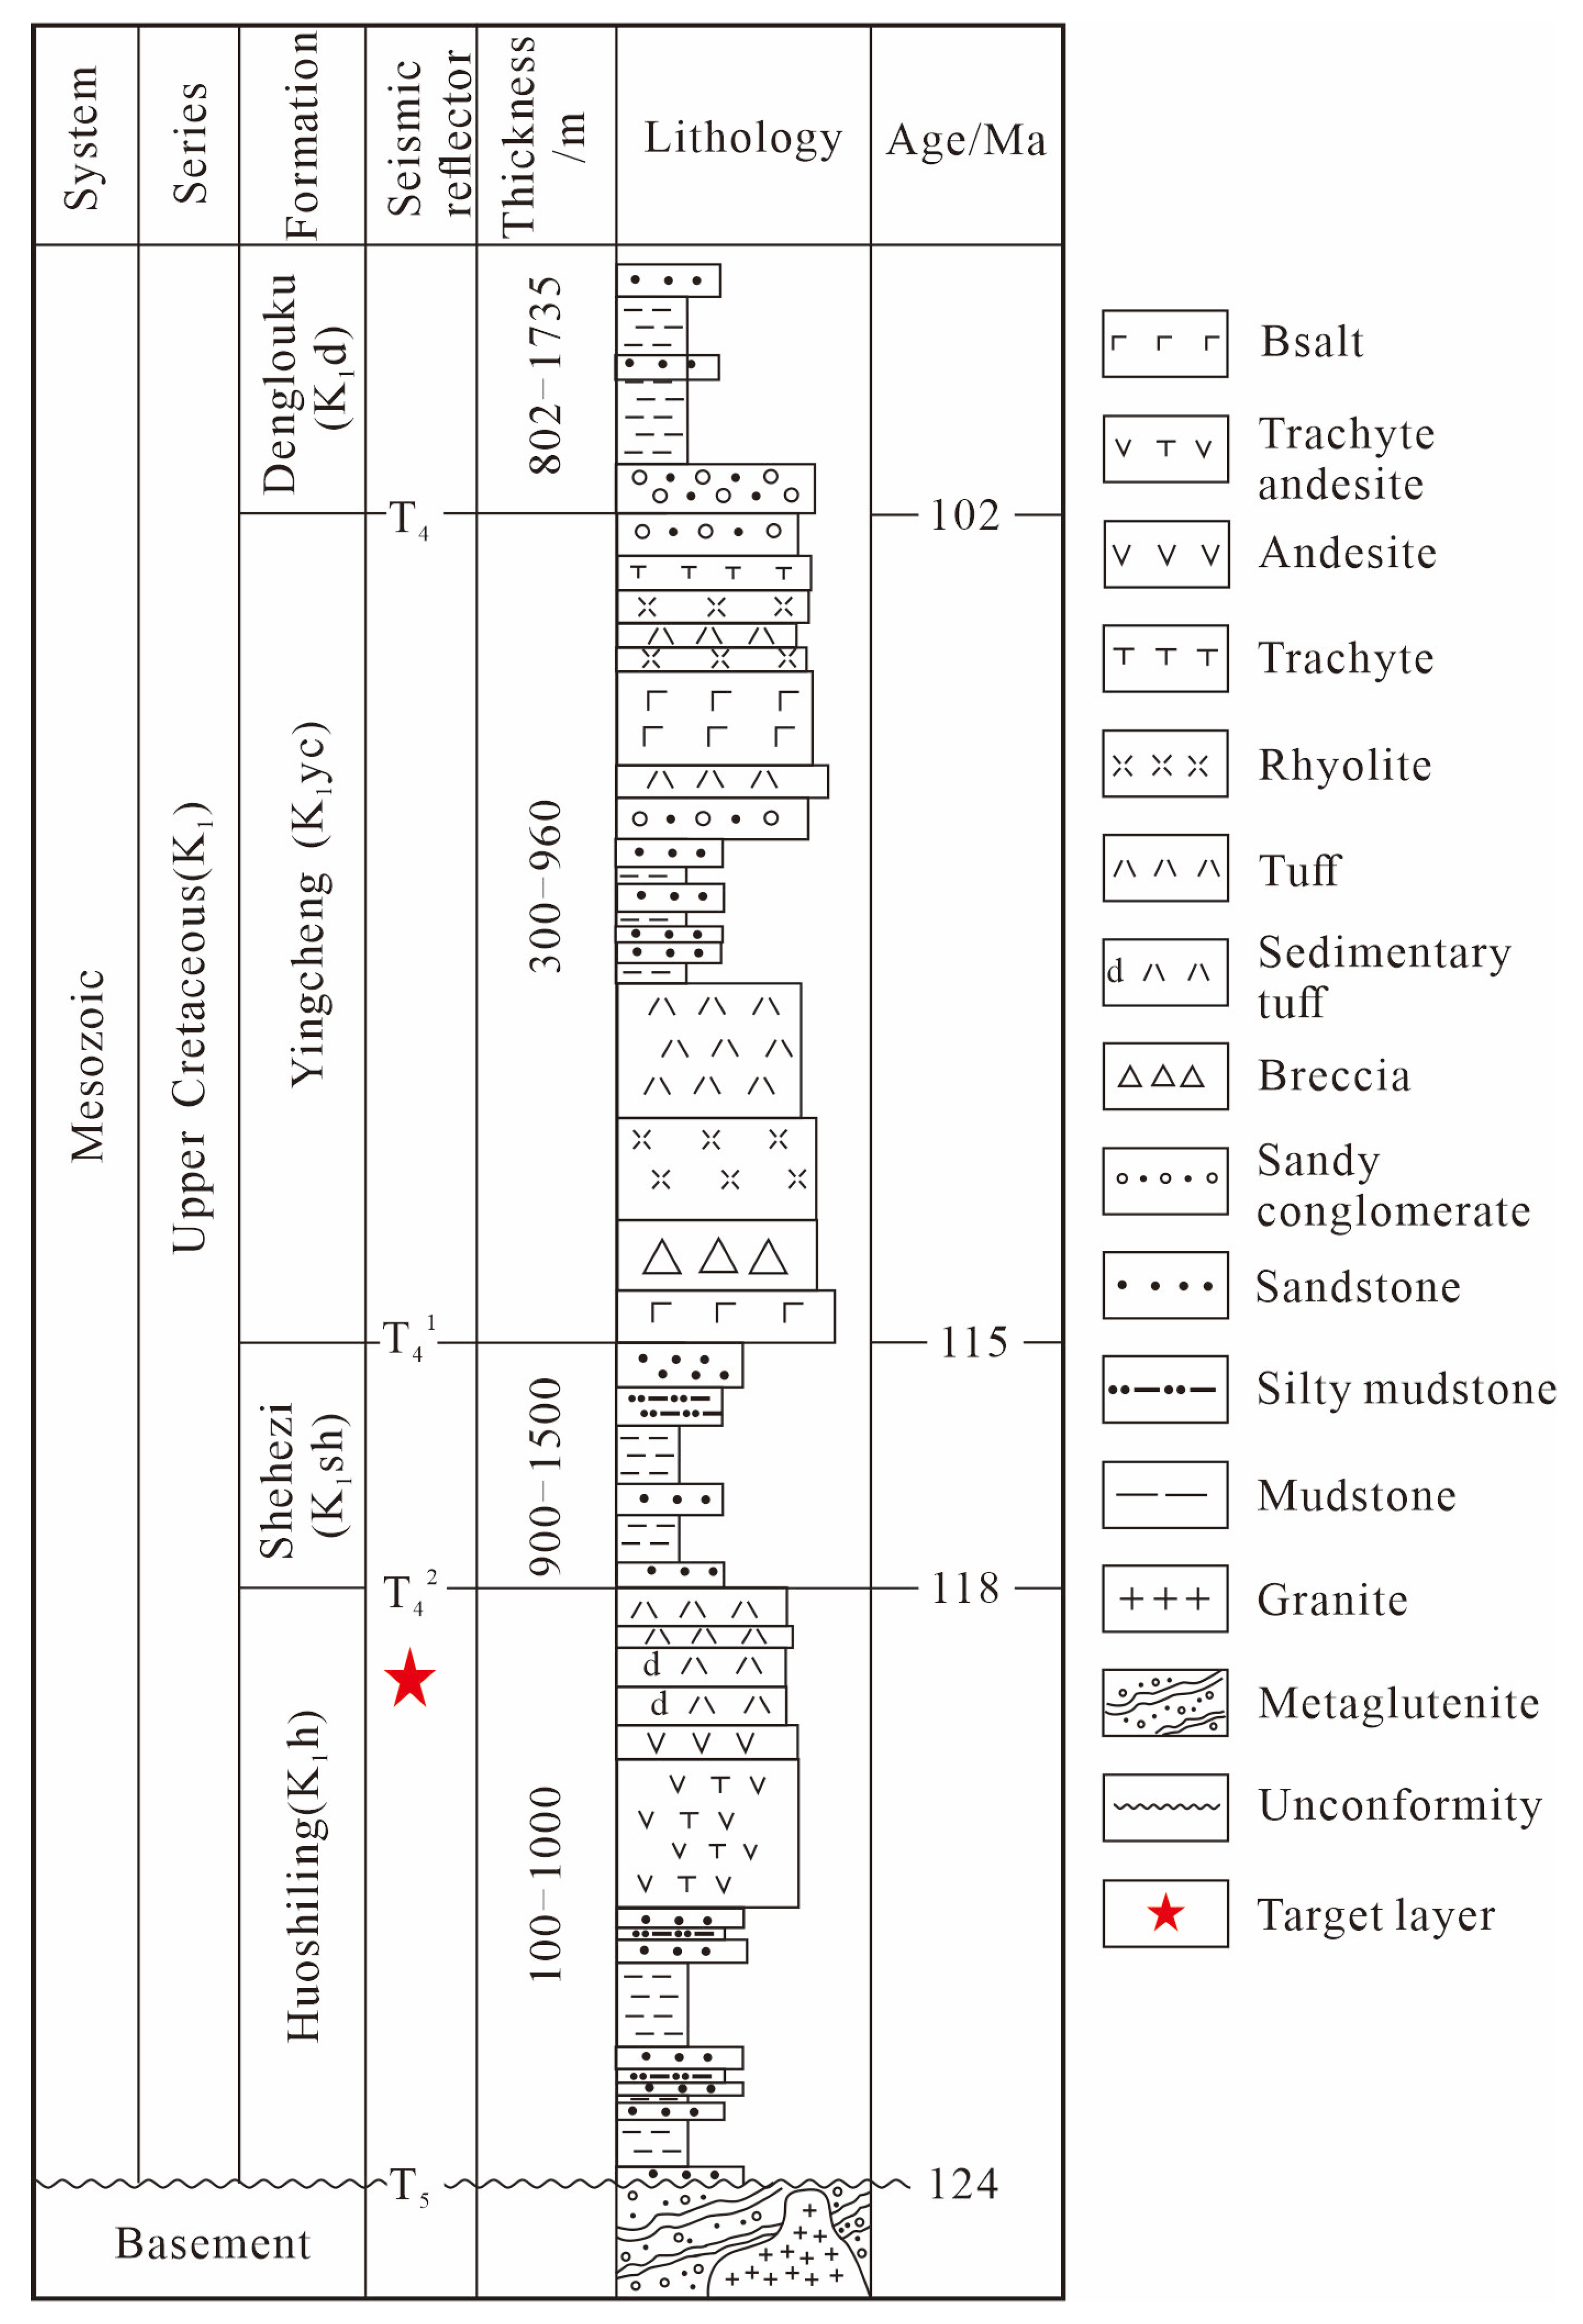
2. Geological Setting

The Songliao Basin is located in northeastern China and is developed on top of the Garridon-Haixi phase fold belt between the southern margin of the Siberian plate and the northern margin of the North China plate [41] and is a hydrocarbon-bearing basin with a double-layered structure of a Middle to Late Jurassic–Early Cretaceous fault and an Early Cretaceous depression [42]. During the Late Jurassic–Early Cretaceous, the Palaeo–Pacific plate subducted towards the NE land mass, producing NW–SE-oriented tensioning and forming numerous fault traps, which extended mostly in the NNE and NW directions [43]. The Changling fault depression is located in the southwestern part of the central depression zone of the Songliao Basin, with a distribution area of approximately 7240 km2, which is the largest depression in the southern part of the Songliao Basin [43,44]. The Changling Depression can be divided into three secondary tectonic units: the Central Depression Zone, the Western Steep Slope Zone, and the Eastern Gently Sloping Zone [45] (Figure 1a,b). The Lower Cretaceous Huoshiling Formation (K1h), Shahezi Formation (K1sh), and Yingcheng Formation (K1yc) were mainly developed during the faulting period of the Changling fault depression, which is characterized by sedimentary filling, simultaneous superposition of multiple eruptions of volcanic rocks, and late modification [46] (Figure 2).
The study area is the Chaganhua subsag, which is located in the eastern gentle slope zone of the Changling fault depression, with a near north-south strike, and the Huoshiling Formation, Shahezi Formation, and Yingcheng Formation in the area basically distributed along its western depression-controlling fracture [48]. The Chaganhua subsag has undergone a transformation from fault to depression, with the Huoshiling stage being the initial tensional faulting stage and the basement fractures being more developed (Figure 1d). The deposition process was accompanied by strong activity of controlling trap faults, which formed massive volcanic rocks; at the end of the deposition of the Huoshiling Formation, the study area was extensively uplifted and denuded, forming regional unconformities [49]. Intense tectonic movement and multiple phases of volcanic eruptions during the Huoshiling period resulted in frequent alternations of volcanic and sedimentary activity in the study area [41]. The Chaganhua subsag has a complex volcanic eruption environment, with the submerged eruption zone located in a depression zone (Figure 1c). The Chaganhua subsag is one of the hydrocarbon source areas of the Changling fault depression, where the volcanic rocks and hydrocarbon source rocks are directly aligned, which is conducive to hydrocarbon formation [50]. In recent years, a major breakthrough has been made in the exploration of deep gas in the Chaganhua subsag of the Changling fault depression, with exploratory wells C2, C2-1, C3, and C301 obtaining high-yielding industrial gas flows in the volcanic rocks of the Huoshiling Formation, thus revealing the rich resource type and considerable exploration potential of the rifting strata.

3. Samples and Experimental Methods

3.1. Samples

To study the petrology and physical characteristics of underwater eruptive pyroclastic reservoirs, 86 core plunger samples were collected from seven wells in the Huoshiling Formation of the Chaganhua subsag for porosity and permeability testing, and another 76 samples were selected for X-ray diffraction analysis of mineral composition.
In this study, the surface ratios of 65 casting thin sections and 24 SEM samples were calculated by the percentage of the pore area to the total area of the field of observation; then, pore types were distinguished; and finally, the main pore size distributions of different types of pores were calculated. Eight core samples were selected for high-pressure mercury injection, and nitrogen adsorption to analyze the pore structure of the pyroclastic reservoir in the study area.

3.2. Experimental Methods

3.2.1. Mercury Intrusion Porosimetry (MIP)

Corelab CMS300 and AutoPore IV 9500 mercury injection instruments were used. The samples were dried to constant weight at 105 °C before the test. The mercury injection experiment included mercury injection under pressure and mercury removal under pressure. The maximum experimental pressure was 200 MPa. The test was conducted according to the national standards of China: GB/T 29172-2012 [51] and GB/T 29171-2012 [52]. A high pressure mercury injection test was used to obtain the pore size distribution and structural parameters of the sample, and the pore structure parameters were calculated according to Washburn formula, i.e., p c = 2 σ c o s θ r , where the interfacial tension σ and wetting angle θ were set to 0.48 J/m2 and 140° [53].

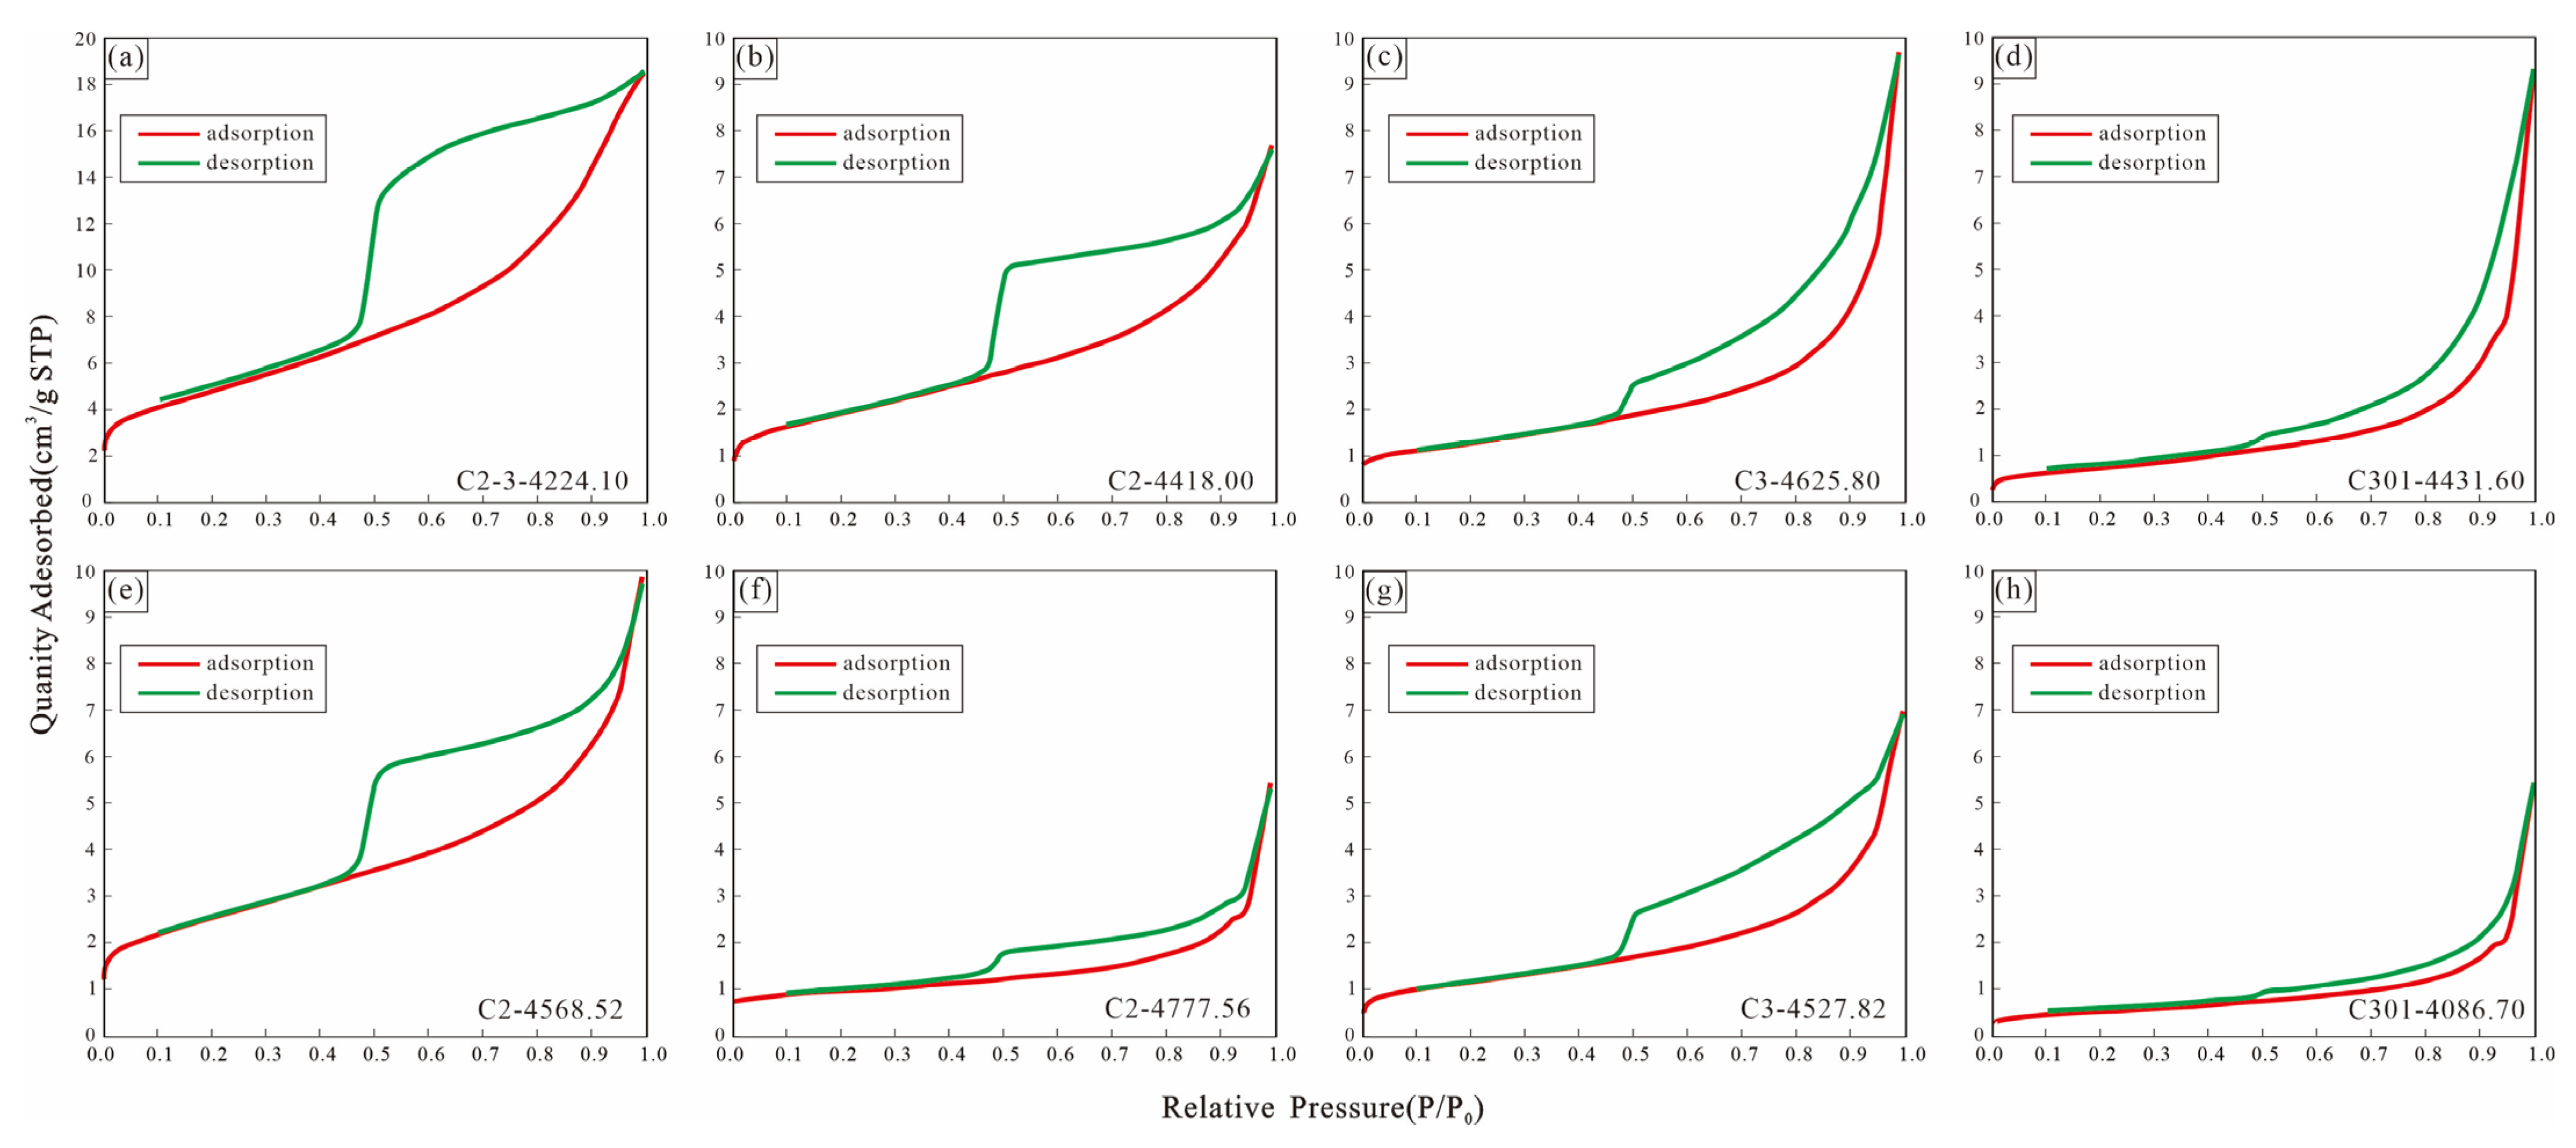
3.2.2. Low-Temperature Nitrogen Adsorption (LTNA)

In accordance with GB/T 19587-2017 [54] and GB/T 21650.3-2011 [55], the fully automatic gas adsorption instrument ASAP 2460 was used to test the specific surface area and pore size structure of the samples after heating at 90 °C for 1 h and 110 °C for 10 h. The test method was the isothermal physical adsorption static volume method. The minimum distinguishable nitrogen relative pressure (P/P0, where P0 is nitrogen saturated vapor pressure at a liquid nitrogen temperature of 77.35 K), was 2.60 × 10⁻⁷, and the measurable specific surface area is no less than 0.5 × 10⁻³ m3/g. The pore size of nitrogen adsorption can be measured in the range of (3.5~5000) × 10−4 nm. Only the adsorption and desorption curves of low-temperature nitrogen adsorption data were measured, while other parameters were calculated by the model. The specific surface area was calculated using the BET (Brunauer, Emmett Teller) multimolecular layer adsorption formula [56]. The isothermal adsorption data with relative pressure (P/P0) between 0.05 and 0.35 were analyzed to obtain the nitrogen monomolecular layer saturation adsorption capacity, and then the specific surface area was calculated.

3.2.3. X-ray Diffraction (XRD)

X-ray diffraction (XRD) is an important technique to analyze the mineral components of rocks; the X-ray diffraction device was an Ultima IV X-ray diffractometer. According to SY/T 5163-2018 [57], the total rock and clay mineral percentages of the rock samples were calculated [58]. The study of the mineral composition, content, and combined characteristics of pyroclastic rocks can provide a basis for the genetic research, quantitative characterization, and evolution of the microcosmic reservoir space of pyroclastic rocks.

3.2.4. Analysis and Calculation of Surface Porosity

Using ImajeJ software, 65 cast thin section photographs and 24 SEM photographs with different lithology were selected for surface porosity analysis. First, the volcanic rock fractures in the photographs were calibrated to determine the types, lengths, widths, and fillings of the fractures. The fracture surface density and linear density values were obtained through software calculation. Then, the fractures were filled according to the grey level to obtain the fracture face rate value, and the pores were directly filled with colorgrey. The number of particles, cumulative frequency curve, frequency curve, normal cumulative curve, and surface porosity were obtained.

4. Lithological Characteristics

The pyroclastic rocks of the Chaganhua subsag are of shallow water magmatic ejecta origin, with strong explosions resulting in fine-grained volcanic clasts in the study area, lacking volcanic breccias and volcanic agglomerates, and developing three types of rocks: tuffs, sedimentary tuffs, and tuffaceous sandstones (The identification of subaqueous pyroclastic rocks is described in another article). Table 1 shows that the volcanic samples consist of larger quantities of quartz, feldspar, and clay minerals and small quantities of calcite, dolomite, pyrite, and siderite minerals. The XRD analysis shows that the clay minerals are mostly chlorite, illite, kaolinite, and mixed-layer illite/smectite (Table 2). The tuff volcanic debris contains approximately 60% quartz and feldspar crystals, with arc-shaped or chicken-bone shaped vitric fragments (Figure 3m), andesite debris, dacite debris, and flint debris (Figure 3n,p). A high degree of matrix devitrification has resulted in aggregates of cryptocrystalline felsic minerals (Figure 3i,k,l). The clay mineral content of the tuff averages 20.87% (Figure 4). The core of the sedimentary tuff is grey-black, and bedding developed due to its transport and sedimentation in water (Figure 3b). Well-rounded terrigenous clastic sedimentary material and pelitic strips (Figure 3o) are visible under the microscope. The sedimentary tuff has a much higher average clay mineral content of over 32% (Figure 4), with terrigenous clay minerals present, in addition to those produced by tuff alteration (Figure 3o). The tuffaceous sandstone was formed during the interval between subaqueous volcanic eruptions and is often interbedded with sedimentary tuff (Figure 3b). The tuffaceous sandstone contains less than 50% volcaniclastic material (Figure 4), and the volcaniclastic composition is dominated by fragments, with less detritus and volcanic ash. The clastic particles are well rounded (Figure 3h,p). The fractures in the rock are mainly low-angle tensile fractures (Figure 3a,b,d,g), with few shear fractures (Figure 3e) and high-angle fractures (Figure 3f). Multiple stages of fracture development are evidenced in the thin sections, and some fractures are filled with calcite and other minerals (Figure 3j–l).

5. Reservoir Characteristics

Based on the core descriptions and cast thin section observations, the study area hosts a dense reservoir of subaqueous pyroclastic rocks, with pores difficult to see in conventional cast thin sections; however, microporosity is observed via SEM, mainly a considerable number of micro- to nanoscale pores, and fractures have also developed, which can also form a high-quality reservoir in the study area. The type of pyroclastic reservoir space in the study area can be classified into primary pore space, secondary pore space, and fractures according to their genesis.

5.1. Reservoir Space Characteristics

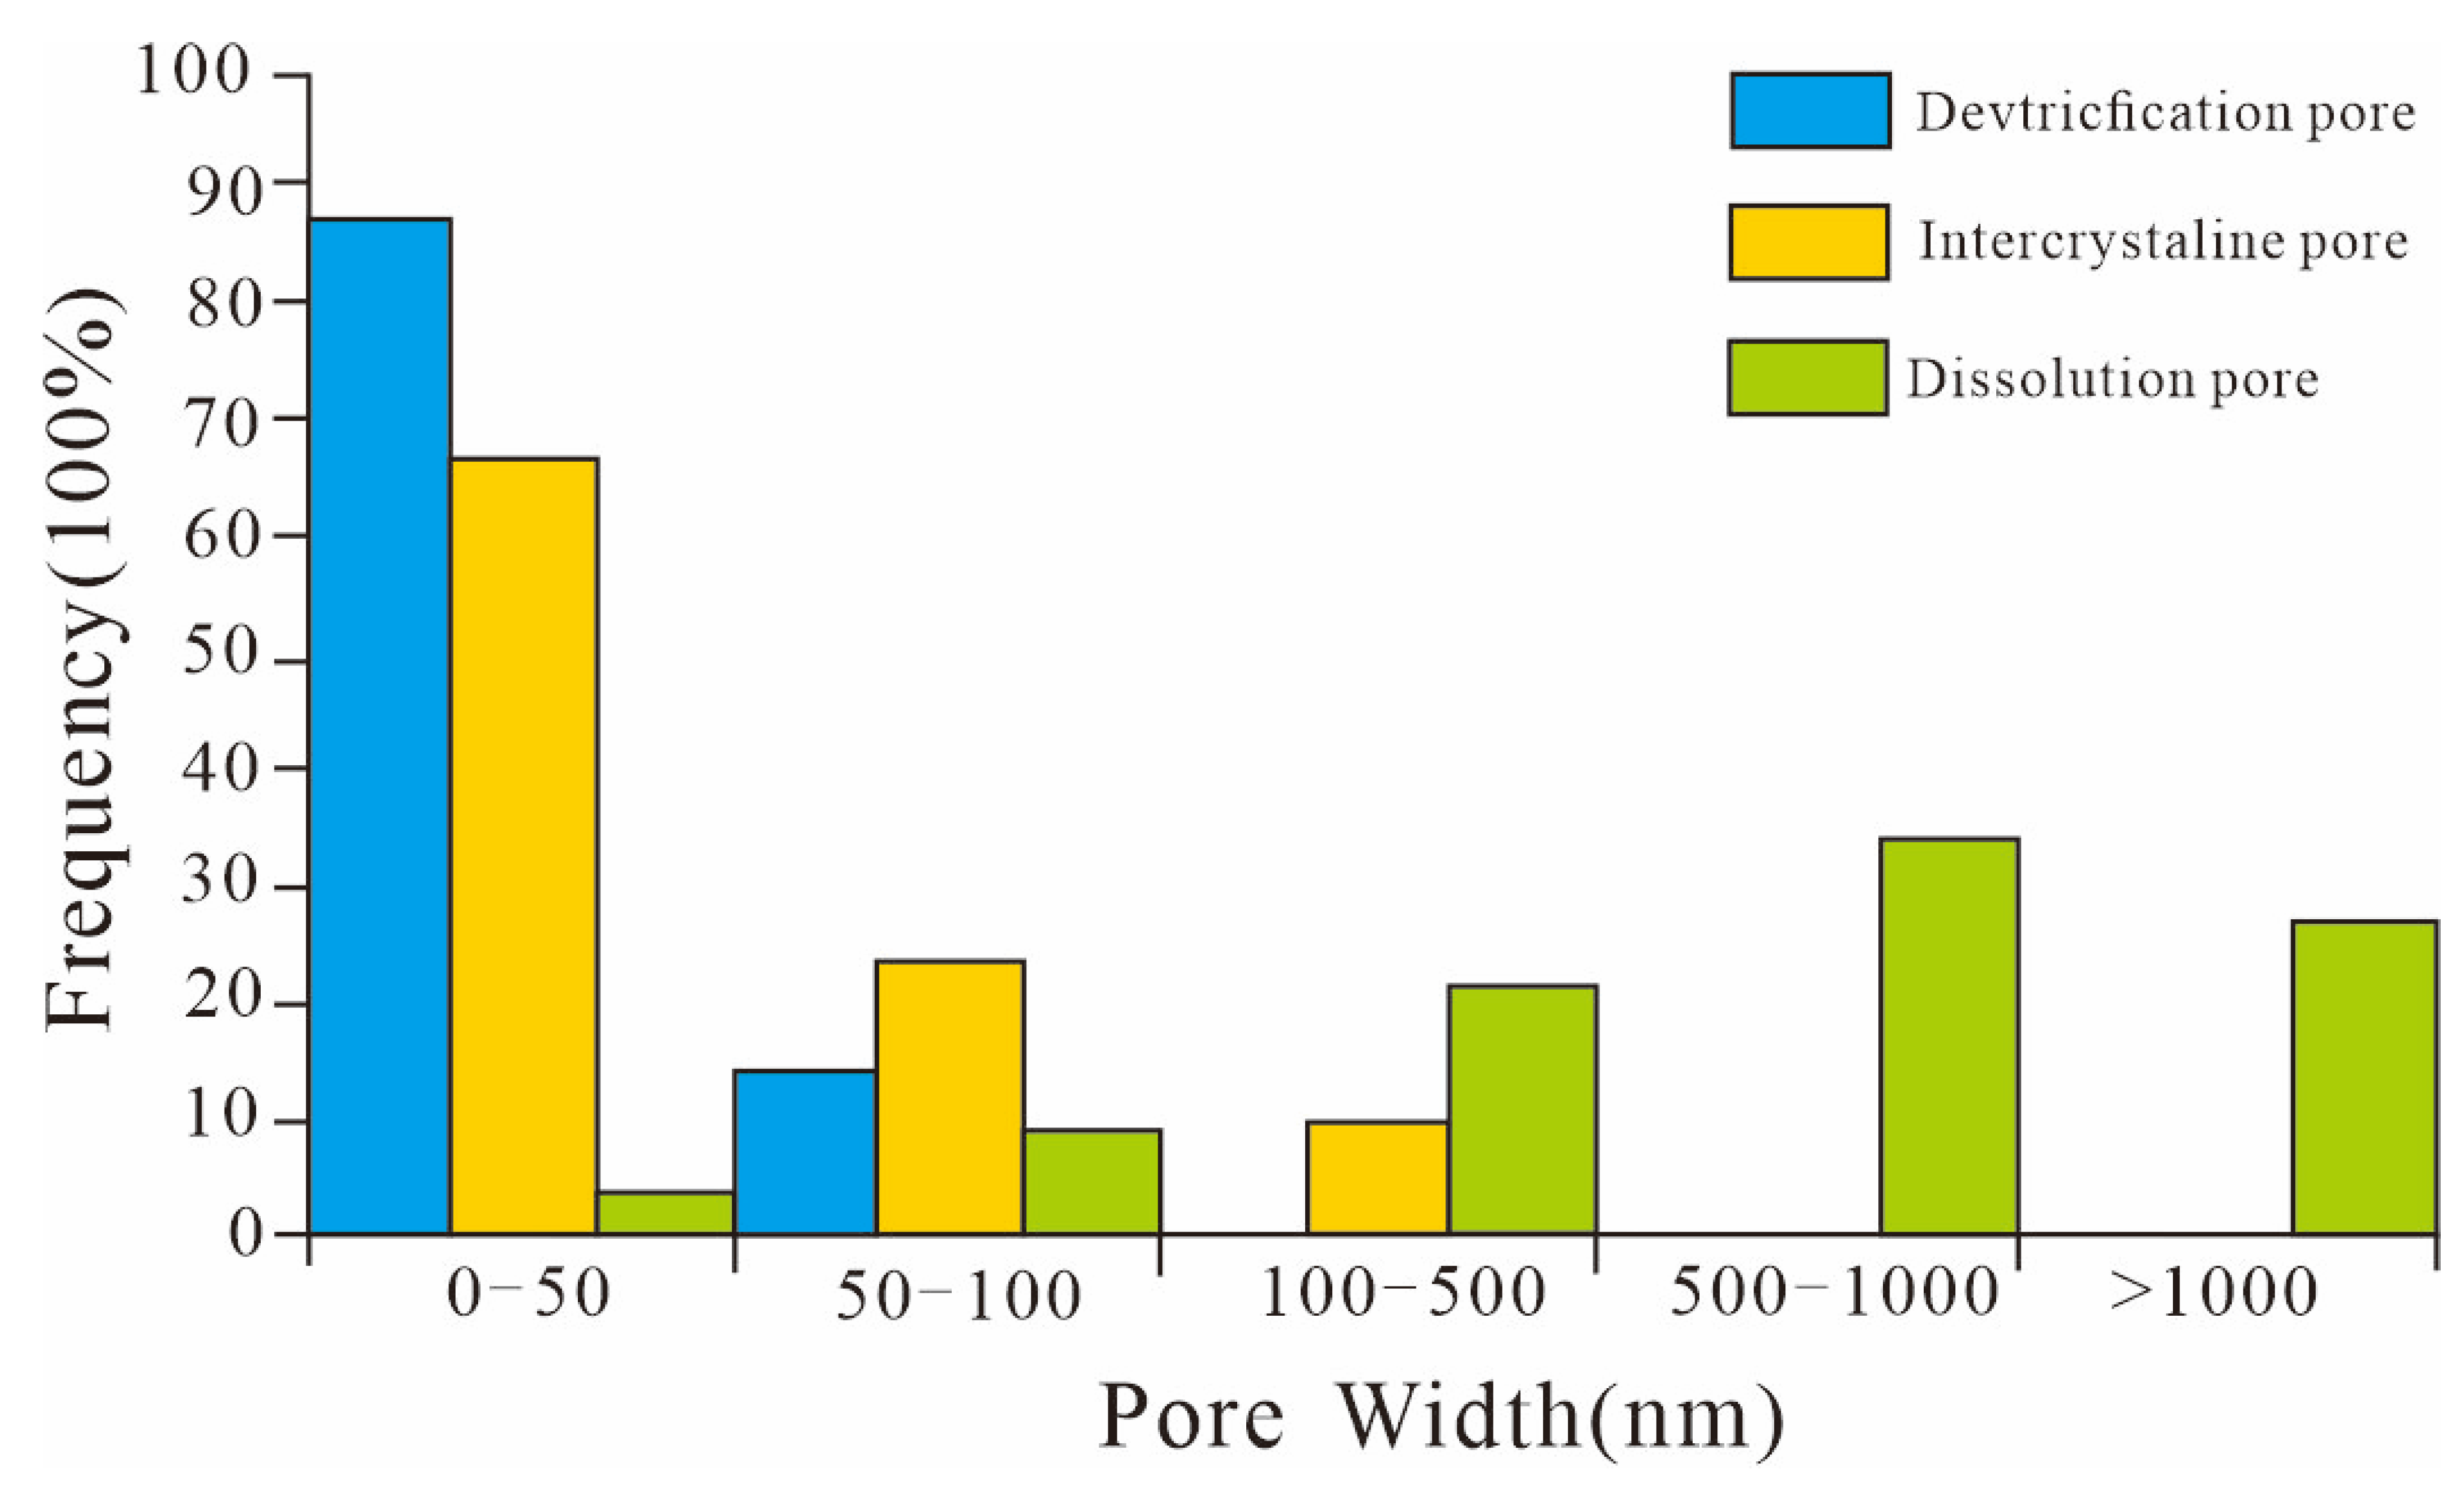
5.1.1. Primary Pores

Devitrification Pores

Tuff is formed by the consolidation and compaction of volcanic ash, and volcanic glass is an extremely unstable component formed during rapid cooling of magma [59]. During the burial process, strong devitrification occurs with changes in time, temperature, and pressure [60,61,62,63,64,65]. When there is an aqueous medium, after hydrolytic devitrification, some of the components are lost with the pore water, and the remaining components are recrystallized and transformed into crystals or microcrystals. The formation process of devitrification includes a series of geochemical effects, such as dissolution–precipitation of volcanic glass, recrystallization, and migration and transformation of metal ions [66,67], and the volume of the newly formed minerals are smaller, thus forming a large number of micropores between different minerals [68,69,70,71]. Devitrification pores can account for approximately 70% of all types of pores in tuffs [68]. The intergranular pores formed by devitrification of pyroclastic rocks in the study area are mainly located between quartz and feldspar grains and are clearly visible under SEM (Figure 5i). The devitrification pores developed in continuous slices in the cast thin section in Figure 5e have a star shape.

5.1.2. Secondary Pores

Dissolved Pores

The pyroclastic rocks of the Huoshiling Formation in the Chaganhua subsag and the source rocks of the Yingcheng Formation interlock laterally [50]. The organic acids produced in the burial process and the unstable minerals produced by deep hydrothermal circulation are the main reasons for the formation of dissolution pores in the study area. Matrix dissolution pores are mainly developed in the matrix of the volcanic ash, and micropores are formed by the dissolution of fine crystalline chips and detritus in the volcanic ash. The dissolution pores developed in the pyroclastic rocks of the Huoshiling Formation in the Chaganhua subsag are mainly feldspar dissolution pores (Figure 5h,k). Minerals such as aluminosilicate formed by devitrification of volcanic glass dissolved in the presence of acidic fluid, thus producing dissolution pores; for devitrification pores or altered pores, further dissolution produces dissolution pores (Figure 5d,e). Therefore, the pores observed in the study area are mostly the combination of devitrification pores and dissolution pores.

Intercrystalline Micropores
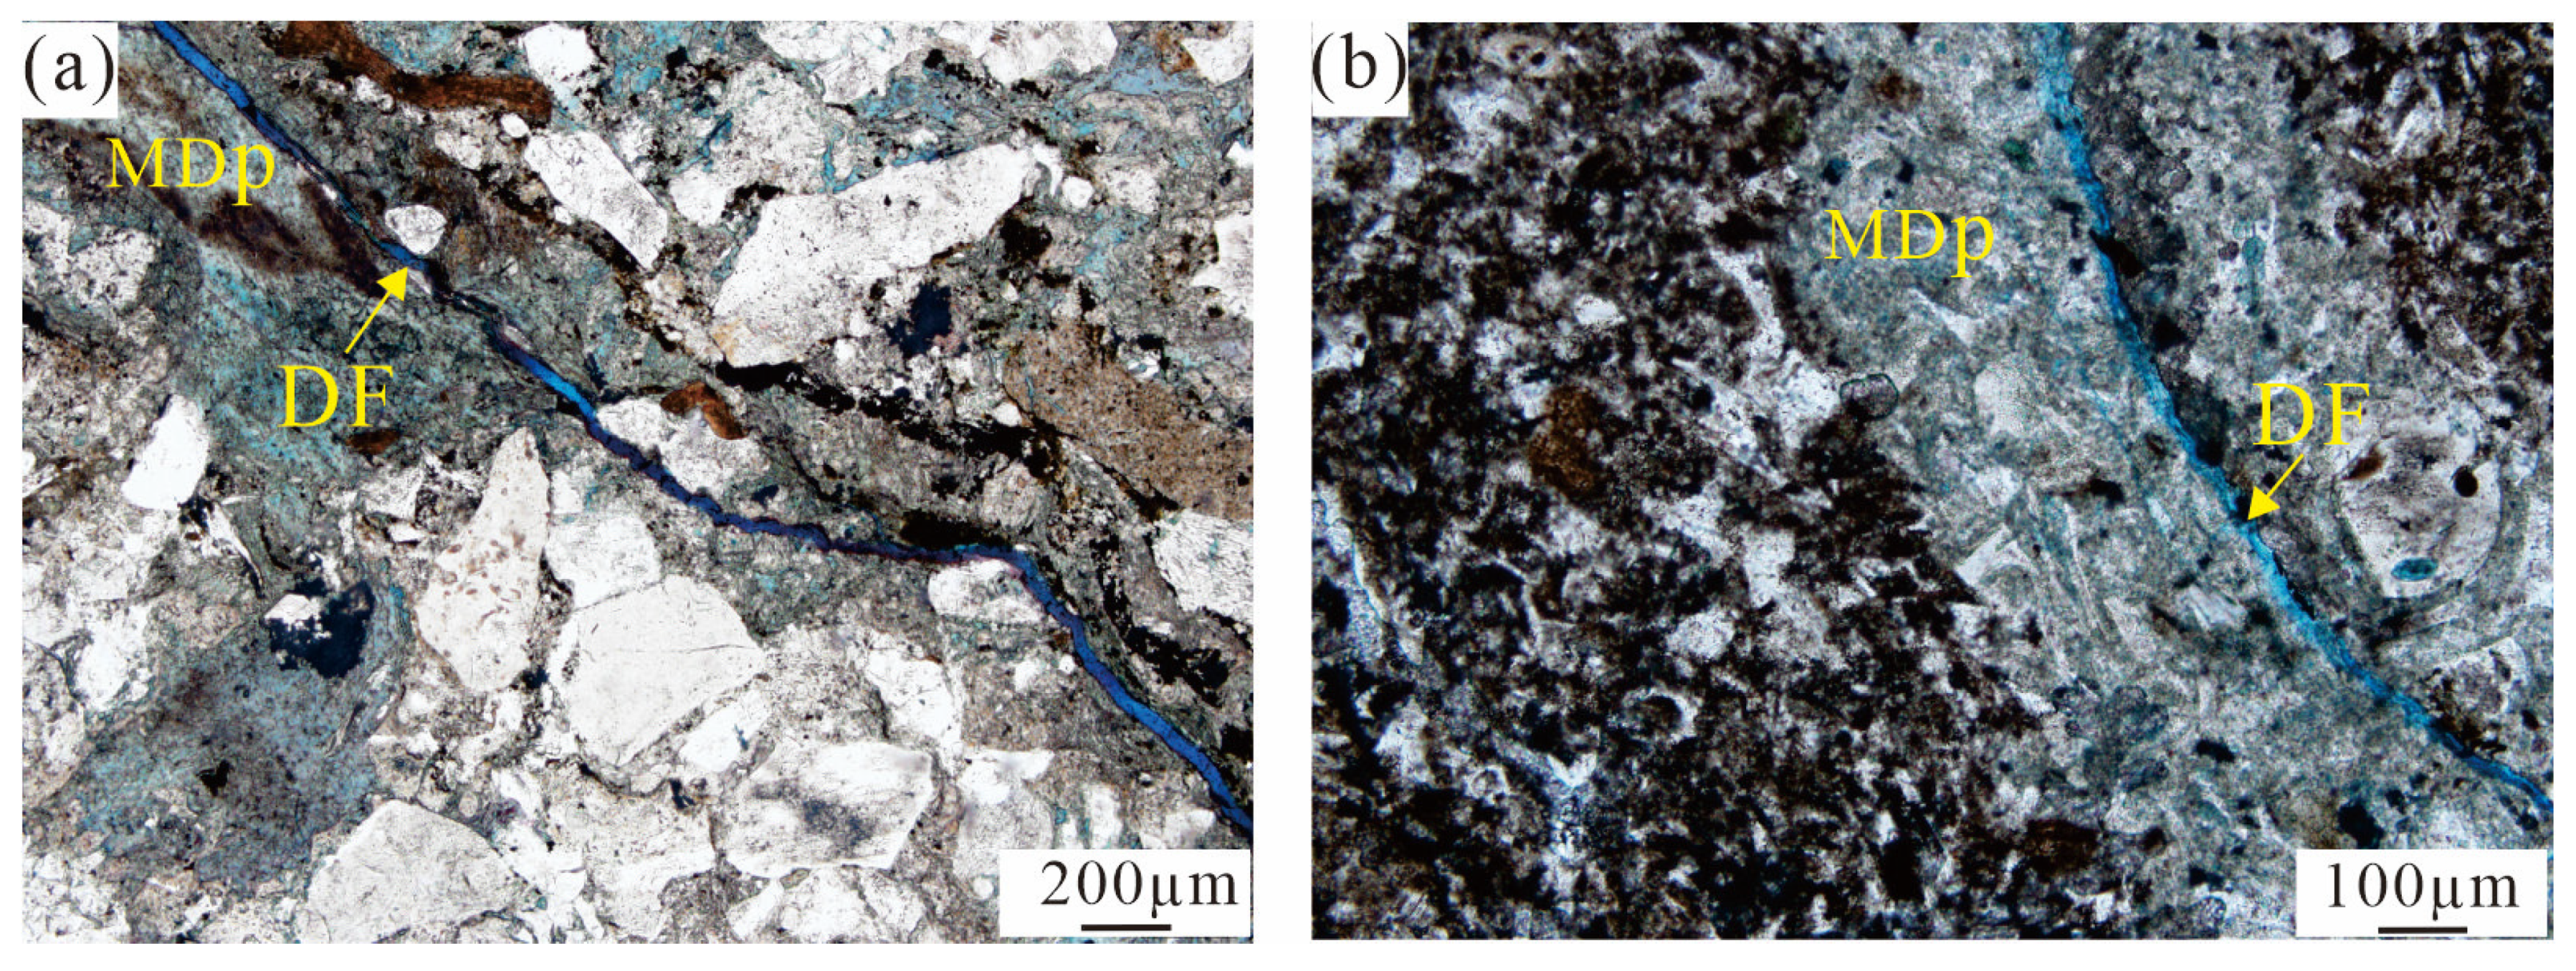
Intergranular pores are mainly developed between clay minerals and to a lesser extent between authigenic pyrite crystals. The pore size of these pores is very small, mostly at the microporous scale. The clay minerals of pyroclastic rocks in the study area are mainly chlorite. Chlorite is blade-like, with micropores between blades, ranging in length from 10s of nanometers to several micrometers (Figure 5j,k). The sedimentary tuffs have the highest clay mineral content, and the clay minerals have developed intergranular pores. The development of strawberry pyrite in the pyroclastic rocks of the study area indicates that it formed in a reducing environment [72,73,74,75]. Strawberry pyrite includes many pyrite crystals, and there are also many micropores between these crystals, which are generally polygonal in shape and range from 20.00 to 2000.00 nm in diameter (Figure 5l), but the pyrite content is low and does not correspond to considerable reservoir space.

5.1.3. Fracture

Fractures can greatly enhance hydrocarbon production, even though some fractures are filled, and can influence the generation of induced joints [71,72,73,74,75,76,77,78,79,80]. There are many types of fractures in the study area, most of which are tectonic joints formed by tectonic stress after the diagenetic period (Figure 3c), and some are modified by dissolution to form dissolution fractures (Figure 5c). Dissolution holes are commonly developed along the fractures (Figure 5d). The fractures in the study area are generally between 5 and 40 μm in diameter, and the total porosity they provide is less than 1%, constituting a very small reservoir space, with little impact on porosity. However, microfractures connect isolated pores and are an important channel for hydrocarbon migration.
Due to the limitations in the number of microfractures and the pore size, they have not fundamentally changed the low permeability of the reservoir but have only improved the permeability of the pyroclastic rocks in the study area to a certain extent, so the reservoir is still characterized by pore type.
In this study, the surface porosity of 65 cast thin sections and 24 SEM samples were studied, and the main pore size distributions of different types of pores were calculated, as shown in Figure 6. Devitrification pores and intergranular pores could be observed by only SEM, and the diameters of most devitrification pores and intergranular pores are less than 50 nm. The pore size distribution range is very wide, and the sizes of the dissolution pores are mainly distributed between approximately 100 and 1000 nm, showing intragranular and matrix dissolution. The reservoir space of tuff mainly consists of dissolution pores, devitrification pores, and clay mineral pores. The reservoir space of sedimentary tuff is mainly composed of intergranular pores with clay minerals and a few dissolution pores. The reservoir space of tuffaceous sandstone mainly consists of dissolution pores and a few clay mineral pores.

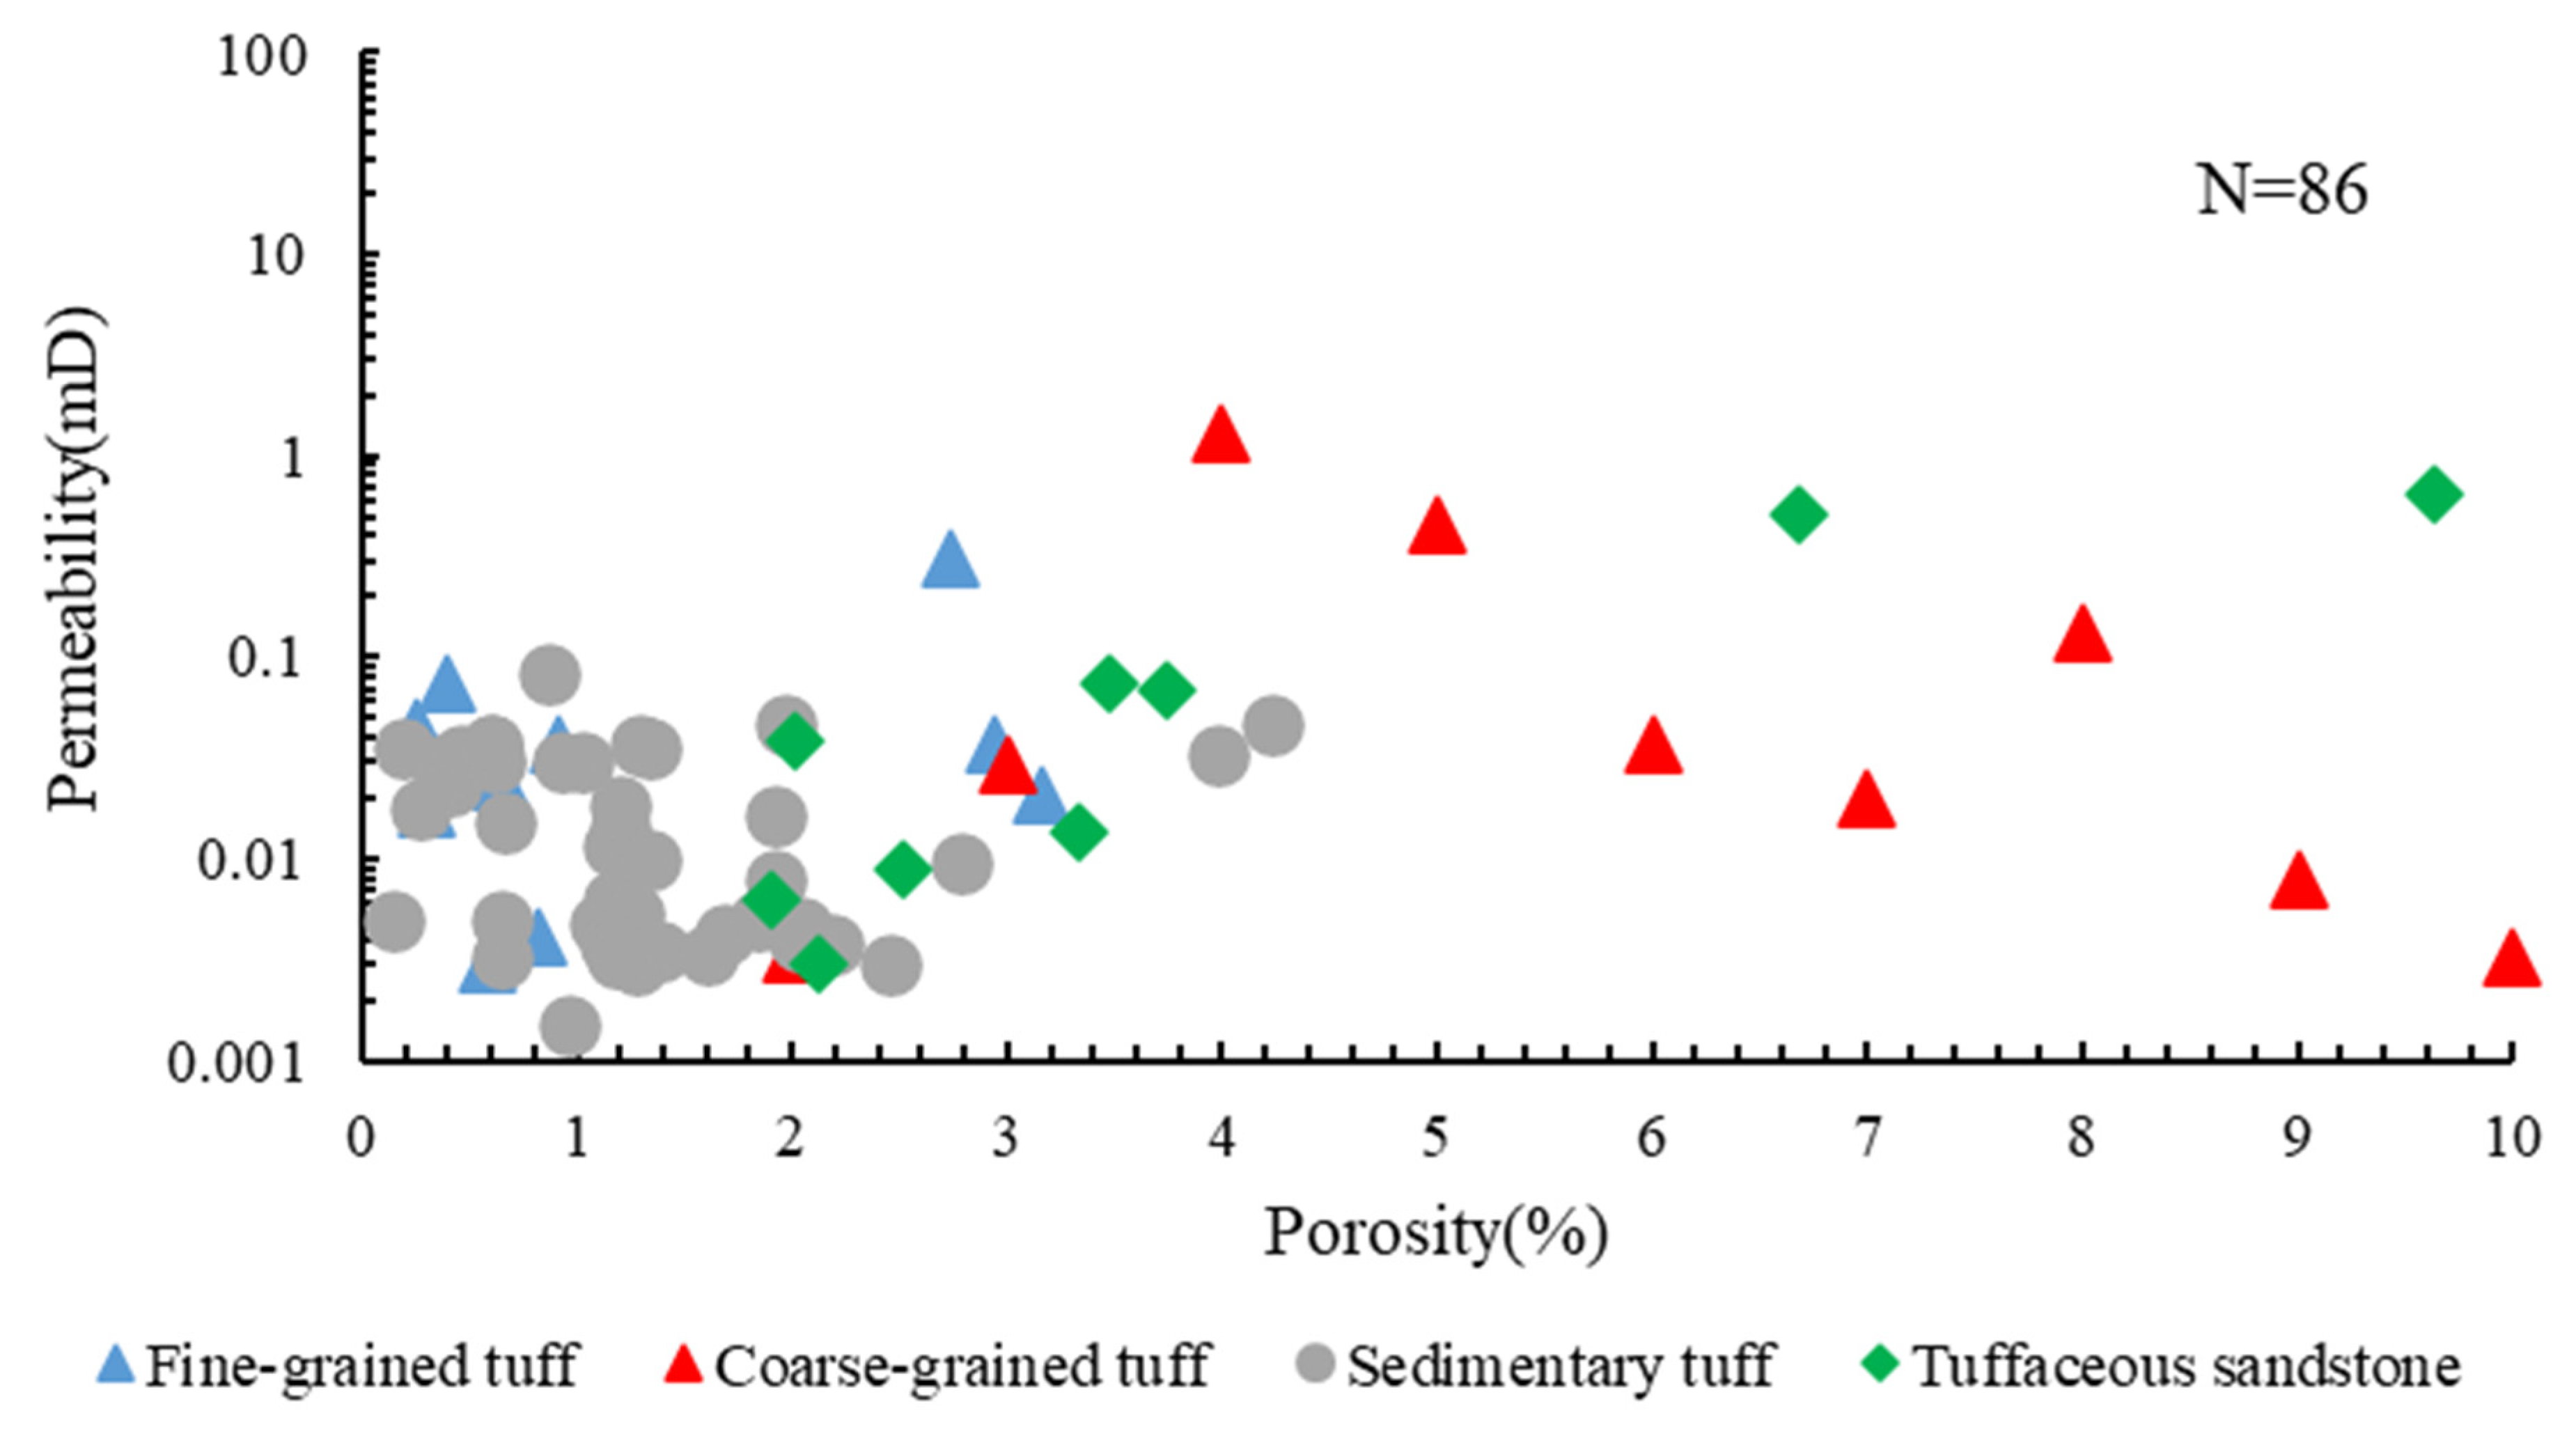
5.2. Reservoir Physical Properties

In this study, 86 rock samples were selected for porosity and permeability tests, and the analysis results showed that the porosity ranged from 0.15% to 6.71%, with an average value of 2.43%, and that the permeability distribution ranged from 0.0011 to 0.646 mD, with an average value of 0.076 mD (Figure 7). The physical properties of the reservoir are closely related to the lithology. Coarse-grained tuffs and tuffaceous sandstones generally have porosities greater than 2%, while the majority of sedimentary tuffs have porosities less than 2%, and there is little difference in permeability between reservoirs of various lithologies. The physical properties of volcanic reservoirs vary greatly with different lithologies, and the main types of reservoir space are also different. Moreover, the distribution range of physical properties of the same lithology is relatively wide, indicating that lithology is an important factor controlling reservoir distribution. In addition to the lithology, the reservoir physical properties are affected by other factors. According to the reservoir classification standard of SY/T 6285-2011 [81] “Oil and Gas Reservoir Evaluation Method”, the pyroclastic reservoir of the Huoshiling Formation is a low-porosity and low-permeability reservoir.

5.3. Reservoir Microscopic Pore Structure Characteristics

The reservoir spaces of the tuff reservoir samples (C2-3-4224.10, C2-4418.00, C3-4625.80) are mainly dissolution pores and devitrification pores. Graphically, the capillary pressure is curved and almost platform-free and sloping, indicating a complex pore structure and poor sorting in the core (Figure 8). The pore size distribution is concentrated in the range of approximately 100 nm to 20 μm, with a median pore throat radius of 0.013 μm, and the pores are predominantly coarse pores, with an overall micro- to nanoscale. The expulsion pressure is 8.259–13.772 MPa, the median mercury saturation pressure is 54.58–170.83 MPa, the maximum incoming mercury saturation is high, and the average mercury removal efficiency of the core is 29.57%, which is due to the complex pore structure of the reservoir and the significant differences in the distribution of pores and throats. The large amount of mercury retained in the pores is caused by the shielding effect of small pores. The hysteresis loop shapes mainly fall between the H2 type and H3 type (Figure 9a–c), indicating that both microspherical pores and some narrow pores or fractures exist in the nanoscale pore space of these samples. Tuffs with high volcanic glass content are prone to form nanoscale devitrification pores with a shape similar to spherical pores under devitrification action, and slit pores can be formed due to the dissolution of minerals and as intergranular pores of clay minerals. The pore volume of the coarse-grained tuff is large, but the number of pores is relatively small, since there are dissolution pores and intergranular pores with large pore sizes. The formation of clay minerals divides the large intergranular pores into multiple micropores, the pore size decreases abruptly in the part of the rock enriched with clay minerals, and an “ink bottle”-shaped pore combination can be formed.
Due to the high vitric fragment content of the coarse-grained tuff, the vitric fragments are unstable and prone to dissolution, which is manifested by a larger porosity contributed by dissolution pores than micropores, such as devitrification pores and intergranular pores of clay minerals. In contrast, the fine-grained tuff samples (C301-4431.60, C3-4625.80) have denser but relatively good homogeneity in the core, with a more concentrated distribution of pores, a small pore diameter, and a low porosity.
The capillary pressure curves of the sedimentary tuff samples (C2-4568.52, C2-4777.56) are steeply sloped, finely skewed, and poorly sorted. This indicates that the reservoir space is dominated by fine pore–very fine pore space, with a pore size distribution concentrated between 4 nm and 40 nm and an average connectivity (Figure 8). The pore type is mainly between type H3 and type H4 (Figure 9e,f), partly attributable to type H4. The content of clay minerals is high, up to 43.5% on average, and easily forms intergranular pores of clay minerals, which exhibit a slit type.
The tuffaceous sandstone (C3-4527.45, C301-4086.70) samples have high-pressure mercury injection curve characteristics similar to those of the sedimentary tuff, with fine skewness and poor sorting (Figure 8). The hysteresis loop characteristics of tuffaceous sandstones are similar to those of tuffs and are of the H3 type, with steeper adsorption curves, but the desorption curves are parallel to the adsorption curves, and the hysteresis loop area is relatively small, indicating the development of crack-like narrow pore structures (Figure 9g,h), such as those between chlorite crystal layers.

6. Discussion

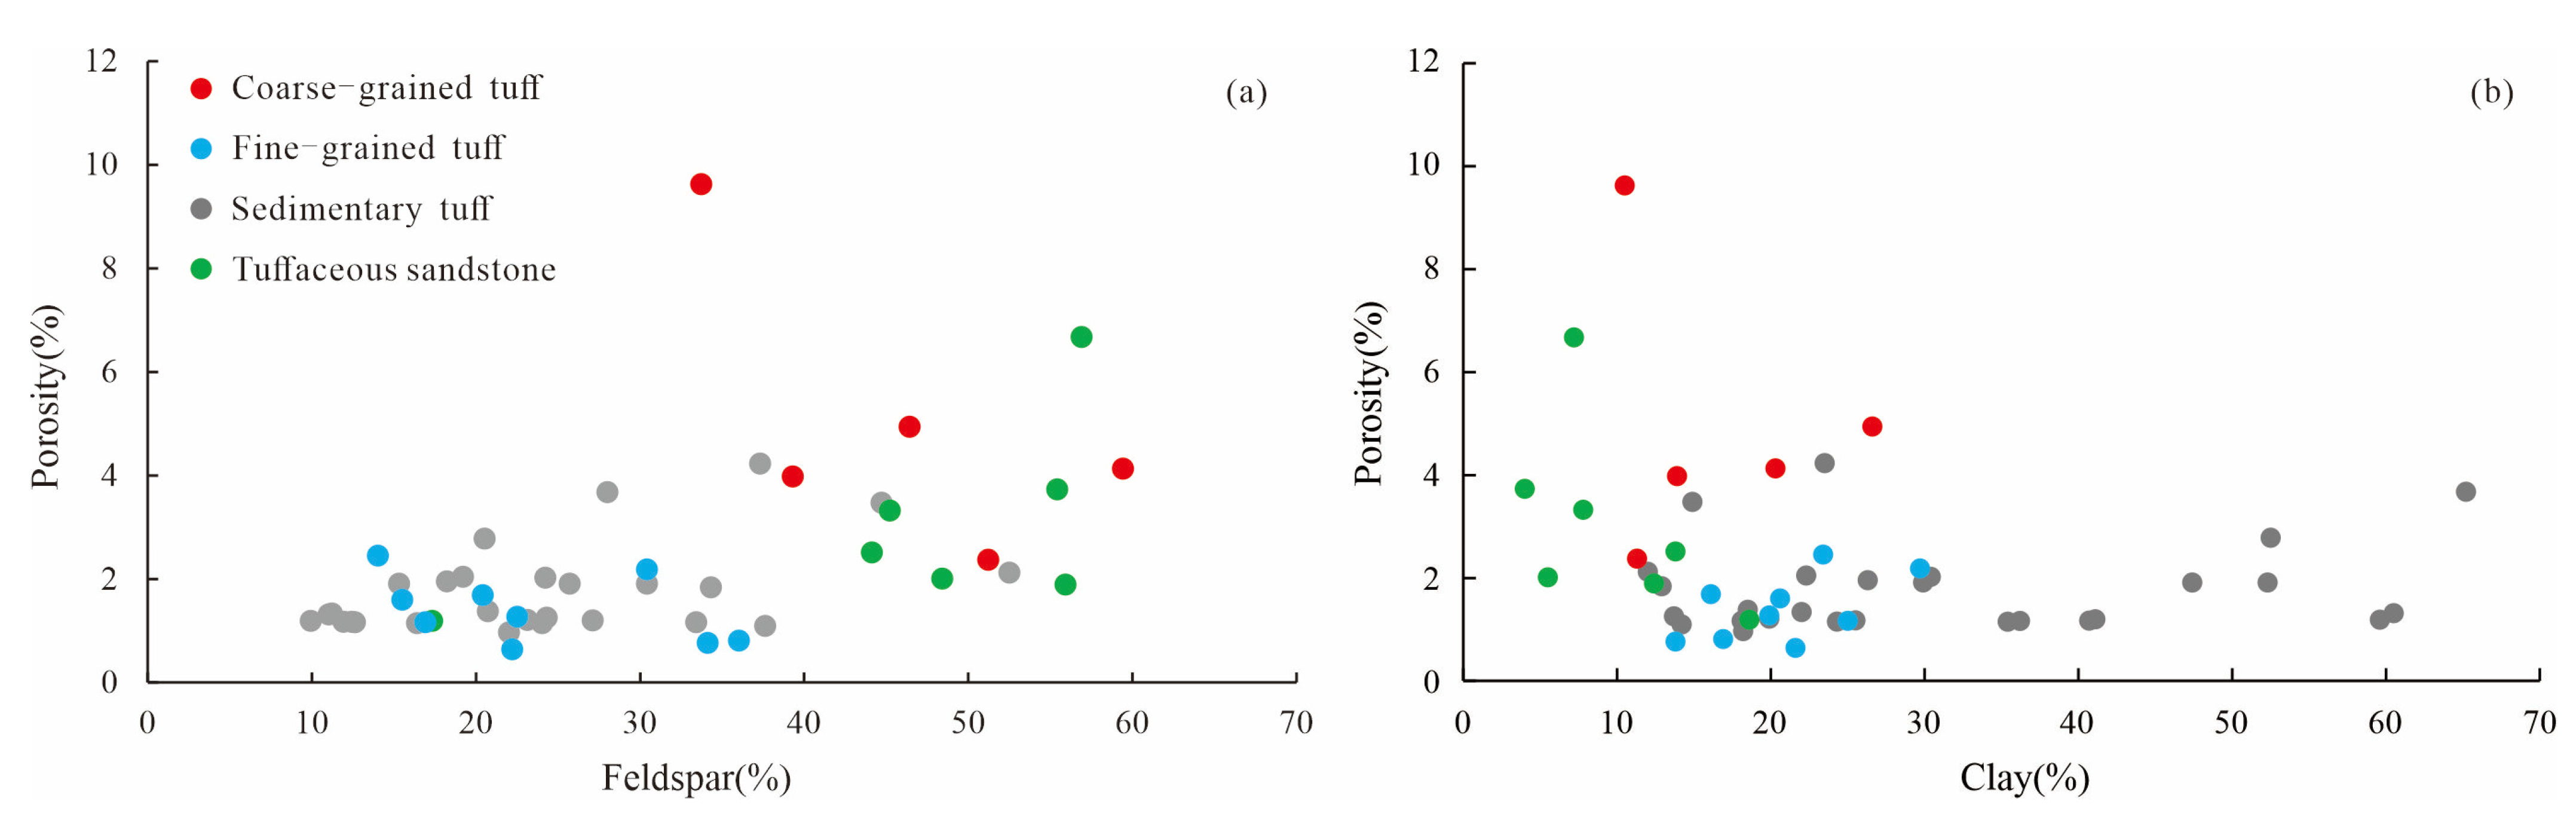
6.1. The Reason for Different Types of Reservoir Physical Property Differences

Through the analysis of the cast thin sections and SEM surface porosity, combined with the measurement of porosity and permeability, it was found that tuff is the most favorable type of reservoir, and the coarser the granularity of the pyroclastic particles, the more favorable the reservoir the physical properties, and the larger the pore size, and the higher the porosity (Figure 10). Tuffaceous sandstone is the next most favorable type of reservoir, and the physical properties of sedimentary tuff reservoirs are the least favorable (Figure 7). The mineral composition of volcanic rock is closely related to its porosity. In general, porosity is negatively correlated with clay mineral content and positively correlated with feldspar content (Figure 11).
The tuff has high surface porosity, and the pore type is dominated by devitrified and dissolved pores (Figure 10). Secondary dissolution pores easily form under the condition of dissolution by acidic formation water after devitrification of volcanic ash, and its recrystallization will also lead to the development of intergranular pores and improve the porosity of reservoirs [68,69,70,71]. The coarse-grained tuff has a higher feldspar content and lower clay mineral content than the fine-grained tuff (Figure 3), which provides a good material basis for dissolution, and the effective support of the coarse-grained tuff clastic particle framework is conducive to the formation of more effective pore space, so the coarse-grained tuff reservoir has more favorable physical properties. The sedimentary tuff has a low feldspar content and an average clay mineral content of 32.27% (Table 1). In addition to clay minerals produced by tuff alteration, there are also terrigenous clay minerals. The reservoir space is dominated by intergranular pores of clay minerals, and argillaceous components fill the pores, reducing the reservoir porosity and permeability, so the corresponding reservoir properties are the least favorable. The tuffaceous sandstone has high feldspar content and low clay mineral content and develops approximately 3% laumontite (Table 1), with secondary dissolution pores formed by dissolution of feldspar, rock debris, and laumontite. The reservoir properties are good, but the physical properties are not as good as those of tuff because the tuff content is low and devitrification pores are not developed.

6.2. Formation Mechanism of Different Types of Reservoirs

Subaqueous pyroclastic rocks have certain peculiarities due to their large number of unstable components, short transport distances, and rapid consolidation into rock, combined with regional tectonic movements and the influence of stratigraphic fluids, resulting in pyroclastic reservoirs that are different from normal volcanic rocks and normal sedimentary rocks [40]. The pyroclastic reservoirs have undergone formation, modification, destruction, and remodeling. The most important mechanisms affecting the formation of pyroclastic reservoirs in the Huoshiling Formation of the Chaganhua subsag are devitrification, dissolution, and tectonic movement.

6.2.1. Devitrification of Volcanic Ash

The pyroclastic rocks of the Huoshiling Formation in the study area are mainly composed of crystal fragments and vitric fragments. The composition of the crystal fragments is mainly quartz and albite, without pyroxene, olivine, and other dark minerals. The composition of vitric fragments is mainly felsic, and their thermodynamic properties are extremely unstable and prone to devitrification [66,67]. The process of devitrification involves a series of geochemical actions, including the recrystallization, dissolution, precipitation, migration, and transformation of metal ions. The vitric fragments undergo crystallization and shrink in volume, micropores will be formed in this series of processes, and then devitrification pores will be developed [68,69,70,71]. The pore size of the micropores formed by devitrification is small, but the number of micropores is large, resulting in a larger overall porosity. Thin crystal materials produced by devitrification can be observed under an optical microscope in the rock section of Well C3 in the study area (Figure 5e). Fine quartz crystals resulting from devitrification can be observed from SEM (Figure 5i).

6.2.2. Dissolution

The pyroclastic rocks of the Huoshiling Formation in the study area have high contents of feldspar and tuff, which provide a material basis for dissolution. The rocks are formed by underwater eruption and accumulation and are not leached by atmospheric fresh water in a reducing environment. The fluids causing dissolution in this area are mainly organic acids. The deep hydrothermal fluids mainly played a destructive role in the reservoir, and mineral filling caused by hydrothermal alteration can be seen. The results of carbon and oxygen isotope testing analysis of calcite cement in pyroclastic reservoirs in the study area are shown in Table 2. The δ13CPDB values of calcite carbon isotopes range from −13.2‰ to −1.8‰, with an average of −8.4‰. The δ18OPDB values ranged from −23.5‰ to −16.1‰, with an average value of −21.3‰ (Table 3). According to the characteristics of carbon and oxygen isotopes, the pyroclastic rock samples in the Chaganhua subsag all plot in area III (Figure 12), indicating that the diagenetic process was affected by the oxidation and decomposition of organic matter.
The calcite associated with decarboxylation of organic acids is characterized by coarse crystalline grains and metasomatism of other minerals [82], which is also consistent with the characteristics of the study area (Figure 3p). The volcanic rocks in the Huoshiling Formation of the Chaganhua subsag are adjacent to the hydrocarbon source rocks, and organic acids produced by the hydrocarbon source rocks enter volcanic rocks along unconformities and fractures. The burial depth of the Huoshiling Formation in the study area is generally between 3900 and 5000 m. X-ray diffraction results of clay minerals show that the I/S mixed layer minerals in the study area are mainly high-order illite, and the ratio of I/S interlayer is 10% (Table 2). In addition, the I/S interlayer and chlorite are visible under SEM. Therefore, the recrystallization and evolution of the clay minerals in the study area were relatively active, and the diagenesis stage had entered the deep burial stage. With the evolution of the clay minerals, they release pore water and interlayer water, and fatty acids form long-chain alkanes and then form petroleum hydrocarbons. In the process of hydrocarbon generation, organic acids and CO2 are produced in large quantities. The presence of large amounts of organic acids and CO2 makes the formation water acidic.
In this area, organic acid dissolution mainly occurs in the deep burial diagenetic stage, and the targets of organic acid dissolution are soluble components such as feldspar, debris and laumontite. Under SEM, the thin sections show that dissolution occurred in feldspar grains and along cleavage joints (Figure 6d). Because cementation occurs mainly in the middle and late diagenesis stages, the dissolution of carbonate cements is not obvious. The aluminosilicate minerals formed by the devitrification of volcanic glass can be dissolved in acidic fluids, and the organic acids can effectively complex the metal cations to adsorb them to the mineral surface and promote the dissolution rate of minerals. The reason for the formation of secondary pores by tuff dissolution is that organic acids can increase the activity of aluminum and combine with aluminum to form organic complexes that are carried away by the fluid, thus producing secondary pores. In the tuffaceous sandstone of wells C3 and C301 in the study area, the laumontite content is relatively high (Table 1). Due to the instability of volcanic materials, a large amount of K+, Na+, Ca2+, and Mg2+ plasma can be released after rapid decomposition under hydrolysis, which makes the solution highly alkaline and increases the salinity, which is conducive to the formation of laumontite minerals [83]. Strong alkalinity (pH > 9), high Ca2+ activity, sufficient, and highly active SiO2, and certain temperature and pressure conditions are conducive to the formation of laumontite [84,85]. Under acidic conditions, element migration easily occurs in laumontite, leading to dissolution and the formation of dissolution pores.
Figure 12. Plot of the δ13CPDB and δ13OPDB values of calcite in the Chaganhua subsag (after Guo et al., 1999) [86].
Energies 16 04968 g012

6.2.3. Tectonism

Tectonic movements provide the driving force for the formation and evolution of basins, lead to the formation and development of faults and tectonic fractures, and control the interaction between fluids and rocks, thus affecting the physical properties of reservoirs [83]. The period of deposition of the Huoshiling Formation corresponds to the rapid extension stage of fault depression [41]. The Changling fault depression features faults trending NNE, NNW, SN, and other directions, along which fracture zones are formed [41,43,44]. The pyroclastic reservoirs of the Huoshiling Formation in the Chaganhua subsag have undergone transformations and processes such as dissolution and structural failure over a long geological period, forming complex and heterogeneous reservoir spaces. The physical properties of pyroclastic reservoirs in the study area vary greatly, with porosity mainly between 1% and 7% and permeability between 0.0011 and 0.646 mD (Figure 7). The pores are mainly devitrification pores, and the connectivity of pores is the key factor restricting the physical properties of volcanic reservoirs in the study area.
The impact of fractures on the reservoir was analyzed with the imaging logging data of five pyroclastic core wells in the study area, which showed that the greater the density of fractures in pyroclastic rocks of the same lithology, the more favorable the physical properties of the reservoir(Figure 13a). This shows that fractures contribute greatly to the physical properties of reservoirs. In the case of Well C301, fracture density correlates well with porosity and permeability, as shown in Figure 13a, and the fracture density of the three stages with porosity and permeability development is also higher. The imaging log sine curve shows fracture development (Figure 13a), and fractures are also visible in the corresponding cores (Figure 13b–d). In addition, the thin sections show that most of the dissolution pores are not isolated but connected by fractures (Figure 14), which contribute to the formation of effective reservoir space and enhance the reservoir physical properties.
Well C301 is located near a deep and large fault and has developed structural fractures (Figure 13g) with well-developed tectonic fractures (Figure 13e) and generally has more favorable reservoir properties than wells C2-1 and C2-3. There are almost no primary pores in the subaqueous pyroclastic rocks, whose porosity is mainly controlled by late dissolution. Faults connect reservoirs and source rocks, affecting oil and gas migration and formation fluid migration [87,88,89]. In the vicinity of tectonic fractures, the more favorable fluidity of formation fluids provides migration channels for erosive fluids (organic acids and deep hydrothermal fluids) and other fluids to interact with rocks, resulting in more dissolution of unstable components in pyroclastic rocks and leading to the development of secondary pores and dissolution fractures, the distribution of dissolution pores along the fractures (Figure 5d and Figure 14), and improving the reservoir performance. Therefore, the influence of fractures on rock porosity is indirectly controlled, and the formation of highly porous rocks is related to the source and migration path configuration of erosive fluids such as unconformities, source rocks, and deep and large faults. These results suggest that the degree of fracture development determines the physical properties of the reservoir.

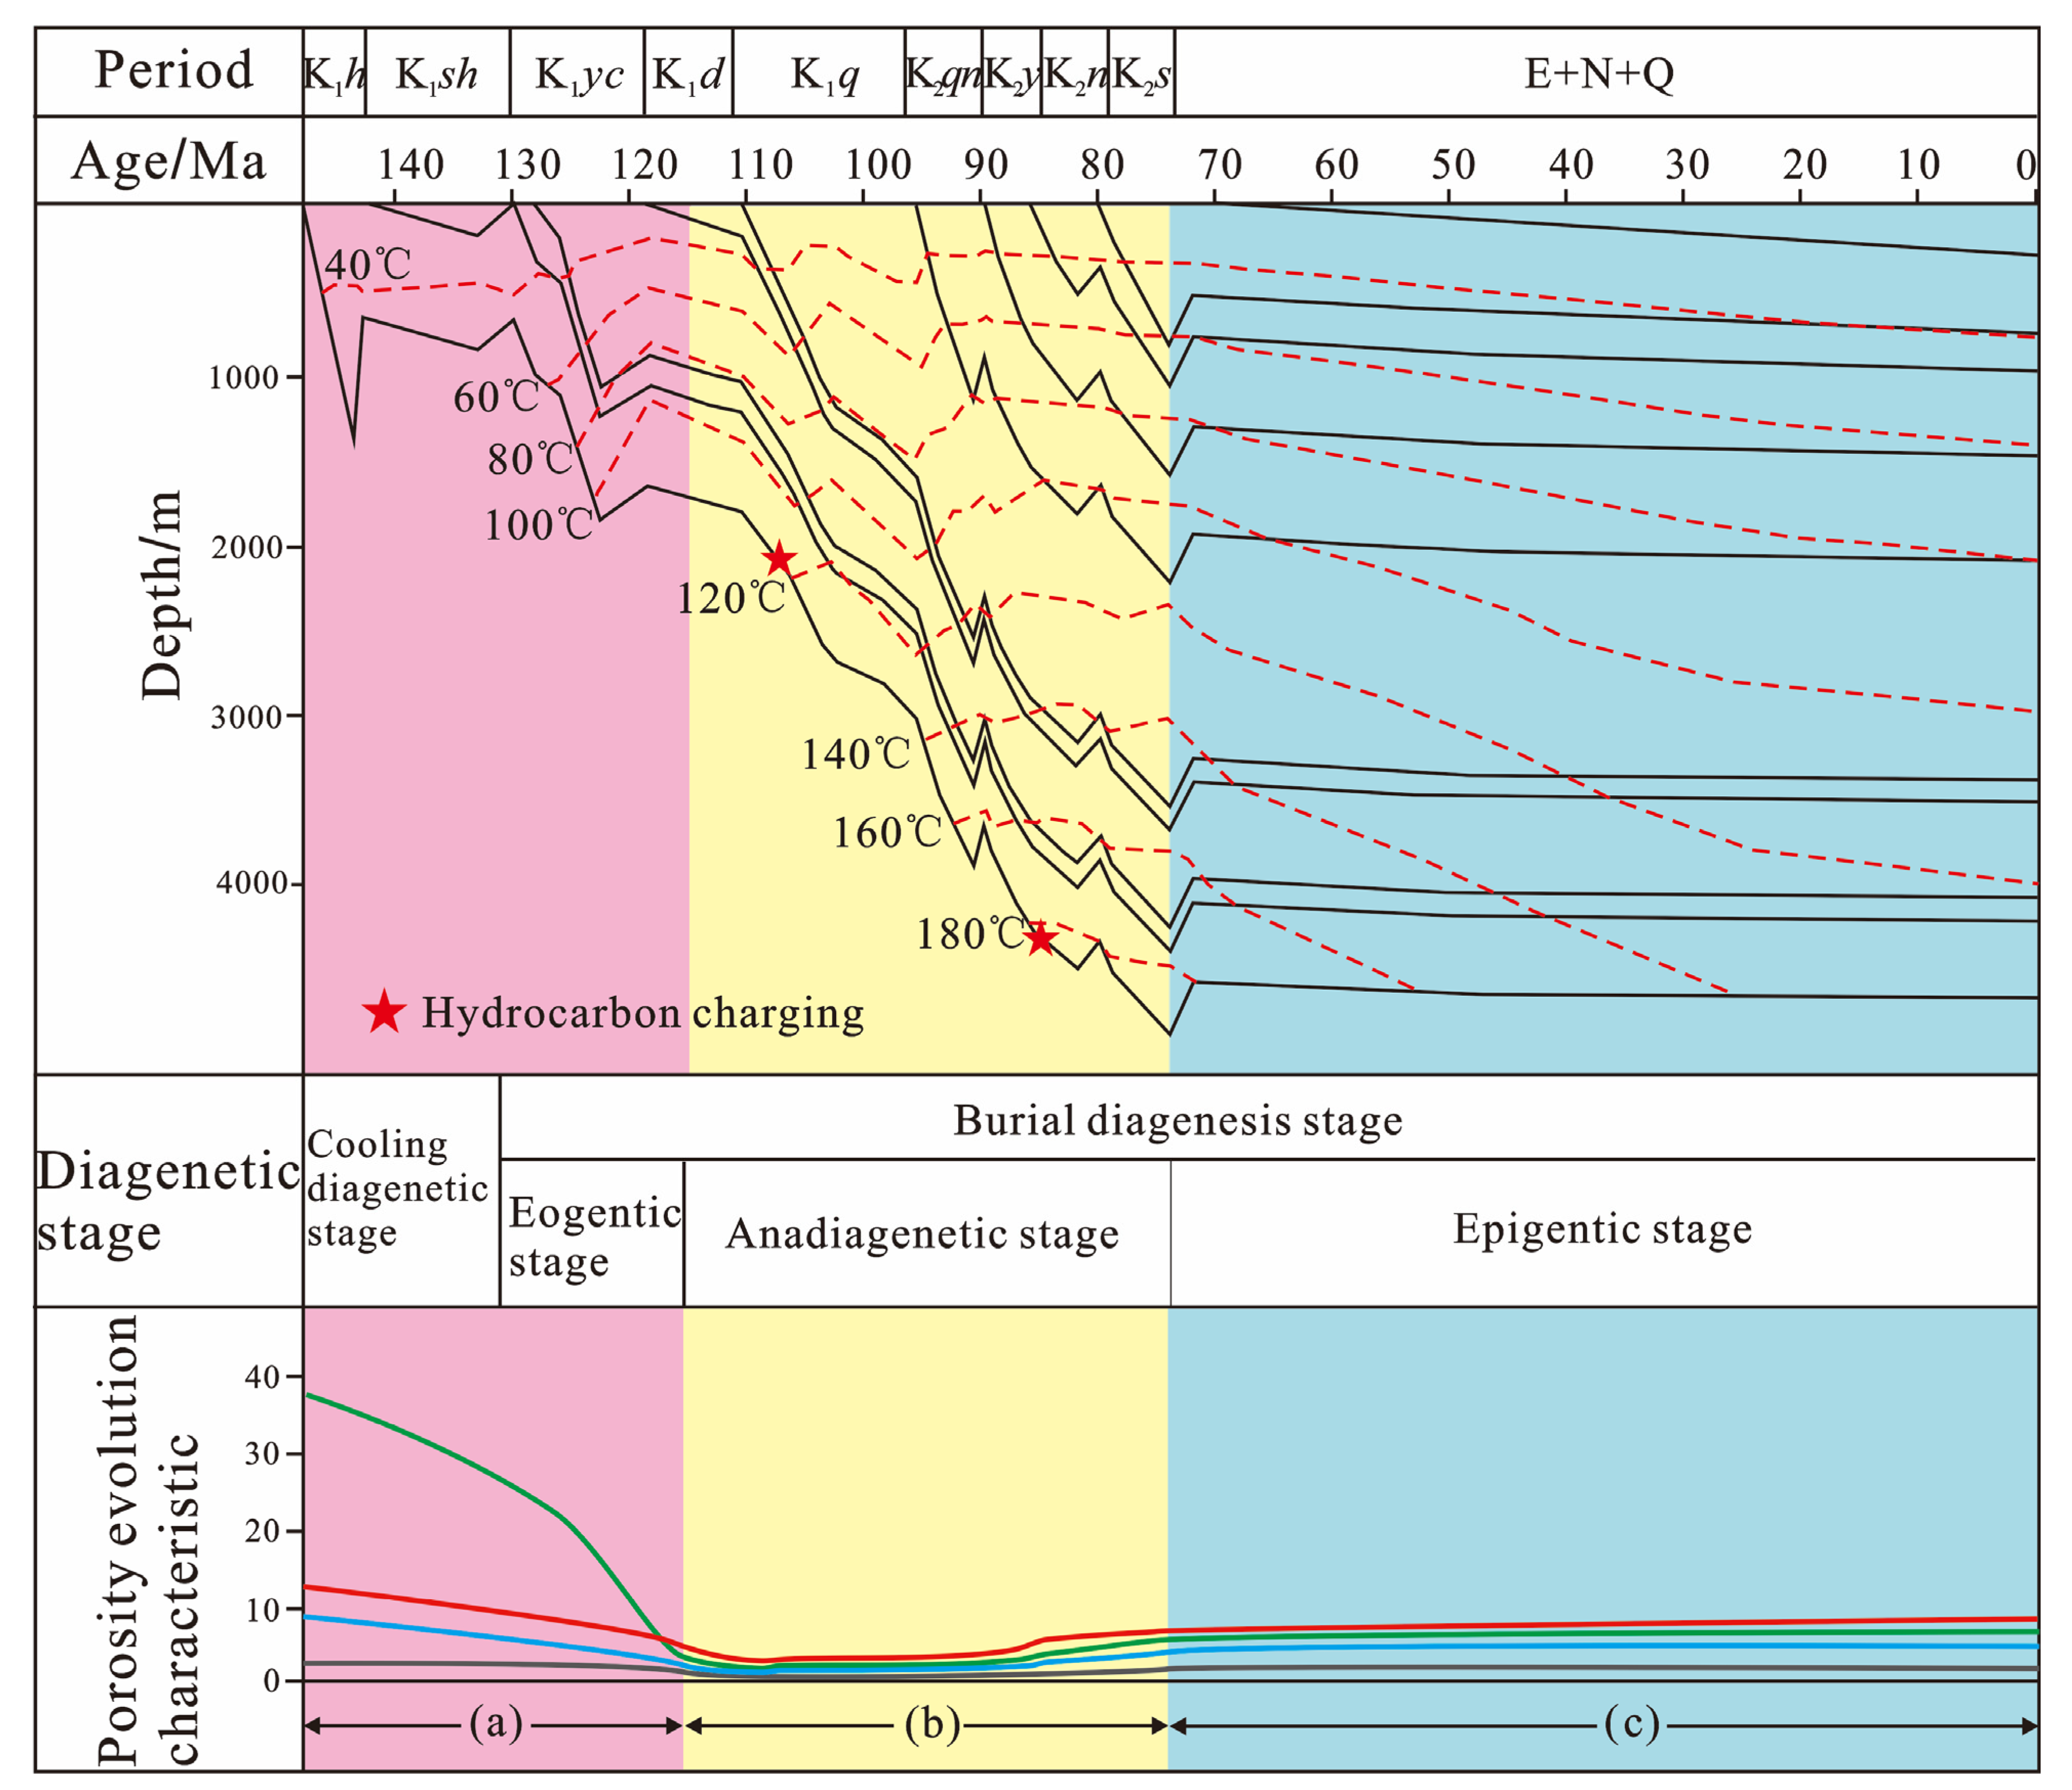
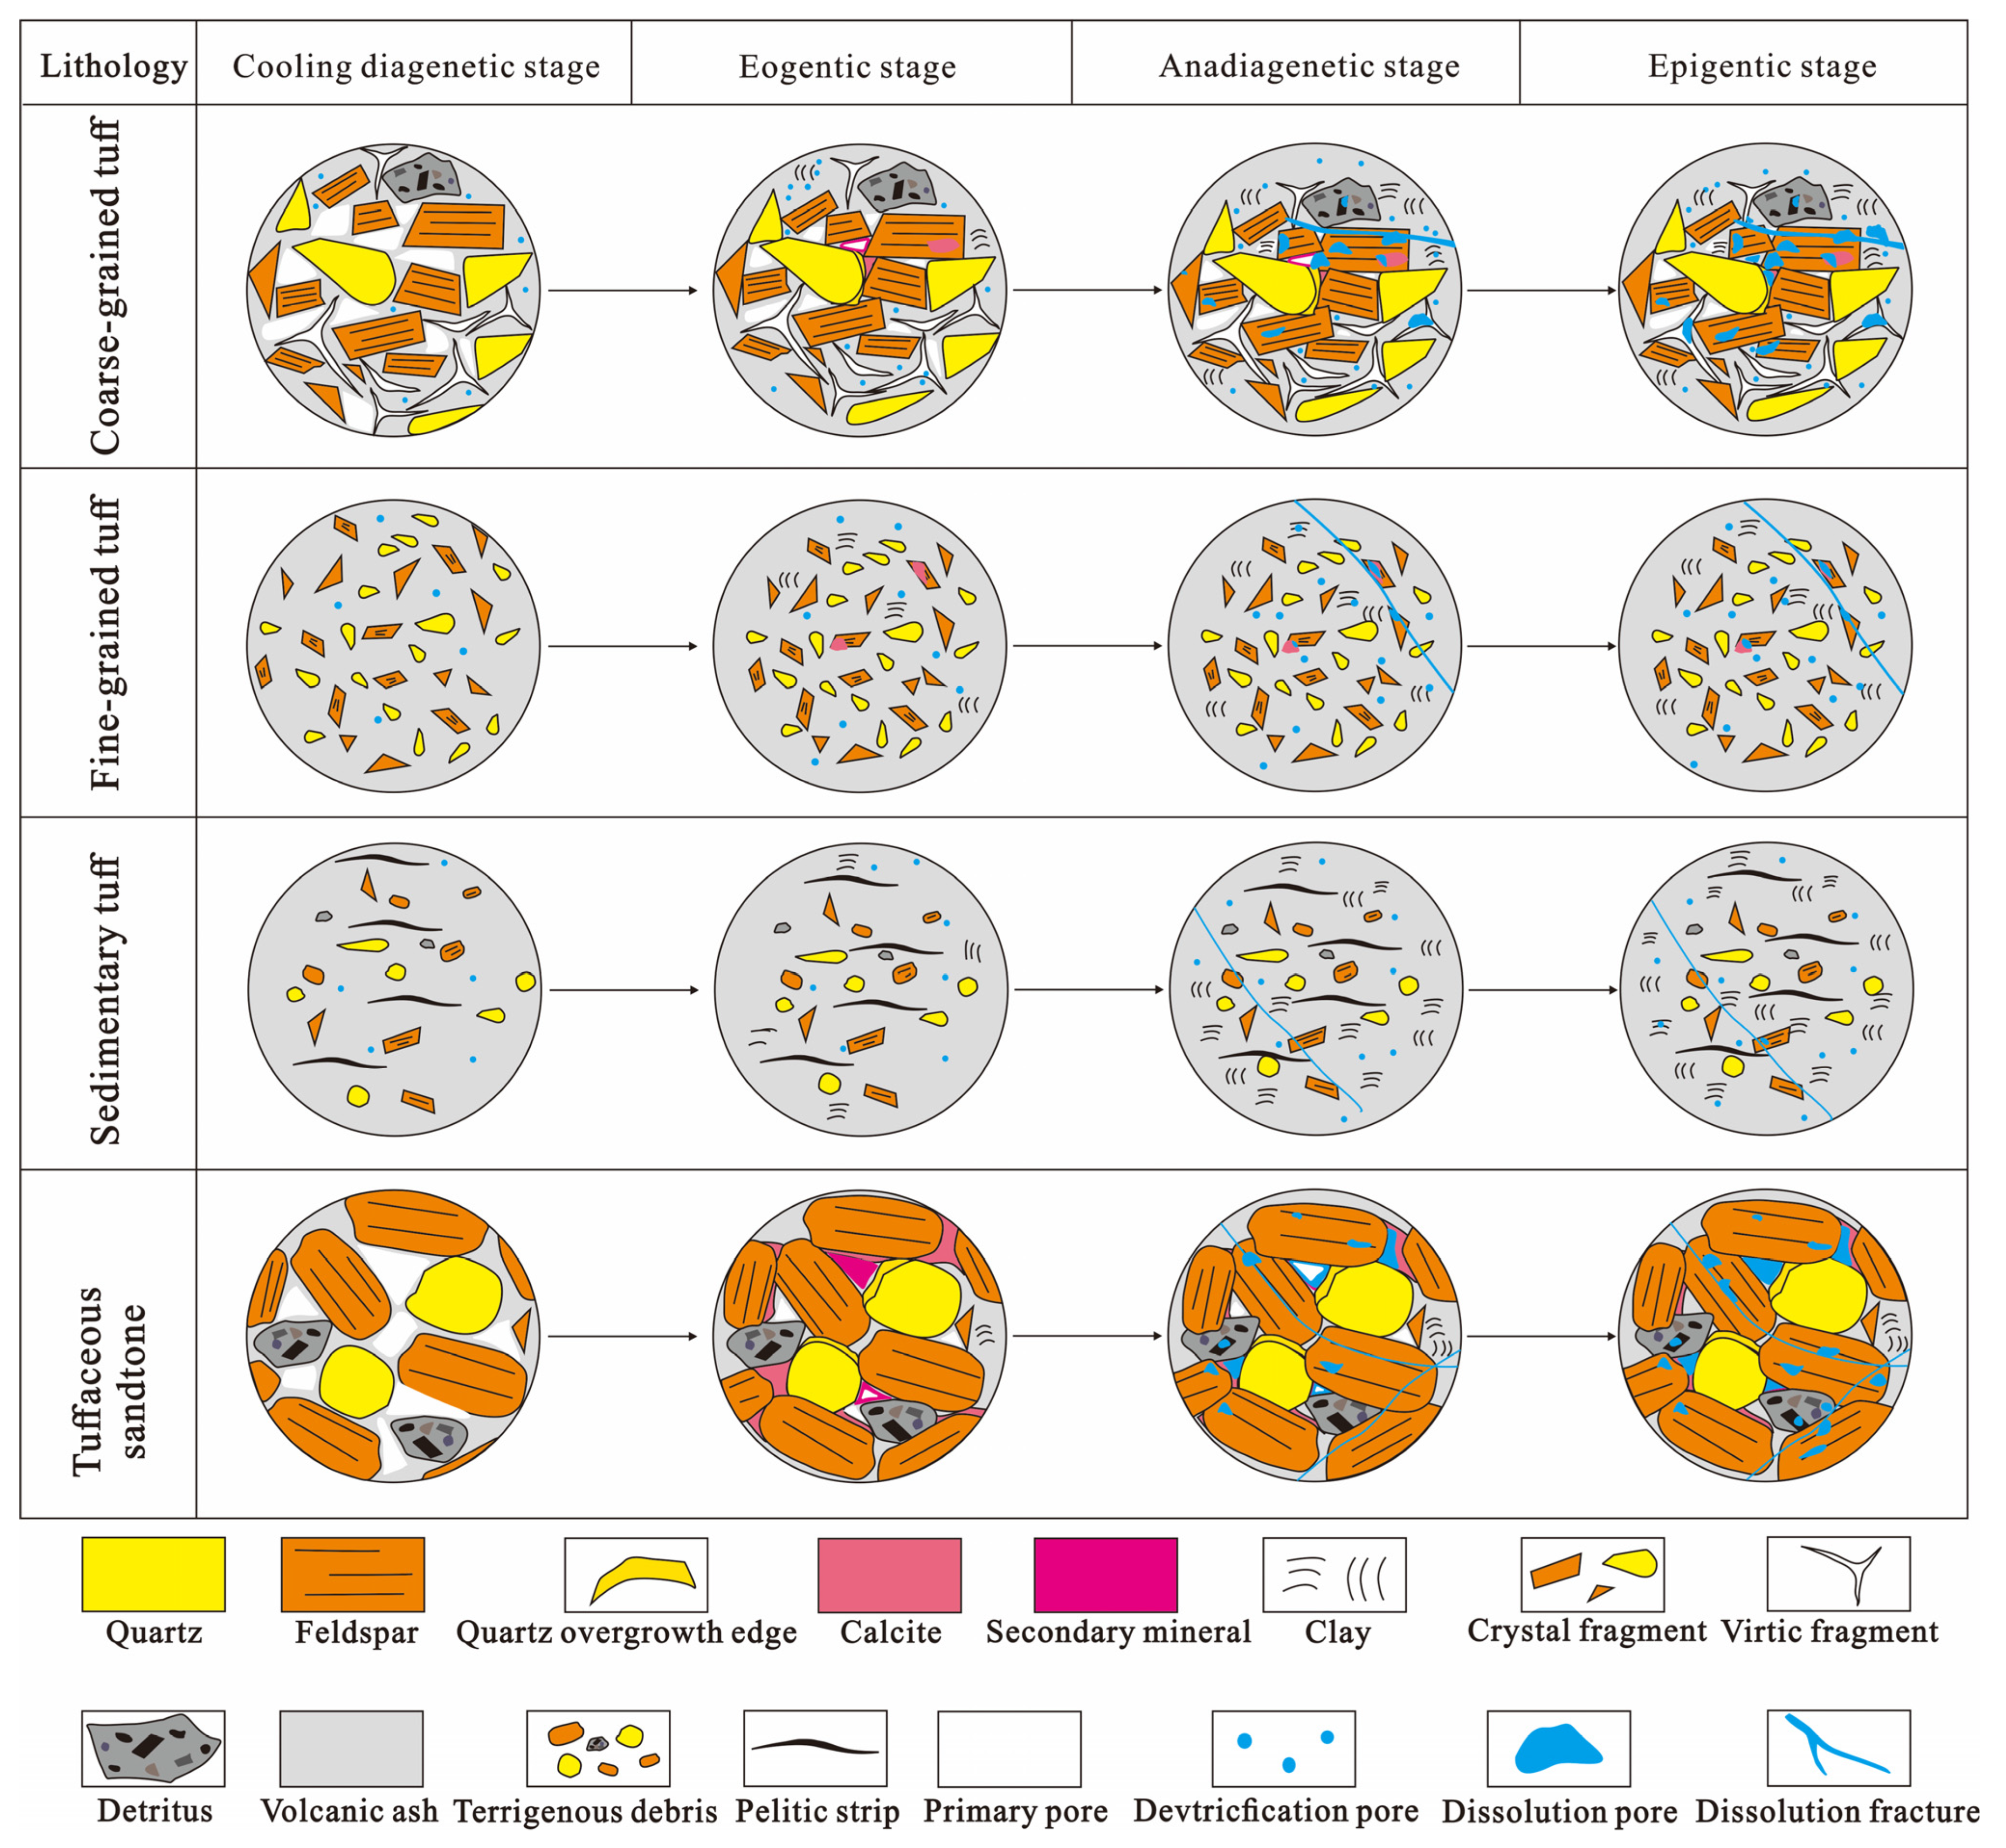
6.3. Process of the Formation and Evolution of Different Types of Reservoirs

The porosity evolution of pyroclastic rocks in the study area can be divided into three stages: the porosity decreasing stage caused by normal compaction, the porosity increasing stage caused by devitrification and dissolution, and the porosity stability stage after tectonic uplift. From the perspective of burial history and thermal evolution history, the three stages occurred before the deposition of the Denglouku Formation, between the deposition of the Denglouku Formation and Sifangtai Formation, and after the deposition of the Sifangtai Formation (Figure 15).
Before oil and gas charging, under the load of the overlying water and sediment, the compaction of pyroclastic rocks in the Huoshiling Formation released pore fluid, and the primary porosity of the reservoir gradually decreased [90,91]. However, due to devitrification and dissolution, the total porosity increased. After entering the burial diagenesis stage, the porosity increase caused by devitrification and dissolution was similar to that caused by compaction. The porosity of tuff does not change with depth.
Increasing temperature and pressure in underwater sedimentary environments are conducive to devitrification [60,61,62,63,64,65]. The subaqueous volcanic rocks are buried underground after ejection and are influenced by the static pressure and tectonic stress of the overlying strata, which is conducive to the occurrence of devitrification. Under the influence of volcanic heat, water is an active component that can increase particle movement in the vitreous [68]. Water can easily accumulate and migrate where tectonic fractures develop, which is also conducive to devitrification. Devitrification lasted for a long time and continued to occur from the cooling diagenetic stage to the late diagenetic stage.
With increasing burial depth, the palaeotemperature increased to 100–180 °C, and the Huoshiling Formation entered the middle petrogenesis stage (Figure 15). There were two stages of hydrocarbon charging in the middle petrogenesis stage [92]. At 103.6 Ma, the first oil and gas charging occurred at the beginning of the third member of the Quantou Formation, which was of low intensity and resulted in a weakly acidic reservoir fluid environment. Weakly acidic hydrocarbon-bearing fluids caused feldspar and tuff to dissolve. At 70.9 Ma, the second hydrocarbon charging occurred at the end of the Nenjiang Formation. The widely distributed mixed layer consumed a large amount of K+ in the process of the transformation from smectite to illite, leading to an increasing concentration ratio of Na+ to K+ in the formation water, which promoted the selective dissolution of K-feldspar and the occurrence of albitization [93,94,95]. With the charging of oil–gas bearing fluid in the hydrocarbon source rocks of the study area, a large amount of acidic substances migrated, the pH of the formation water was significantly reduced, and the dissolution of tuffaceous composition and feldspar was greatly accelerated, which promoted illitization of montmorillonite and was associated with Fe-rich chlorite (Figure 6j,k).
The middle diagenetic stage and late diagenetic stage correspond to the tectonic movement stage of the depression–reversion stage [41], and the effective fractures formed relatively late, which played a guiding role in hydrocarbon accumulation and a dynamic adjustment role after oil and gas charging. The fault side of the well continued to be active for a long time until the end of the Mingshui Formation.
From the difference in pore structure characteristics of different lithologies, the lithology determined the basic petrological characteristics of the rock, such as particle size distribution, sorting, rounding, and mineral content, thus laying the foundation for the evolution of the pore structure of pyroclastic rocks. The depth-porosity map shows that the tuffaceous sandstone had the strongest influence on compaction, followed by coarse-grained tuff, with fine-grained tuff and sedimentary tuff being dense in the diagenetic stage and less affected by compaction. The dissolution of feldspar minerals lags behind that of tuff, and the dissolution rate was lower than that of tuff [96], with a high clay mineral content and low soluble material content in sedimentary tuff. Therefore, the dissolution of tuff in the study area was stronger than that of tuffaceous sandstone and sedimentary tuff, the dissolution pores and fractures were more developed in the tuff, making its physical properties more favorable. In addition, coarse-grained tuff has a coarse grain size and primary intergranular pores, and mineral filling in the intergranular pores could offset part of the compaction effect; later dissolution led to the dissolution of the filling minerals and the formation of secondary pores (Figure 16). Strong tectonic activities in the middle and late diagenesis produced a large number of fractures, which are one of the main controlling factors for forming favorable reservoir space, as reservoir space and seepage channels can promote the interaction between fluid and rock.

6.4. Reservoir Development Pattern

Studies have shown that the distribution of volcanic reservoirs is controlled by the volcanic edifice and facies, and favorable reservoirs are usually located in the proximal facies of the volcanic edifice [97,98,99]. The proximal facies is characterized by coarse grains, poor sorting, disordered accumulation, and high volcanic debris content; the distal facies is characterized by fine grains, good sorting, bedding development, and high content of retransported volcanic debris particles [40]. In the tuff cone volcanic edifice of the study area, coarse-grained tuff is a representative of the proximal facies, while sedimentary tuff and tuffaceous sandstone are often representatives of the mesodistal facies (Figure 5). Facies control the distribution range of favorable reservoirs. Different facies have different lithologies and different degrees of interaction with water, resulting in great differences in different facies. The porosity and permeability values of the proximal facies are higher than those of the distal facies. The tuff reservoir in the proximal facies is the most important reservoir space, with a high content of volcanic glass and the development of devitrification pores. In addition to favorable facies and lithology, dissolution is also one of the important effects on reservoir development. Since the primary pores of underwater volcanic rocks are poorly developed, the organic acid dissolution pores formed by the dissolution of volcanic materials by the organic acid discharged from the source rocks in the process of evolutionary burial are very important reservoir spaces and can form relatively large abundant effective pores. Fractures that developed close to the fault connect isolated pores and enhance the effectiveness of the reservoir space (Figure 17).

7. Conclusions

(1)
The reservoirs of pyroclastic rocks are compact, and the primary pores are not developed. The reservoir space is mainly composed of secondary pores and fractures such as devitrification pores, dissolution pores, and clay mineral intergranular pores. Tuff has a high content of volcanic ash and glass chips, and a large number of devitrification pores constitute the main reservoir space. Under the influence of dissolution and alteration, dissolution pores and clay mineral intergranular pores also develop. Fractures created by tectonic processes can mainfest these pores. The sedimentary tuff has the least favorable physical properties and high clay mineral content. The reservoir space is mainly micropores between clay minerals, and the pore connectivity is poor, so it is difficult to form favorable reservoirs in this rock type. The content of soluble components such as feldspar, debris, and turbidite in tuffaceous sandstone is high, and a certain scale of dissolution pores can be formed. However, due to the low content of volcanic ash, devitrification pores are hardly developed, and the physical properties of tuffaceous sandstone are less favorable than those of tuff.
(2)
Devitrification and dissolution are the main mechanisms of micropore formation in pyroclastic reservoirs. The underwater eruptive accumulation environment is conducive to continuous devitrification. The organic acid dissolution caused by two oil–gas charging events in the middle petrogenesis stage is an important cause of the formation of reservoir pores. Tectonic activity is intense and fractures develop. As both reservoir spaces and fluid migration channels, fractures promote the development of reservoirs.
(3)
The coarse-grained tuff reservoir developed in the proximal facies of the tuff cone volcanic edifice formed by underwater eruption is the highest-quality pyroclastic reservoir in the study area. A large number of devitrification pores are present due to the high content of volcanic ash. In the later stage of diagenesis, dissolution pores were generated under the transformation of organic acids, and deep hydrothermal fluids, and fractures were generated by tectonic activities to communicate reservoir space. The superior lithology superimposed dissolution and tectonic action are favorable target areas for exploration and development.

Author Contributions

Conceptualization, Y.S. and X.S.; methodology, Y.S.; software, Y.L., Q.L. and J.L.; validation, Y.S., X.S. and J.Y.; formal analysis, Y.S.; investigation, H.P. and R.Z.; resources, A.L.; data curation, Y.S.; writing—original draft preparation, Y.S.; writing—review and editing, W.B.; visualization, Y.S.; supervision, X.S.; project administration, J.Y. and G.H.; funding acquisition, X.S. All authors have read and agreed to the published version of the manuscript.

Funding

National Natural Science Foundation of China (No. 41790453, No. 41972313); Science and Technology Department Project of Jilin Province (Grant No. 20200403068SF, 20210101108JC).

Data Availability Statement

The data used to support the findings of this study are included within the article.

Acknowledgments

Thanks to Northeast Oil and Gas Branch, SINOPEC, for the basic data used in this project. We are also very grateful to the reviewers and editors for their contributions to improving this paper.

Conflicts of Interest

The authors declare no conflict of interest.

References

  1. White, J.; Smellie, J.L.; Clague, D.A. Explosive Subaqueous Volcanism; American Geophysical Union: Washington, DC, USA, 2003. [Google Scholar]
  2. Arculus, R. Submarine volcanism: Deeply explosive. Nat. Geosci. 2011, 4, 737–738. [Google Scholar] [CrossRef]
  3. Embley, R.W.; Chadwick, W.W., Jr.; Baker, E.T.; Butterfield, D.A.; Resing, J.A.; Ronde, C.; Tunnicliffe, V.; Lupton, J.E.; Juniper, S.K.; Rubin, K.H. Long-term eruptive activity at a submarine arc volcano. Nature 2006, 441, 494–497. [Google Scholar] [CrossRef] [PubMed]
  4. Sohn, R.A.; Willis, C.; Humphris, S.; Shank, T.M.; Singh, H.; Edmonds, H.N.; Kunz, C.; Hedman, U.; Helmke, E.; Jakuba, M. Explosive volcanism on the ultraslow-spreading Gakkel ridge, Arctic Ocean. Nature 2008, 453, 1236–1238. [Google Scholar] [CrossRef] [PubMed] [Green Version]
  5. Chadwick, W.W.; Cashman, K.V.; Embley, R.W.; Matsumoto, H.; Dziak, R.P.; Ronde, C.; Lau, T.K.; Deardorff, N.D.; Merle, S.G. Direct video and hydrophone observations of submarine explosive eruptions at NW Rota-1 volcano, Mariana arc. J. Geophys. Res. Solid Earth 2008, 113. [Google Scholar] [CrossRef] [Green Version]
  6. Cas, R.A.F. Submarine volcanism; eruption styles, products, and relevance to understanding the host-rock successions to volcanic-hosted massive sulfide deposits. Econ. Geol. Bull. Soc. Econ. Geol. 1992, 87, 511–541. [Google Scholar] [CrossRef]
  7. Wohletz, K.H.; Sheridan, M.F. Hydrovolcanic explosions. II. Evolution of basaltic tuff rings and tuff cones. Am. J. 1983, 283, 385–413. [Google Scholar] [CrossRef]
  8. Mattox, T.N.; Mangan, M.T. Littoral hydrovolcanic explosions: A case study of lava-seawater interaction at Kilauea Volcano. J. Volcanol. Geotherm. Res. 1997, 75, 1–17. [Google Scholar] [CrossRef] [Green Version]
  9. Saint-Ange, F.; Bachèlery, P.; Babonneau, N.; Michon, L.; Jorry, S.J. Volcaniclastic sedimentation on the submarine slopes of a basaltic hotspot volcano: Piton de la Fournaise volcano (La Réunion Island, Indian Ocean). Mar. Geol. 2013, 337, 35–52. [Google Scholar] [CrossRef] [Green Version]
  10. Head, J.W.; Wilson, L. Deep submarine pyroclastic eruptions: Theory and predicted landforms and deposits. J. Volcanol. Geotherm. Res. 2003, 121, 155–193. [Google Scholar] [CrossRef] [Green Version]
  11. Allen, S.R.; Hayward, B.W.; Mathews, E. A facies model for a submarine volcaniclastic apron: The Miocene Manukau Subgroup, New Zealand. Geol. Soc. Am. Bull. 2007, 119, 725–742. [Google Scholar] [CrossRef]
  12. Helo, C.; Clague, D.A.; Dingwell, D.B.; Stix, J. High and highly variable cooling rates during pyroclastic eruptions on Axial Seamount, Juan de Fuca Ridge. J. Volcanol. Geotherm. Res. 2013, 253, 54–64. [Google Scholar] [CrossRef]
  13. Steffen, K.; Schindlbeck, J.C.; Scudder, R.P.; Murray, R.W.; Pickering, K.T.; Armin, F.; Shasa, L.; Ken, H.; Sanny, S.; Hajime, N. Large volume submarine ignimbrites in the Shikoku Basin: An example for explosive volcanism in the Western Pacific during the Late Miocene. Geochem. Geophys. Geosyst. 2014, 15, 1837–1851. [Google Scholar]
  14. White, J. Subaqueous eruption-fed density currents and their deposits. Precambrian Res. 2000, 101, 87–109. [Google Scholar] [CrossRef]
  15. Mueller, W.U. A subaqueous eruption model for shallow-water, small volume eruptions: Evidence from two Precambrian examples. Wash. DC Am. Geophys. Union Geophys. Monogr. 2003, 140, 189–203. [Google Scholar]
  16. Kokelaar, P.; Busby, C. Subaqueous explosive eruption and welding of pyroclastic deposits. Science 1992, 257, 196–201. [Google Scholar] [CrossRef] [Green Version]
  17. Grynberg, M.E.; Papava, D. Petrophysical characteristics of the middle eocene laumontite tuff reservoir, samgori field, republic of georgia. J. Pet. Geol. 1993, 16, 313–322. [Google Scholar] [CrossRef]
  18. Thomas Kalan, H.P.; Sitorus, M.E. Jatibarang Field, Geologic Study of Volcanic Reservoir for Horizontal Well Proposal; Indonesian Petroleum Association: Jakarta, Indonesia, 1994. [Google Scholar]
  19. Tomaru, H.; Lu, Z.L.; Fehn, U. Origin of hydrocarbons in the Green Tuff region of Japan: I-129 results from oil field brines and hot springs in the Akita and Niigata Basins. Chem. Geol. 2009, 264, 221–231. [Google Scholar] [CrossRef]
  20. Bischoff, A.P.; Nicol, A.; Beggs, M. Stratigraphy of architectural elements in a buried volcanic system and implications for hydrocarbon exploration. Interpretation 2017, 5, SK141–SK159. [Google Scholar] [CrossRef]
  21. Zhang, Y.; Shu, P.; Wang, P.J.; Zheng, C.Q.; Shan, X.L. Differences between volcanic rocks from onshore and underwater eruptions and their effects on reservoirs: A case study of Yingcheng Formation, Songliao Basin. J. Jilin Univ. Earth Sci. Ed. 2007, 37, 125–1265. [Google Scholar]
  22. Shan, X.L.; Yi, J.; Li, J.Z.; Luo, H.H.; Zhang, Y.Y. Geochemistry of perlite of the Yingcheng Formation in Santai region, Songliao basin and its tectonic implications. Acta Petrol. Sin. 2010, 26, 93–98. [Google Scholar]
  23. Cheng, R.H.; Shen, Y.J.; Wang, T.F.; Yu, Z.F. Pyroclastics deposition and its facies model of crater: An example from Yingcheng formation in Songliao basin, Cretaceous, NE China. J. Cent. South Univ. 2014, 45, 2006–2013. [Google Scholar]
  24. Li, S.C.; Ma, Q.; Bai, G.J.; Li, X.N.; Yan, L.G.; Huang, Z.L. Characteristics of Dense Tuff Reservoir of Haerjiawu Formation in Malang Sag in Santanghu Basin. Xinjiang Pet. Geol. 2015, 36, 430–435. [Google Scholar]
  25. Wang, S.P.; Lin, T.; Sun, P.; Liang, H.; Wang, D.L.; Gou, H.G. Influences of diagenetic effects on volcanic rock reservoirs under two different sedimentary environments. Pet. Geol. Exp. 2012, 34, 145–152. [Google Scholar]
  26. Ma, J.; Liu, G.H.; Huang, Z.L.; Ou, G.X.; Li, T.J.; Guo, X.B. Tight tuff reservoir characteristics and its controlling factors: A comparative study of the Permian Tiaohu Formation and Carboniferous Haerjiawu Formation in the Santanghu Basin, NW China. J. Pet. Sci. Eng. 2020, 187, 106808. [Google Scholar] [CrossRef]
  27. Xian, B.Z.; Niu, H.P.; Zhu, X.M.; Dong, G.D.; Zhu, S.F.; An, S.Q. Early Permian Volcanic Lithology, Lithofacies and Their Relations to Reservoir in Northwestern Margin of the Junggar Basin. Geol. J. China Univ. 2013, 19, 46–55. [Google Scholar]
  28. Yang, K.K.; Bian, W.H.; Wang, Y.Q.; Li, Z.; Liu, X.K.; Wang, P.J. Discovery and geological significance of hyaloclastite of Batamayineishan Formation in Eastern Junggar Basin. J. Cent. South Univ. 2018, 42, 14–22. [Google Scholar]
  29. Xie, J.R.; Li, Y.; Yang, Y.M.; Zhang, B.J.; Liu, R.; He, Q.L.; Wang, W.; Wang, Y.F. Main controlling factors and natural gas exploration potential of Permian scale volcanoclastic reservoirs in the western Sichuan Basin. Nat. Gas Ind. 2021, 41, 48–57. [Google Scholar]
  30. Xiong, S.Y.; Shi, Z.Y.; Wang, W.; Zhang, H.; Liu, R.; Su, W.; Li, Y.; Yao, Q.Y.; Zhang, J.Y.; Jiang, Q.C. Permian volcanic reservoir types and main controlling factors in Southwest Sichuan. Nat. Gas Geosci. 2022, 33, 899–916. [Google Scholar]
  31. Maitre, R.W. The Chemical Variability of some Common Igneous Rocks. J. Petrol. 1976, 17, 589–598. [Google Scholar] [CrossRef]
  32. Fudali, R.F.; Dyar, D.M.; Griscom, D.L.; Henry, D. The oxidation state of iron in tektite glass. Geochim. Cosmochim. Acta 1987, 51, 2749–2756. [Google Scholar] [CrossRef]
  33. Shan, X.L.; Li, J.Y.; Chen, S.M.; Ran, Q.C.; Chen, G.B.; Liu, C. Subaquatic volcanic eruptions in continental facies and their influence on high quality source rocks shown by the volcanic rocks of a faulted depression in Northeast China. Sci. China: Earth Sci. 2014, 44, 2637–2644. [Google Scholar] [CrossRef]
  34. Tang, H.F.; Yang, D.; Shao, M.L.; Wang, P.J.; Sun, W.T.; Huang, Y.L. Constraint of volcano-stratigraphic emplacement environment on the reservoir distribution: A case analysis of rhyolitic volcanic strata in the 2nd member of Jurassic Huoshiling Formation in Wangfu fault depression, Songliao Basin, East China. Pet. Explor. Dev. 2016, 43, 573–579. [Google Scholar] [CrossRef]
  35. He, Y.X.; Xian, B.Z.; Shen, J.N. Discrimination of Volcanic Eruption Environment Using Oxidation Index:A Case Study of Lower Permian Volcanic Rocks in Northwestern Margin of Junggar Basin. Geol. J. China Univ. 2017, 23, 737–749. [Google Scholar]
  36. Liu, D.C.; Chen, Y.J.; Wu, H.M.; Ma, Q.; Zhang, H. Characteristics and element geochemical discrimination of onshore and underwater eruptive volcanic rocks: A case study of the Upper Carboniferous volcanic rocks in Malang Sag, Santanghu Basin, Xinjiang. J. Northeast Pet. Univ. 2021, 45, 41–51+79. [Google Scholar]
  37. Wu, H.M.; Chen, Y.J.; Meng, P.F.; Ma, Q.; Song, X.Y.; He, X.H.; Yu, J.Y.; He, B.B. Oxidation coefficient discrimination method of volcanic eruption environment on land and underwater. Acta Sedimentol. Sin. 2022, 40, 599–615. [Google Scholar]
  38. Sun, M.D.; Xu, Y.G.; Chen, H.L. Subaqueous volcanism in the Paleo-Pacific Ocean based on Jurassic basaltic tuff and pillow basalt in the Raohe Complex, NE China. Sci. China Earth Sci. 2018, 48, 1016–1032. [Google Scholar] [CrossRef]
  39. Huang, Y.L.; Shan, J.F.; Liu, H.B.; Zhang, B.; Feng, Y.H.; Lang, H.L. Facies architecture of Paleogene subaqueous trachytes and its implica tions for hydrocarbon reservoirs in Liaohe Basin. J. China Univ. Pet. 2019, 43, 1–11. [Google Scholar]
  40. Tang, H.F.; Wang, H.F.; Kennedy, B.; Zhang, X.Y.; Rossetti, M.; Bischoff, A.P.; Nicol, A. Characteristics and controlling factors of volcanic reservoirs of subaqueous pyroclastic rocks: An analysis of the Miocene Kora volcano in the Taranaki basin. Earth Sci. Front. 2021, 28, 375–387. [Google Scholar]
  41. Wang, P.J.; Mattern, F.; Didenko, N.A.; Zhu, D.F.; Singer, B.; Sun, X.M. Tectonics and cycle system of the Cretaceous Songliao Basin: An inverted active continental margin basin. Earth Sci. Rev. 2016, 159, 82–102. [Google Scholar] [CrossRef] [Green Version]
  42. Shu, L.S.; Mu, Y.F.; Wang, B.C. The oil-gas-bearing strata and the structural features in the Songliao Basin, NE China. J. Stratigr. 2003, 27, 340–347. [Google Scholar]
  43. Zhang, W.; Li, H.G.; Li, M.J. Structural characteristics and gas accumulation in the deep of the Changling Fault Depression, the South Songliao Basin. Oil Gas Geol. 2008, 29, 120–127. [Google Scholar]
  44. Ge, R.F.; Zhang, Q.; Xu, S.Y.; Wang, L.S.; Xie, G.A.; Chen, J.; Wang, X.Y. Structure evolution and its kinetic setting of changling fault depression in Songliao basin. J. Geol. 2009, 33, 346–358. [Google Scholar]
  45. Liu, Y.J.; Zhang, X.Z.; Jin, W.; Chi, X.G.; Wang, C.W.; Ma, Z.H.; Han, G.Q.; Wen, Q.B.; Zhao, Y.L.; Wang, W.D.; et al. Late Paleozoic tectonic evolution in Northeast China. Geol. China 2010, 37, 943–951. [Google Scholar]
  46. Chang, W.B.; Shan, X.L.; Yi, J.; Du, T.T.; Qu, Y. Spatial and temporal distributions of the late Mesozoic volcanic successions and their controlling effects on the Changling fault depression of the Songliao Basin, NE China. Can. J. Earth Sci. 2017, 54, 1194–1213. [Google Scholar] [CrossRef] [Green Version]
  47. Liu, C.; Shan, X.; Yi, J.; Shi, Y.; Ventura, G. Volcanism at the end of continental rifting: The Cretaceous syn-rift to post-rift transition in the Songliao Basin (NE China). Gondwana Res. 2022, 111, 174–188. [Google Scholar] [CrossRef]
  48. Li, R.L.; Zhu, J.F.; Liu, Y.H.; Li, Z.B.; Fan, X.P.; Leng, Q.L.; Zhang, T.T. Volcanic rock reservoir characteristics and hydrocarbon accumulation factors of rift unit in southern area, Songliao Basin. Earth Sci. Front. 2022. [Google Scholar] [CrossRef]
  49. Qu, X.J.; Wang, P.J.; Gao, Y.F.; Wan, X.Q. Chronostratigraphy of Huoshiling Formation in the Songliao Basin, NE China: An overview. Earth Sci. Front. 2014, 21, 234–250. [Google Scholar]
  50. Zhang, J.F.; Xu, X.Y.; Bai, J.; Chen, S.; Liu, W.B.; Li, Y.H. Accumulation and exploration of continental shale gas resources of Cretaceous Shahezi Formation in Lishu fault depression, Songliao Basin, NE China. Pet. Explor. Dev. 2022, 49, 440–452. [Google Scholar] [CrossRef]
  51. GB/T 29172-2012; Standard Practices for Core Analysis. Standardization Administration of China: Beijing, China, 2012.
  52. GB/T 29171-2012; Standard Rock Capillary Pressure Measurement. Standardization Administration of China: Beijing, China, 2012.
  53. Washburn, E.W. The dynamics of capillary flow. Phys. Rev. 1921, 17, 273. [Google Scholar] [CrossRef] [Green Version]
  54. GB/T 19587-2017; Standard Determination of the Specific Surface Area of Solids by Gas Adsorption Using the BET Method. Standardization Administration of China: Beijing, China, 2017.
  55. GB/T 21650.3-2011; Standard Pore Size Distribution and Porosity of Solid Materials by Mercury Porosimetry and Gas Adsorption—Part 3:Analysis of Micropores by Gas Adsorption. Standardization Administration of China: Beijing, China, 2012.
  56. Brunauer, S.; Emmett, P.H.; Teller, E. Adsorption of gases in multi-molecular layers. J. Am. Chem. Soc. 1983, 60, 309–319. [Google Scholar] [CrossRef]
  57. SY/T 5163-2010; Analysis Method for Clay Minerals and Ordinary Non-Clay Minerals in Sedimentary Rocks by the X-ray Diffraction. Standardization Administration of China: Beijing, China, 2012.
  58. Zhang, R.K.; Fan, G. Quantitative analytic method and experiments of X-ray diffration phase of clay minerals. Uranium Geol. Name 2003, 19, 180–185. [Google Scholar]
  59. Wang, Y.Q.; Wang, J.D.; Wang, Q.J.; Sui, F.G.; Shi, H.G.; Xu, Y.D. Diagenesis of vo caniclastic rocks and its control over reservoir performance:A case study of the Carbonilerous system in Chepaizi area, Junggar basin. J. China Univ. Min. Technol. 2019, 48, 405–414. [Google Scholar]
  60. Oelkers, E.H.; Gislason, S.R. The mechanism, rates and consequences of basaltic glass dissolution: I. An experimental study of the dissolution rates of basaltic glass as a function of aqueous Al, Si and oxalic acid concentration at 25 °C and pH = 3 and 11. Geochim. Cosmochim. Acta 2001, 65, 3671–3681. [Google Scholar] [CrossRef]
  61. Gislason, S.R.; Wolff-Boenisch, D.; Oelkers, E.H.; Putnis, C.V. The dissolution rates of natural glasses as a function of their composition at pH 4 and 10.6, and temperatures from 25 to 74 °C. Geochim. Cosmochim. Acta J. Geochem. Soc. Meteorit. Soc. 2004, 68, 4843–4858. [Google Scholar]
  62. Aradóttir, E.S.P.; Sigfússon, B.; Sonnenthal, E.L.; Bjrnsson, G.; Jónsson, H. Dynamics of basaltic glass dissolution—Capturing microscopic effects in continuum scale models. Geochim. Cosmochim. Acta 2013, 121, 311–327. [Google Scholar] [CrossRef] [Green Version]
  63. Declercq, J.; Diedrich, T.; Perrot, M.; Gislason, S.R.; Oelkers, E.H. Experimental determination of rhyolitic glass dissolution rates at 40–200 °C and 2 < pH < 10.1. Geochim. Cosmochim. Acta 2013, 100, 251–263. [Google Scholar]
  64. Minde, M.W.; Wang, W.X.; Madland, M.V.; Zimmermann, U.; Korsnes, R.I.; Bertolino, S.R.A.; Andersen, P.Ø. Temperature effects on rock engineering properties and rock-fluid chemistry in opal-CT-bearing chalk. J. Pet. Sci. Eng. 2018, 169, 454–470. [Google Scholar] [CrossRef]
  65. Andersen, P.S.; Berawala, D.S. Modeling of Creep-Compacting Outcrop Chalks Injected with Ca-Mg-Na-Cl Brines at Reservoir Conditions. SPE J. 2019, 24, 2889–2910. [Google Scholar] [CrossRef]
  66. Mchenry, L.J. Element mobility during zeolitic and argillic alteration of volcanic ash in a closed-basin lacustrine environment: Case study Olduvai Gorge, Tanzania. Chem. Geol. 2009, 265, 540–552. [Google Scholar] [CrossRef]
  67. Kirov, G.; Samajova, E.; Nedialkov, R.; Stanimirova, T. Alteration processes and products of acid pyroclastic rocks in Bulgaria and Slovakia. Clay Miner. 2011, 46, 279–294. [Google Scholar] [CrossRef]
  68. Zhao, H.L.; Huang, W.; Wang, C.; Di, Y.J.; Qi, J.S.; Xiao, Y.; Liu, J. Micropores from devitrification in volcanic rocks and their contribution to reservoirs. Oil Gas Geol. 2009, 30, 47–52+58. [Google Scholar]
  69. Xiang, F.; Xiao, Q.; Yu, X.T.; Huang, H.X.; Zhu, X. Reservoir characteristics of the Upper Permian marine tuffaceous deposits in Yuanba area, Sichuan Basin. Oil Gas Geol. 2022, 43, 889–901. [Google Scholar]
  70. Liu, X.N.; Jiang, Z.X.; Yuan, X.D.; Chen, C.; Wang, C. Influence of the Cretaceous fine-grained volcanic materials on shale oil/gas, Luanping Basin. Oil Gas Geol. 2022, 43, 390–406. [Google Scholar]
  71. Zhao, Y.T.; Shan, X.L.; Wang, P.J.; Sun, J.; Liu, Q.D.; Ren, L.J. Devitrification of the Volcanic Rocks of the Cretaceous Yingcheng Formation in the Songliao Basin and Its Reservoir Significance: An Example from a Basin Boundary Section. J. Jilin Univ. 2007, 37, 1152–1158. [Google Scholar]
  72. Wilkin, R.T.; Brantley, S.L.; Barnes, H.L. The size distribution of framboidal pyrite in modern sediments: An indicator of redox conditions. Geochim. Cosmochim. Acta 1996, 60, 3897–3912. [Google Scholar] [CrossRef]
  73. Wilkin, R.T.; Barnes, H.L. Formation processes of framboidal pyrite. Geochim. Cosmochim. Acta 1997, 61, 323–339. [Google Scholar] [CrossRef]
  74. Wignall, P.B.; Newton, R. Pyrite framboid diameter as a measure of oxygen deficiency in ancient mudrocks. Am. J. Sci. 1998, 298, 537–552. [Google Scholar] [CrossRef]
  75. Wilkin, R.T.; Arthur, M.A. Variations in pyrite texture, sulfur isotope composition, and iron systematics in the Black Sea: Evidence for Late Pleistocene to Holocene excursions of the o2-h2s redox transition. Geochim. Cosmochim. Acta 2001, 65, 1399–1416. [Google Scholar] [CrossRef]
  76. Wang, J.; Wang, X.L. Seepage characteristic and fracture development of protected seam caused by mining protecting strata. J. Min. Strat. Control Eng. 2021, 3, 62–70. [Google Scholar]
  77. Li, H.; Tang, H.M.; Qin, Q.R.; Zhou, J.L.; Qin, Z.J.; Fan, C.H.; Su, P.D.; Wang, Q.; Zhong, C. Characteristics, formation periods and genetic mechanisms of tectonic fractures in the tight gas sandstones reservoir: A case study of Xujiahe Formation in YB area, Sichuan Basin, China. J. Pet. Sci. Eng. 2019, 178, 723–735. [Google Scholar]
  78. Li, H.; Wang, Q.; Qin, Q.R.; Ge, X.Y. Characteristics of natural fractures in an ultradeep marine carbonate gas reservoir and their impact on the reservoir: A case study of the Maokou Formation of the JLS Structure in the Sichuan Basin, China. Energy Fuels 2021, 35, 13098–13108. [Google Scholar] [CrossRef]
  79. Li, H.; Qin, Q.R.; Zhang, B.J.; Ge, X.Y.; Hu, X.; Fan, C.H.; Tang, H.M. Tectonic fracture formation and distribution in ultradeep marine carbonate gas reservoirs: A case study of the Maokou Formation in the Jiulongshan Gas Field, Sichuan Basin, southwest China. Energy Fuels 2020, 34, 14132–14146. [Google Scholar] [CrossRef]
  80. Li, Q.W.; Liu, Z.B.; Chen, F.-R.; Zhang, K.; Tang, L. Behavior and controlling factors of methane adsorption in Jurassic continental shale, northeastern Sichuan Basin. Energy Geosci. 2023, 4, 83–92. [Google Scholar] [CrossRef]
  81. SY/T 6285-2011; Standard Evaluating Methods of Oil and Gas Reservoirs. Standardization Administration of China: Beijing, China, 2012.
  82. Zhang, Z.; Pang, J.; Yang, Y.T.; Cao, Y.H.; Qi, M.H.; Zhang, Y.Y.; Zhang, L.; Ma, S. Carbon and oxygen isotope characteristics and genesis of carbonate cements in sandstone of the 4th Member of the Xujiahe Formation in the central western Sichuan depression, Sichuan basin, China. Acta Geol. Sin. 2022, 96, 2094–2106. [Google Scholar]
  83. Zhu, S.F.; Zhu, X.M.; Wu, D.; Liu, Y.H.; Li, P.P.; Jiang, S.X.; Liu, X.C. Alteration of volcanics and its controlling factors in the Lower Permian reservoirs at northwestern margin of Junggar Basin. Oil Gas Geol. 2014, 35, 77–85. [Google Scholar]
  84. Yang, X.P.; Qiu, Y.N. Formation Process and Distribution of Laumontite in Yanchang Formation (Upper Triassic) of Ordos Basin. Acta Sedimentol. Sin. 2002, 20, 628–632. [Google Scholar]
  85. Huang, S.J.; Huang, K.K.; Feng, W.L.; Tong, H.P.; Liu, L.H.; Zhang, X.H. Mass exchanges among feldspar, kaolinite and illite and their influences on secondary porosity formation in clastic diagenesis—A case study on the Upper Paleozoic, Ordos Basin and Xujiahe Formation, Western Sichuan Depression. Geochimica 2009, 38, 498–506. [Google Scholar]
  86. Guo, H.L.; Wang, D.R. Isotopic composition and genesis analysis of carbonate cements in sandstone reservoirs in Tarim oil and gas area. Pet. Explor. Dev. 1999, 26, 51–52. [Google Scholar]
  87. Wang, X.; Ding, W.; Long, C.; Wang, R.; He, J.; Li, A.; Yang, G.; Liu, J.; Xiao, Z.; Fu, F. The developmental characteristics of natural fractures and their significance for reservoirs in the Cambrian Niutitang marine shale of the Sangzhi block, southern China. J. Pet. Sci. Eng. 2018, 165, 831–841. [Google Scholar] [CrossRef]
  88. Cai, Z.J. Analysis of the developmental characteristics and major regulating factors of fractures in marine-continental transitional shale-gas reservoirs: A case study of the Carboniferous-Permian strata in the southeastern Ordos Basin, central China. Mar. Pet. Geol. 2013, 45, 121–133. [Google Scholar]
  89. Guo, P.; Yao, L.; Ren, D. Simulation of three-dimensional tectonic stress fields and quantitative prediction of tectonic fracture within the Damintun Depression, Liaohe Basin, northeast China. J. Struct. Geol. 2016, 86, 211–223. [Google Scholar] [CrossRef]
  90. Goulty, N.R.; Sargent, C.; Andras, P.; Aplin, A.C. Compaction of diagenetically altered mudstones—Part 1: Mechanical and chemical contributions. Mar. Pet. Geol. 2016, 77, 703–713. [Google Scholar] [CrossRef] [Green Version]
  91. Liu, G.H.; Zhai, G.Y.; Huang, Z.L.; Zou, C.N.; Xia, X.H.; Shi, D.S.; Zhou, Z.; Zhou, C.; Chen, R.; Yu, S.F. The effect of tuffaceous material on characteristics of different lithofacies: A case study on Lucaogou Formation fine-grained sedimentary rocks in Santanghu Basin. J. Pet. Sci. Eng. 2019, 179, 355–377. [Google Scholar] [CrossRef]
  92. Shi, Y.M. Volcano edificies and Gas Pool Formation in Changling Faulted Depression, Songliao Basin, China. Ph.D. Thesis, China University of Geosciences (Beijing), Beijing, China, 2012. [Google Scholar]
  93. Luo, J.L.; Shao, H.M.; Yang, Y.F.; Li, S.; Luo, C.Y. Temporal and spatial evolution of burial-hydrocarbon filing-diagenetic process of deep volcanic reservoir in Songliao Basin. Earth Sci. Front. 2013, 20, 175–187. [Google Scholar]
  94. Cheng, R.H.; Shen, Y.J.; Yan, J.B.; Li, Q.F.; Li, X.H.; Wang, Y.W.; Li, F.; Xu, Z.J. Diagenesis of volcaniclastic rocks in Hailaer Basin. Acta Petrol. Sin. 2010, 26, 47–54. [Google Scholar]
  95. Li, J.S.; Fu, L.; Zhang, J.L.; Chen, J.; Niu, B.; Zhang, S.C. Diagenesis and secondary pore evolution of Middle and Upper Permian clastic rocks in WuXia area, Junggar Basin. Lithologic Reservoirs. Lithol. Reserv. 2019, 31, 54–66. [Google Scholar]
  96. Liu, R.E.; Sun, F.J.; Bai, C.H.; Ma, C.H.; Huang, Y.M. An approach to the generating mechanism of secondary pores and pore evolution model of He 8 gas layer in Suligemiao gas field. Pet. Explor. Dev. 2002, 29, 47–49. [Google Scholar]
  97. Wang, P.J.; Chen, S.M.; Liu, W.Z.; Shan, X.L.; Cheng, R.H.; Zang, Y.; Wu, H.B.; Qi, J.S. Relationship between volcanic fscies and volcanic reservoirs in Songliao Basin. Oil Gas Geol. 2003, 24, 18–23. [Google Scholar]
  98. Wang, P.J.; Hou, Q.J.; Liu, W.Z.; Huang, Y.L.; Jia, J.T.; Tang, H.F. Characteristics of volcanic facies and genesis of natural gases in deep Songliao Basin, NE China. Glob. Geol. 2007, 26, 319–325. [Google Scholar]
  99. Jadwiga, J.; Edyta, P.; Maria, B.; Bartosz, P. Variability of the Rotliegend sandstones in the Polish part of the Southern Permian Basin-permeability and porosity relationships. Ann. Soc. Geol. Pol. 2009, 79, 13–26. [Google Scholar]
Figure 1. (a) Location map of the Songliao Basin; (b) map of the study area, Changling fault depression in the Songliao Basin, modified after Chang et al. (2017) [46]; (c) Wells in the Chaganhua area; (d) Typical geological section through C301 and adjacent areas (for the location of the section, see (c)).
Energies 16 04968 g001
Figure 2. Stratigraphic column for the study area, modified after Wang et al. (2016) [41]. The ages are from Chang et al. (2017) [46] and Liu et al. (2022) [47].
Energies 16 04968 g002
Figure 3. Petrographic characteristics of subaqueous pyroclastic rocks of the Chaganhua subsag, Huoshiling Formation. (a) Fine-grained crystalline tuff, low-angle fracture, high-angle fractures filled with siliceous minerals, Well C2, 4417.70 m; (b) Fine-grained crystalline tuff, bedding, low-angle fracture, Well C301, 4035.60 m; (c) Coarse-grained crystalline vitric tuff, accretionary lapilli, Well C3, 4627.90 m; (d) Coarse-grained detritus crystalline tuff, low-angle fracture, Well C2, 4417.70 m; (e) Tuffaceous sandstone, shear fracture, Well C301, 4047.00 m; (f) Fine-grained crystalline tuff, high-angle fracture, Well C2, 4563.10 m; (g) Sedimentary tuff, accretionary lapilli, fractures filled with calcite, Well C2-1, 4542.20 m; (h) Tuffaceous sandstone, Well C3, 4526.33 m; (i) Fine-grained crystalline tuff, Well C2, 4422.12 m; (j) Coarse-grained crystalline tuff, fractured Well C2, 4781.80 m; (k) Fine-grained crystalline tuff, accretionary lapilli, two-stage fractures filled with calcite, Well C3, 4627.90 m; (l) Sedimentary tuff, two-stage fractures filled with calcite and siliceous minerals, Well C2-3, 4226.35 m; (m) Coarse-grained crystal vitric tuff, Well C3, 4624.80 m; (n) Coarse-grained detritus crystalline tuff, Well C2, 4417.70 m; (o) Sedimentary tuff, pelitic strips, Well C2, 4778.3 m; (p) Tuffaceous sandstone, calcite cement, Well C3, 4526.3 m. Qtz = quartz, Kfs = K-feldspar, Pl = plagioclase.
Energies 16 04968 g003
Figure 4. Content of clay minerals for different lithologies.
Energies 16 04968 g004
Figure 5. Reservoir space types of pyroclastic rocks in the Huoshiling Formation of the Chaganhua subsag. (a) Matrix dissolution pore, Well C301, 4047.85 m; (b) Matrix dissolution pore, Well C3, 4627.40 m; (c) Dissolution fracture, Well YS3, 4,159.37 m; (d) A matrix dissolution pore strongly dissolved along the fracture, Well C3, 4625.08 m; (e) Devitrification contiguous development, Well YS3, 4327.58 m; (f) Dissolution fracture, Well C3, 4632.24 m; (g) Structural fracture, Well C2-1, 4543.85 m; (h) Feldspar intragranular dissolution pore, Well C2-1, 4543.85 m; (i) Devitrification pore, Well C2-3, 4273.40 m; (j) Clay mineral intercrystalline pore, Well C3, 4624.80 m; (k) Dissolution pore, Well C301, 4047.58 m; (l) Pyrite intercrystalline pore, Well C2-1, 4644.28 m. MDp = matrix dissolution pore, IDp = intragranular dissolution pore, ICp = intercrystalline pore, DVp = devitrification pore, SF = structural fractures, DF = dissolution fracture; Qtz = quartz, Ab = albite, Afs = alkaline feldspar, Kfs = K-feldspar, Ill = illite, Chl = chlorite.
Energies 16 04968 g005
Figure 6. Pore width frequency distributions of different types of pores.
Energies 16 04968 g006
Figure 7. Relationship between the porosity and permeability of the pyroclastic rocks in the Chaganhua subsag.
Energies 16 04968 g007
Figure 8. Capillary pressure curve characteristics.
Energies 16 04968 g008
Figure 9. N2 adsorption and desorption isotherms obtained from the LTNA experiments. (a) Well C2-3, 4224.10 m, coarse-grained brecciated crystalline tuff; (b) Well C2, 4418.00 m, coarse-grained detritus crystalline tuff; (c) Well C3, 4625.80 m, coarse-grained vitric crystalline tuff; (d) Well C301, 4431.60 m, fine-grained crystalline tuff; (e) Well C2, 4568.52 m, sedimentary tuff; (f) Well C2, 4777.56 m, sedimentary tuff; (g) Well C3, 4527.82 m, tuffaceous sandstone; (h) Well C301, 4086.70 m, tuffaceous sandstone.
Energies 16 04968 g009
Figure 10. Surface porosity of different lithologies. (a) Surface porosity of fine-grained tuff; (b) Surface porosity of coarse-grained tuff; (c) Surface porosity of sedimentary tuff; (d) Surface porosity of tuffaceous sandstone.
Energies 16 04968 g010
Figure 11. Porosity associated with feldspar and clay mineral. (a) Porosity associated with feldspar; (b) Porosity associated with clay mineral.
Energies 16 04968 g011
Figure 13. Fracture development characteristics (example of Well C301). (a) Fracture characteristics of the comprehensive columnar section from Well C301; (b) Low-angle fractures, Well C301, 4039.58–4039.70 m; (c) Low-angle fractures, Well C301, 4041.88–4042.13 m; (d) Low-angle fractures and shear fractures, Well C301, 4048.20–4050.00 m; (e) Characteristics of the seismic profile along the b-b′ line in the study area (profile position is shown in Figure 1b).
Energies 16 04968 g013
Figure 14. Dissolution fractures in thin sections of pyroclastic rocks in the study area. (a) A dissolution pore develops near the fracture, Well C3, 4527.42 m; (b) Dissolution pores are distributed along the fracture, Well YS3, 4329.30 m. DF = dissolution fractures, MDp = matrix dissolved pore.
Energies 16 04968 g014
Figure 15. Burial history and pore evolution characteristics of pyroclastic rock in Well C2, Huoshiling Formation, Chaganhua subsag. (a) Reducing porosity of normal compaction; (b) Increasing porosity stage of devitrification; (c) Normal evolution stage after increasing porosity.
Energies 16 04968 g015
Figure 16. Pore evolution model of pyroclastic rocks in the Huoshiling Formation of the Chaganhua subsag.
Energies 16 04968 g016
Figure 17. Reservoir development pattern of subaqueous pyroclastic rock in the Huoshiling Formation of the Chaganhua subsag.
Energies 16 04968 g017
Table 1. Lithology and content of mineral components measured by XRD.
Lithology WellDepth (m)Content from XRD (%)
ClayLaumontiteAnhydriteAnalciteQuartzK-FeldsparPlagioclaseCalciteDolomiteSideritePyrite
TuffC24416.502.3 44.31.950.70.40.4
C24417.703.3 43.11.750.51.4
C24418.004.3 47.3 47.41
C24418.303.1 48.42.345.30.9
C24419.3029.8 28.84.131.21.81.8 2.5
C24419.5010 59.91.324 4.8
C24423.0595.2 1.92.9
C24568.6013.9 0.6 41.83.3364 0.4
C2-14668.1011.6 39.57.239.80.31.6
C2-14668.4512.5 35.110.839.20.32.1
C34527.1313.8 0.8 36.83.540.62.61.5 0.4
C34527.8212.4 13.86.549.416.60.8 0.5
C34529.005.1 1.2 42.84.841.72.41.5 0.5
C34625.8026.6 0.8 17.810.835.60.35.91.21.0
C34624.805.7 37.17.926.121.02.2
C34626.507.7 50.77.430.73.5
C34916.0010.812.7 20.17.242.33.52.10.80.5
C34918.6011.71.1 16.26.255.47.51.5 0.4
C34915.357.825 0.819.93.641.61.3
YS34161.6411.36.410.327.26.145.12.2 0.4
YS34162.9716.612.30.6 49.669.41.53.6 0.4
YS34325.006.229.4 35.65.220.21.32.1
YS34327.5861.1 0.339.15.940.55.51.6
C3013971.0725 0.455.74.412.5 2
C3013971.3720.3 19.24.4550.70.4
C3013973.7721.6 1 51.82.719.50.32 1.1
C3013974.1716.1 61.54.915.5 2
C3013979.6719.9 54.85.017.5 2.8
C3014038.3529.7 39.57.822.6 0.4
C3014039.2823.4 61.63.210.8 1
C3014042.7220.6 61.63.212.3 2.3
C3014045.0616.9 46.710.625.4 0.4
C3014047.587.214.2 20.97.749.20.2 0.6
C3014083.4510.5 0.8 51.55.128.60.33.2
C3014084.1813.8 0.451.76.527.6
C3014431.6014.3 36.18.840.8
Sedimentary
tuff
C24413.3565.2 6.42.625.4 0.4
C24568.2252.5 0.7 24.93.716.80.30.7 0.4
C24568.9241 9.33.75.638.61 0.8
C24779.1626.1 50.47.016.5
C2-14543.4024.5 0.648.27.016.22.31.2
C2-14546.6832.5 26.75.027.56.90.6 0.8
C2-34220.7054.9 6.46.418.114.2
C2-34224.1053.6 7.16.517.215.6
C2-34272.1068.3 13.15.89.1 2.8 0.9
C2-34273.4038.1 0.8 33.41.625.60.2 0.3
C2-34274.5225.2 49.911.48.8 4.7
C34528.6212 1 33.37.944.60.30.3 0.6
YS34024.8119.9 55.65.717.40.90.5
C3013964.0547.4 21.68.122.3 0.6
C3013964.7736.2 48.73.78.90.42.1
C3013964.9725.5 60.36.25.7 2.3
C3013965.3160.5 0.425.63.97.1 2.5
C3013966.459.6 27.43.46.512.1
C3013967.0740.7 43.03.78.71.42.5
C3013967.3352.3 1.40.427.94.710.6 2.7
C3013967.535.4 45.99.07.4 2.3
C3013972.1729.9 42.67.817.9 1.8
C3013972.8414.9 39.16.238.5 1.3
C3013973.5218.1 43.95.727.7 4.6
C3013974.5223.5 0.434.512.624.7 4.3
C3013975.112.9 51.914.719.6 0.9
C3013975.526.3 1.9 50.16.611.6 3.5
C3013976.3314.2 0.70.444.710.726.9 1.8 0.6
C3013976.8313.7 6111.712.60.30.7
C3013978.0724.3 48.64.319.7 3.1
C3014036.5530.4 425.318.9 3.4
C3014039.7818.5 57.613.17.60.32.9
C3014041.5822.3 54.75.313.90.52.8 0.5
C3014157.722 0.4 63.17.53.7 3.3
C3014159.2718.2 1.1 57.213.88.21.5
C3014429.641.1 1.5 26.23.024.10.82.6 0.7
Tuffaceous
sanfstone
C3014043.1218.6 1.2 59.25.312 3.2 0.5
C3014047.855.55.6 33.41.047.4 0.66.5
C3014086.544.0 0.9 26.51.553.912.90.3
C3014086.74.81.01.5 22.93.663.42.1 0.7
Table 2. Lithology and content of clay minerals components measured by XRD.
Lithology WellDepth (m)Relative Content of Clay (%)Mixed-Layer Ratio (S%)
KCII/SI/S
TuffC24417.7020.257.814.47.610
C24418.001249.731.76.610
C24418.3019.543.427.29.910
C24419.3012.640.433.813.210
C24419.504.59.164.821.610
C24423.051.32.172.224.410
C2-14668.453.310.468.218.110
C34527.1317.445.831.55.310
C34527.8227.333.625.213.910
C34529.0016.841.833.28.210
C34625.803.216.570.79.610
C34624.805.411.365.517.810
C34626.506.722.450.520.410
C34918.6021.857.1147.110
C34915.3518.345.224.312.210
YS34161.6417.348.924.19.710
YS34162.9713.833.53715.710
YS34325.0012.674.58.64.310
YS34327.585.25326.715.110
C3013971.0712.213.749.224.910
C3013971.379.948.426.914.810
C3013973.7714.625.542.417.510
C3013974.1717.216.251.515.110
C3013979.676.820.952.919.410
C3014038.3513.861.517.86.910
C3014039.285.42752.814.810
C3014042.721025.642.921.510
C3014045.0617.234.527.820.510
C3014047.5811.128.442.218.310
C3014083.451731.633.41810
C3014084.1817.541.228.412.910
C3014431.601854.719.77.610
Sedimentary tuffC24413.352.810.669.217.410
C24568.223.110.963.822.210
C24568.920.30.561.437.815
C24779.166.215.460.717.710
C2-14543.4012.443.43311.210
C2-14546.681231.739.616.710
C2-34220.7012.532.839.814.910
C2-34224.1011.931.234.822.110
C2-34272.1025.468.324.310
C2-34273.4020.763.810.25.310
C2-34274.522.35.771.820.210
C34528.6216.156.419.48.110
YS34024.8112.329.231.626.915
C3013964.05428.635.731.715
C3013964.775.314.946.433.415
C3013964.978.131.836.523.615
C3013965.319.242.12622.715
C3013966.43.84.953.238.115
C3013967.078.328.433.130.215
C3013967.335.57.551.435.615
C3013967.5413.167.515.410
C3013972.1714.659.217.48.810
C3013972.8412.158.717.21210
C3013973.5211.723.945.618.810
C3013974.527.427.546.518.610
C3013975.111.226.345.816.710
C3013975.59.115.657.517.810
C3013976.334.722.255.417.710
C3013976.838.928.243.319.610
C3013978.078.527.243.920.410
C3014036.5520.943.324.81110
C3014039.7814.147.220.518.210
C3014041.581.657617.410
C3014157.71528.933.922.215
C3014159.27920.141.329.615
C3014429.611.925.131.731.315
Tuffaceous sanfstoneC3014043.1211.633.536.818.110
C3014047.8515.260.320.44.110
C3014086.5411.368.614.1610
C3014086.79.762.718.98.710
Abbreviation: K = Kaolinite, C = Chlorite, I = Illite, I/S = Mixed-layer illite/smectite.
Table 3. Carbon and oxygen isotopic compositions of calcite cement of the Huoshiling Formation pyroclastic rocks.
WellDepth (m)δ13CPDB (‰)δ18OPDB (‰)
C14466.50 −9.2−22.6
4473.90 −8.7−21.4
4474.00 −8.7−22.4
4473.00 −9.6−22.5
C24717.20 −9.9−20.1
4716.00 −6.0−20.9
4716.90 −6.4−20.9
C34630.90 −4.9−22.3
4446.90 −10.0−21.0
4447.00 −8.6−23.4
4443.40 −12.3−19.8
4444.20 −8.4−20.3
4448.80 −14.2−20.2
4532.40 −7.8−24.2
4626.90 −7.9−22.0
4915.10 −7.4−23.3
4445.90 −9.5−20.9
4446.72 −8.7−18.2
4446.80 −8.3−19.0
4449.35 −8.2−16.6
C54450.13 −2.3−11.9
4452.46 −1.8−16.1
4526.00 −4.5−27.6
4526.80 −5.8−23.1
4527.94 −7.0−23.5
YS34026.30 −6.5−22.1
4023.77 −7.0−25.1
4024.41 −6.7−18.2
4026.30 −9.2−19.0
4022.87 −12.4−22.9
4025.66 −15.5−27.6
4027.15 −13.2−24.8
4159.97−10.6−21.5
4160.64 −7.7−22.4
4162.95 −7.1−23.5
4324.60 −10.3−25.8
4324.90 −8.7−17.7
4329.30 −9.1−17.9
Disclaimer/Publisher’s Note: The statements, opinions and data contained in all publications are solely those of the individual author(s) and contributor(s) and not of MDPI and/or the editor(s). MDPI and/or the editor(s) disclaim responsibility for any injury to people or property resulting from any ideas, methods, instructions or products referred to in the content.

