
Experimental Study on U-Beam Separator Device for Separating Solids from Gases

Abstract
:1. Introduction

2. Materials and Methods
2.1. Geometry of the Equipment
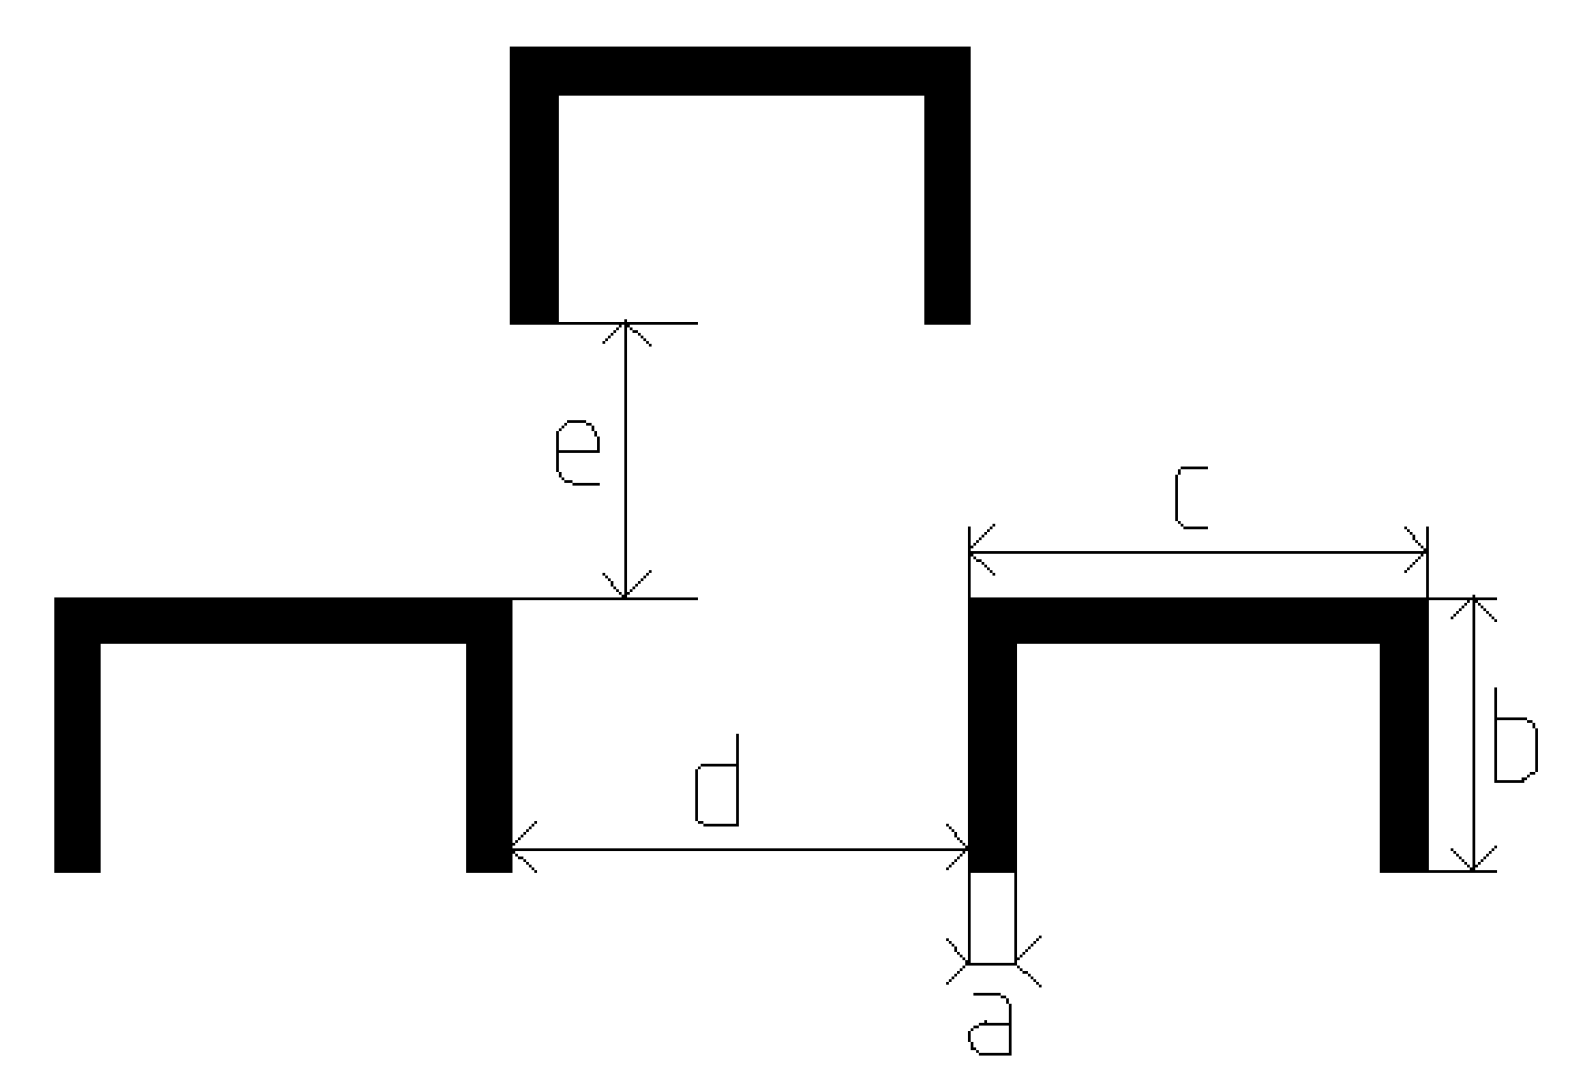
2.2. Geometry of U-Beam
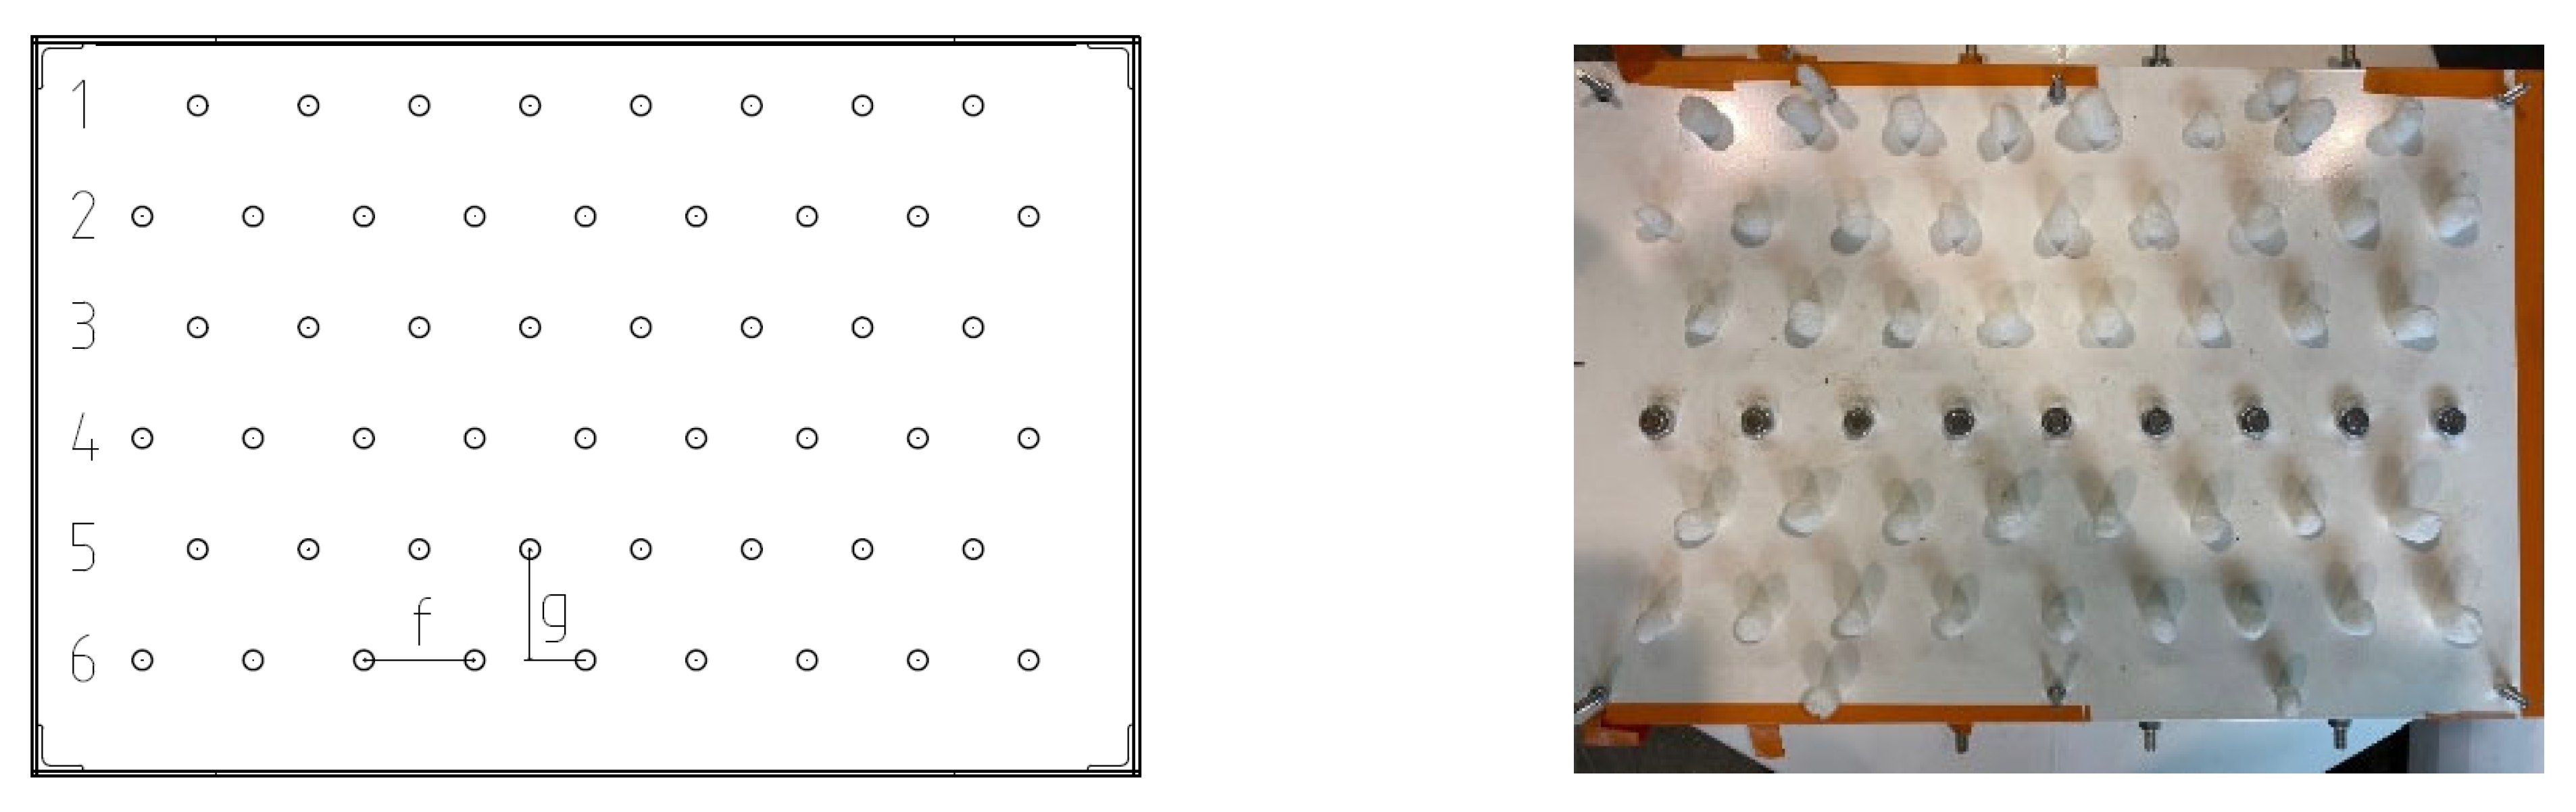
2.3. Geometry of the Box
- without U-beam;
- with one row installed;
- with two rows installed at different positions in the system and with a variable space between the rows;
- with three rows installed at different positions in the system and with a variable space between the rows;
- with four rows.
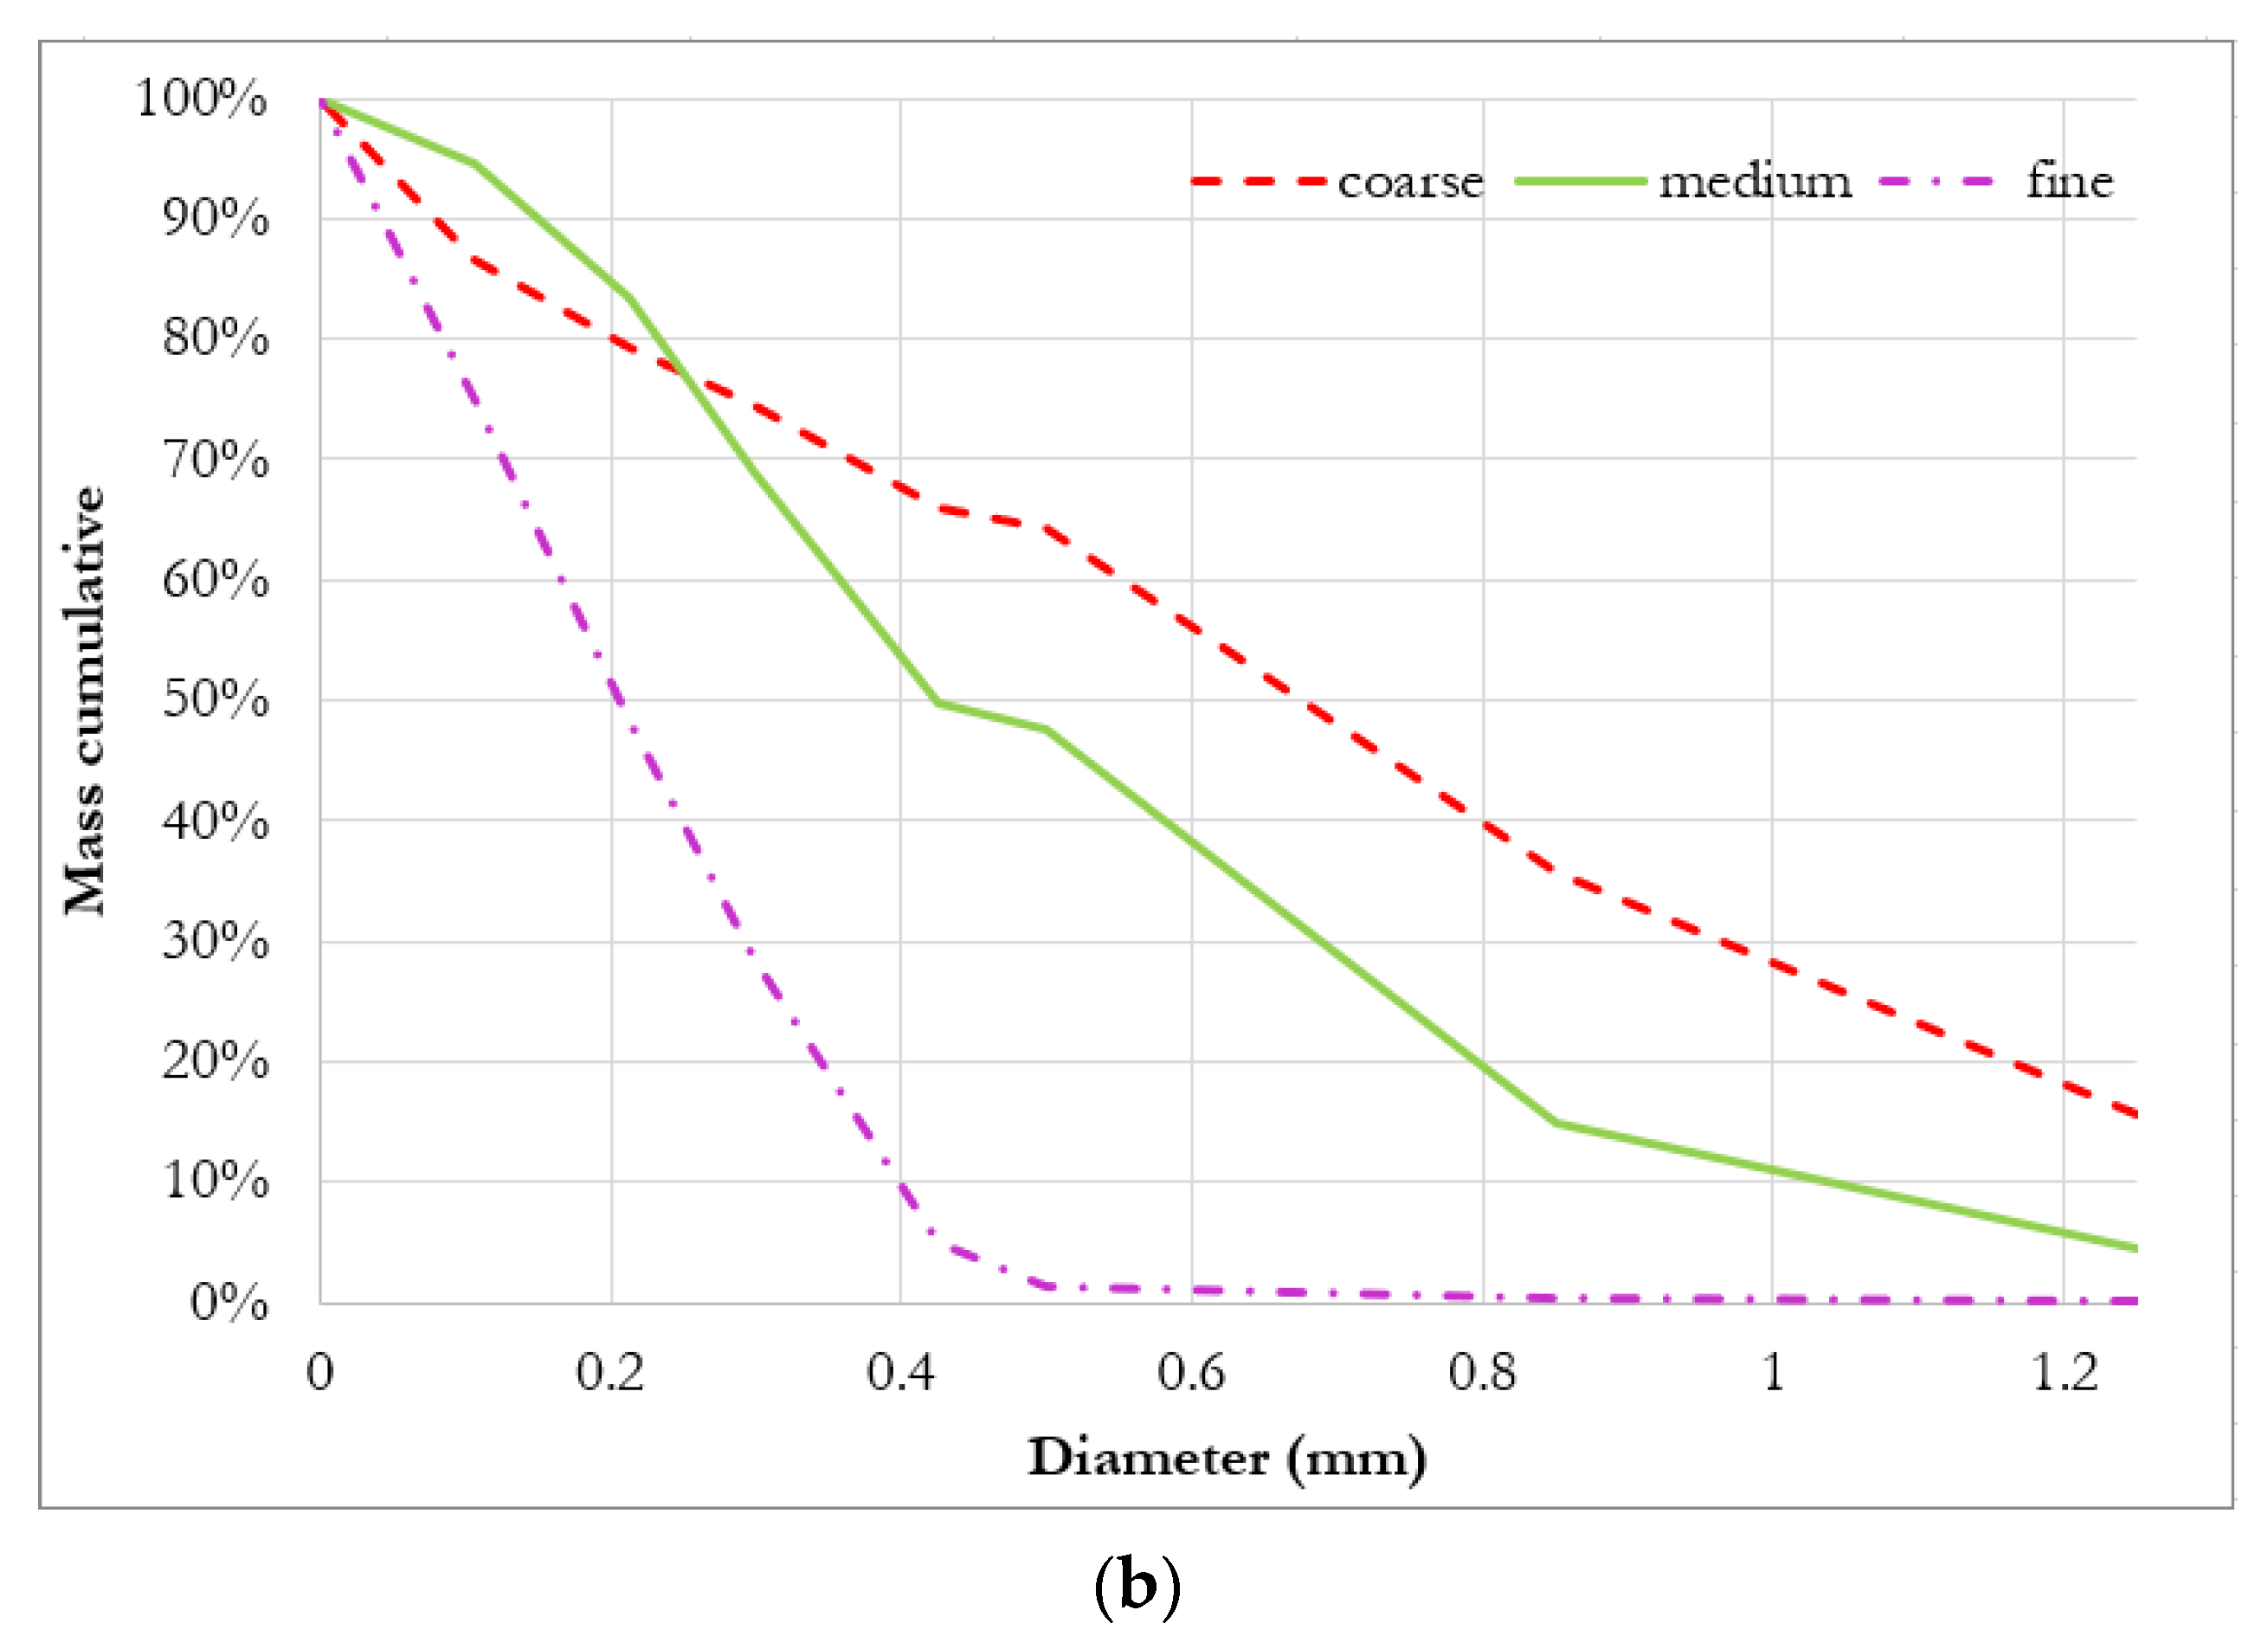
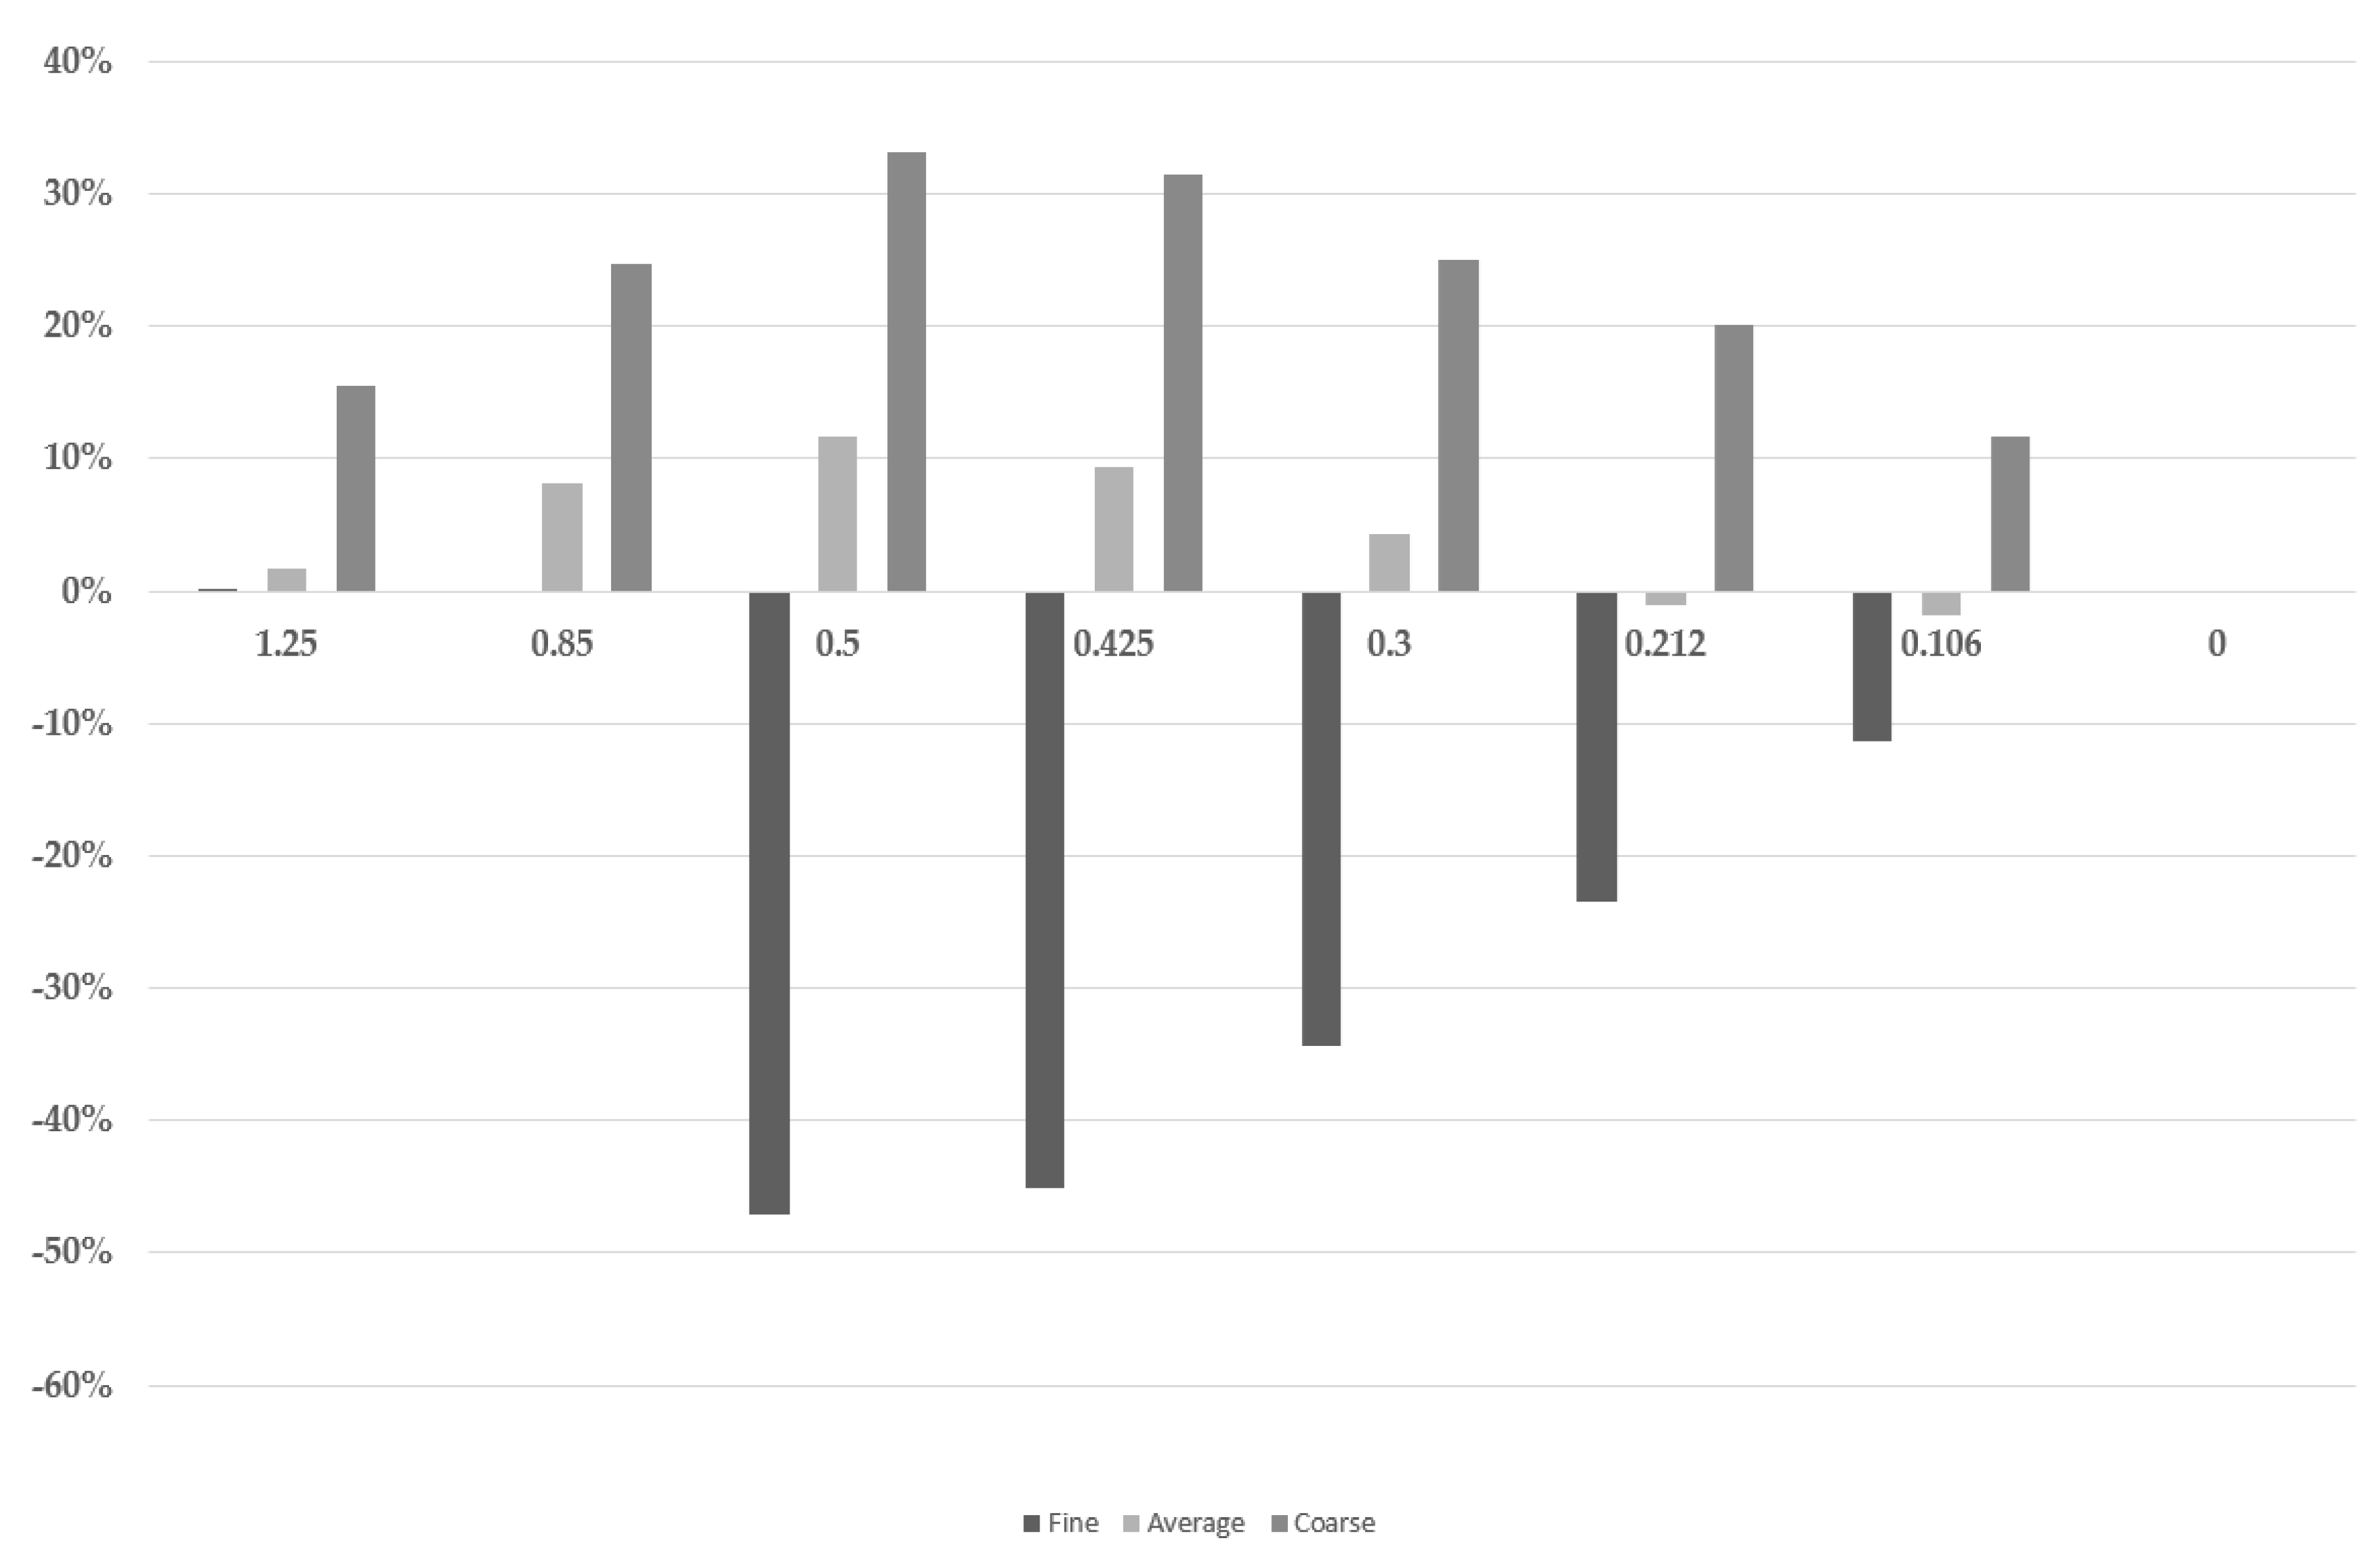
2.4. Granulometry
2.5. Velocity
2.6. Experimental Measurements
2.7. Computational Fluid Dynamics
3. Results and Discussion
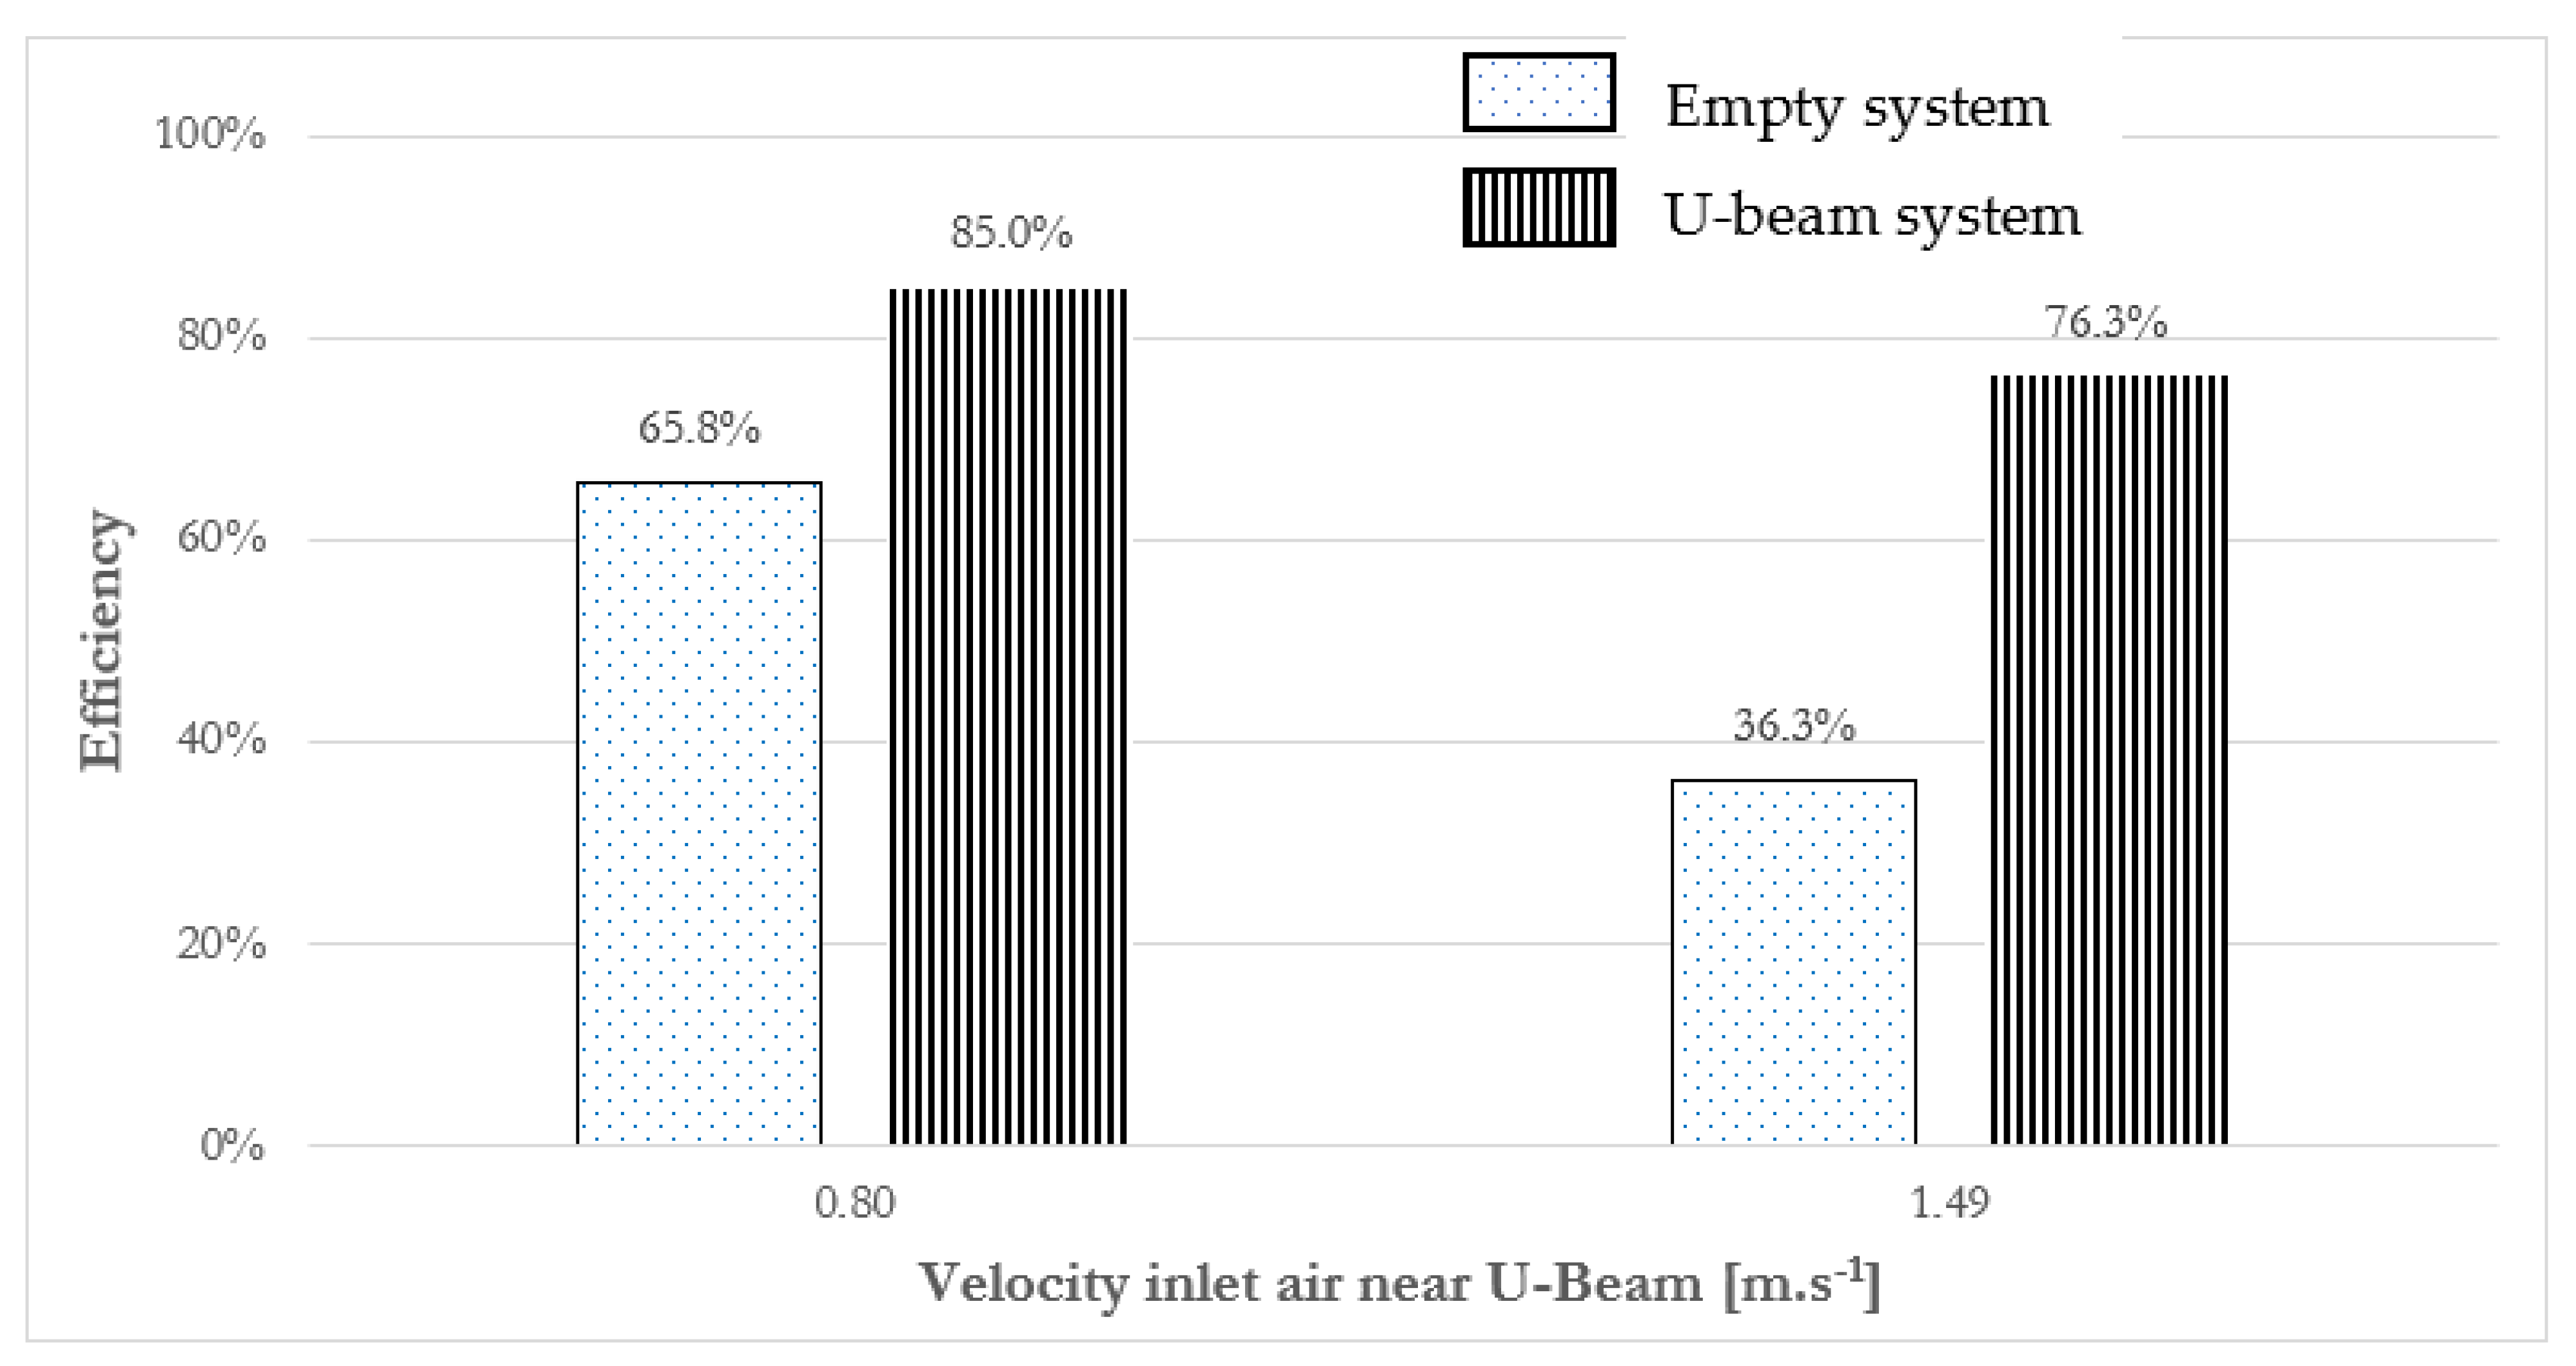
3.1. Effect of the Velocity
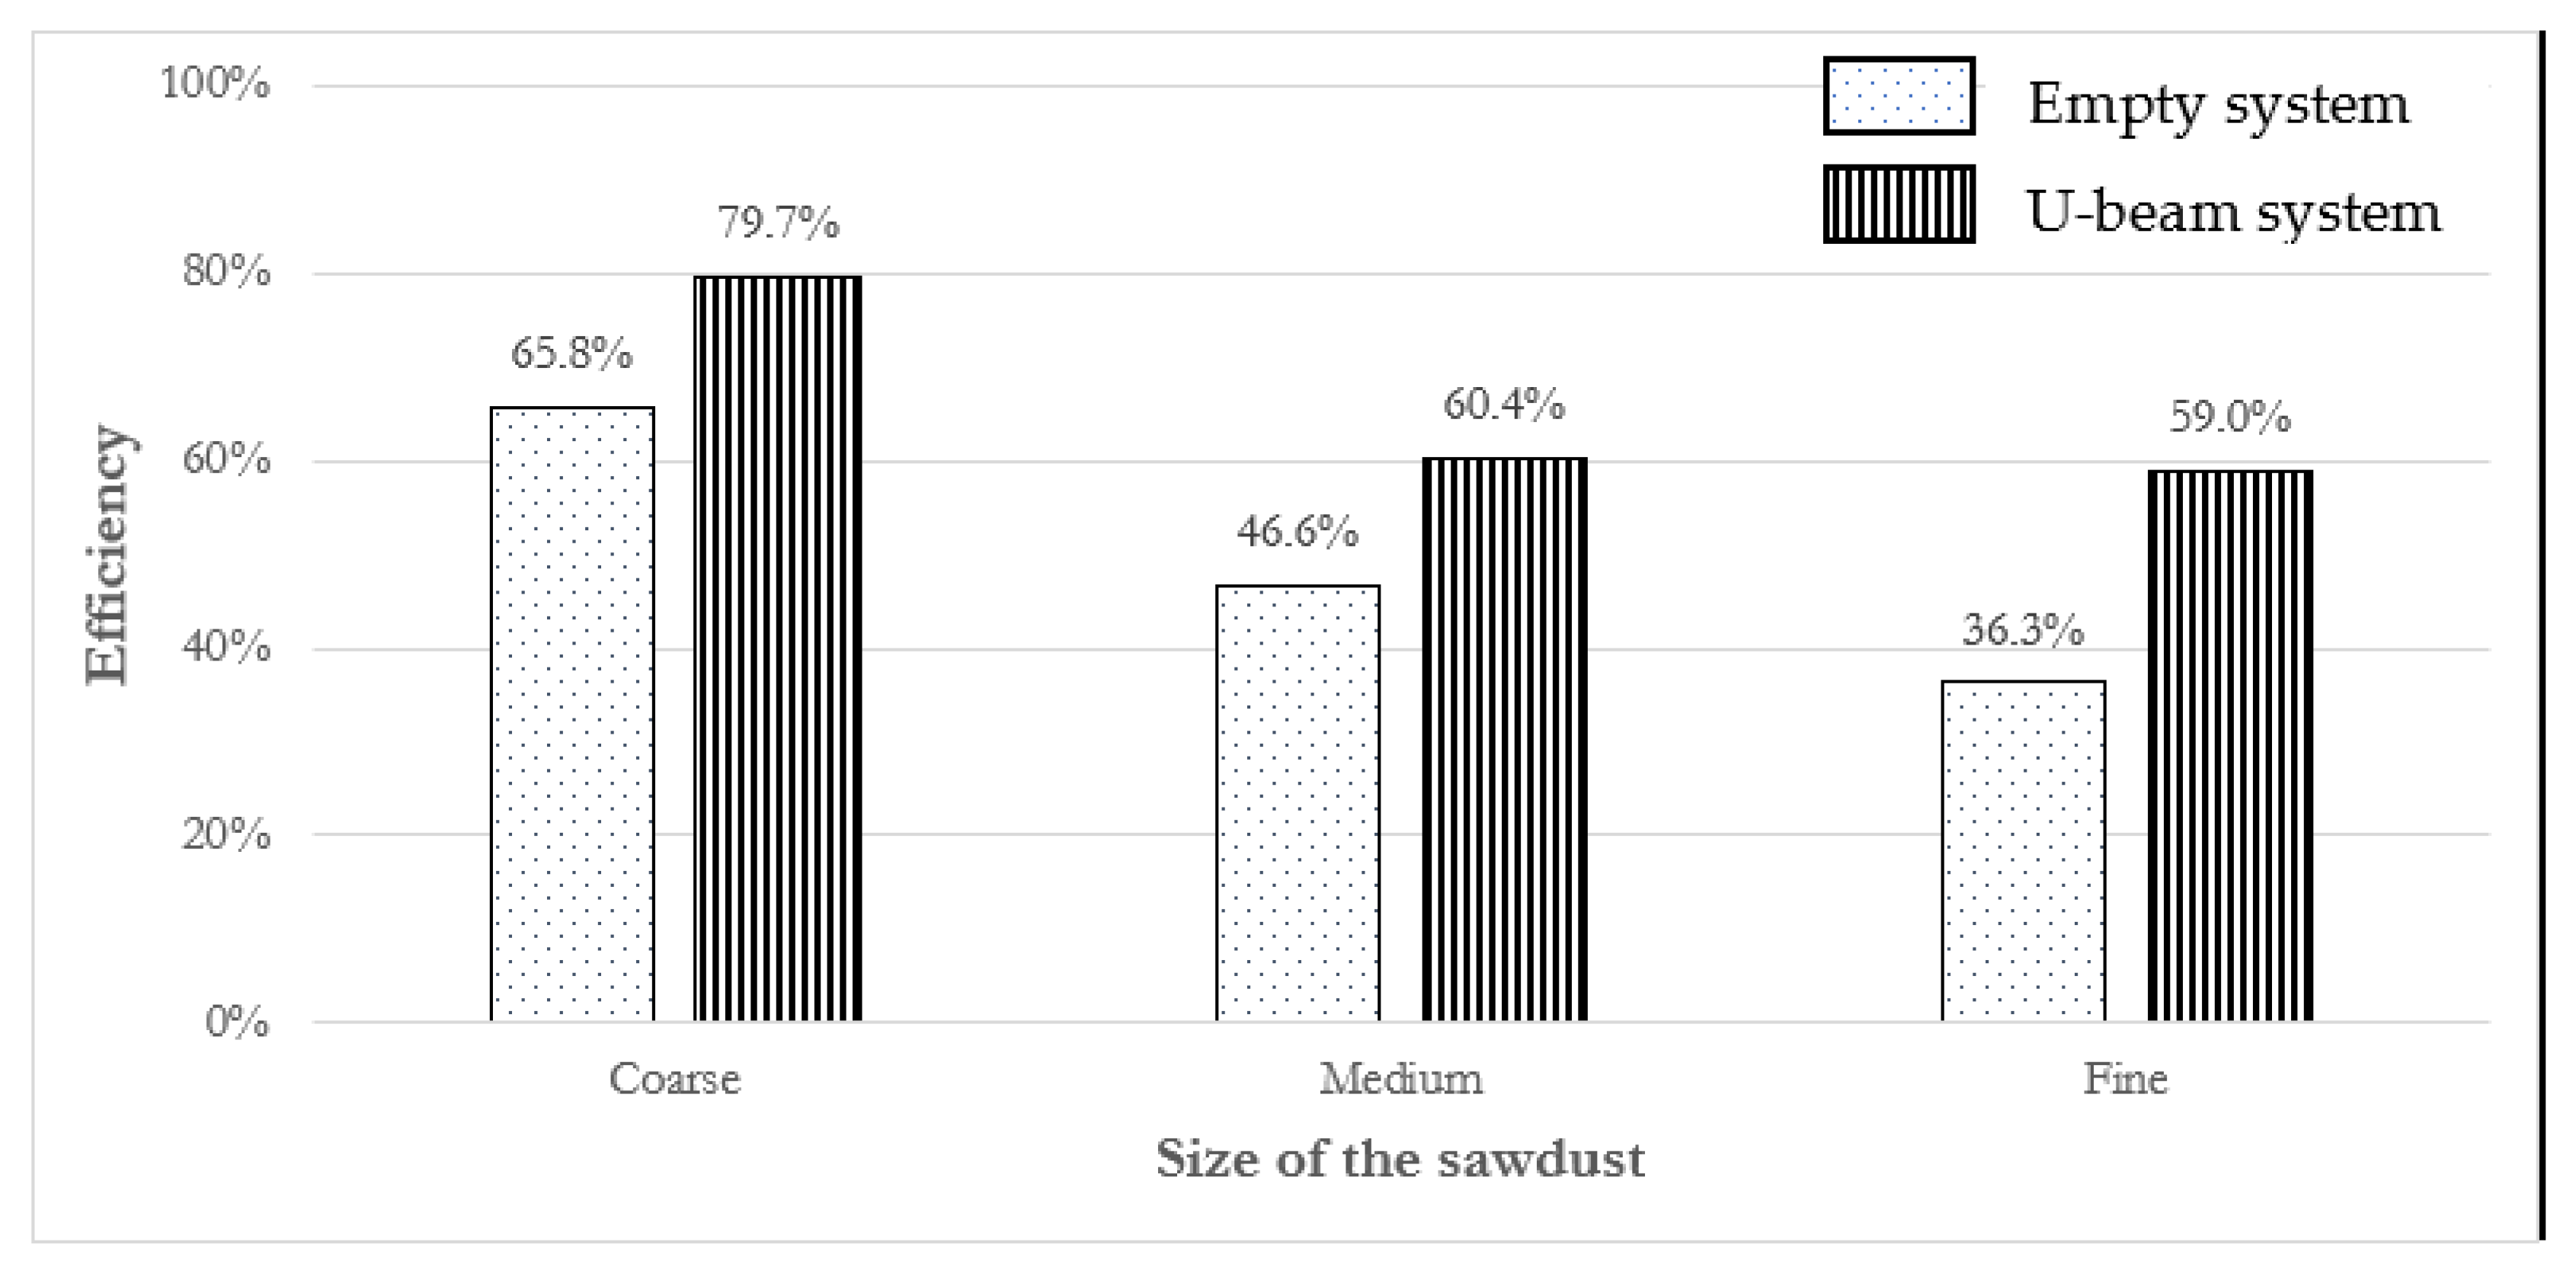
3.2. Effect of the Granulometry
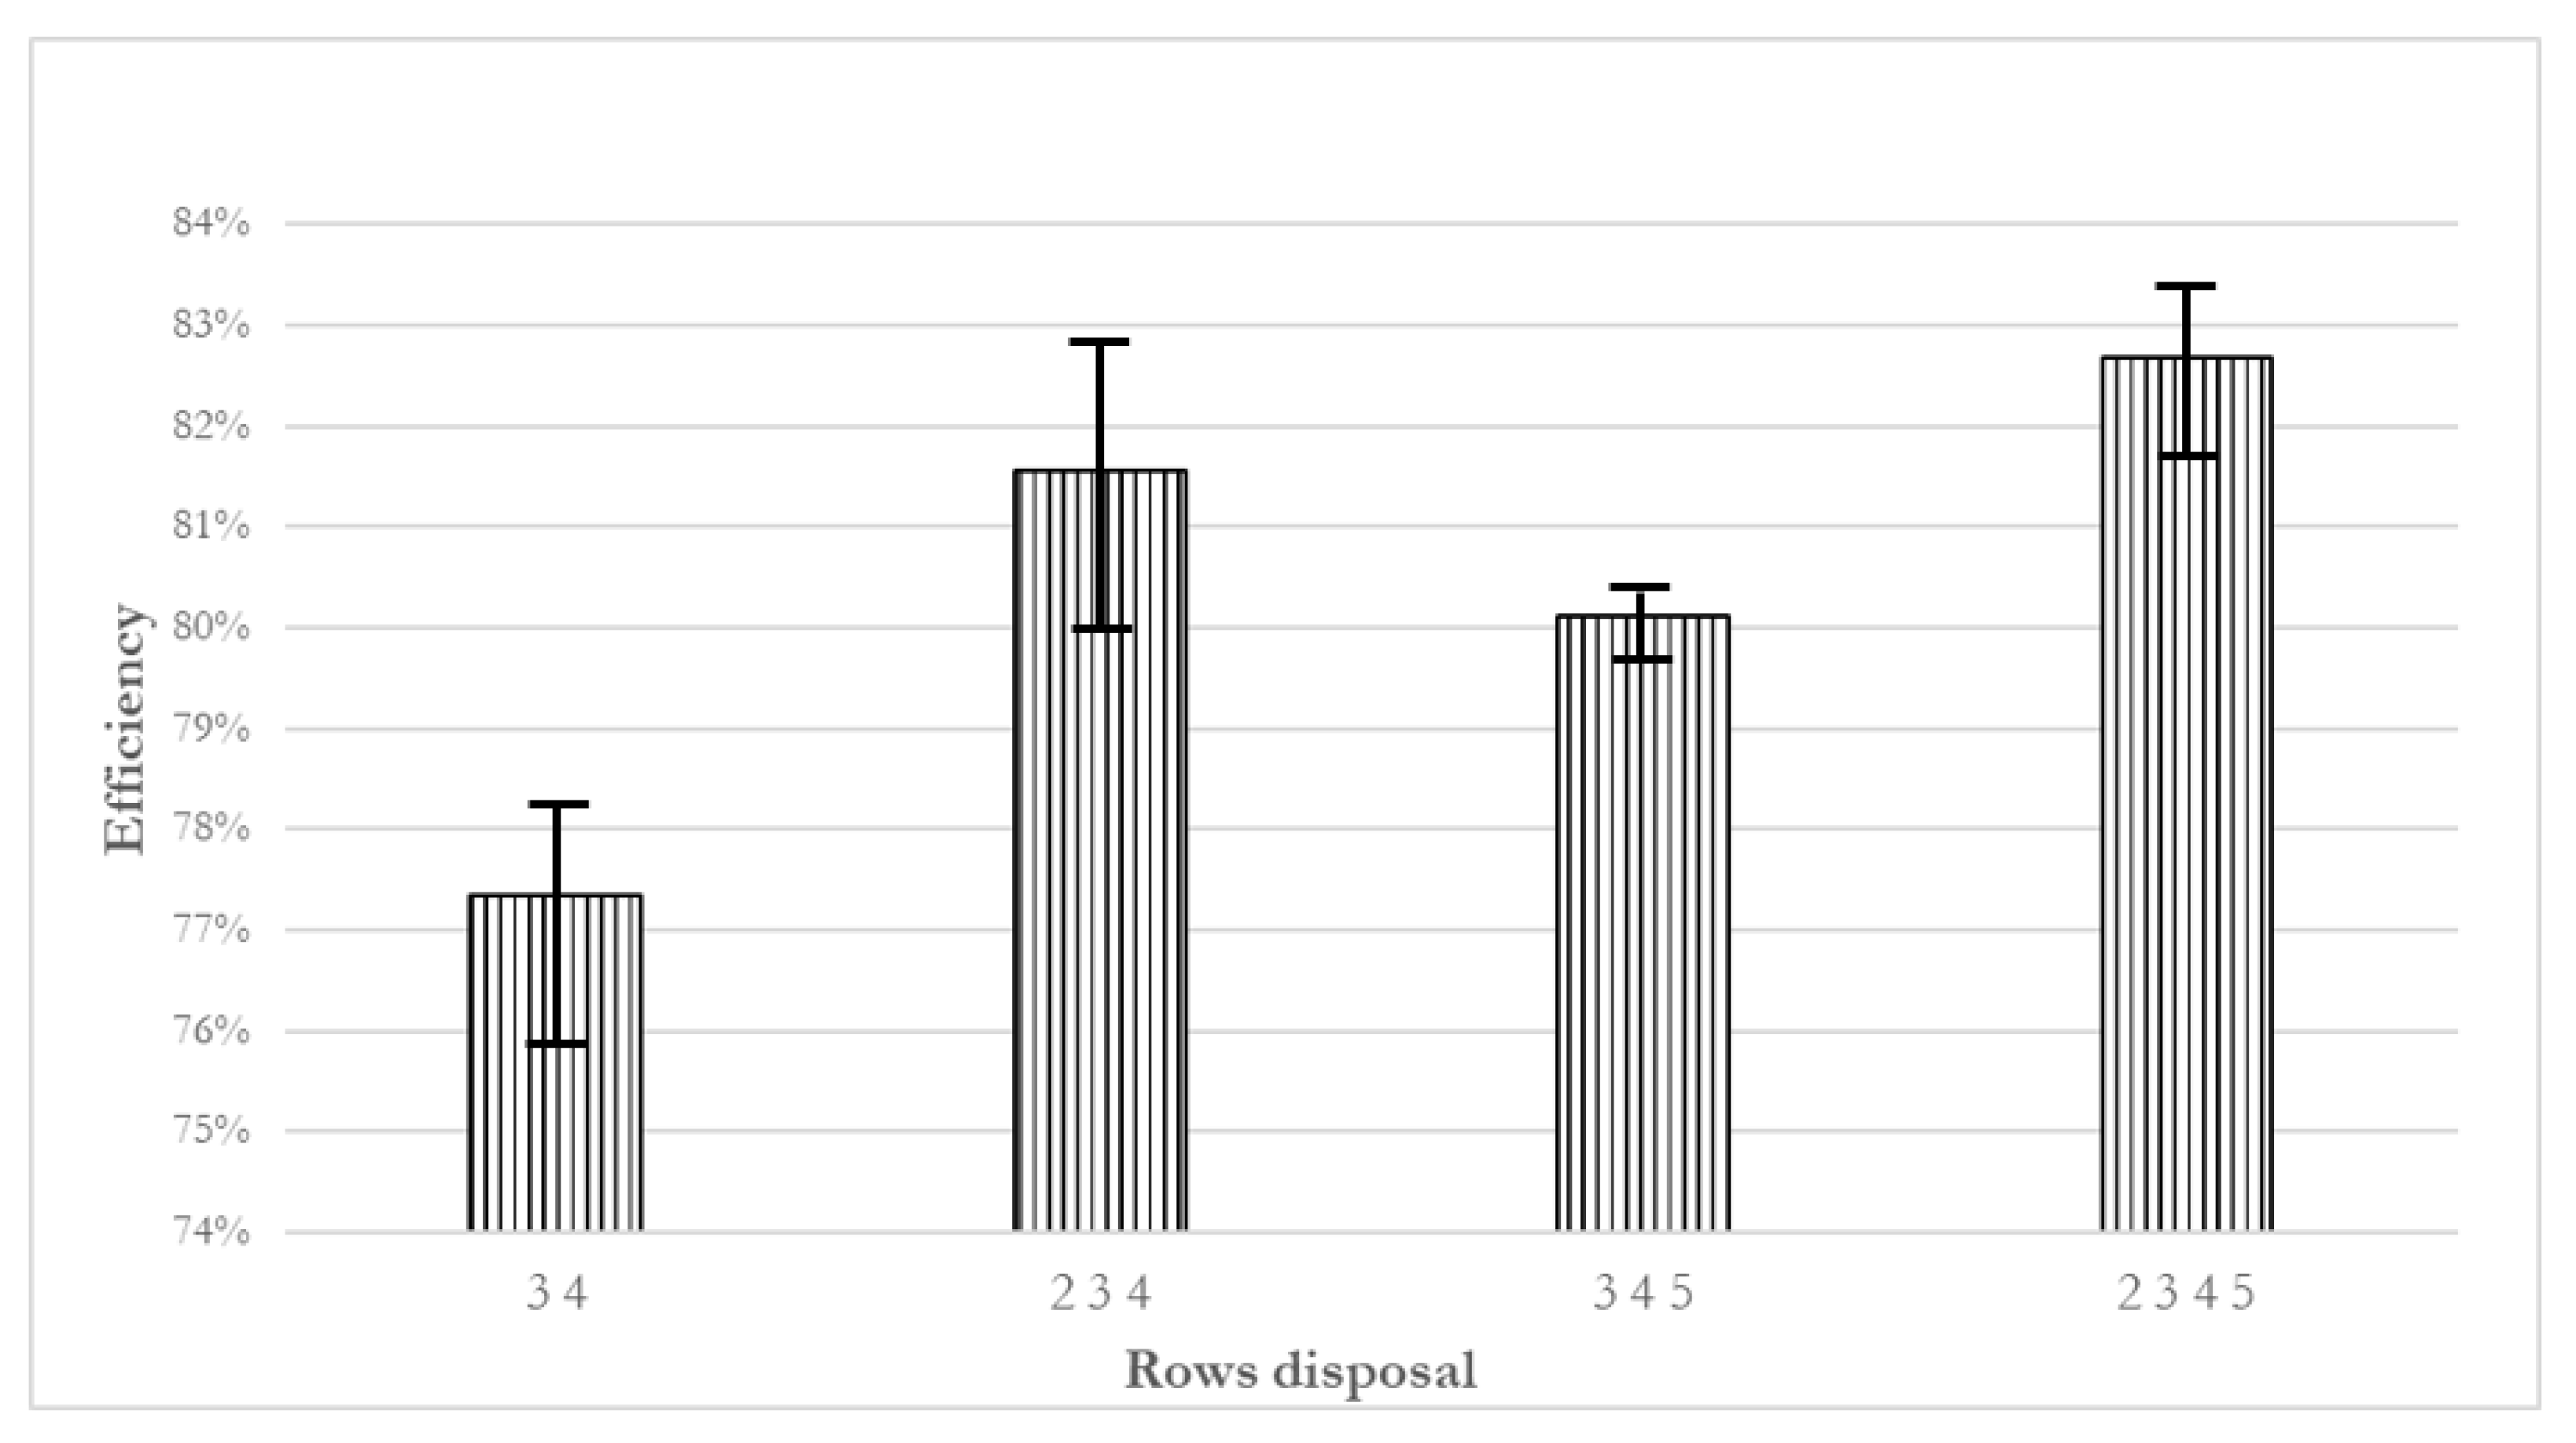
3.3. Effect of the Geometry of the Separator
3.4. Modeling Checking
4. Conclusions
- -
- A minimum of two rows (maximum four) covering the entire surface normal to the flow;
- -
- A space between two rows equal to one time of the width of the U-beam;
- -
- Attention given to sealing and optimizing the airflow;
- -
- The system of U-beams should be designed to limit particle flight and allow for easy removal to maintain the impactor system’s efficiency.
Author Contributions
Funding
Data Availability Statement
Conflicts of Interest
Nomenclature
| CFB | Circulating fluidized bed |
| D | Inner diameter (m)—9.4 × 10⁻² |
| IPCC | Intergovernmental Panel on Climate Change |
| Loss | the loss of sawdust mass collected |
| MDC | Mechanical dust collector |
| Initial mass of the feeding system for the sawdust (g) | |
| Final mass of the feeding system for the sawdust (g) | |
| Mass collected in the entire system (g) | |
| Mass collected in the bag (g) | |
| MWth | Thermal megawatt (MW) |
| RANS | Reynolds-Averaged Navier Stokes equations |
| Re | Reynolds number |
| RDF | Refuse-Derived Fuels |
| SRF | Solid Recovery Fuels |
| UPN | Steel beam in «U» shape conforming to the EN 10365 standard and EN 10279 for tolerances |
| V | Velocity of the air flow (m·s−1) |
| Greek letters | |
| Efficiency | |
| Density (kg·m−3) 1.204 for air at 20 °C under 1.013 × 10⁵ Pa | |
| Dynamic viscosity (kg·(m·s)−1 1.8 × 10⁻⁵ | |
References
- IPCC. Global Warming of 1.5 °C. 2022. Available online: https://www.ipcc.ch/sr15/ (accessed on 6 October 2022).
- Van Loo, S.; Kopperjan, J. The Handbook of Biomass Combustion & Co-Firing; Earthscan: London, UK, 2008. [Google Scholar] [CrossRef]
- Johansen, K. A Brief History of District Heating and Combined Heat and Power in Denmark: Promoting Energy Efficiency, Fuel Diversification, and Energy Flexibility. Energies 2022, 15, 9281. [Google Scholar] [CrossRef]
- Koornneef, J.; Junginger, M.; Faaij, A. Development of fluidized bed combustion—An overview of trends, performance and cost. Prog. Energy Combust. Sci. 2007, 33, 19–55. [Google Scholar] [CrossRef] [Green Version]
- Odzijewicz, I.J.; Wołejko, E.; Wydro, U.; Wasil, M.; Jabłońska-Trypuć, A. Utilization of Ashes from Biomass Combustion. Energies 2022, 15, 9653. [Google Scholar] [CrossRef]
- Boriouchkine, A.; Zakharov, A.; Jämsä-Jounela, S.-L. Dynamic modeling of combustion in a BioGrate furnace: The effect of operation parameters on biomass firing. Chem. Eng. Sci. 2012, 69, 669–678. [Google Scholar] [CrossRef] [Green Version]
- Bicocchi, S.; Boulinguez, M.; Diard, K. Les Polluants et Les Techniques D’épuration des Fumées; RECORD; Lavoisier: Paris, France, 2009; Available online: https://www.lavoisier.fr/livre/environnement/les-polluants-et-les-techniques-d-epuration-des-fumees-2-ed/bicocchi/descriptif-9782743011901 (accessed on 26 June 2023).
- Altmeyer, S.; Mathieu, V.; Jullermier, S.; Contral, P.; Midoux, N.; Rode, S.; Leclerc, J.P. Comparison of different models of cyclone prediction performance for various operating conditions using a general software. Chem. Eng. Process. Process Intensif. 2004, 43, 511–522. [Google Scholar] [CrossRef]
- Ganegama Bogodage, S.; Leung, A.Y.T. CFD simulation of cyclone separators to reduce air pollution. Powder Technol. 2015, 286, 488–506. [Google Scholar] [CrossRef]
- Alves, A.; Paiva, J.; Salcedo, R. Cyclone optimization including particle clustering. Powder Technol. 2015, 272, 14–22. [Google Scholar] [CrossRef] [Green Version]
- Wan, G.; Sun, G.; Xue, X.; Shi, M. Solids concentration simulation of different size particles in a cyclone separator. Powder Technol. 2008, 183, 94–104. [Google Scholar] [CrossRef]
- Szyszlak-Bargłowicz, J.; Wasilewski, J.; Zając, G.; Kuranc, A.; Koniuszy, A.; Hawrot-Paw, M. Evaluation of Particulate Matter (PM) Emissions from Combustion of Selected Types of Rapeseed Biofuels. Energies 2023, 16, 239. [Google Scholar] [CrossRef]
- Khan, A.A.; de Jong, W.; Jansens, P.J.; Spliethoff, H. Biomass combustion in fluidized bed boilers: Potential problems and remedies. Fuel Process Technol. 2009, 90, 21–50. [Google Scholar] [CrossRef]
- Kefa, C.; Li, X.; Li, Y.; Yan, J.; Shen, Y.; Liang, S.; Ni, M. Experimental study of a finned tubes impact gas-solid separator for CFB boilers. Chem. Eng. J. 1997, 66, 159–169. [Google Scholar] [CrossRef]
- Zhu, Q. Developments in Circulating Fluidised Bed Combustion. IEA Clean Coal Center. 2013. Available online: https://usea.org/sites/default/files/042013_Developments%20in%20circulating%20fluidised%20bed%20combustion_ccc219.pdf (accessed on 26 June 2023).
- Leckner, B. Hundred years of fluidization for the conversion of solid fuels. Powder Technol. 2022, 411, 117935. [Google Scholar] [CrossRef]
- Belin, F.; Walker, D.J. Impingement Type Solids Collector Discharge Restrictor. U.S. Patent 4,891,052, 2 January 1990. Available online: https://patents.google.com/patent/US4891052 (accessed on 26 June 2023).
- Belin, F.; James, D.E.; Walker, D.J. Internal Impact Type Particle Separator. U.S. Patent 4,992,085, 12 February 1991. Available online: https://patents.google.com/patent/US4992085A (accessed on 26 June 2023).
- Daum, E.D.; Rowley, D.R. Water/Steam-Cooled U-Beam Impact Type Particle Separator. U.S. Patent 5,435,820, 25 July 1995. Available online: https://patents.google.com/patent/US5435820 (accessed on 26 June 2023).
- James, D.E.; Walker, D.J.; Belin, F. Indirect Cooling of Primary Impact Type Solids Separator Elements in a CFB Reactor. U.S. Patent 5,809,940, 22 September 1998. Available online: https://patents.google.com/patent/US5809940 (accessed on 26 June 2023).
- Walker, D.J. Particulate Collector Channel with Cooling Inner Elements in a CFB Boiler. U.S. Patent 6322603B1, 27 November 2001. Available online: https://patents.google.com/patent/US6322603B1 (accessed on 26 June 2023).
- Maryamchik, M.; Alexander, C.K.; Belin, F.; Gibbs, D.R.; Walker, D.J.; Wietzke, D.L. CFB impact type particle collection elements attached to cooled supports. U.S. Patent 6454824B1, 24 September 2002. Available online: https://patents.google.com/patent/US6454824B1/en (accessed on 6 October 2002).
- Basu, P.; Fraser, S.A. Chapter 7—Gas-solid separators. In Circulating Fluidized Bed Boilers; Basu, P., Fraser, S.A., Eds.; Butterworth-Heinemann: Oxford, UK, 1991; pp. 201–228. [Google Scholar] [CrossRef]
- Belin, F.; Walker, J.D. Drainable Discharge Pan for Impact Type Particle Separator. U.S. Patent 5799593A, 1 September 1998. Available online: https://patents.google.com/patent/US5799593A/en (accessed on 6 October 2022).
- De, S.; Nag, P.K. Pressure drop and collection efficiency of cyclone and impact separators in a CFB. Int. J. Energy Res. 1999, 23, 51–60. [Google Scholar] [CrossRef]
- Basu, P. Combustion of coal in circulating fluidized-bed boilers: A review. Chem. Eng. Sci. 1999, 54, 5547–5557. [Google Scholar] [CrossRef]
- ADEME. Référentiels Combustibles Bois Energie de l’ADEME. Définition et Exigences. 2017. Available online: https://librairie.ademe.fr/energies-renouvelables-reseaux-et-stockage/1783-referentiels-combustibles-bois-energie-de-l-ademe.html (accessed on 2 December 2022).
- ADEME. Biomasse Energie et Produits Biosourcés. Recueil de Projets Soutenus Par l’ADEME Entre 2008 et 2015, 8744, 2016. Available online: https://librairie.ademe.fr/energies-renouvelables-reseaux-et-stockage/2321-biomasse-energie-et-produits-biosources-9791029703386.html (accessed on 6 October 2022).
- Anantharaman, A.; Cocco, R.A.; Chew, J.W. Evaluation of correlations for minimum fluidization velocity (Umf) in gas-solid fluidization. Powder Technol. 2018, 323, 454–485. [Google Scholar] [CrossRef]
- Wen-Ching, Y. Handbook of Fluidization and Fluid-Particle Systems; Marcel Dekker: New York, NY, USA, 2003. [Google Scholar] [CrossRef]
- Morris, J.D.; Daood, S.S.; Chilton, S.; Nimmo, W. Mechanisms and mitigation of agglomeration during fluidized bed combustion of biomass: A review. Fuel 2018, 230, 452–473. [Google Scholar] [CrossRef]
- Anicic, B.; Lin, W.; Dam-Johansen, K.; Wu, H. Agglomeration mechanism in biomass fluidized bed combustion—Reaction between potassium carbonate and silica sand. Fuel Process. Technol. 2018, 173, 182–190. [Google Scholar] [CrossRef] [Green Version]
- Aubry, R.; Préau, S.; Martin, G.; Brenot, P.; Chobaut, J.-P.; Rogaume, Y. Projet POLYBIOM. 2018. Available online: https://icar-cm2t.com/wp-content/uploads/2020/11/Synthese-POLYBIOM-dossier-Ademe.pdf (accessed on 11 October 2022).
- Winaya, N.S.; Basu, P.; Reddy, B.V. Experimental investigations on heat transfer from suspension to impact separators in the riser column of a circulating fluidized bed combustor. Int. J. Heat Mass Transf. 2003, 46, 71–75. [Google Scholar] [CrossRef]
- Adamczyk, W.P.; Kozolub, P.; Kruczek, G.; Pilorz, M.; Klimanek, A.; Czakiert, T.; Wecel, G. Numerical approach for modeling particle transport phenomena in a closed loop of a circulating fluidized bed. Particuology 2016, 29, 69–79. [Google Scholar] [CrossRef]
- Wischnewski, R.; Ratschow, L.; Hartge, E.-U.; Werther, J. Reactive gas–solids flows in large volumes—3D modeling of industrial circulating fluidized bed combustors. Particuology 2010, 8, 67–77. [Google Scholar] [CrossRef]
- Shah, S.; Myöhänen, K.; Kallio, S.; Hyppänen, T. CFD simulations of gas–solid flow in an industrial-scale circulating fluidized bed furnace using subgrid-scale drag models. Particuology 2015, 18, 66–75. [Google Scholar] [CrossRef]
- Baskakov, A.P.; Mudrechenko, A.V.; Bubenchikov, A.M.; Starchenko, A.V.; Gogolev, A.F.; Markovich, D.M. Modeling of U-beam separator. Powder Technol. 2000, 107, 84–92. [Google Scholar] [CrossRef]
- Zevenhoven-Onderwater, M. Ash-Forming Matter in Biomass Fuels. Ph.D. Thesis, Faculty of Engineering, Process Chemestry Group Abo Akademi, Turku, Finland, 2001. Available online: http://users.abo.fi/mzevenho/portfolj/publikationer/PhD%20MZ.pdf (accessed on 26 June 2023).
- Obernberger, I.; Brunner, T.; Jöller, M. Characterisation and formation of aerosols and fly-ashes from fixed bed biomass combustion. In Proceedings of the IEA-Seminar Aerosols from Biomass Combustion, Zurich, Switzerland, 27 June 2001; pp. 66–74. [Google Scholar]
- Promtong, M.; Phirommark, P.; Suvanjumrat, C.; Chookaew, W.; Uapipatanakul, S. A CFD Study of Particle Flows (PM1, PM10, PM100) in Lowvolume Impact Separator. Geomate J. 2022, 22, 53–61. [Google Scholar] [CrossRef]
- Hamelin, J.P.M.; Basu, P.; Hamdullahpur, F. A study into the operation of an impact-type gas–solid separator. Int. J. Energy Res. 2004, 28, 1023–1032. [Google Scholar] [CrossRef]
- Song, C.; Pei, B.; Jiang, M.; Wang, B.; Xu, D.; Chen, Y. Numerical analysis of forces exerted on particles in cyclone separators. Powder Technol. 2016, 294, 437–448. [Google Scholar] [CrossRef]


| D (mm) | Re | ||||
|---|---|---|---|---|---|
| Test 1 | 1.204 | 18.48 | 94 | 1.8 × 10⁻⁵ | |
| Test 2 | 1.204 | 94 | 1.8 × 10⁻⁵ |
| Velocity | m·s−1 | 0.77 | 0.76 | 0.74 | 0.79 | 0.79 | 0.80 |
| Mass_coll_i | g | 591.47 | 578.25 | 693.52 | 632.3 | 614.29 | 690.93 |
| Ratio Mass_coll_i/Mass_feed | % | 69.4% | 66.6% | 76.0% | 79.3% | 84.0% | 80.4% |
| Mass_bag | g | 275.54 | 240.25 | 187.31 | 143.61 | 102.17 | 121.54 |
| Ratio Mass_bag/Mass_feed | % | 32.3% | 27.7% | 20.5% | 18.0% | 14.0% | 14.1% |
| Loss | g | 15.01 | 49.5 | 31.17 | 21.09 | 14.54 | 46.53 |
| Ratio Loss/Mass_feed | % | 1.76% | 5.70% | 3.42% | 2.65% | 1.99% | 5.42% |
| U-Beam configuration | None | None | 1 row | 1 row | 2 rows | 2 rows | |
| Sawdust | medium | medium | medium | medium | medium | medium | |
| Velocity | m·s−1 | 0.81 | 0.81 | 0.80 | 0.81 | 0.82 | 1.54 |
| Mass_feed | g | 915 | 938 | 553 | 593 | 590 | 643 |
| Mass_coll_i | g | 748.22 | 757.57 | 432.68 | 420.41 | 422.33 | 241.82 |
| Ratio Mass_coll_i/Mass_feed | % | 81.8% | 80.8% | 78.2% | 70.9% | 71.6% | 37.6% |
| Mass_bag | g | 146.98 | 152.78 | 119.68 | 145.61 | 219.11 | 424.09 |
| Ratio Mass_bag/Mass_feed | % | 16.1% | 16.3% | 21.6% | 24.6% | 37.1% | 66.0% |
| Loss | g | 19.8 | 27.65 | 0.64 | 26.98 | 51.44 | 22.91 |
| Ratio Loss/Mass_feed | % | 2.16% | 2.95% | 0.12% | 4.55% | 8.72% | 3.56% |
| U-Beam configuration | 2 rows | 2 rows | 2 rows | 2 rows | None | None | |
| Sawdust | medium | medium | medium | medium | medium | medium | |
| Velocity | m·s−1 | 1.54 | 1.49 | 1.44 | 1.57 | 1.41 | 1.50 |
| Mass_feed | g | 701 | 548 | 733 | 743 | 742 | 415 |
| Mass_coll_i | g | 336.07 | 351.44 | 418.37 | 408.62 | 412.34 | 198.36 |
| Ratio Mass_coll_i/Mass_feed | % | 47.9% | 64.1% | 57.1% | 55.0% | 55.6% | 47.8% |
| Mass_bag | g | 350.44 | 232.68 | 274.62 | 284.13 | 299.77 | 206.72 |
| Ratio Mass_bag/Mass_feed | % | 50.0% | 42.5% | 37.5% | 38.2% | 40.4% | 49.8% |
| Loss | g | 14.49 | 36.12 | 40.01 | 50.25 | 29.89 | 9.92 |
| Ratio Loss/Mass_feed | % | 2.07% | 6.59% | 5.46% | 6.76% | 4.03% | 2.39% |
| U-Beam configuration | 3 rows | 3 rows | 3 rows | 3 rows | 3 rows | 3 rows | |
| Sawdust | medium | medium | medium | fine | fine | fine | |
| Velocity | m·s−1 | 1.43 | 1.44 | 1.51 | 1.39 | 1.45 | 1.34 |
| Mass_feed | g | 393.4 | 438 | 860 | 840 | 931 | 849 |
| Mass_coll_i | g | 178.45 | 214.56 | 487.05 | 539.24 | 580.4 | 694.86 |
| Ratio Mass_coll_i/Mass_feed | % | 45.4% | 49.0% | 56.6% | 64.2% | 62.3% | 81.8% |
| Mass_bag | g | 204.55 | 213.26 | 323.63 | 340.63 | 301.23 | 137.7 |
| Ratio Mass_bag/Mass_feed | % | 52.0% | 48.7% | 37.6% | 40.6% | 32.4% | 16.2% |
| Loss | g | 10.4 | 10.18 | 49.32 | 39.87 | 49.37 | 16.44 |
| Ratio Loss/Mass_feed | % | 2.64% | 2.32% | 5.73% | 4.75% | 5.30% | 1.94% |
| U-Beam configuration | None | 3 rows | 3 rows | None | None | 3 rows | |
| Sawdust | fine | fine | fine | coarse | coarse | coarse | |
| Velocity | m·s−1 | 1.51 | 1.51 | 1.50 | 1.49 | 1.58 | 1.59 |
| Mass_feed | g | 933 | 910 | 932 | 922 | 898 | 967 |
| Mass_coll_i | g | 699.88 | 707.95 | 687.61 | 683.58 | 675.064 | 756.53 |
| Ratio Mass_coll_i/Mass_feed | % | 75.0% | 77.8% | 73.8% | 74.1% | 75.2% | 78.2% |
| Mass_bag | g | 173.16 | 176.34 | 189.53 | 212.29 | 198.71 | 209.22 |
| Ratio Mass_bag/Mass_feed | % | 18.6% | 19.4% | 20.3% | 23.0% | 22.1% | 21.6% |
| Loss | g | 59.96 | 25.71 | 54.86 | 26.13 | 24.226 | 1.25 |
| Ratio Loss/Mass_feed | % | 6.43% | 2.83% | 5.89% | 2.83% | 2.70% | 0.13% |
| U-Beam configuration | 3 rows | 3 rows | 2 rows | 2 rows | 4 rows | 4 rows | |
| Sawdust | coarse | coarse | coarse | coarse | coarse | coarse |
Disclaimer/Publisher’s Note: The statements, opinions and data contained in all publications are solely those of the individual author(s) and contributor(s) and not of MDPI and/or the editor(s). MDPI and/or the editor(s) disclaim responsibility for any injury to people or property resulting from any ideas, methods, instructions or products referred to in the content. |
© 2023 by the authors. Licensee MDPI, Basel, Switzerland. This article is an open access article distributed under the terms and conditions of the Creative Commons Attribution (CC BY) license (https://creativecommons.org/licenses/by/4.0/).
Share and Cite
Aubry, R.; Debal, M.; Aubert, S.; Rogaume, Y. Experimental Study on U-Beam Separator Device for Separating Solids from Gases. Energies 2023, 16, 4975. https://doi.org/10.3390/en16134975
Aubry R, Debal M, Aubert S, Rogaume Y. Experimental Study on U-Beam Separator Device for Separating Solids from Gases. Energies. 2023; 16(13):4975. https://doi.org/10.3390/en16134975
Chicago/Turabian StyleAubry, Rémy, Matthieu Debal, Stéphane Aubert, and Yann Rogaume. 2023. "Experimental Study on U-Beam Separator Device for Separating Solids from Gases" Energies 16, no. 13: 4975. https://doi.org/10.3390/en16134975