Article

Experimental Investigation on the Relationship between Biot’s Coefficient and Hydrostatic Stress for Enhanced Oil Recovery Projects

by
Mohammad Ahmad Mahmoudi Zamani
and
Dariusz Knez
*
Department of Drilling and Geoengineering, Faculty of Drilling, Oil and Gas, AGH University of Krakow, 30-059 Krakow, Poland
*
Author to whom correspondence should be addressed.
Energies 2023, 16(13), 4999; https://doi.org/10.3390/en16134999
Submission received: 7 April 2023 / Revised: 2 June 2023 / Accepted: 13 June 2023 / Published: 27 June 2023
(This article belongs to the Special Issue Advances in Petroleum Exploration and Production)

Abstract

:
The majority of global conventional oil reservoirs have been dramatically depleted during the last few decades. To increase the oil production rate, enhanced oil recovery (EOR) techniques are commonly utilized. The ratio of the recovered oil volume to the rock volume change is defined as Biot’s coefficient. During the EOR operations, Biot’s coefficient continuously changes due to the fluid injection and oil production; however, so far, only porosity-dependent or constant values of Biot’s coefficient have been incorporated in the EOR calculations, which is not valid since the role of external stress changes is overlooked. In this research, the Biot’s coefficient of a sandstone formation was measured through the acoustic wave propagation technique. A stress-dependent equation of Biot’s coefficient was achieved for application in the EOR calculations. The findings illustrated that Biot’s coefficient decreases logarithmically with the hydrostatic stress. Moreover, the Biot’s coefficient varied from 0.52 to 0.60 for an applied hydrostatic stress of 3.50 MPa to 21 MPa. Furthermore, it was found that there was no anisotropy of Biot’s coefficient in the sandstone formations. The extracted empirical correlation can be utilized for EOR projects in which the recovered oil volume is of paramount importance economically.

1. Introduction

Many geo-engineering projects deal with the rocks containing different pore fluids such as oil, CO2, water, etc. [1,2]. For instance, oil exploitation from subsurface reservoirs, water extraction from aquifers, and CO2 storage in exhausted reservoirs are typical examples of such engineering applications. In all these cases, the hydro-mechanical interaction between the pore fluid and the hosting rocks influences the success of the project [1].
In common oilfields, the rate of oil production usually falls several years after the beginning of the exploitation phase [3]. To improve the oil mobility in the depleted reservoirs, EOR operations are designed so that a higher volume of the residual oil is extracted [4]. Figure 1 depicts a typical schematic of an EOR operation in which an artificial solution (fluid) such as water, CO2, polymer, etc., is injected into the depleted oil reservoir. Through this technique, the pore pressure of the residual oil increases, thereby leading to the mobilization of the oil from the injection well towards the production well.
An EOR operation may lead to additional exploitation of 30% to 60% of the oil reservoir [5]; however, the recovered oil volume can be very changeable as it depends on different parameters such as the characteristics (chemical, physical, and rheological) of the injected solutions, in situ stress regime, and the poroelastic parameters of the reservoir. The poroelastic parameters have a significant influence on the oil mobilization efficiency and the total recovered oil volume. Moreover, those parameters control the deformation of the reservoir formation [6] and the stability of the injection and production wellbores [7].
The effect of poroelastic parameters on the hydro-mechanical behavior of porous rocks was initially studied by Maurice Anthony Biot who established the poroelasticity theory [8]. Before this theory, the classic elasticity theory was not capable of explaining many phenomena related to the interaction between the pore fluids and rocks [1]. The main poroelastic parameters are the Biot’s coefficient, Poisson’s ratio, shear modulus, bulk modulus, storage coefficient, and Skempton’s coefficient [1]. Amongst these parameters, Biot’s coefficient is the most important parameter.
When a saturated rock sample is subjected to an external stress, the pore fluid together with the solid structure of the sample bear the external stress. As the external stress increases, the volume of pore fluid (water/oil) released from the pores builds up. Hence, gradually, the influence of pore fluid as a resistive feature of the rock declines. Biot, in 1941 [8], formulated the effect of the pore fluid via incorporating a new parameter, Biot’s coefficient, in the effective stress law which was already established by Terzaghi [9]. Biot modified the effective stress law as [1]:
σ = σ α P p
where σ (Pa) indicates the effective stress, σ (Pa) shows the total stress, α demonstrates the dimensionless Biot’s coefficient, and P p (Pa) represents the pore pressure.
During EOR operations, the Biot’s coefficient of the depleted reservoir changes since the fluid injection and oil production disturb the hydro-mechanical equilibrium of the reservoir. Prediction of the recovered oil volume requires complicated 2D or 3D numerical simulations in which a coupled hydro-mechanical approach is implemented [10]. Such an approach becomes further complicated if the thermal properties of the reservoir are also incorporated into the simulations (thermo-hydro-mechanical coupling). Since laboratory measurements of Biot’s coefficient need expensive apparatuses and time-consuming tests, two simplifications may made by the reservoir engineers. The first simplification is that the Biot’s coefficient is assumed to be 1 which is not true for rocks. The second simplification is that the Biot’s coefficient is considered a constant value, which is not true since the Biot’s coefficient changes with the injection- and production-induced stresses. In the following paragraph, two recent studies in which Biot’s coefficient was incorporated in the EOR numerical simulations are elaborated.
Wang et al. (2021) performed a coupled thermo-hydro-mechanical numerical simulation to evaluate the production of a CO2-EOR project [11]. To do this, a broad spectrum of physical, poroelastic, and thermal properties were assigned to the numerical model. Moreover, a suitable mathematical formulation was established, and the poroelastic governing equations were accurately specified to the model. Although some conclusions pertinent to the production of the CO2-EOR project were made, the Biot’s coefficient was assumed to be 1 which was not correct at all [1]. In fact, the value of Biot’s coefficient is equal to 1 only for common soils while oil reservoirs include common sedimentary rocks such as sandstone, limestone, etc. In another study, Lu et al. (2020) conducted a coupled hydro-mechanical analysis to investigate the influence of refracturing treatment on the EOR efficiency [12]. In the refracturing treatment technique, the reservoir fractures are reoriented to improve the oil production rate. Through this technique, the in situ stress state around the fractures is redistributed, thereby leading to the mobilization of the trapped oil [13,14]. Lu et al. studied both the mechanical and poroelastic effects on the fracture reorientation. The poroelastic effect was mathematically formulated by establishment of the following relationship [12]:
p o r e = σ H m a x σ h m i n α ( 1 2 ν ) 1 ν P R i P w f
where p o r e represents the dimensionless poroelastic stress reorientation number, σ H m a x (Pa) indicates the maximum horizontal stress, and σ h m i n (Pa) demonstrates the minimum horizontal stress. Furthermore, α represents the Biot’s coefficient, ν indicates the Poisson’s ratio, P R i (Pa) indicates the initial pressure in the reservoir, and P w f (Pa) demonstrates the bottom-hole pressure. Finally, the authors calculated the total recovered oil volume as a function of different angles of the reoriented fractures. Furthermore, it was concluded that as the p o r e decreases, the refracturing treatment technique becomes more efficient.
Recent investigations have reported that Biot’s coefficient can be affected by the anisotropy of rock permeability, especially for shale formations. Fakcharoenphol et al. (2012) performed a numerical simulation to evaluate the waterflooding efficiency in Bakken shale reservoirs [15]. The Biot’s coefficient of the shale formation was assumed to be 0.8. Although the value of 0.8 was acceptable for the shale formation, the laboratory experiments performed by He et al. (2016) showed that the Biot’s coefficient of Bakken shale formations is not consistent in different directions [16]. In fact, the specimens captured vertically from the horizontal shale formation exhibited lower values of Biot’s coefficient than those captured parallel to the horizontal direction. Such a difference was attributed to the anisotropy of shale permeability. In another study, for a number of sandstone samples, Nowakowski (2021) investigated the effect of the rate of change in the confining pressure on the Biot’s coefficient [17]. It was reported that the Biot’s coefficient was sensitive to the rate of change in the confining pressure. As the rate of loading increased, the value of Biot’s coefficient declined.
In this study, the primary objective was to measure the Biot’s coefficient for a sandstone formation using an acoustic wave propagation apparatus. To do this, firstly, a piece of rock was captured from the Świętokrzyskie mine located near Kielce city in Poland. Then, several samples were taken and were prepared in the laboratory to conduct the acoustic wave propagation tests. Afterward, all specimens were completely saturated with water. In the next step, the experiments were performed under two conditions: undrained and drained. Through recording the time flight of the propagated compressional and shear waves in the rock specimens, the values of the corresponding velocities were calculated. Then, using the available relationships between the acoustic wave velocities and the rock elastic moduli, the rock bulk modulus was calculated in both drained and undrained conditions. In the final stage, an empirical correlation was extracted between the Biot’s coefficient and hydrostatic stress. Moreover, the values of Biot’s coefficient obtained from this research were compared with some existing porosity-dependent Biot’s coefficient correlations. Apart from the EOR projects, the obtained empirical correlation can be utilized in other fluid–rock interaction engineering applications such as aquifer characterization [18], land subsidence [19], etc.

2. Materials and Methods

2.1. Biot’s Coefficient Theory

The parameter of Biot’s coefficient describes the relationship between the change in pore fluid volume and the change in the rock bulk volume when a hydrostatic stress is applied to the rock specimen. It is defined through the underlying relationship [1]:
α = V f V P p = 0
where α represents the Biot’s coefficient, V f (m3) is the pore fluid volume change, V (m3) indicates the sample volume change, and P p (Pa) is the pore fluid pressure. Note that P p = 0 means that the test is performed when no change occurs in the pore pressure. In other words, the experiment must be conducted under drained conditions [20]. Generally, the parameter of α lies in the range of ϕ < α 1 ; and the parameter ϕ represents the rock porosity [21,22]. For soils, α is equal to 1. Regarding common sandstone rocks, Biot’s coefficient commonly lies in the range of 0.5–0.8 [23,24].
In addition to using Equation (3), α can also be experimentally measured using the Skempton’s coefficient, and drained and undrained bulk moduli. The pertinent relationship is [25,26]:
α = 1 K d r / K u n / B
where K d r (Pa) manifests the rock bulk modulus under the drained condition, K u n (Pa) is the rock bulk modulus under the undrained condition, and B is the dimensionless Skempton’s coefficient. Skempton’s coefficient relates the pore fluid pressure change to the hydrostatic stress change under the undrained condition [25]. B is calculated as [27]:
B = P p P m f = 0
where B is Skempton’s coefficient, P p (Pa) indicates the pore fluid pressure change, and P (Pa) represents the hydrostatic stress change. The parameter of m f (kg) is the mass of the pore fluid. Note that m f = 0 indicates the consistency of the pore fluid mass during the test. Therefore, no pore fluid is allowed to be released from the rock specimen. Generally, for common soils, the Skempton’s coefficient is equal to 1 [25]. For common rocks, the value of Skempton’s coefficient depends on the applied hydrostatic stress. Typically, when the hydrostatic stress increases, Skempton’s coefficient gradually declines.
Knez and Zamani reported that if the values of hydrostatic stress are approximately less than 50% of the rock unconfined compressive strength (UCS), the Skempton’s coefficient remains almost between 0.95 and 1 [23]. Hence, in this case, in Equation (4), B can be relatively assumed to be 1.

2.2. UCS Measurement Procedure

To perform the experiments, initially, a uniformly homogeneous piece of sandstone rock was transferred from the field to the laboratory. Afterward, twelve cylindrical samples were prepared. Then, the samples were divided into two groups: the first group included five samples for conducting the UCS measurement tests; the second group included seven samples for conducting the acoustic wave propagation experiments. Both groups are shown in Figure 2.
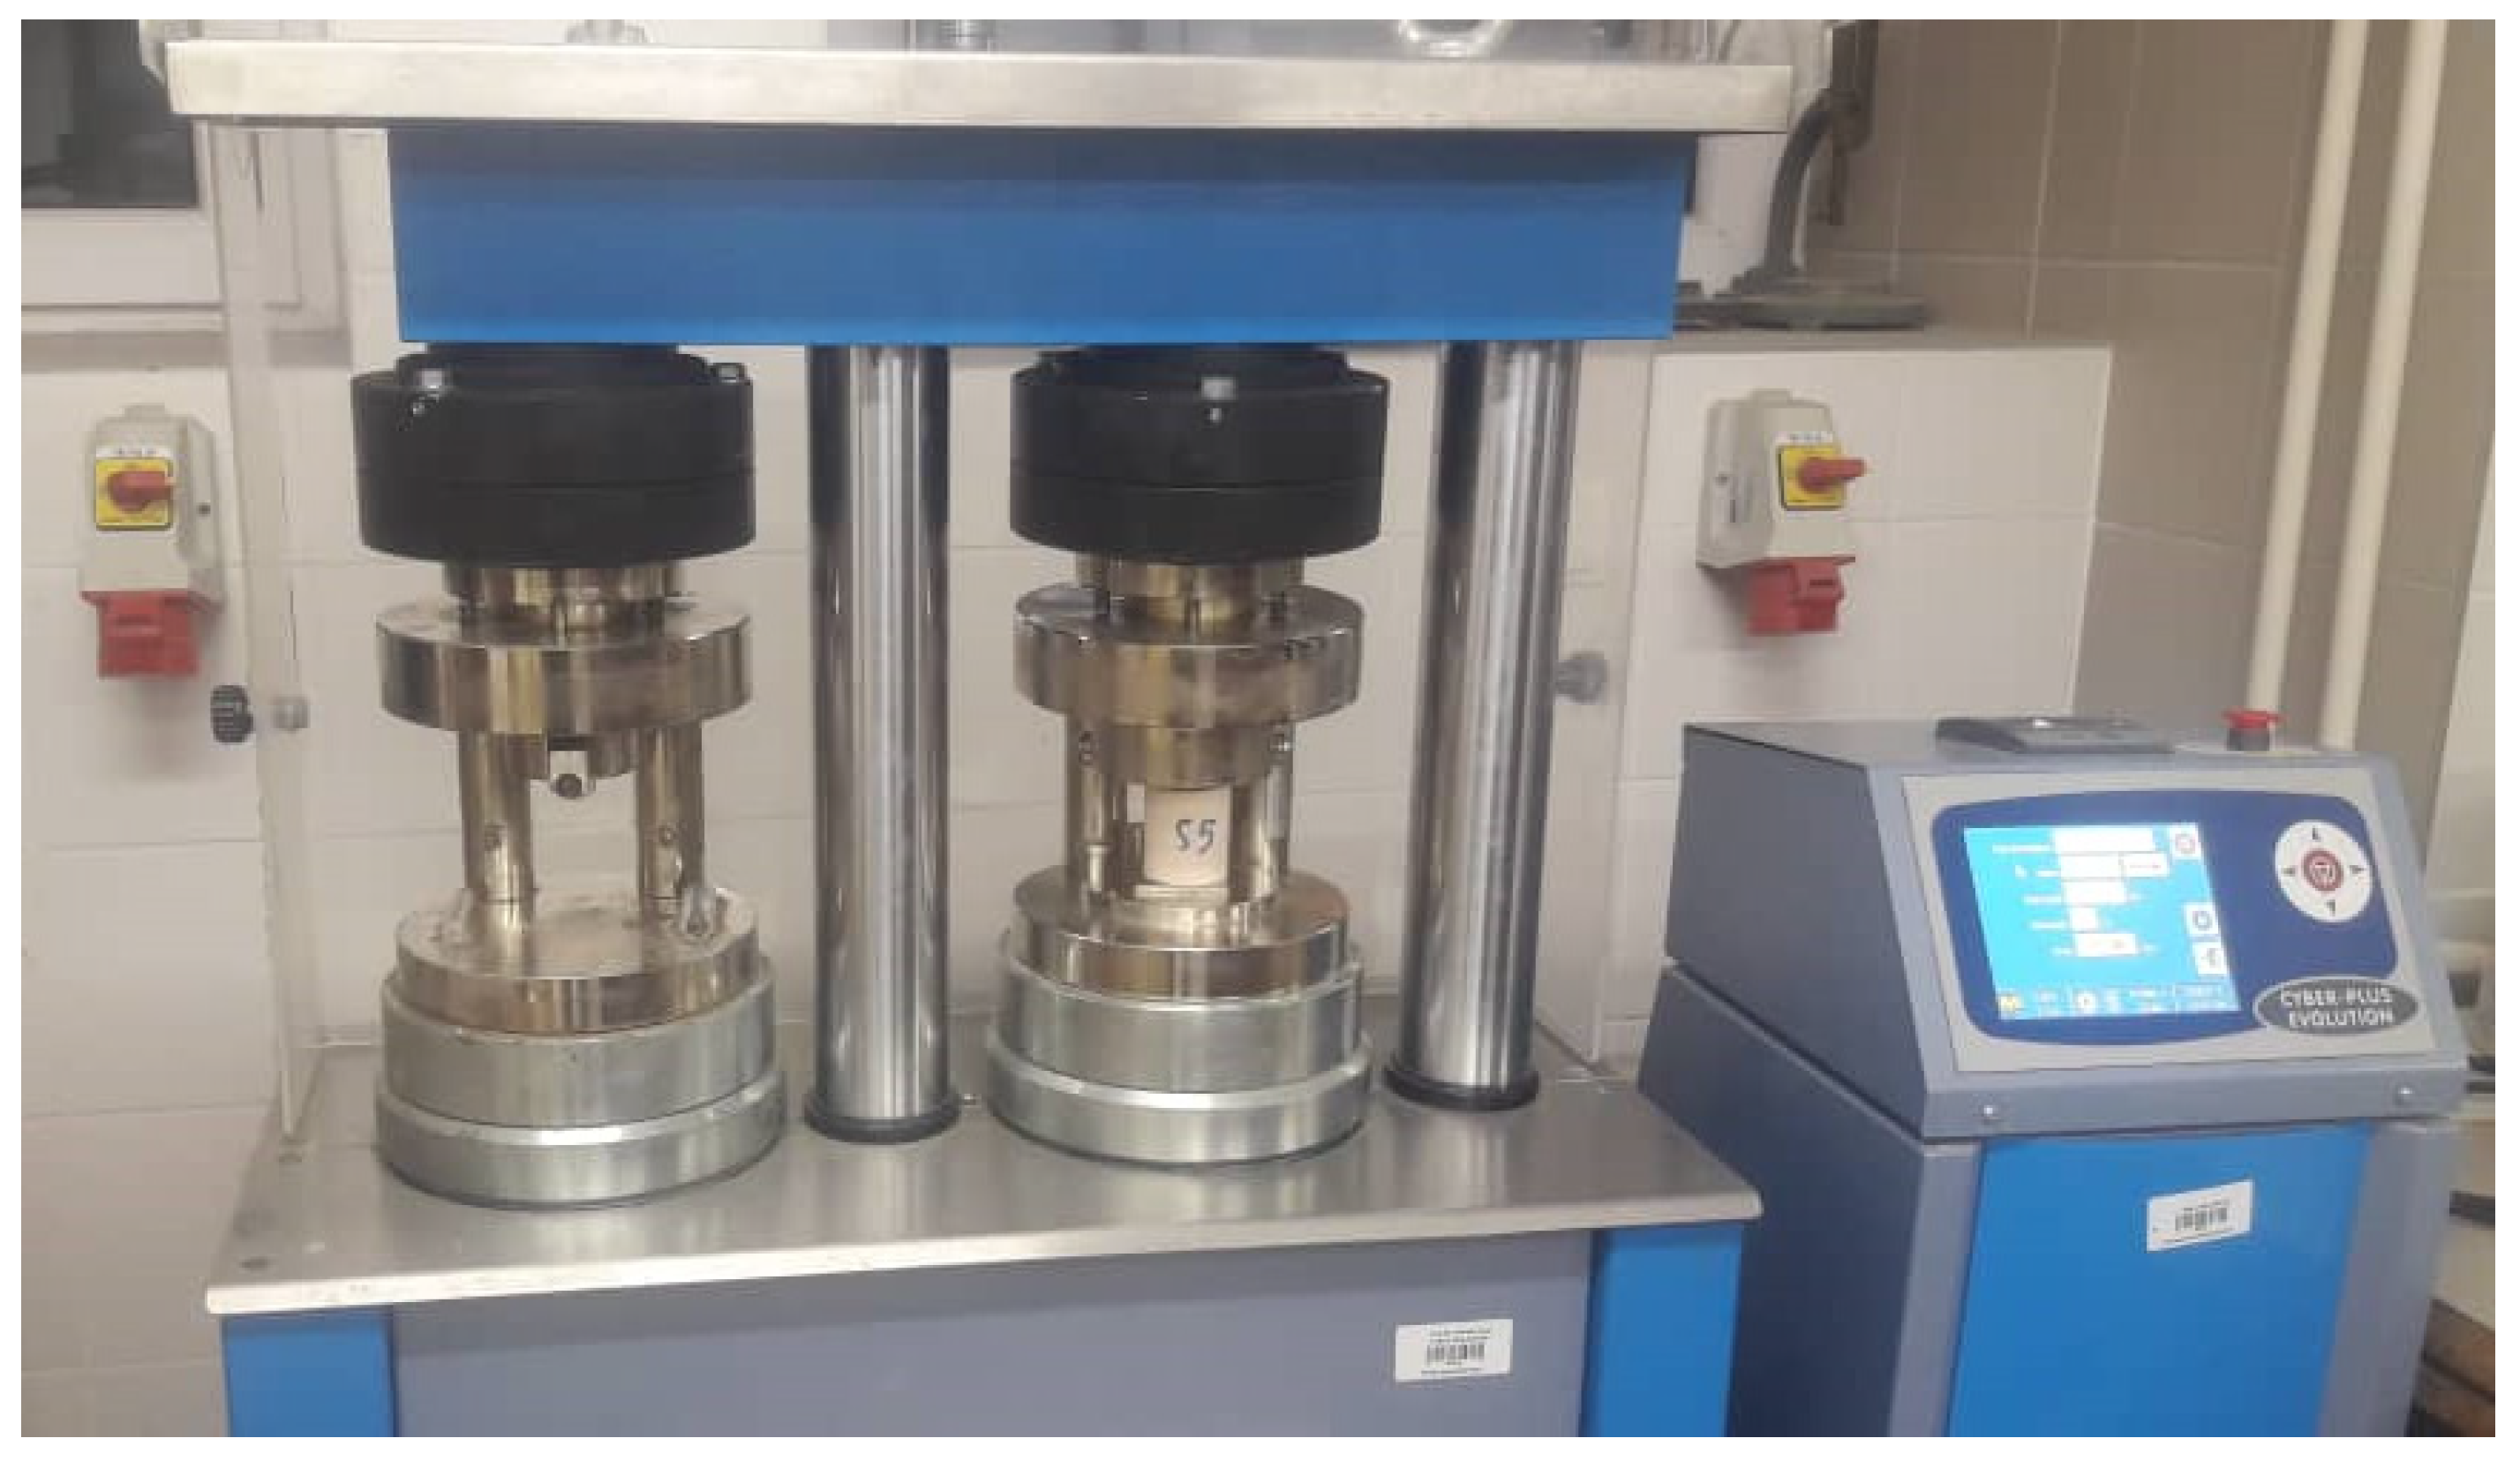
The UCS of the first group was measured using a UCS measurement apparatus (shown in Figure 3). The apparatus was manufactured by the Italian company MATEST (Arcore, Italy). The apparatus model was E181N with the load measuring system of Servo-Plus Evolution. Moreover, the machine was equipped with two load chambers. The applied load on the rock samples was measured by two strain gauge load cells. The experiments were conducted on the samples with a ratio of length to diameter equal to 2:1.
The physical properties and UCS values of the first group are tabulated in Table 1. Based on this table, the average UCS of the specimens was equal to 42 MPa.
On the other side, the second group included seven samples prepared for the acoustic propagation tests. These samples were initially saturated with water, and then, their physical properties were measured. Table 2 demonstrates the physical characteristics of those samples. As can be seen, the average density and porosity of the samples were equal to 2520 kg/m3 and 15.66%, respectively. Moreover, the values of the standard deviation of the density and porosity were 30.70 kg/m3 and 0.45%, respectively. Porosity has a significant influence on the mechanical behavior of rocks and soils [28].

2.3. Acoustic Wave Propagation Procedure

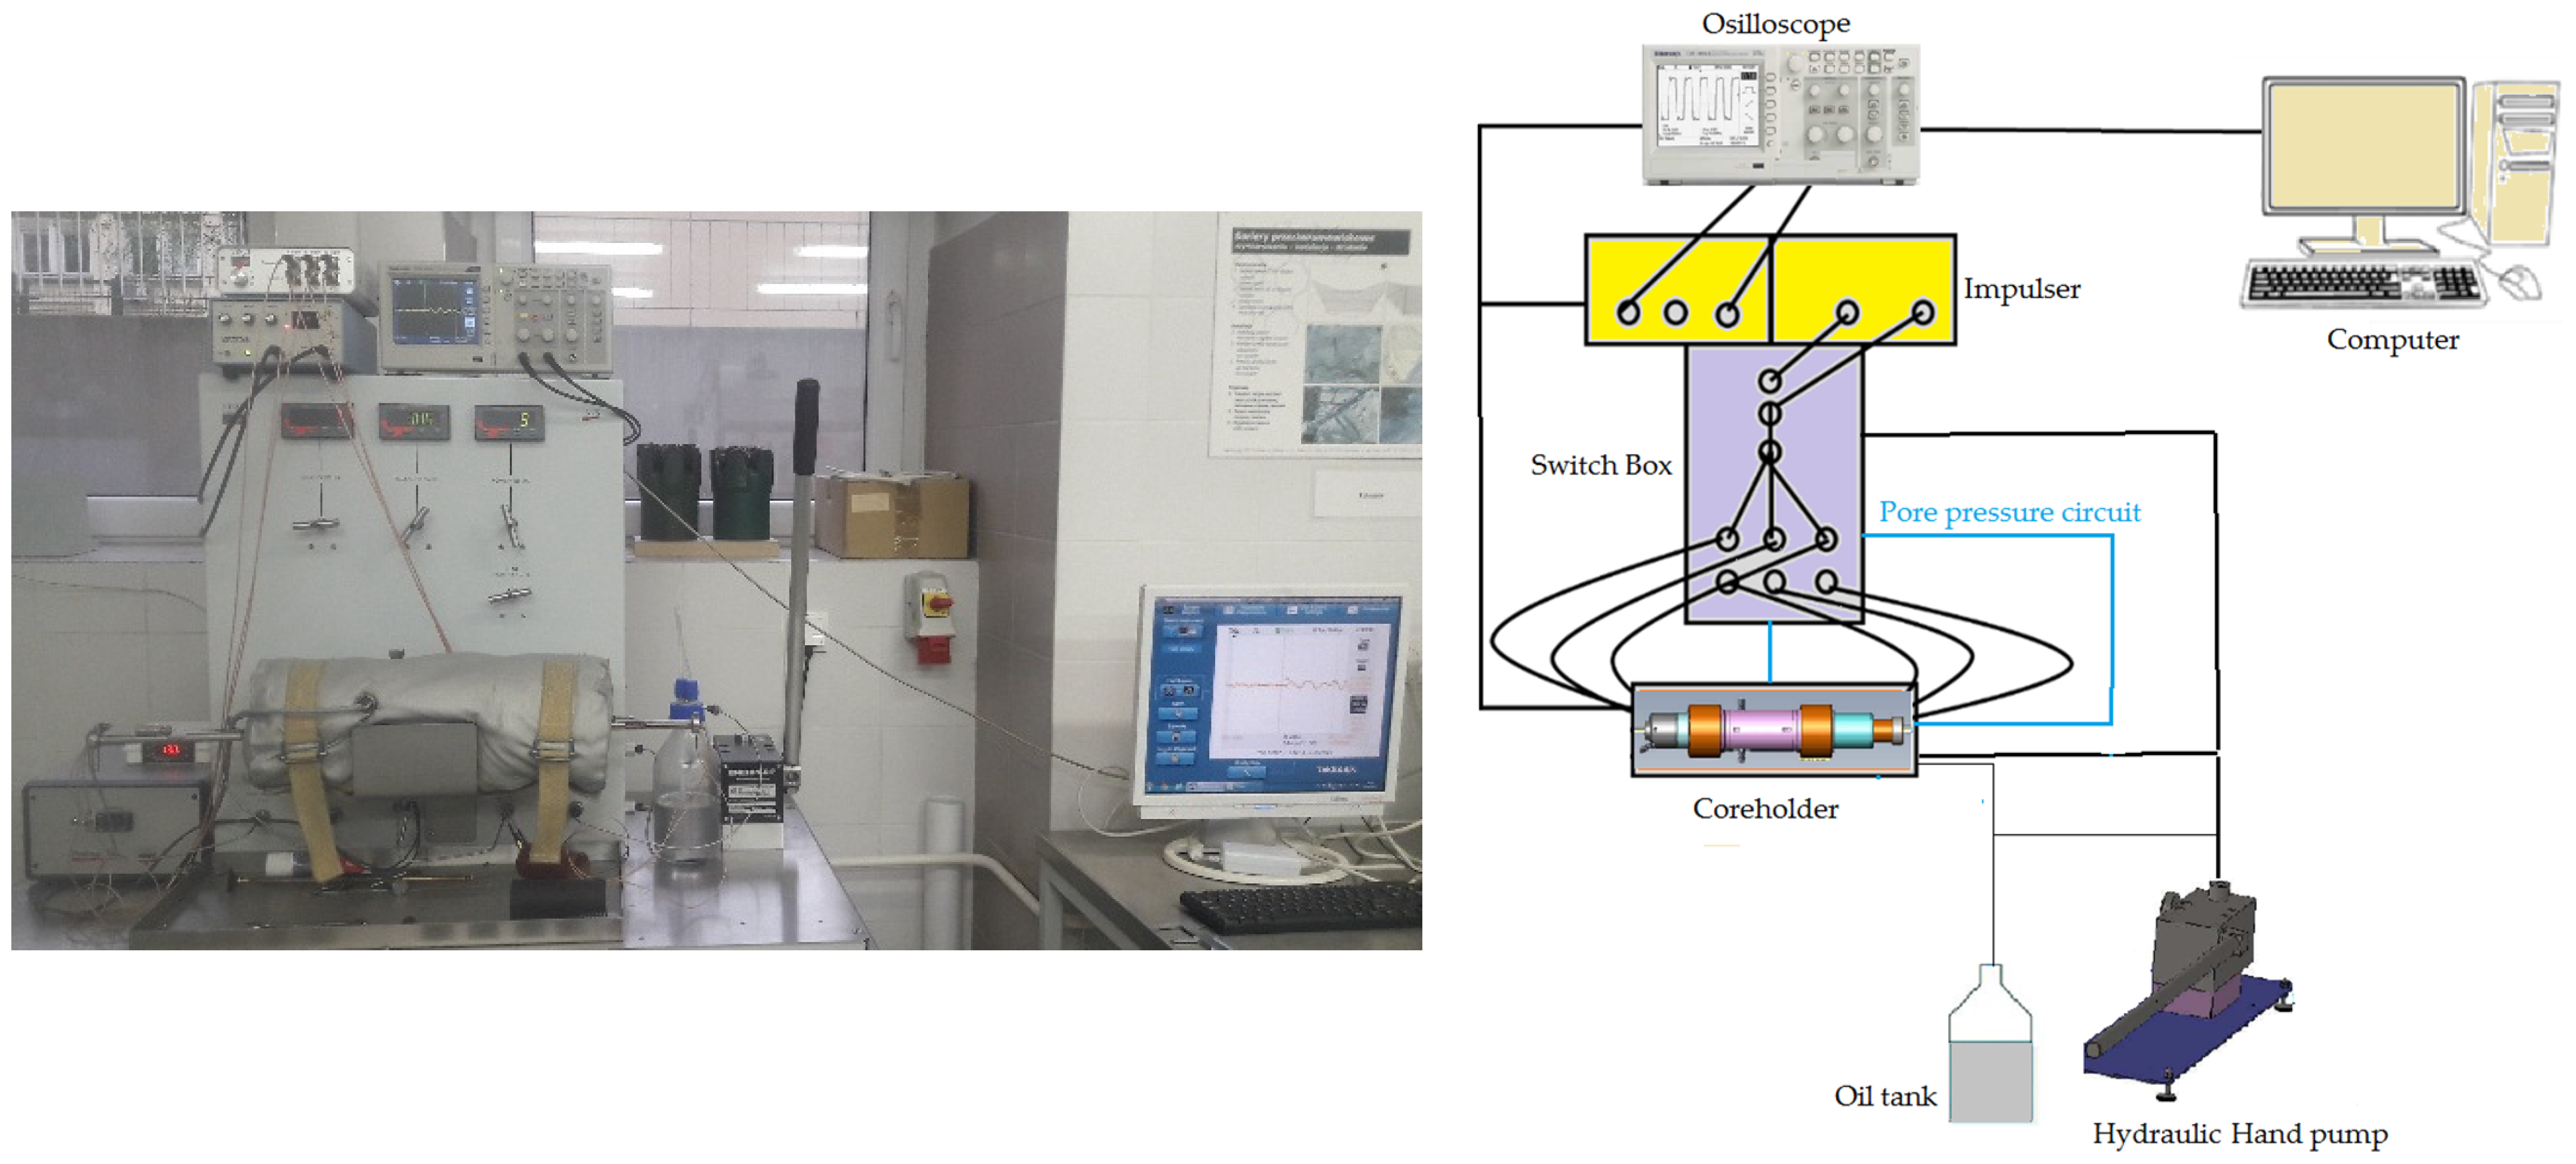
After saturating the samples of the second group, an acoustic velocity measurement apparatus (AVS) was set up to conduct the tests. Figure 4 depicts the AVS apparatus with its schematic diagram. The apparatus model was AVS 1000 manufactured by the French company Vinci Technologies (Nanterre, France).
The apparatus was equipped with a coreholder, oil tank, hydraulic pressure hand pump, pore pressure circuit, switch box, oscilloscope, impulser, and computer. The coreholder was a cylindrical chamber for placement of the rock samples. The oil tank supplied the oil used for the hydraulic hand pump. The hydraulic hand pump was used for applying the confining pressure to the rock samples. Moreover, the hand pump was used to increase the pore fluid (water) pressure within the rock sample. In this research, water was used as the pore fluid circulated in the pore pressure circuit. The corresponding valves and tubes were able to hold the pressure of water up to 105 MPa. Furthermore, the switch box contained the pore pressure valves, confining pressure valves, and the monitors showing the magnitudes of the applied pressures on the rock samples.
The oscilloscope showed the frequency and time of flight of the propagated waves. Moreover, the task of the impulser was to transmit and receive the acoustic waves through the rock samples. The apparatus used high-frequency signals (500 KHz). Additionally, there were two transducers on both sides of the coreholder. The first transducer transmitted the acoustic waves into the rock sample, and at the opposite end, the second transducer received the waves. In all experiments, the compressional and shear waves were transmitted through the specimens, and then, their time of flight was recorded. The recorded time of flight was then transferred from the oscilloscope to a specific software on the computer. To compute the velocities of the acoustic waves, the length (m) of the samples was divided by the time of flight of the waves (s).

3. Results

The experiments were conducted under two conditions: undrained and drained conditions. The first step was to conduct the tests under undrained conditions. The principal objective of such tests was to compute the undrained bulk modulus, K u n , for each specimen. For this purpose, the following procedure was performed for each sample:
  • The sample was inserted into the cylindrical chamber, and then, the water valves were completely closed to satisfy the undrained condition.
  • Using the hand pump, the hydrostatic stress was increased through regular intervals equal to 3.50 MPa (roughly 500 psi). All tests were performed under a hydrostatic stress less than 50% of the rock’s UCS. In other words, the maximum applied hydrostatic stress was equal to 21 MPa.
  • For every interval, the applied hydrostatic stress, pore pressure, compressional wave velocity, and shear wave velocity were recorded.
  • Finally, the undrained bulk modulus of each sample was calculated using [29]:
K u n = ρ V p 2 4 3 V s 2
where K u n (Pa) indicates the rock bulk modulus under the undrained condition, ρ (kg/m3) represents the density of the rock specimen, V p (m/s) indicates the P-wave velocity, and V s (m/s) illustrates the S-wave velocity. In this way, the undrained experiments were completed.
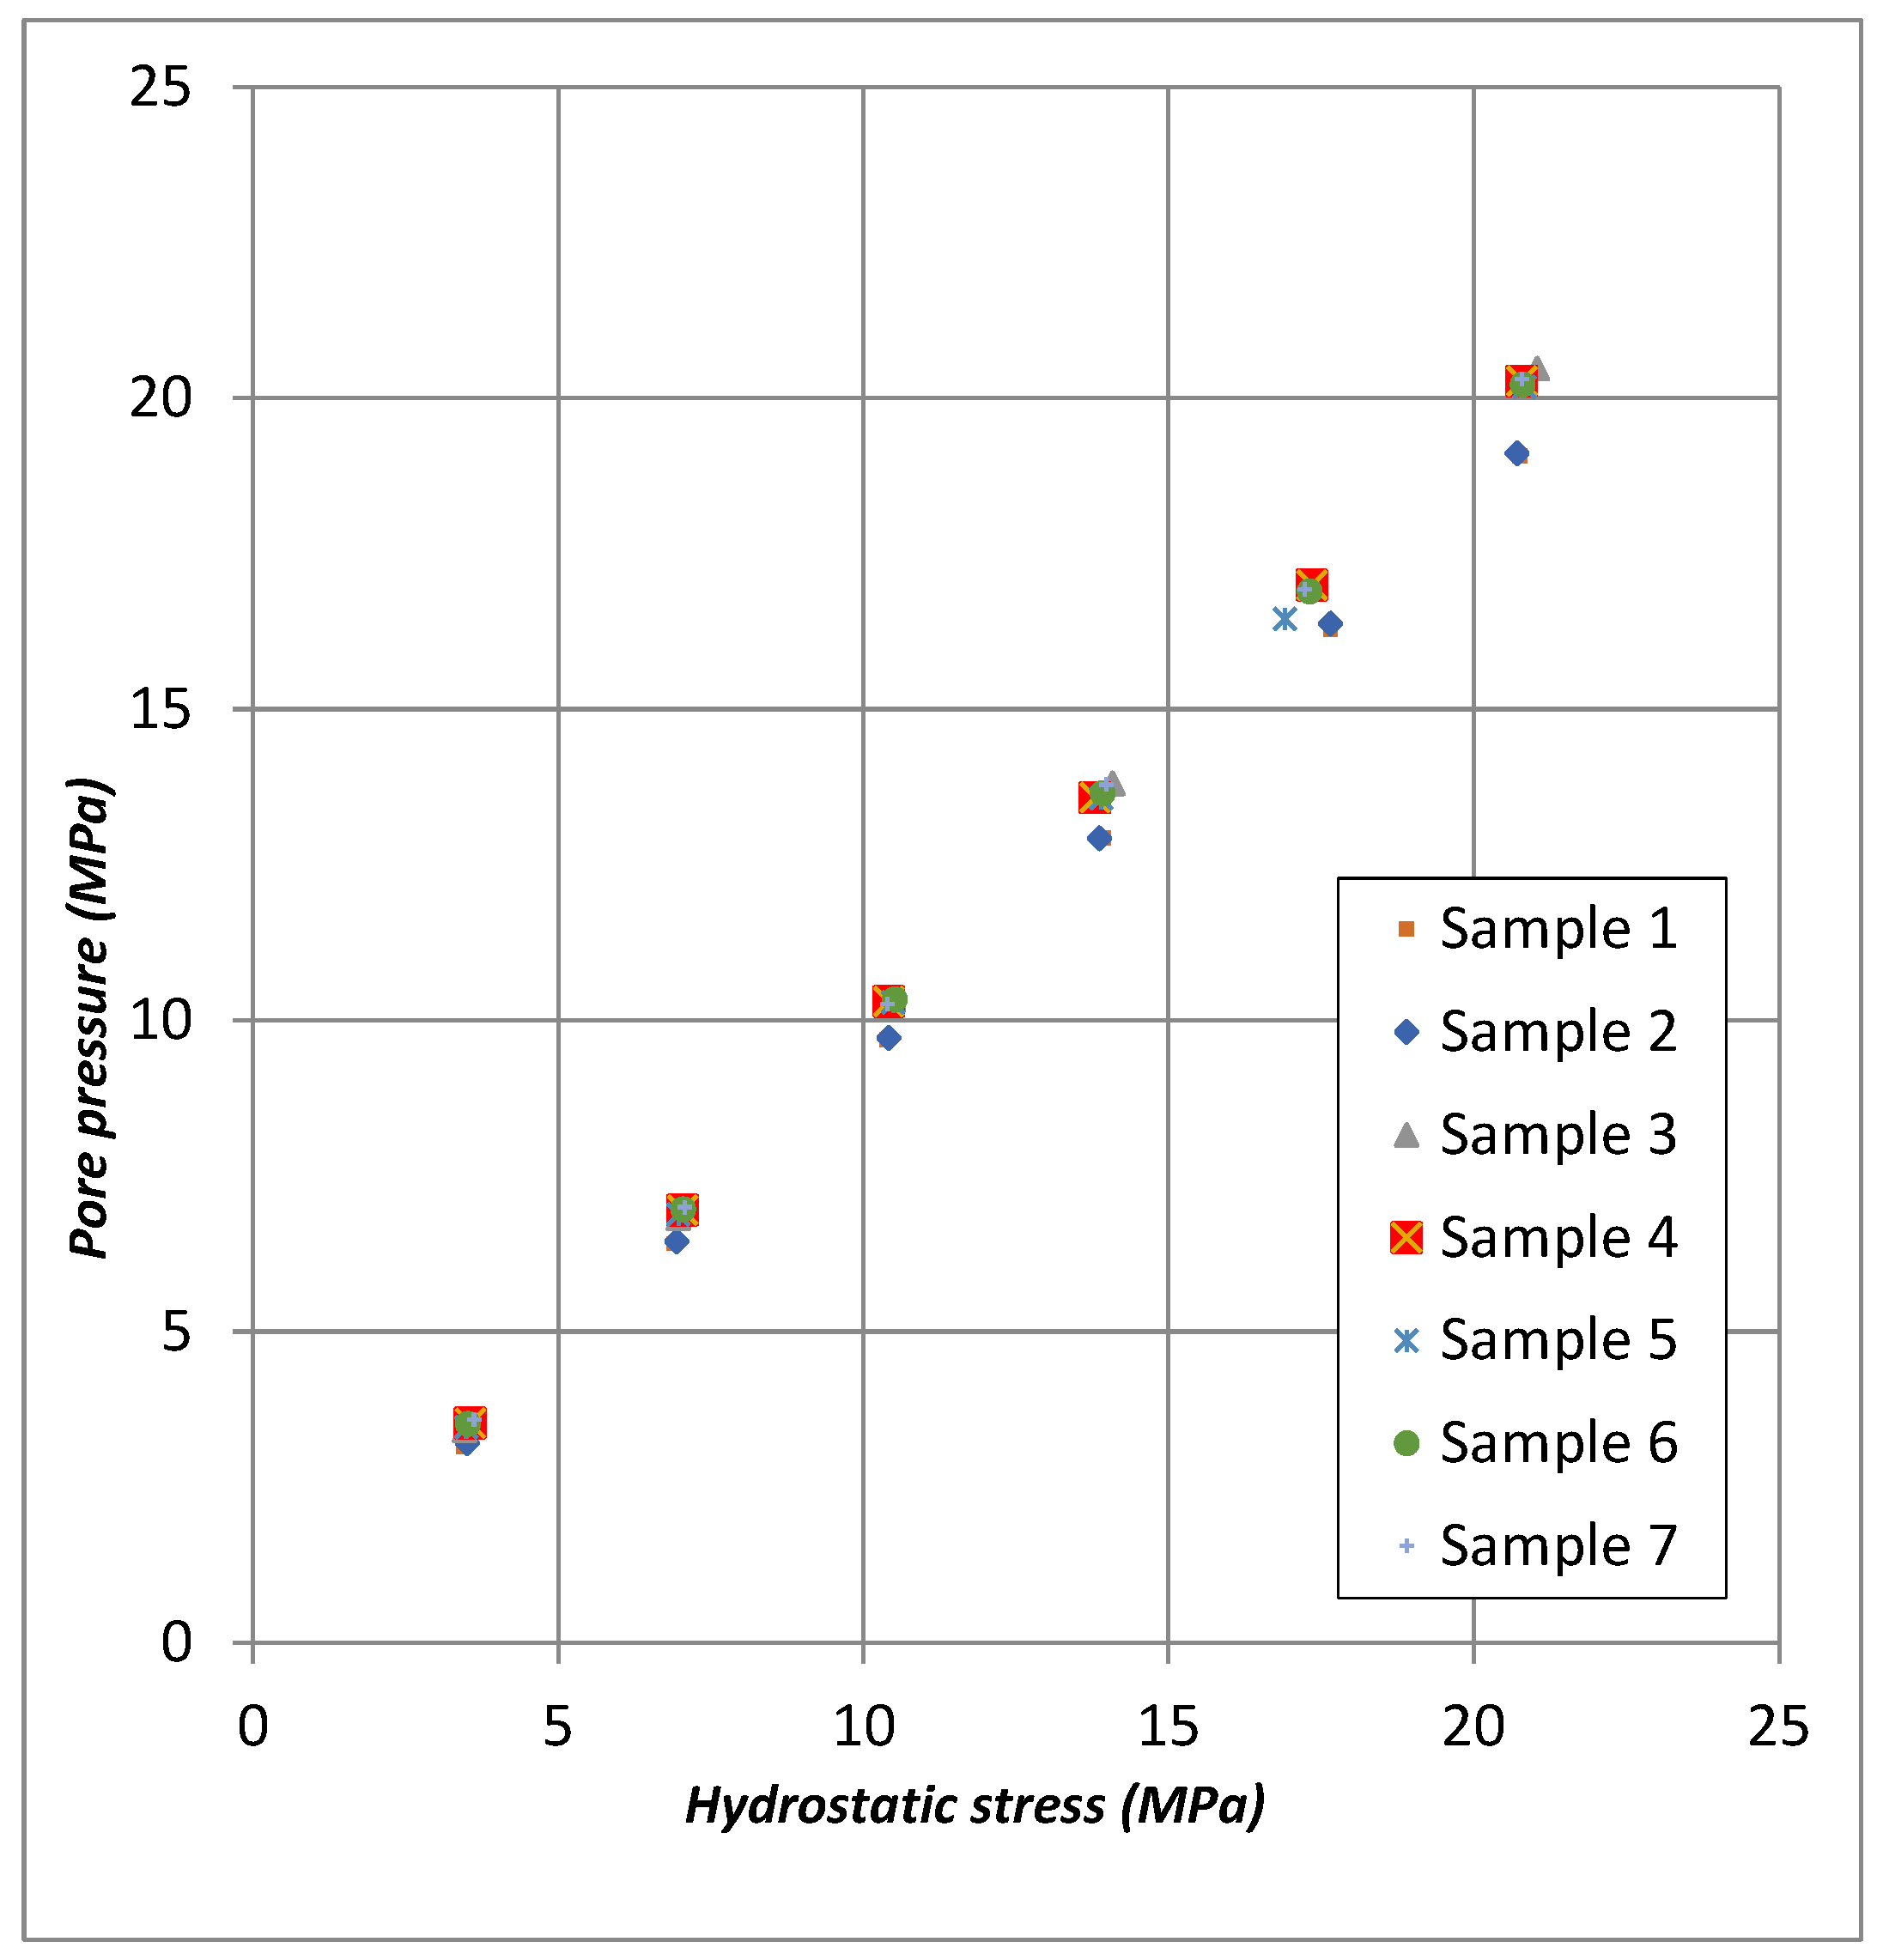
As the hydrostatic stress was increased, the pore pressure rose to bear the hydrostatic stress. Using the incremental values of hydrostatic stress together with the pore fluid pressure, the Skempton’s coefficient was calculated in each increment. To avoid potential failure in the solid structure of the rock sample, the hydrostatic stress was raised only up to 50% of the samples’ UCS. In this case, the instant values of Skempton’s coefficient varied only from 0.95 to 1. Furthermore, the overall Skempton’s coefficient fluctuated around 0.97.
Figure 5 depicts the variation in the hydrostatic stress versus the pore pressure for all seven samples. In this figure, Skempton’s coefficient is the average slope of the line. It is conspicuous that as the hydrostatic stress was increased, the difference between the pore pressure and the hydrostatic stress escalated too. This trend implies that the influence of pore pressure on the bearing from the applied hydrostatic stress has declined.
Afterwards, the AVS apparatus was set up for conduction of experiments under drained conditions. The following procedure was carried out for each sandstone sample:
  • The pore pressure valves were completely opened to satisfy the drained condition.
  • The sample was inserted into the coreholder.
  • The hydrostatic stress was incrementally raised from 3.5 MPa to 21 MPa. In each increment, the value of the hydrostatic stress together with the acoustic waves’ velocities were recorded.
  • Eventually, using the following equation, the rock bulk modulus under drained conditions, K d r , was computed for each sample [29]:
K d r = ρ V p 2 4 3 V s 2
where K d r (Pa) indicates the bulk modulus under drained conditions.
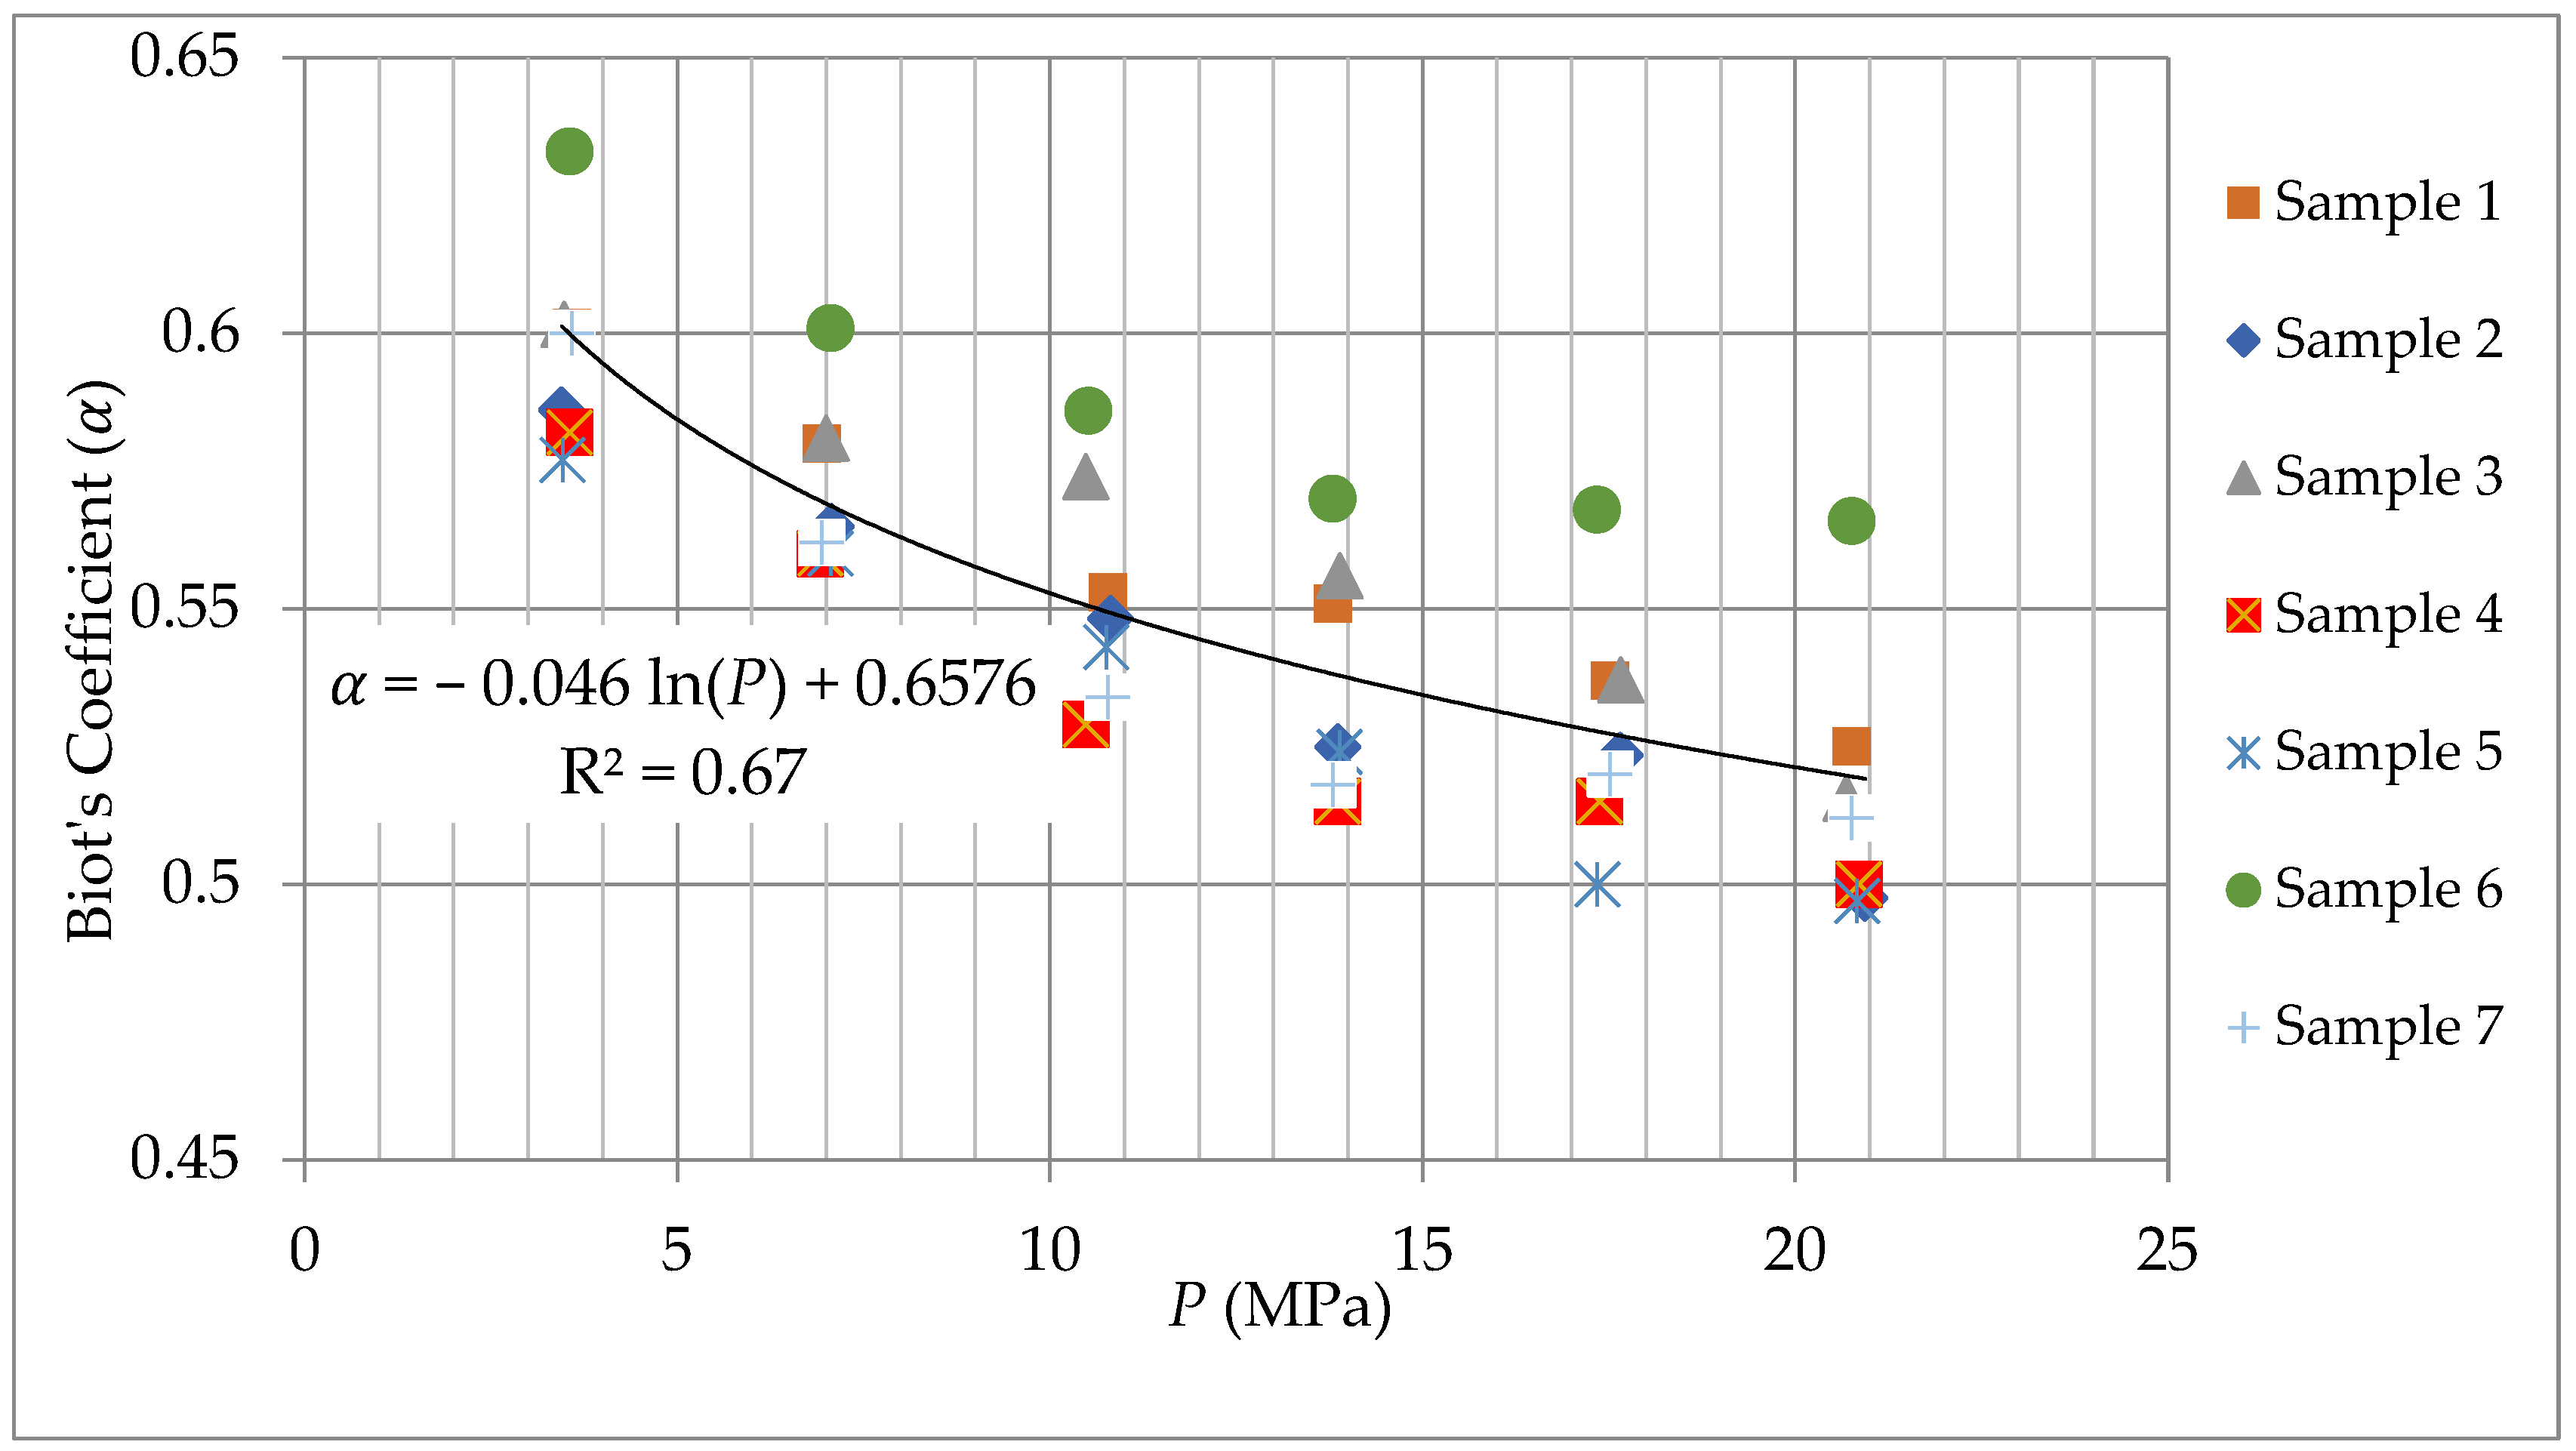
Finally, after calculating the undrained and drained bulk moduli, the Biot’s coefficient, α, was calculated for each sample using Equation (4). Figure 6 illustrates the variation in Biot’s coefficient with the hydrostatic stress for all seven specimens. It can be observed that α declined logarithmically with the hydrostatic stress. The following correlation was extracted between the Biot’s coefficient and the applied hydrostatic stress:
α = 0.046 ln P + 0.6576
where α is the dimensionless Biot’s coefficient and P (MPa) stands for the applied hydrostatic stress. Moreover, for this equation, the value of the correlation coefficient (R2) was equal to 0.67. Although it may seem that the value of 0.67 is not high, it should be noted that the non-homogeneity of different rock samples partially causes this result. In addition, it was found that the Biot’s coefficient of the sandstone samples varied in the range of 0.52–0.60. Moreover, Figure 6 shows that the Biot’s coefficient variation rate declined with the increase in the hydrostatic stress.
The extracted empirical correlation can be utilized to predict the magnitude of Biot’s coefficient for the identical sandstone rocks which are planned for EOR operations, or other rock–fluid interaction projects. During the EOR process, the hydrostatic stress around the reservoirs increases, thereby leading to a rise in the Biot’s coefficient. Consequently, a larger volume of the residual oil is released (produced) from the reservoir. The rock–fluid interaction can be numerically simulated to investigate the influence of Biot’s coefficient variation on the oil flow from the reservoir to the production wells.
In a reservoir, the magnitudes of pore pressure and in situ stresses can usually be reasonably estimated through different methods. Nevertheless, there is a need to have the Biot’s coefficient to calculate the effective stress using Equation (1). The merit of Equation (8) is that the Biot’s coefficient can be imported to the numerical models as a function of stress rather than a constant value. In other words, since during EOR operations the stress state in the reservoir is gradually redistributed, the assumption of a constant Biot’s coefficient seems to be inaccurate. Hence, to omit the impact of such an assumption, the extracted empirical correlation in this research can be utilized.
The available empirical correlations for calculating the Biot’s coefficient are chiefly based on the rock porosity. For example, Raymer et al. (1980) proposed the following empirical correlation [30]:
α = 1 ( 1 φ ) 3.8
where φ (dimensionless) indicates the rock porosity. Another empirical correlation was introduced by Krief et al. (1990) [31]:
α = 1 ( 1 φ ) ( 3 1 φ )
It is noteworthy that in Equations (9) and (10), the rock porosity must be set as a real number in the range of 0–1. Table 3 summarizes the Biot’s coefficient values calculated through Equations (8)–(10). As can be seen, the Biot’s coefficient obtained from Equation (9) is closer to the Biot’s coefficient computed from Equation (8). The main novelty in Equation (8), which was obtained in this research, is that it is dependent on the pressure (stress) on the rock under compaction. In this case, more accurate results are obtained for the efficiency of EOR projects. Hence, the EOR project will be implemented with a higher economical profitability and smaller environmental footprints.

4. Discussion

Biot’s coefficient is a key poroelastic parameter which influences the volume of pore fluid entering or exiting from the porous rocks under external hydrostatic stress [32]. In this research, the Biot’s coefficient of seven specimens captured from the Świętokrzyskie mine was determined. For these sandstone samples, an empirical correlation was extracted (Equation (8)).
The Biot’s coefficient was observed to range from 0.52 to 0.60 when the hydrostatic stress was raised from 3.50 MPa to 21 MPa, respectively. The experimental findings illustrated that when the hydrostatic stress increases, the rate of reduction in Biot’s coefficient steadily declines. This phenomenon shows the reduction of the effect of the pore pressure in the resistance against the applied hydrostatic stress. Such a downtrend previously appeared in the research conducted by Knez and Zamani [23]. In Reference [23], two empirical correlations were introduced for the Biot’s coefficient of two different types of sandstone rocks. The corresponding sandstone rocks had porosity values of 11.5%, and 21%. The samples had been taken perpendicular to the direction of the in situ sandstone layers. On the contrary, in the present research, the samples (with an average porosity of 15.66%) were taken parallel to the direction of the sandstone layer. In both studies, the Biot’s coefficient correlations exhibited a near logarithmic trend. Furthermore, in Reference [23], the ratio of the P-wave velocity to the S-wave velocity fluctuated in the domain of 1.6–1.8. Such a ratio varied in the range of 1.7–1.9 in the current research. The similar trend of Biot’s coefficient and the close values of V p / V s suggests that there is no Biot’s coefficient anisotropy affecting the EOR operations in the sandstone rocks.
According to the effective stress law (Equation (1)), as the Biot’s coefficient declines, the effective stress increases. The effective stress is considered the determining factor in the depletion of hydrocarbon-bearing formations [33]. Hence, by applying Equation (8) in Equation (1), the values of EOR-induced stress in the reservoir can be computed by analytical or numerical solutions. Consequently, the stability of the injection and production wells can be analyzed. In addition, the EOR efficiency, wellbore stability, and sand production prediction [34] are other applications in which Equation (8) can be used.
Apart from the economical and geomechanical aspects, the extracted empirical correlation is also applicable in environmental investigations. In fact, in many global oil/gas fields, reservoir depletion causes different environmental impacts such as land subsidence and shallow-depth earthquakes [24,35]. Thus, the extracted correlation can be utilized in analytical calculations or numerical simulations related to these environmental issues.
Another finding from this research was that the Skempton’s coefficient value can be reasonably assumed to be 1 when the external hydrostatic stress on the rock is less than half of the rock’s UCS value. In this case, Equation (4) becomes simpler for calculating the Biot’s coefficient (since the value of B is assumed to be 1).
Except waterflooding, CO2-flooding, and polymer-flooding operations in which a fluid is directly injected into the depleted reservoirs, other techniques such as seismic stimulation can also be adopted for EOR purposes [36]. In such a technique, seismic waves are propagated through the reservoir rocks, thereby leading to mobilization of the residual oil. To evaluate the success of these operations, the poroelastic effects of the seismic waves on the EOR efficiency must be investigated using numerical simulations. Prid et al. (2008) developed a numerical solution for calculating the oil flow rate induced by the propagated seismic waves [36]. Since, in the current research, Equation (8) was obtained through the wave propagation method, it can be used in the numerical simulations pertinent to such EOR-seismic operations.
In this research, the impact of temperature on the Biot’s coefficient was not investigated. A number of investigations have previously reported that temperature has a direct impact on Biot’s coefficient [37,38]. The main reason is that the temperature variation affects the rheological features of the pore fluid. Therefore, in future works, the effect of temperature on the Biot’s coefficient should be incorporated. To this end, different statistical approaches and artificial intelligence techniques can be utilized [39,40,41].
Furthermore, Equation (8) can be used in many applications in drilling engineering. For example, it is quite useful in the calculations related to the evaluation of drilling efficiency. Such evaluations are commonly based on improving the rate of penetration (ROP) and mechanical specific energy (MSE). The application of Biot’s coefficient in these applications will enhance the accuracy of the predicted results [42]. Such an application is not only useful in terrestrial engineering projects, but also it is instrumental in characterizing the poroelastic interaction between the lunar/Martian regolith and water on the moon and Mars [43,44].

5. Conclusions

In this research, the Biot’s coefficient of seven sandstone samples captured from the Świętokrzyskie mine in Kielc, Poland, was determined. To accomplish this, an acoustic wave propagation apparatus was used to measure the compressional and shear wave velocities within the sandstone samples.
The laboratory experiments were conducted under undrained and drained conditions. The experiments showed that the Skempton’s coefficient varied from 0.95 to 1 when the hydrostatic stress was increased from 3.50 MPa to 21 MPa. Hence, in all experiments, the hydrostatic stress was raised up to 21 MPa to avoid any potential failure in the sample structure. The hydrostatic stress was raised with a constant increment equal to 3.5 MPa. Through this procedure, the bulk moduli of each sandstone specimen were calculated under undrained and drained conditions.
In the subsequent step, the magnitude of Biot’s coefficient was computed through Equation (4). Therefore, an experimental correlation was extracted for Biot’s coefficient as a function of the applied hydrostatic stress. The corresponding empirical correlation was
α = 0.046 ln P + 0.6576
where α is the dimensionless Biot’s coefficient and P (MPa) stands for the applied hydrostatic stress. The Biot’s coefficient logarithmically declines with the hydrostatic stress. Furthermore, it was found that the Biot’s coefficient increased from 0.52 to 0.60 when the hydrostatic stress was raised from 3.50 MPa to 21 MPa. Such a relationship can be utilized instead of the existing empirical correlations in which the Biot’s coefficient is correlated with the rock’s porosity.
Equation (8) can be utilized for prospective engineering plans in which the rock poroelastic behavior affects the project. In this research, the experiments were conducted on seven sandstone samples with an average porosity of 15.66%. In a previous study conducted by the authors in Reference [18], the Biot’s coefficient values of two other sandstone formations (with porosity values of 11.5% and 21%) were also studied. Although the direction of the core sampling was different in those studies, the similar logarithmic trend of the Biot’s coefficient together with the close values of V p / V s implies that there is no Biot’s coefficient anisotropy in the sandstone rocks. However, for future investigations, it is suggested to study a larger range of rock porosities to further analyze this phenomenon.
Using Equation (8), the reservoir engineers can determine the Biot’s coefficient of sandstone rocks for EOR projects. Then, the Biot’s coefficient can be imported into the corresponding EOR calculations. The main advantage of Equation (8) over Equations (9) and (10) is that it is dependent on the stress (pressure at which the rock is held), not to the porosity which changes during reservoir depletion and EOR-solution injection. To reach a more general model, it is also proposed to test other sandstone rocks with dissimilar porosities. The extracted correlation can be utilized in different reservoir issues such as wellbore instability, sand production, reservoir compaction, and land subsidence.

Author Contributions

Conceptualization, D.K.; Methodology, D.K.; Software, M.A.M.Z.; Validation, D.K.; Formal analysis, D.K. and M.A.M.Z., Investigation, M.A.M.Z.; Resources, D.K.; Data curation, M.A.M.Z.; Writing—original draft, M.A.M.Z. and D.K.; Writing—review and editing, M.A.M.Z. and D.K.; Visualization, D.K. and M.A.M.Z.; Supervision, D.K.; Project administration, D.K.; Funding acquisition, D.K. All authors have read and agreed to the published version of the manuscript.

Funding

The project was supported by the AGH University of Krakow, Krakow, Poland, subsidy 16.16.190.779.

Data Availability Statement

All data are accessible in the context of the article.

Conflicts of Interest

The authors declare no conflict of interest.

References

  1. Wang, H.F. Theory of Linear Poroelasticity with Applications to Geomechanics and Hydrogeology; Princeton University Press: Oxford, UK, 2000. [Google Scholar]
  2. Alyafei, N. Fundamentals of Reservoir Rock Properties, 2nd ed.; Hamad Bin Khalifa University Press: Doha, Qatar, 2021; ISBN 9789927137273. [Google Scholar] [CrossRef]
  3. Höök, M.; Davidsson, S.; Johansson, S.; Tang, X. Decline and depletion rates of oil production: A comprehensive investigation. Phil. Trans. R. Soc. 2014, 372, 20120448. [Google Scholar] [CrossRef]
  4. Muggeridge, A.; Cockin, A.; Webb, K.; Frampton, H.; Collins, I.; Moulds, T.; Salino, P. Recovery rates, enhanced oil recovery and technological limits. Philos. Trans. A Math. Phys. Eng. Sci. 2013, 372, 20120320. [Google Scholar] [CrossRef] [Green Version]
  5. Available online: https://www.energy.gov/fecm/enhanced-oil-recovery (accessed on 21 January 2023).
  6. Elyasi, A.; Goshtasbi, K.; Hashemolhosseini, H. A coupled thermo-hydro-mechanical simulation of reservoir CO2 enhanced oil recovery. Energy Environ. 2016, 27, 524–541. [Google Scholar] [CrossRef]
  7. Adeosun, T.A.; Adabanija, M.A.; Akinpelu, F.O. Modeling and simulation of reservoir pressure associated with emulsions transport near wellbore for enhanced oil recovery. World Sci. News 2020, 144, 427–449. [Google Scholar]
  8. Biot, M.A. General Theory of three-dimensional consolidation. J. Appl. Phys. 1941, 12, 155–164. [Google Scholar] [CrossRef]
  9. Terzaghi, K.; Peck, R.B.; Mesri, G. Soil Mechanics in Engineering Practice, 3rd ed.; John Wiley & Sons: Hoboken, NJ, USA, 1996; ISBN 978-0-444-50260-5. [Google Scholar]
  10. Teklu, T.W.; Alameri, W.; Graves, R.M.; Tutuncu, A.N.; Kazemi, H.; Alsumaiti, A.M. Geomechanics considerations in enhanced oil recovery. In Proceedings of the SPE Canadian Unconventional Resources Conference, Calgary, AB, Canada, 30 October–1 November 2012. [Google Scholar] [CrossRef]
  11. Wang, S.; Di, Y.; Winterfeld, P.H.; Li, J.; Zhou, X.; Wu, Y.S.; Yao, B. Understanding the multiphysical processes in carbon dioxide enhanced-oil-recovery operations: A numerical study using a general simulation framework. SPE J. 2021, 26, 918–939. [Google Scholar] [CrossRef]
  12. Lu, M.; Su, Y.; Zhan, S.; Almrabat, A. Modeling for reorientation and potential of enhanced oil recovery in refracturing. Adv. Geo-Energy Res. 2020, 4, 20–28. [Google Scholar] [CrossRef] [Green Version]
  13. Zhang, G.Q.; Chen, M. Dynamic fracture propagation in hydraulic re-fracturing. J. Pet. Sci. Eng. 2010, 70, 266–272. [Google Scholar] [CrossRef]
  14. Roussel, N.P.; Sharma, M.M. Role of stress reorientation in the success of refracture treatments in tight gas sands. SPE Prod. Oper. 2012, 27, 346–355. [Google Scholar] [CrossRef]
  15. Fakcharoenphol, P.; Charoenwongsa, S.; Kazemi, H.; Wu, Y.S. The effect of water-induced stress to enhance hydrocarbon recovery in shale reservoirs. SPE J. 2013, 18, 897–909. [Google Scholar] [CrossRef]
  16. He, J.; Rui, Z.; Ling, K. A new method to determine Biot’s coefficients of Bakken samples. J. Nat. Gas Sci. Eng. 2016, 35, 259–264. [Google Scholar] [CrossRef] [Green Version]
  17. Nowakowski, A. The Influence of Rate of Change in Confining and Pore Pressure on Values of the Modulus of Compressibility of the Rock Skeleton and Biot’s Coefficient. Energies 2021, 14, 3056. [Google Scholar] [CrossRef]
  18. Khalilidermani, M.; Knez, D.; Zamani, M.A.M. Empirical Correlations between the Hydraulic Properties Obtained from the Geoelectrical Methods and Water Well Data of Arak Aquifer. Energies 2021, 14, 5415. [Google Scholar] [CrossRef]
  19. Knez, D.; Rajaoalison, H. Land Subsidence Assessment for Wind Turbine Location in the South-Western Part of Madagascar. Energies 2022, 15, 4878. [Google Scholar] [CrossRef]
  20. Franquet, J.A.; Abass, H.H. Experimental evaluation of Biot’s poroelastic parameter-three different methods. In Proceedings of the 37th U.S. Symposium on Rock Mechanics (USRMS), Vail, CO, USA, 6–9 June 1999. [Google Scholar]
  21. Berryman, J.G. Effective Stress for Transport Properties of Inhomogeneous porous rocks. J. Geophys. Res. 1992, 97, 17409–17424. [Google Scholar] [CrossRef] [Green Version]
  22. Zhang, J.J. Applied Petroleum Geomechanics, 2nd ed.; Elsevier Inc: Cambridge, MA, USA, 2019; ISBN 978-0-12-814814-3. [Google Scholar] [CrossRef]
  23. Knez, D.; Zamani, M.A.M. Empirical Formula for Dynamic Biot Coefficient of Sandstone Samples from South-West of Poland. Energies 2021, 14, 5514. [Google Scholar] [CrossRef]
  24. Wang, C.; Zeng, Z. Overview of Geomechanical Properties of Bakken Formation in Williston Basin, North Dakota. In Proceedings of the 45th U.S. Rock Mechanics/Geomechanics Symposium, San Francisco, CA, USA, 26–29 June 2011; pp. 1–11. [Google Scholar]
  25. Makhnenko, R.Y.; Labuz, J.F. Saturation of Porous Rock and Measurement of the B coefficient. In Proceedings of the 47th US Rock Mechanics/Geomechanics Symposium, San Francisco, CA, USA, 23–26 June 2013. [Google Scholar]
  26. Knez, D.; Khalilidermani, M.; Zamani, M.A.M. Water Influence on the Determination of the Rock Matrix Bulk Modulus in Reservoir Engineering and Rock-Fluid Coupling Projects. Energies 2023, 16, 1769. [Google Scholar] [CrossRef]
  27. Hart, D.J.; Wang, H.F. Laboratory measurements of a complete set of poroelastic moduli for Berea Sandstone and Indiana Limestone. J. Geophys. Res. 1995, 100, 17741–17751. [Google Scholar] [CrossRef]
  28. Hajivand, R.D.; Zamani, M.A.M.; Knez, D.; Kazemi, K. Comparing Several Different Numerical Approaches for Large Deformation Modeling with Application in Soil Dynamic Compaction. Transp. Infrastruct. Geotech. 2023. [Google Scholar] [CrossRef]
  29. Fjaer, E.; Holt, R.M.; Horsrud, P.; Raaen, A.M.; Risnes, R. Petroleum Related Rock Mechanics, 2nd ed.; Elsevier: Amsterdam, The Netherlands, 2008; ISBN 978-0-444-50260-5. ISSN 0376-7361. [Google Scholar]
  30. Raymer, L.L.; Hunt, E.R.; Gardner, J.S. An improved sonic transit time-to-porosity transform. In Proceedings of the 21st Annual Logging Symposium, Lafayette, LA, USA, 8–11 July 1980; pp. 1–13. [Google Scholar]
  31. Krief, M.; Garta, J.; Stellingwerff, J.; Ventre, J. A petrophysical interpretation using the velocities of P and S waves (full-waveform sonic). Log. Anal. 1990, 31, 355–369. [Google Scholar]
  32. Detournay, E.; Cheng, A.H.D. Fundamentals of Poroelasticity; Pergamon Press: Oxford, UK, 1993; Volume 2, pp. 113–171. [Google Scholar] [CrossRef]
  33. Nermoen, A.; Korsnes, R.; Christensen, H.F.; Trads, N.; Hiorth, A.; Madland, M.V. Measuring the Biot stress coefficient and is implications on the Effective Stress Estimate. In Proceedings of the 47th US Rock Mechanics/Geomechanics Symposium, San Francisco, CA, USA, 23–26 June 2013. [Google Scholar]
  34. Zamani, M.A.M.; Knez, D. A new mechanical-hydrodynamic safety factor index for sand production prediction. Energies 2021, 14, 3130. [Google Scholar] [CrossRef]
  35. Rajaoalison, H.; Knez, D.; Zamani, M.A.M. A Multidisciplinary Approach to Evaluate the Environmental Impacts of Hydrocarbon Production in Khuzestan Province, Iran. Energies 2022, 15, 8656. [Google Scholar] [CrossRef]
  36. Pride, S.R.; Flekkøy, E.G.; Aursjø, O. Seismic stimulation for enhanced oil recovery. Geophysics 2008, 73, O23–O35. [Google Scholar] [CrossRef]
  37. Rajaoalison, H.; Knez, D.; Zlotkowski, A. Changes of Dynamic Mechanical Properties of Brine-Saturated Istebna Sandstone under Action of Temperature and Stress. Przemysł Chem. 2019, 98, 801–804. [Google Scholar]
  38. Knez, D.; Rajaoalison, H. Discrepancy between Measured Dynamic Poroelastic Parameters and Predicted Values from Wyllie’s Equation for Water-Saturated Istebna Sandstone. Acta Geophys. 2021, 69, 673–680. [Google Scholar] [CrossRef]
  39. Quosay, A.A.; Knez, D.; Ziaja, J. Hydraulic Fracturing: New Uncertainty Based modelling Approach for Process Design Using Monte Carlo Simulation Technique. PLoS ONE 2020, 15, e0236726. [Google Scholar] [CrossRef]
  40. Quosay, A.A.; Knez, D. Sensitivity Analysis on Fracturing Pressure using Monte Carlo Simulation Technique. Oil Gas Eur. Mag. 2016, 42, 140–144. [Google Scholar]
  41. Mostafaei, K.; Maleki, S.; Zamani Ahmad Mahmoudi, M.; Knez, D. Risk Management Prediction of Mining and Industrial Projects by Support Vector Machine. Resour. Policy 2022, 78, 102819. [Google Scholar] [CrossRef]
  42. Khalilidermani, M.; Knez, D. A Survey of Application of Mechanical Specific Energy in Petroleum and Space Drilling. Energies 2022, 15, 3162. [Google Scholar] [CrossRef]
  43. Knez, D.; Khalilidermani, M. A Review of Different Aspects of Off-Earth Drilling. Energies 2021, 14, 7351. [Google Scholar] [CrossRef]
  44. Knez, D.; Zamani, M.A.M. A Review of the Geomechanics Aspects in Space Exploration. Energies 2021, 14, 7522. [Google Scholar] [CrossRef]
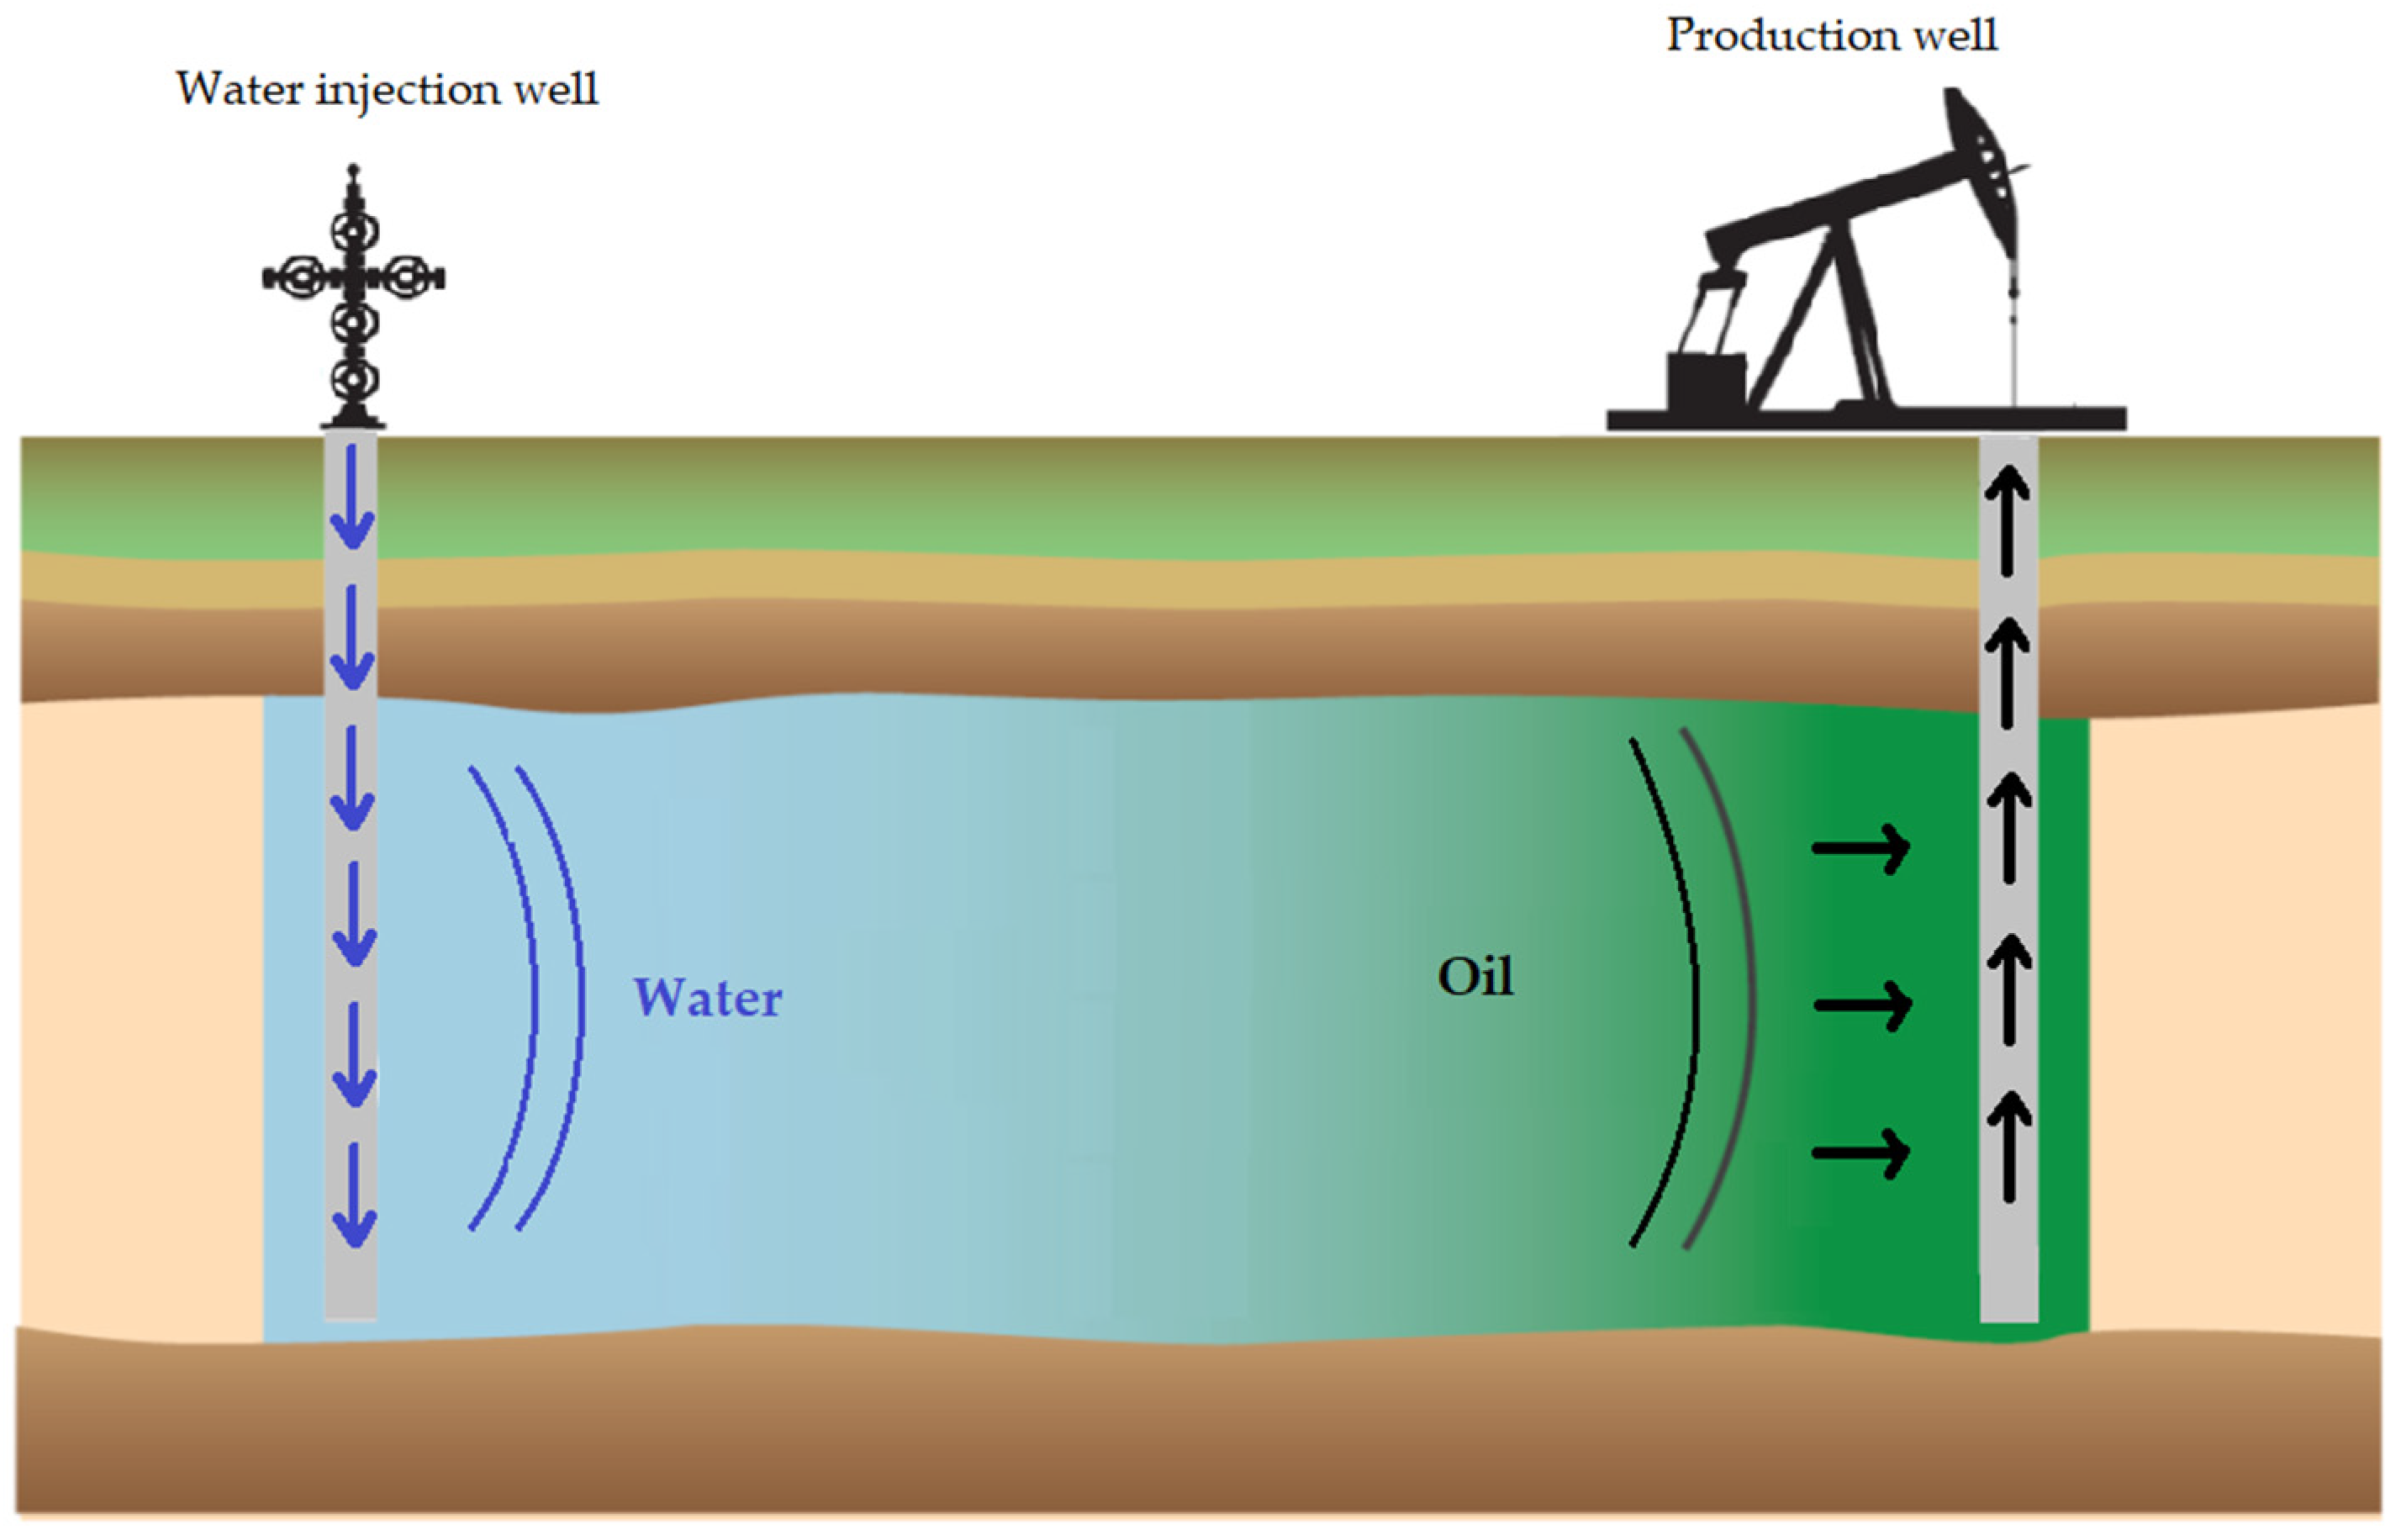
Figure 1. A schematic illustration of an EOR operation.
Energies 16 04999 g001
Figure 2. Two groups of sandstone samples: first group for conducting the UCS measurement tests (right); second group for conducting the acoustic wave propagation tests (left).
Energies 16 04999 g002
Figure 3. UCS measurement apparatus.
Energies 16 04999 g003
Figure 4. Acoustic velocity measurement (AVS) apparatus (left); the schematic diagram of the apparatus (right).
Energies 16 04999 g004
Figure 5. Relationship between the hydrostatic stress and pore pressure for 7 samples (under undrained condition).
Energies 16 04999 g005
Figure 6. The variation in Biot’s coefficient with the hydrostatic stress for seven sandstone samples.
Energies 16 04999 g006
Table 1. Characteristics of the five samples used for measuring the average UCS.
Sample CodeDry Mass (g)Diameter (mm)UCS (MPa)
R193.483840.2
R2102.953842.3
R3100.413844.5
R4100.653843.1
R5105.683840.8
Table 2. Characteristics of the seven samples used for acoustic wave propagation tests.
Sample CodeDry Mass (g)Diameter (mm)Density (kg/m3)Porosity (%)
S197.3038247015.19
S299.9438248016.50
S391.2738252015.86
S4100.3738256015.62
S5104.7738253015.98
S6104.9438254015.12
S797.4538254015.35
Table 3. Calculated values of Biot’s coefficient using Equations (8)–(10).
Empirical Equation Calculated Biot’s Coefficient
Equation (8)0.52–0.60
Equation (9)0.52
Equation (10)0.45
Disclaimer/Publisher’s Note: The statements, opinions and data contained in all publications are solely those of the individual author(s) and contributor(s) and not of MDPI and/or the editor(s). MDPI and/or the editor(s) disclaim responsibility for any injury to people or property resulting from any ideas, methods, instructions or products referred to in the content.