Article

Experimental Investigation on Deformation and Permeability of Clayey–Silty Sediment during Hydrate Dissociation by Depressurization

School of Engineering and Technology, China University of Geosciences, Beijing 100083, China
*
Author to whom correspondence should be addressed.
Energies 2023, 16(13), 5005; https://doi.org/10.3390/en16135005
Submission received: 16 May 2023 / Revised: 21 June 2023 / Accepted: 26 June 2023 / Published: 28 June 2023

Abstract

:
The sediments in the South China sea are mainly composed of clayey silt, characterized by weak cementation, low strength, and poor permeability. These characteristics lead to slow gas and water transport and low gas production efficiency in the production process, which is not conducive to reservoir stability. Therefore, this paper studied the influence of different factors on the displacement and permeability of hydrate-bearing sediments by using remolded cores from the South China Sea. It was found that, when the depressurization method was used for hydrate decomposition, the displacement change in sediments could be divided into three stages: depressurization stage, decomposition stage, and creep stage. During the decompression stage, sediment deformation was rapid and displacement was small. During the decomposition process of hydrates, sediment deformation was slow and displacement was maximum. The creep stage had the slowest deformation and the smallest displacement. The displacement increased with the increase in initial porosity, hydrate saturation, effective pressure, and depressurization amplitude. The permeability of the sediments was lower than that of the original sediments after hydrate decomposition. This permeability damage increased with the increase in the sediment porosity, hydrate saturation, depressurization range and effective pressure. Furthermore, the displacement of sediments was positively correlated with the permeability damage.

Graphical Abstract

1. Introduction

Natural gas hydrate (NGH) is a potentially favorable resource with the advantages of wide distribution, large storage capacity, high energy density, and high cleanliness [1,2]. They are mainly found in oceanic continental slopes, permafrost, and the Arctic [3].
In hydrate-bearing sediments, gas hydrates can also be used to cement sediment particles in addition to being part of the sediment solid skeleton [4]. The formation of gas hydrates hardens the reservoir sediments and the decomposition of the hydrates reduces the shear strength of the sediments [5], which leads to significant deformation of the sediments and wellbore instability [6,7]. Therefore, the deformation of gas hydrate deposits has important implications for reservoir stability during production and it is important to understand the mechanical properties of hydrate deposits. It was found that the decomposition of hydrate can lead to changes in the strength and stiffness of the reservoir. Triaxial tests show that the mechanical properties of hydrate are affected by many factors. The initial confining pressure or consolidation stress can significantly affect the mechanical behavior of the hydrate-bearing sediments at low hydrate saturation [8]. Furthermore, the strength and stiffness of the samples also increase when the hydrate saturation increases [9], and the stress–strain relationship is enhanced [10]. The lateral deformation and Poisson’s ratio in coarse grained sand are larger compared with fine grained sand [11]. With the increase in temperature or the decrease in water pressure, the cohesion and friction angle of hydrate-bearing sandy sediments decrease with increasing dilatancy [12]. Li et al. studied the deformation and strength characteristics of hydrated kaolin synthesized by ice seeding method under high and low confining pressures. When the confining pressure is less than 5 MPa, the shear strength of the specimen is positively related to the confining pressure and the confining pressure will inhibit the deformation of the specimen. Under high confining pressure, the shear strength of the sample increases slowly with the increase in confining pressure [13]. Nariai and Ohmura studied the compressive strength of CO2 hydrate [14] and THF hydrate [15], and found similar results to methane hydrate. The compressive strength of hydrate increases with the increase in confining pressure. Hyodo et al. carried out triaxial shear tests on synthetic natural gas hydrate deposits made of Toyoura sand, and systematically studied the effects of effective confining pressure, pore pressure, hydrate saturation, temperature, and density on the strength and deformation characteristics of the deposits [16,17,18]. Through research, we found that the classical triaxial tests mostly study the deformation characteristics and strength characteristics of hydrate-bearing sediments under specific hydrate saturation conditions [19]. Due to the real-time changes in hydrate saturation during hydrate decomposition, it is relatively difficult to analyze the sediment deformation during hydrate decomposition.
In addition, permeability is one of the most important parameters in quantifying flux and determining the economic feasibility of gas production in hydrate [20,21]. Permeability determines the distribution of gas hydrates, and free gas and water [22,23], and the hydrate concentration and accumulation [24]. In the process of gas hydrate exploitation, since gas hydrate is a non-flowing solid occupying the seepage channel [25], therefore, the formation and decomposition of gas hydrate will lead to significant permeability changes, which will affect the production efficiency of gas energy in the hydrate reservoir [26,27]. According to the research, sediment particle size, hydrate saturation, porosity, and other factors affect the permeability of porous samples [28,29,30,31,32,33]. As for permeability studies at present, there are many studies on sand filling, artificial sandstone, and clay filling. However, more than 90% of the global hydrate resources exist in fine-grained hydrate reservoirs [34]. The seepage characteristics of clay and sandy sediments are different [35,36] due to their different properties. At present, the mechanism of permeability variation in clayey–silty sediments containing hydrate is not very complete. According to the literature, the decomposition of hydrates can lead to the expansion and contraction behavior of clay. Compared to sand, clay can cause permeability damage through its unique water sensitivity and expansion mechanism [37,38]. Wu et al. [39] defined permeability damage in terms of the percentage of permeability loss when the effective stress increases. Jing et al. [40] used the maximum permeability damage rate and the permeability damage rate respectively to represent the range of permeability reduction and the degree of recovery of hydrate sediments. The reduction of permeability in hydrate sediments increases with an increase in the maximum permeability damage rate. Furthermore, an increase in permeability damage rate leads to a worse permeability recovery degree of hydrate sediment.
In 2017, China conducted the first pilot production in the Shenhu area of the South China Sea. From 2019 to 2020, the China Geological Survey conducted another production test in the Shenhu Sea area. The second production is located in the Shenhu area on the north slope of Baiyun Sag in the Pearl River Mouth Basin in the north of the South China Sea. Baiyun Sag has good gas production conditions. The hydrate pilot production area is mainly hosted in quaternary clayey silt or unconsolidated sediment of silty mud. In this paper, the displacement and permeability of the clayey–silty hydrate deposits in the Shenhu area of the South China Sea are studied. Due to the strong creep characteristics of the hydrate reservoir [41], an experimental device for measuring sediment deformation and permeability was designed in this paper. The hydrate-bearing sediment decomposition experiments were carried out with different influencing factors by decompression method.

2. Experiments

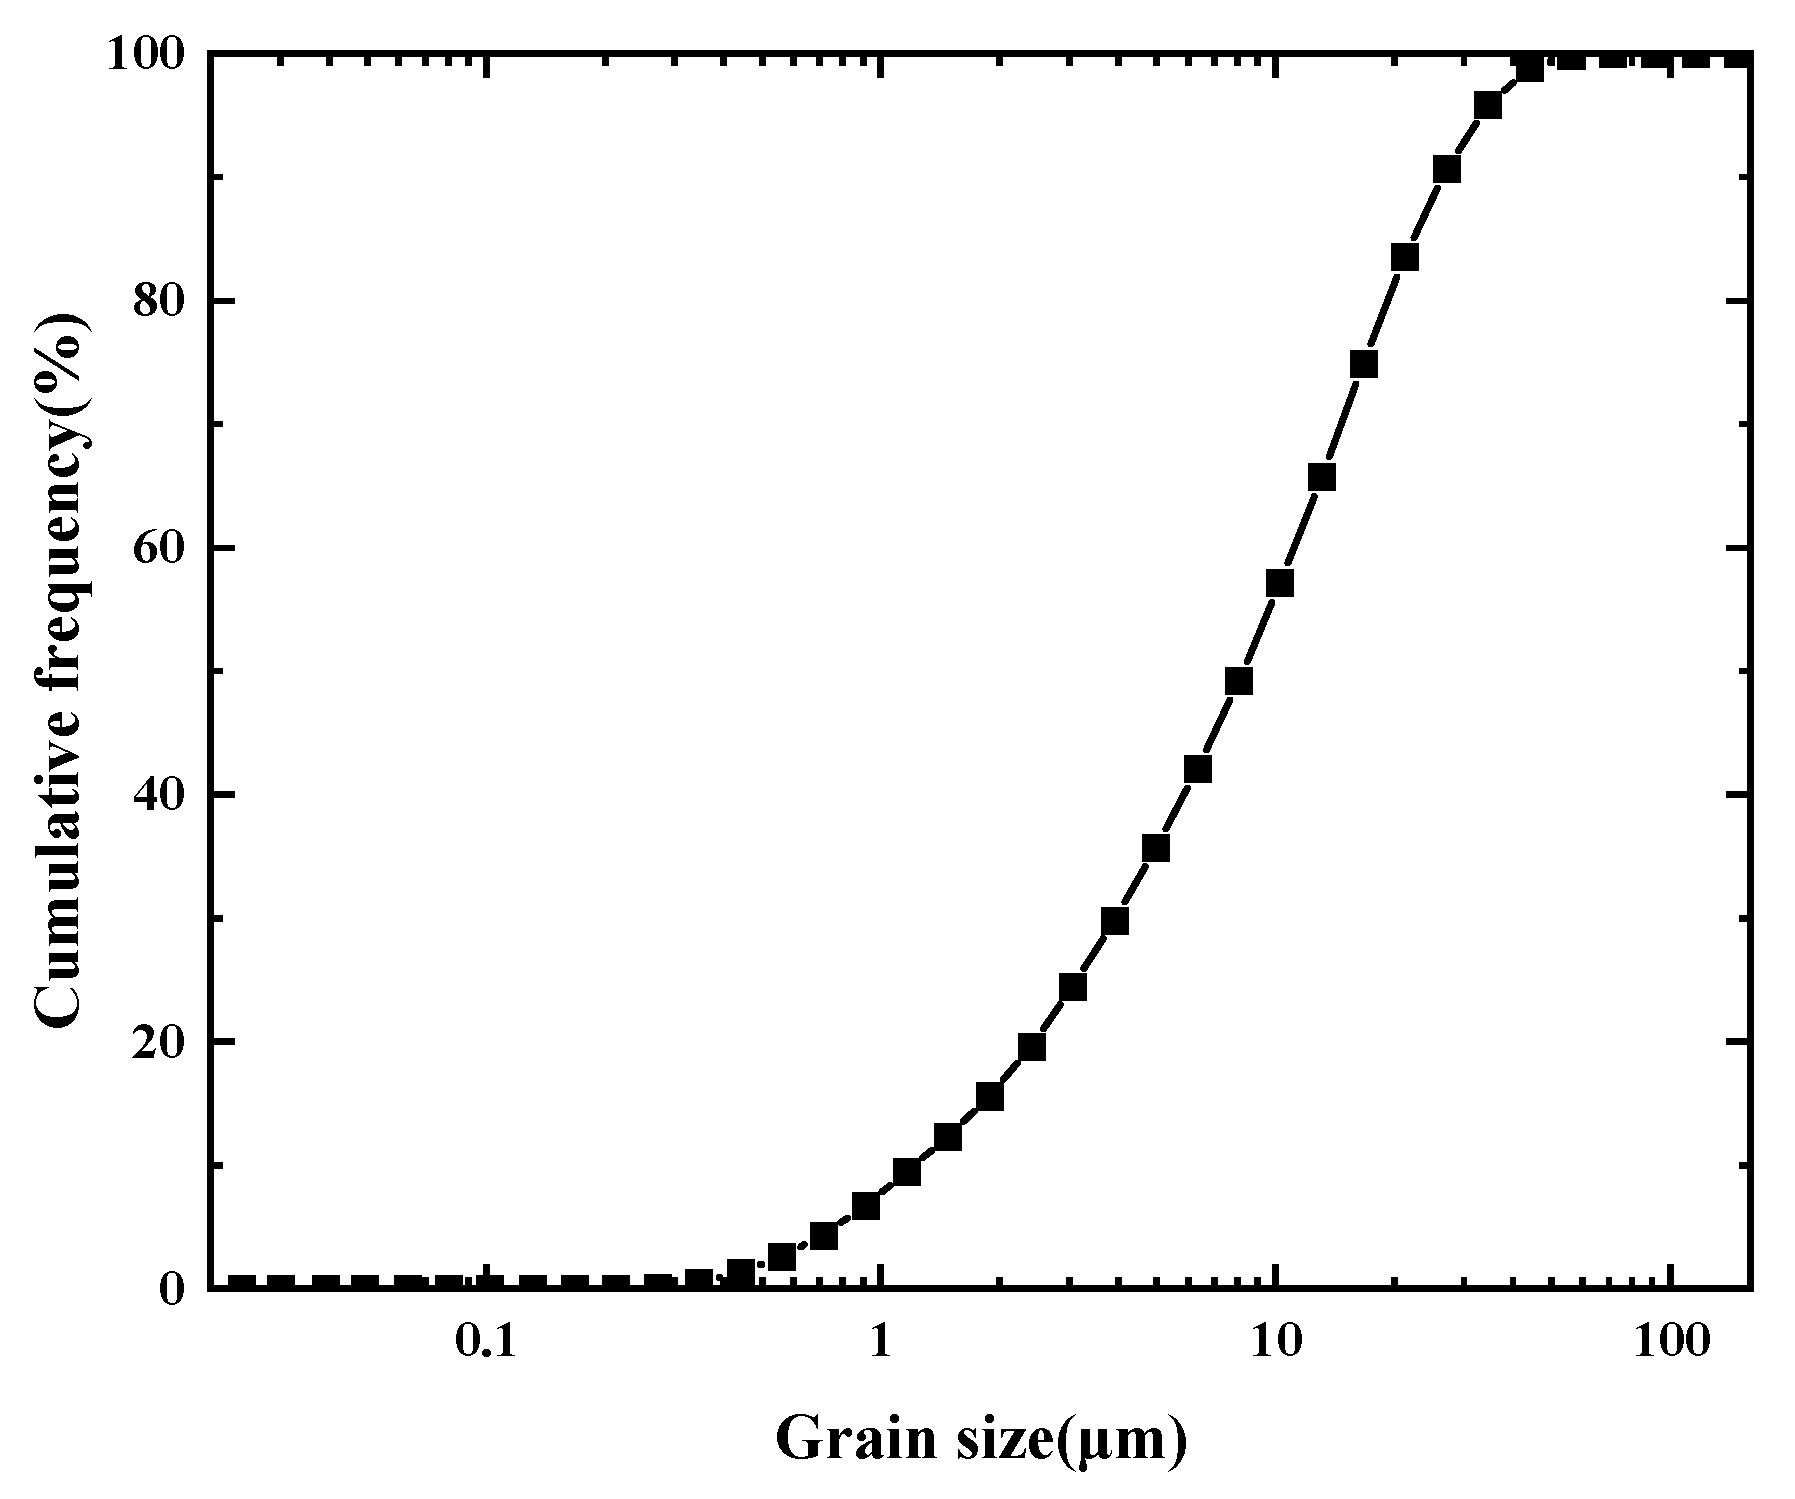
2.1. Experimental Materials

The clayey–silty sand reservoirs in the South China Sea are mainly composed of clays (<4 μm) and fine sands (4–64 μm) [42]. According to the actual geological exploration data of w17 station where shsc-4, the first hydrate pilot production well in the South China Sea in 2017, is located, the average particle size of sediments is about 12 μm. It mainly contains quartz and feldspar (53%), carbonate (16%), and clay minerals composed of montmorillonite and illite (26–30%) [43].
The comparison of parameters between the sediments used in this study and the in situ sediments of the South China Sea is shown in Table 1. The grain size distribution of sediment is shown in Figure 1. Distilled water was used in the experiment.

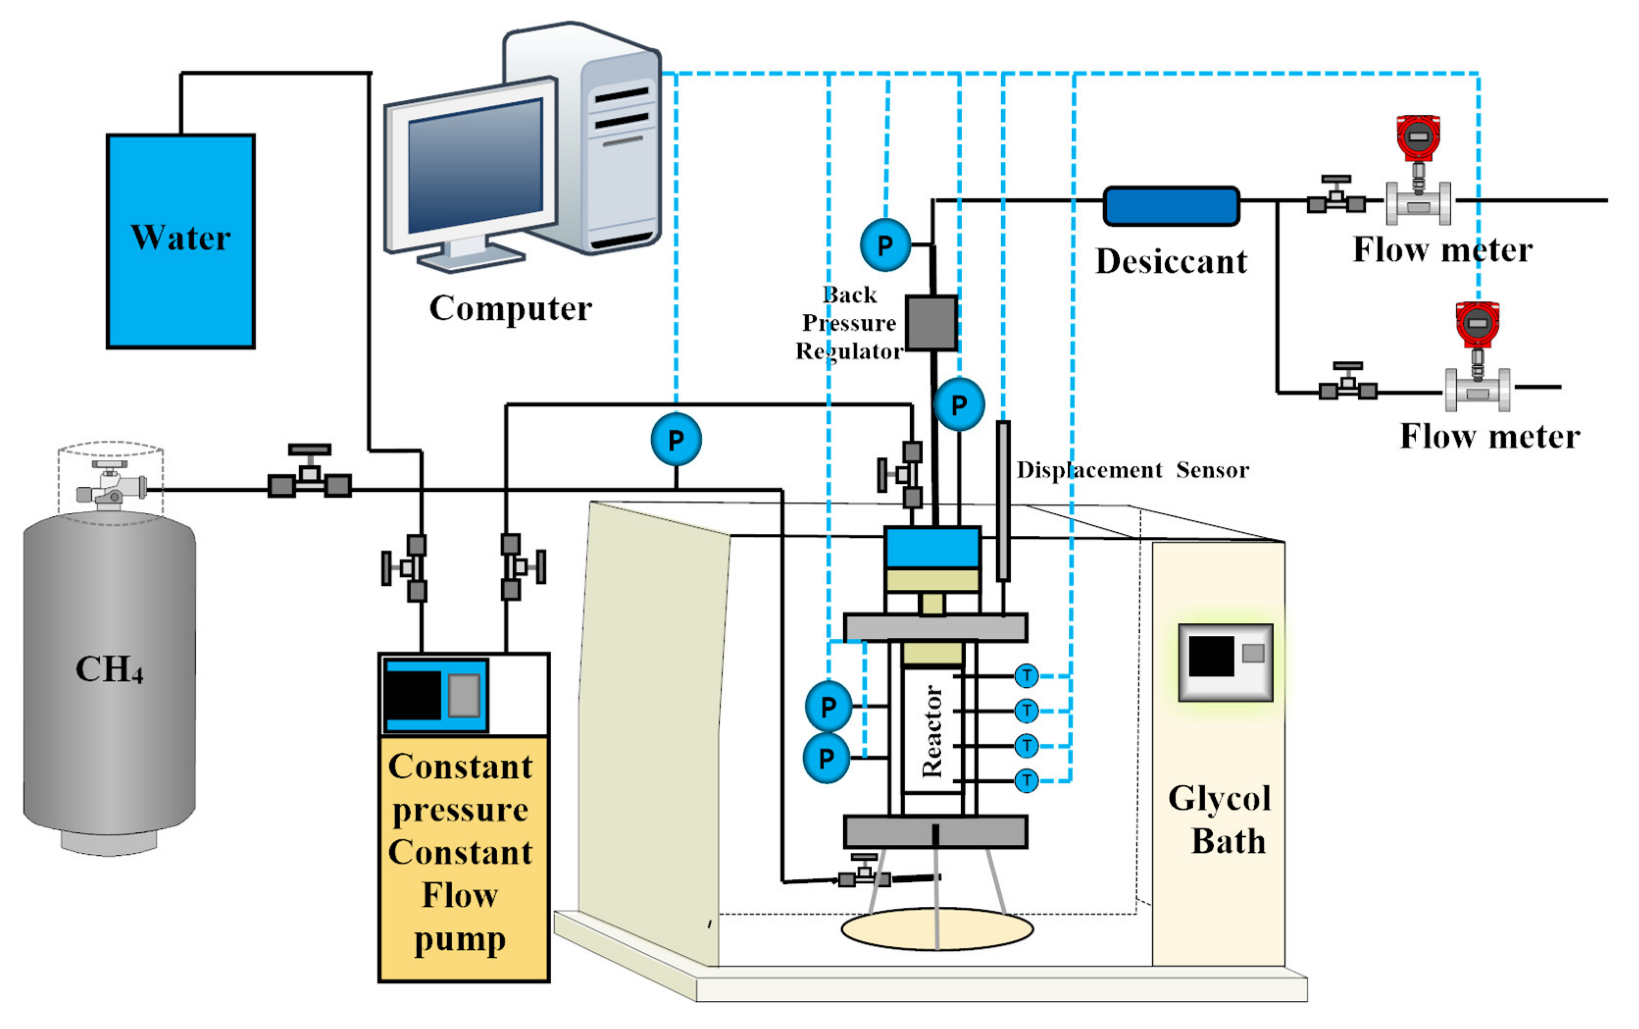
2.2. Experimental Apparatus

Figure 2 shows a schematic diagram of the apparatus used in this study to research the displacement and permeability of methane hydrate deposits during hydrate formation and decomposition. The device is made of 316 pieces of stainless steel and forms a cylindrical reactor with a working pressure of up to 30 MPa, with a diameter and maximum depth of 50 mm and 120 mm, respectively. In this study, the device could simulate the temperature, pore pressure, and overburden pressure conditions for hydrate formation. The experimental device is mainly composed of an upper piston, a middle reaction chamber, and a lower base. The piston is located at the top of the high-pressure reactor. The top of the piston is subjected to the pressure of constant pressure and constant flow pump, and the bottom of the piston is in contact with the sample under water pressure to simulate the pressure of the cover layer. In the radial direction of the specimen, the deformation of the specimen in this direction is completely limited by the metal wall of the reactor. It is assumed that the submarine reservoir is treated as a semi-infinite body; therefore, the horizontal deformation of the reservoir is 0 at any depth, that is, there is no radial deformation state. Therefore, it can be considered that the deformation and force in the axial direction and radial direction of the reactor are in line with that of the submarine reservoir, and only the axial stress on the hydrate sample needs to be considered. The upper piston is connected to the displacement sensor, which can measure the displacement data of the sample during the experiment. Four temperature sensors and two pressure sensors are distributed averagely in the middle reaction chamber to measure the temperature and pressure data, and the gas injection pipe is connected to the base. The experimental temperature is controlled by the water bath (range: −120 °C~300 °C. Model: ATPIO XODC-2050). The methane gas (99.9%) used in the experiments is supplied by the Beifang Special Gas Industry Corporation in China (located in Beijing). All the temperature and pressure data during experiments are measured by the temperature sensors (range: −50 °C~120 °C) and pressure sensors (range: 0~25 MPa) with accuracy of 0.1 K and 0.01 MPa, respectively. A back pressure valve (max in: 2500 PSI) is used to control the sample permeability measurement and the production pressure. In order to collect the gas precisely at the depressurization stage, two types of flow meters are adopted with the maximal measuring range of 200 mL and 5 L. The temperature, pressure, and displacement of the sample as well as the volume of gas production are recorded in real time using the data acquisition system and shown on the computer.

2.3. Experimental Procedure

The experimental process included two stages, which were gas hydrate in situ formation and depressurization decomposition.

2.3.1. Gas Hydrate In Situ Formation Stage

The samples were prepared by in situ synthesis where the diameter and height were 50 mm and 100 mm, respectively. Therefore, the sample volume was 196.25 cm3, the pore volume was 196.25n and the sediment volume was 196.25 (1 − n) when the preset porosity was n. In this paper, the volume fraction was 54% for quartz sand, 10% for montmorillonite, 20% for illite, and 16% for carbonate. Therefore, the volume of quartz sand was 105.975 (1 − n), montmorillonite was 19.625 (1 − n), illite was 39.25 (1 − n), and carbonate was 31.4 (1 − n). Because quartz sand has a density of 2.65 g/cm3, clay has a density of 2.75 g/cm3 and carbonate has a density of 2.7 g/cm3. The mass of quartz sand was 280.834 (1 − n), the mass of montmorillonite was 53.969 (1 − n), the mass of illite was 107.938 (1 − n), and the mass of carbonate was 84.78 (1 − n). When the preset water saturation was S, the volume of distilled water was 196.25nS, so the mass of distilled water was 196.25nS. The sediment and distilled water were mixed and put in a sealed bag, and the mixed sediments were placed in a glass jar to moisturize overnight. Then the sediments were taken out and poured into a 50 mm diameter sampler, and the surface flattened. Lastly, the sediments were pressed to a height of 100 mm under static pressure to obtain a sample with a predetermined porosity. Then the sample was filled into the reactor.
In this paper, the experimental design method of controlling variables was used and a total of 7 sets of experiments were carried out to study the effects of sediment porosity, hydrate saturation, effective pressure, and production pressure on the displacement and permeability of clayey-silt sediments. The key parameters are detailed in Table 2.
After filling the samples, the rest of the reactor was installed and the airtightness was subsequently checked. The effective permeability of the sample was measured before hydrate formation and recorded as K1. The permeability could be obtained by the following equation [44]:
K = 2 P 0 Q 0 L μ A ( P 1 2 P 2 2 ) × 1000
where K is the permeability (10−3 µm2), P0 is the atmospheric pressure (0.1 MPa), Q0 is the flow that gas goes through an arbitrary interface under atmospheric pressure (mL/s), L is the flow length (cm), µ is the gas viscosity (mpa·s), A is the cross-sectional area (cm2), and P1 and P2 are the absolute pressure at the inlet and outlet section.
Then, the methane gas was injected into the reactor and the temperature of the water bath set to 0.1 °C to prevent water from freezing. The hydrate formation could be considered complete when the temperature and pressure of the reactor did not change for several hours. Recording current data on temperature and pressure, hydrate saturation was calculated by the following equation:
n H = P 1 V g Z 1 T 1 R P 2 V g Z 2 T 2 R
S H = n H M H ρ H V pore
where P, Z, T are the data of gas pressure, gas compressibility factor, and sample temperature, respectively. Subscript 1 indicates the state before the hydrate formation, namely, after injecting methane and adjusting the temperature. Subscript 2 indicates the state that the hydrate has been formed. Vg is the volume of the gas phase in the reactor. R is the gas constant. nH is the amount of consumed gas, namely the amount of formed hydrate. SH is the methane hydrate saturation. MH is the molar mass of methane hydrate. ρH is the density of methane hydrate. Vpore is the volume of the pore space in the sample.

2.3.2. Depressurization Decomposition Stage

The constant flow and constant pressure pump were turned on after the methane hydrate formed, and the pressure of the pump was according to the initial effective pressure of different experimental groups. Due to the different cross-sectional areas of the upper and lower pistons, there is a conversion relationship between the pump pressure and the overlying pressure borne by the sample, as shown in Equation (4). Furthermore, the relationship between the overlying pressure and the effective pressure is determined based on the principle of effective stress, as shown in Equation (5).
P pump = 0.447 P up + 41
P up = P e + P pore
where Ppump is the pump pressure (KPa), Pup is the overlying pressure (KPa), Pe is the initial effective pressure (KPa), and Ppore is the pore pressure (KPa).
There was an instant change in sample displacement as pump pressure increased. The current displacement value was recorded as L1 and the decompression decomposition process was carried out when the displacement no longer changed. First, the flow meter was adjusted and the production pressure set by the back pressure valve, then the outlet valve was opened and the displacement value at this time recorded as L2 after the system pressure dropped to the production pressure. Subsequently, the hydrate gradually decomposed and the displacement change in the sample was recorded. The hydrate decomposition ended when the gas production rate was 0 and the displacement value at this time recorded as L3; then, the outlet pressure valve was closed. The displacement of the sediment was monitored within 12 h after the end of hydrate decomposition and the final displacement recorded as L4. Finally, the permeability of the current sample was measured and recorded as K2.
During the experiment, the sediment displacement could be divided into three stages: the displacement in the depressurization stage, the displacement in the hydrate decomposition stage, and the displacement after decomposition. They could be calculated by the following equations:
L d = L 1 L 2
L h = L 2 L 3
L a = L 3 L 4
where Ld is the displacement during the period of the depressurization stage, Lh is the displacement during the period of the hydrate decomposition stage, and La is the displacement during the period of the stage after hydrate decomposition.
The entire displacement could be calculated by the Ld, Lh, and La. That is,
L = L d + L h + L a
Finally, the pressure of the reactor was reduced to atmospheric pressure by releasing the residual gas.

3. Results and Discussion

The depressurization method promotes dissociation of CH4 hydrate by decreasing the pore pressure to production pressure at a specific temperature in order to break the phase equilibrium condition of the hydrate [45]. In the process of hydrate depressurization production, the reservoir is deformed due to the increase in effective stress, which would lead to reservoir instability. Therefore, in this experiment, axial pressure was applied to the clayey–silty sediments to simulate the overburden pressure of the reservoir, and to explore the response of sediment displacement and permeability.

3.1. Sediment Displacement

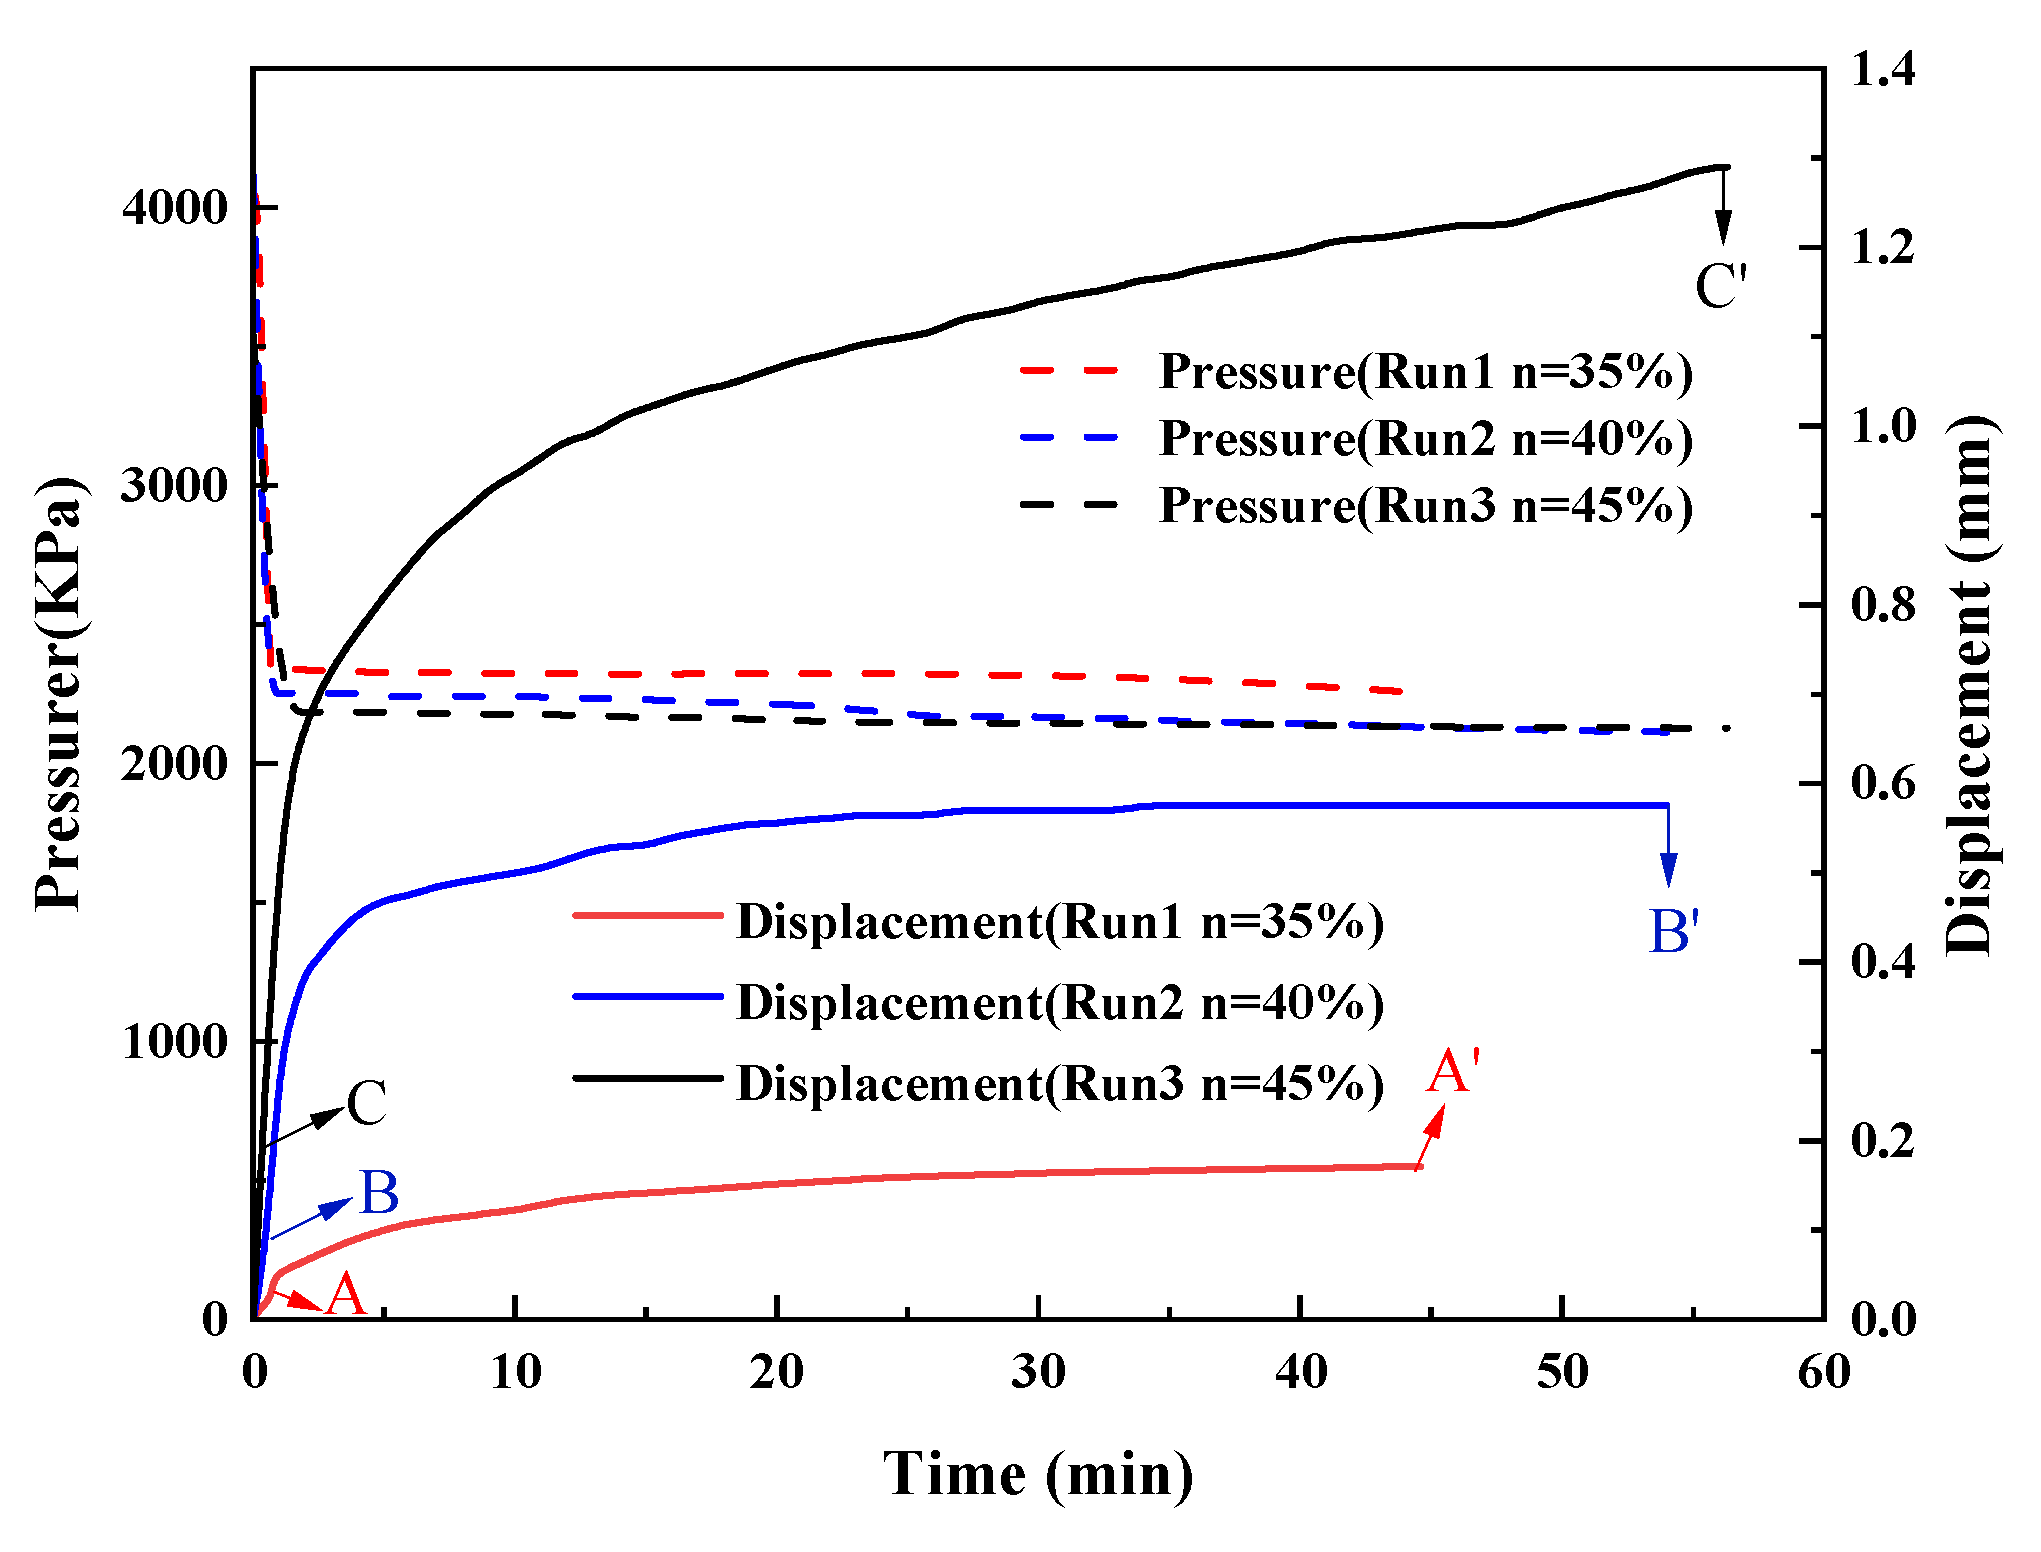
3.1.1. Effect of Sediment Porosity

Runs 1–3 investigated the influence mechanism of different sediment porosity conditions on the displacement of clayey–silty hydrate sediments. The changes in system pressure and sediment displacement of hydrate during decomposition by depressurization are plotted in Figure 3. As can be seen from Figure 3, the sediments underwent rapid deformation due to the increase in effective pressure during the period that the pore pressures were dropping down to the production pressures. The sediments were compressed when the pore space structure was changed and the vertical displacement of sediments increased significantly in a period of about 1 min. After this rapid deformation the displacements of specimens were 0.04 mm (point A), 0.085 mm (point B), and 0.16 mm (point C), respectively. Then, the system pressure was maintained near the production pressure and the hydrates began to decompose gradually. The system pressures dropped sharply in a short time at the initial stage of decomposition, which made the driving force of decomposition sufficient and the reaction violent. Due to the weakened supporting effect of hydrates on sediments in the process of decomposition, the strength of sediments decreased and pore structures were further compressed; therefore, the deformation rate of sediments was maintained at a high level. With the process of hydrate decomposition, the deformation rates of Runs 1–3 began to decrease, which may be because the hydrate decomposition is an endothermic process; the samples’ strength will be higher at a lower temperature; therefore, the samples’ deformation became slow [17,46]. At the end of hydrate decomposition, the displacement changes in Run 1 (point A′) and Run 2 (point B′) were basically stabilized, while the displacement of Run 3 (point C′) was still increasing. This may be because of the large porosity of sediment, accompanied by loose particles deposited, and the resistance of the sediment itself to pressure is relatively scarce. Under the same external load, there will be larger deformation and longer response time of specimens with a large porosity.

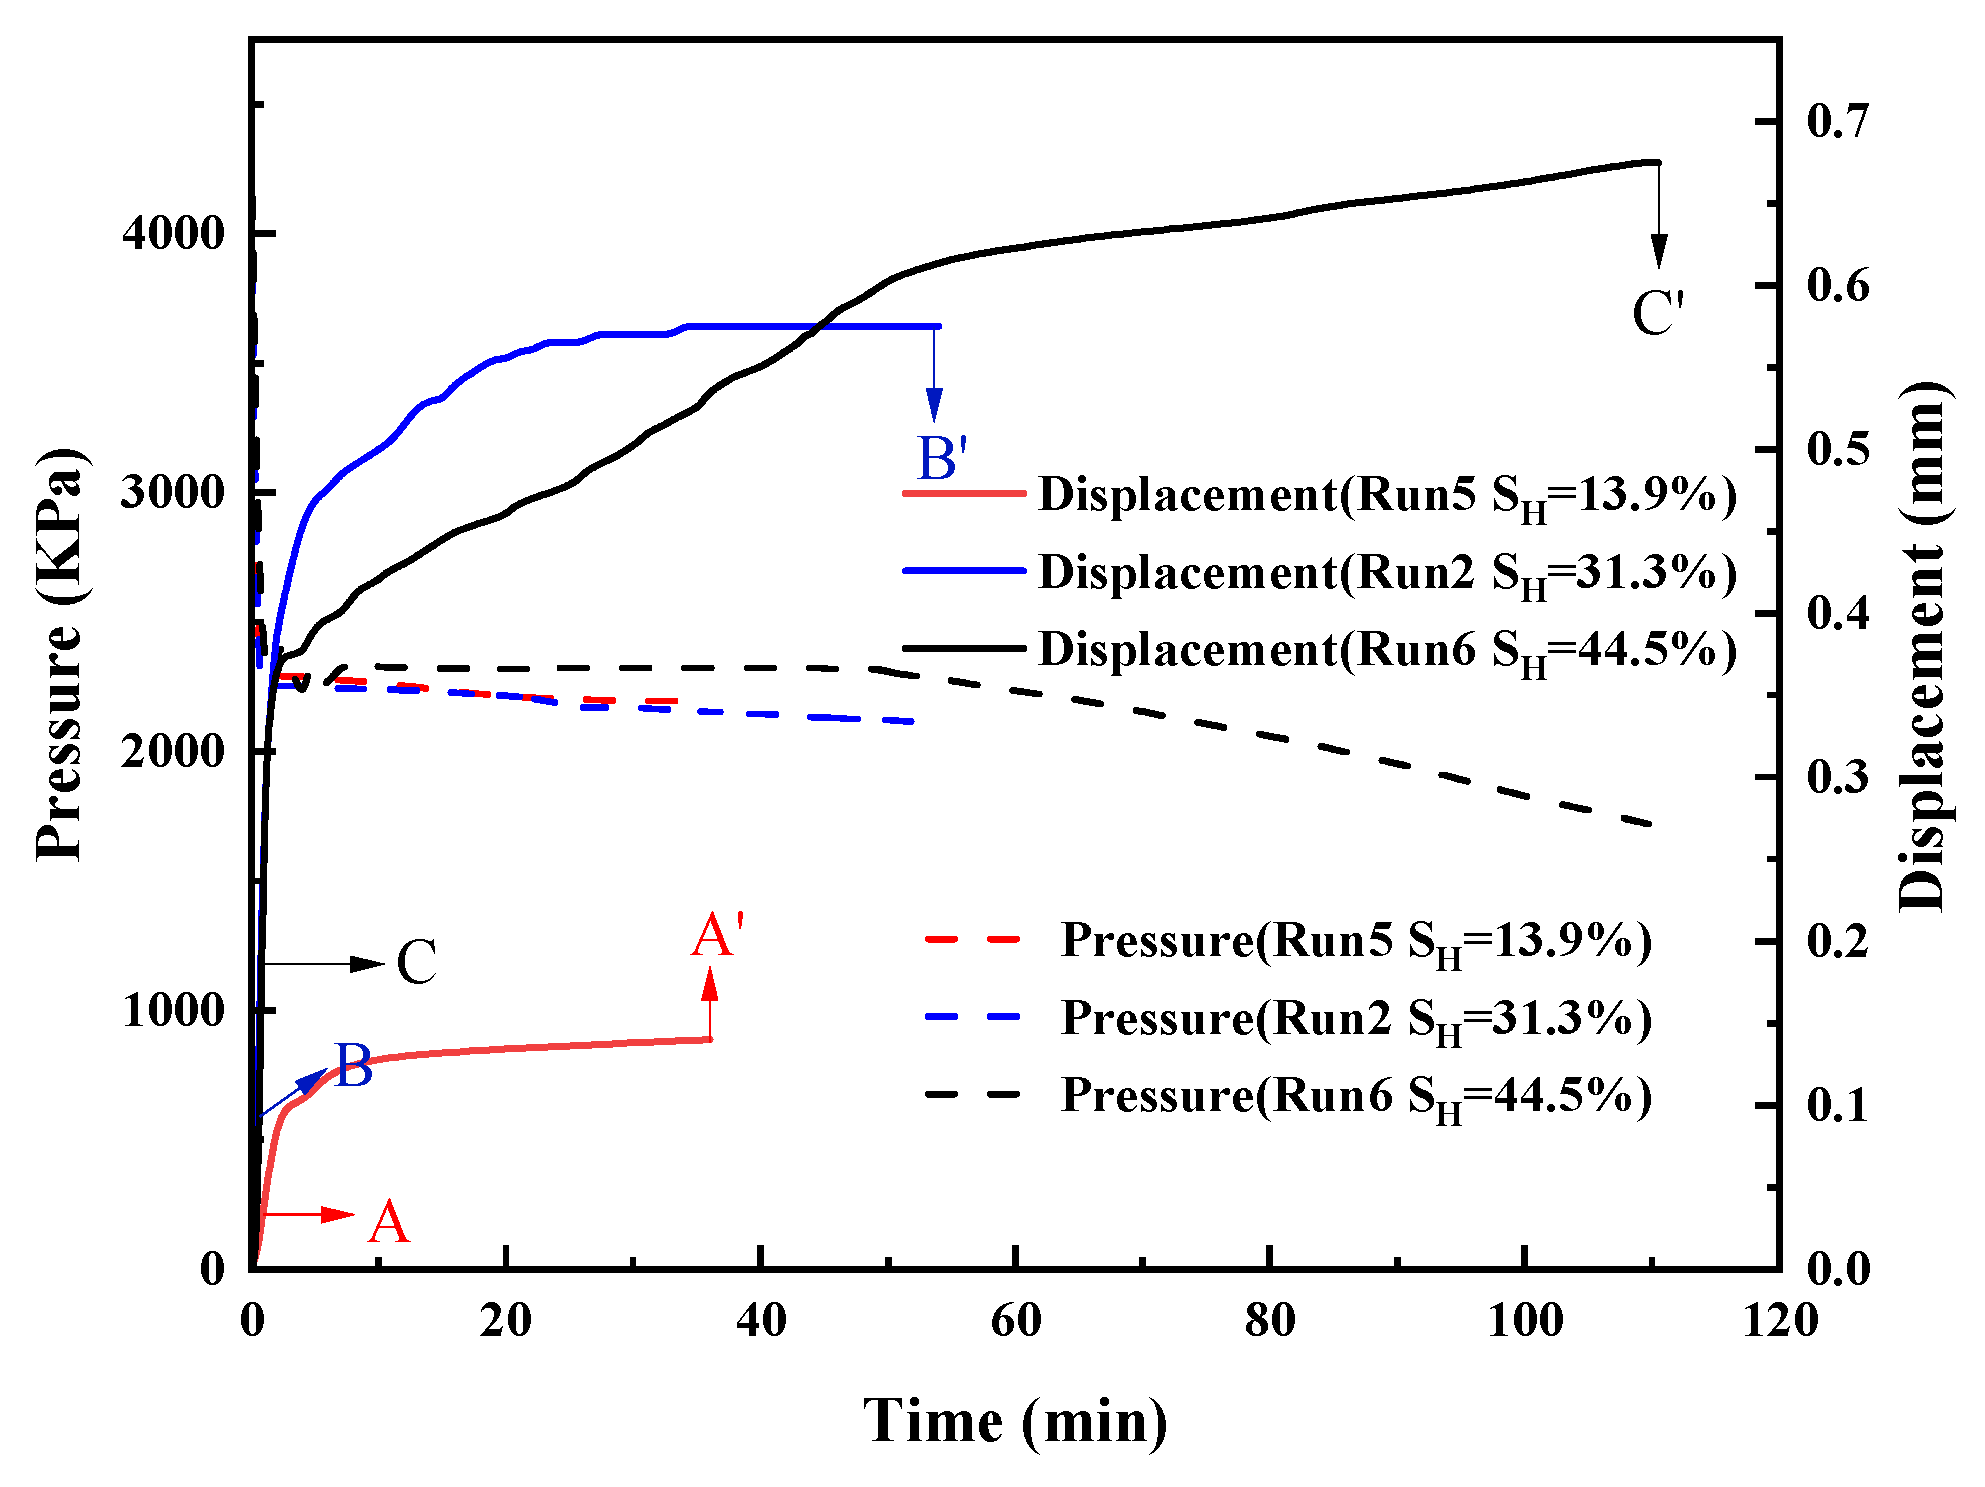
3.1.2. Effect of Hydrate Saturation

Runs 4, 2, and 5 studied the influence mechanism of different hydrate saturation conditions on the displacement of clayey–silty sediments. Figure 4 shows the changes in system pressure and displacement of hydrate during decomposition by depressurization. It can be found from the picture that the displacement increased linearly with the increase in time at the initial depressurization stage and the sediments deformed largely in about 1 min. The displacement of Run 4 (point A) was 0.045 mm, Run 2 (point B) was 0.085 mm, and Run 5 (point C) was 0.175 mm. In about 3 min, the initial violent decomposition stages ended and the deformation rate began to decrease. As can be seen from the figure, it takes longer to decompose with the increase in hydrate saturation. This is because the higher the hydrate saturation is the smaller the contact area between hydrate and free water and gas, and the slower the decomposition rate is. In addition, hydrate would block the gas–water seepage path with a high saturation, which leads to poor permeability and prolongs the response time.
It can also be seen from Figure 4 that, when the hydrate saturation was 44.5%, the sediment deformation rate was slow during the process of hydrate decomposition and, when the hydrate decomposition ended (point C′), the sediment deformation continued. This may be because the strength of gas hydrate sediments increases with the increase in hydrate saturation [47,48]; in addition, because the hydrates blocked the seepage path, that resulted in the slow decomposition rate and slow deformation. Moreover, when the hydrate saturation was 44.5%, the amount of water production was greater. The clay particles expanded because of their hydrophily. With the continuous enhancement of hydration expansion, the strength of sediments decreased significantly. Hence, the sediment deformation was large and lasted longer under the effective pressure. The displacement of sediment with the hydrate saturation was 13.9% reaching a stable state earlier (about 10 min). A possible reason for this phenomenon is that there are a few influences the hydrate has on sediment strength with a low hydrate saturation. Therefore, the sediment displacement reaches a stable state earlier under the effective pressure.

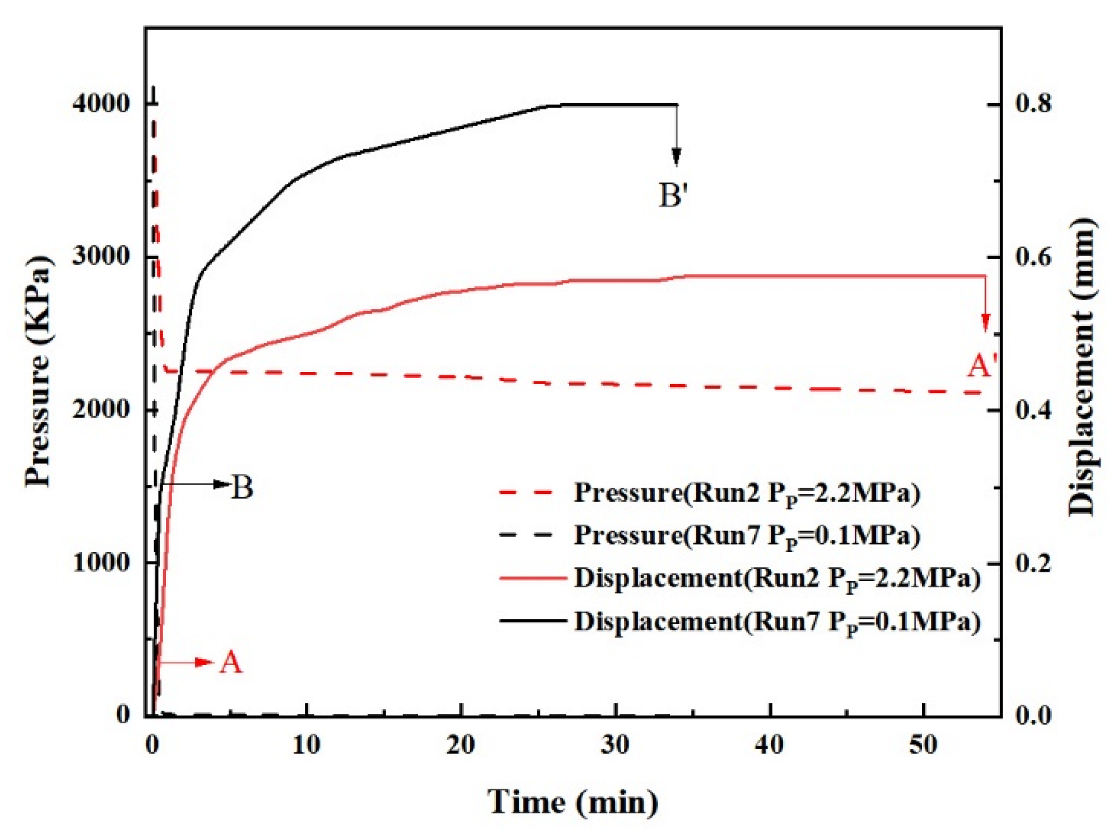
3.1.3. Effect of Production Pressure

Run 2 and Run 6 researched the displacement evolution mechanism of clayey–silty sediments under different production pressures. Figure 5 shows the changes in system pressure and sediment displacement during the process of hydrate decompression decomposition. The deformation of sediments went through the same stages as the previous experimental group according to the variation curves plotted in Figure 5.
It can be seen from the figure that the sediment displacement in Run 6 was larger than that in Run 2. This is because the hydrate-bearing sediment bears greater effective pressure when the production pressure is lower. Moreover, Run 2 took more time to decompose hydrate than Run 6. This is because there is a large difference between the reservoir temperature and the ambient temperature when the production pressure is lower; a large temperature difference accelerates the hydrate decomposition.

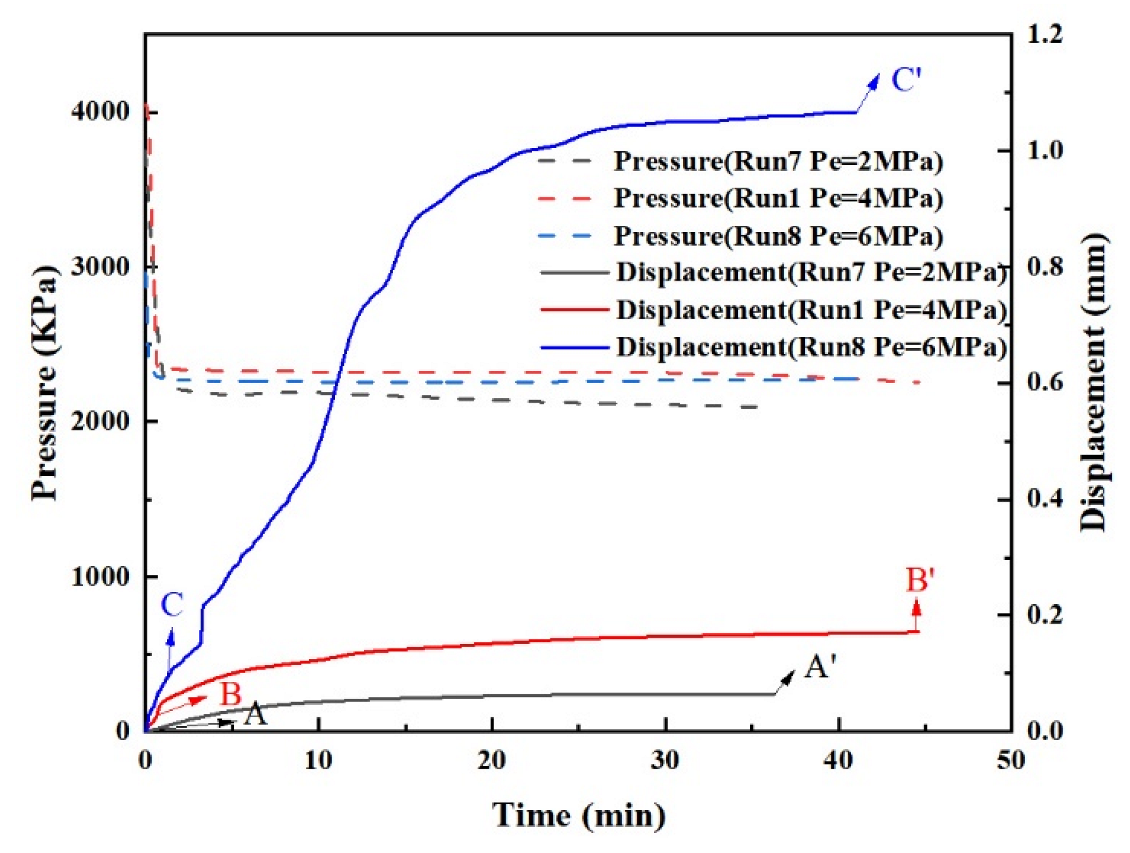
3.1.4. Effect of Effective Pressure

Run 7, Run 1, and Run 8 studied the influence mechanism of initial effective pressure on the displacement of clayey–silty sediments. Figure 6 shows the variation law of system pressure and sediment displacement during hydrate decompression decomposition. It can be found that the deformation rate of the sediments was maximum during the period of the initial pressure drop. Furthermore, the deformation rate decreased gradually and tended to be stable with the gradual decomposition of hydrate. It can also be found that the sediment displacement was much larger than Run 1 and Run 7 when the initial effective pressure was 6 MPa. A possible reason for this phenomenon may be that the ability of sediment to resist deformation decreases with the decomposition of hydrate, the sediment particles may be crushed under the action of higher effective pressure, and the sediment particles rearrange.

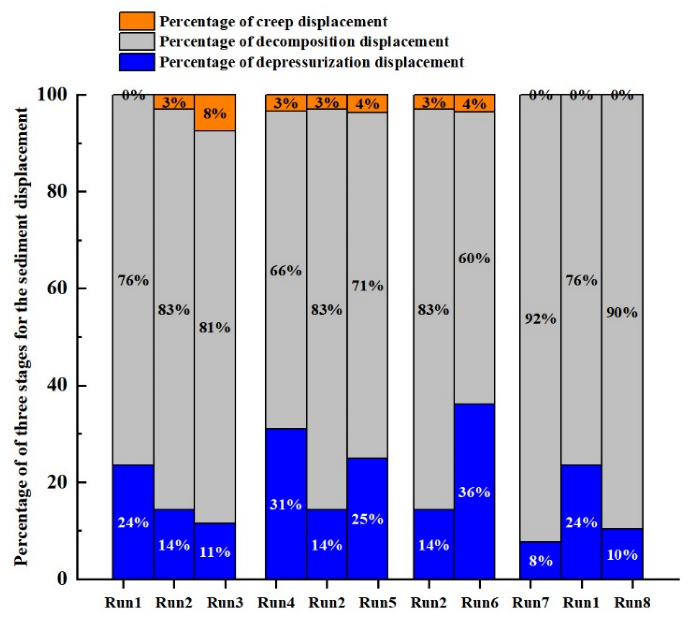
3.1.5. Displacement during Different Periods

The displacement of sediments within 12 h after hydrate decomposition was also measured in the experiment in order to consider the creep phenomenon of the clayey–silty sediments. As shown in Figure 7, creeps appeared in sediments except for Run 1, Run 7, and Run 8. That may be because the displacements reached the maximum value in the process of hydrate decomposition due to the low porosity of Run 1, Run 7, and Run 8; there were no sediment creeps measured. The contribution of creep displacement to the total sediment displacement was the smallest, less than or equal to 8%. The creep phenomenon may be because the water saturation of the sediments increased after the decomposition of hydrate and the clay particles had a greater expansion pressure [49] with the expansion of water, which resulted in the reduction in sediment strength. Moreover, the bound water could easily enter the clay mineral crystals to promote hydration expansion under the action of external pressure. Furthermore, with the continuous enhancement of hydration expansion, the strength of the sediments was also substantially reduced. The sediments continued to deform under the continuous effective pressure. As can also be seen from Figure 7, the total displacement of sediments is divided into three stages, namely, the displacement in the decompression stage, the displacement in the process of hydrate decomposition, and the creep displacement. Hydrate decomposition contributes the most to sediment displacement, the decompression stage is in the middle, and the creep stage contributes the least.

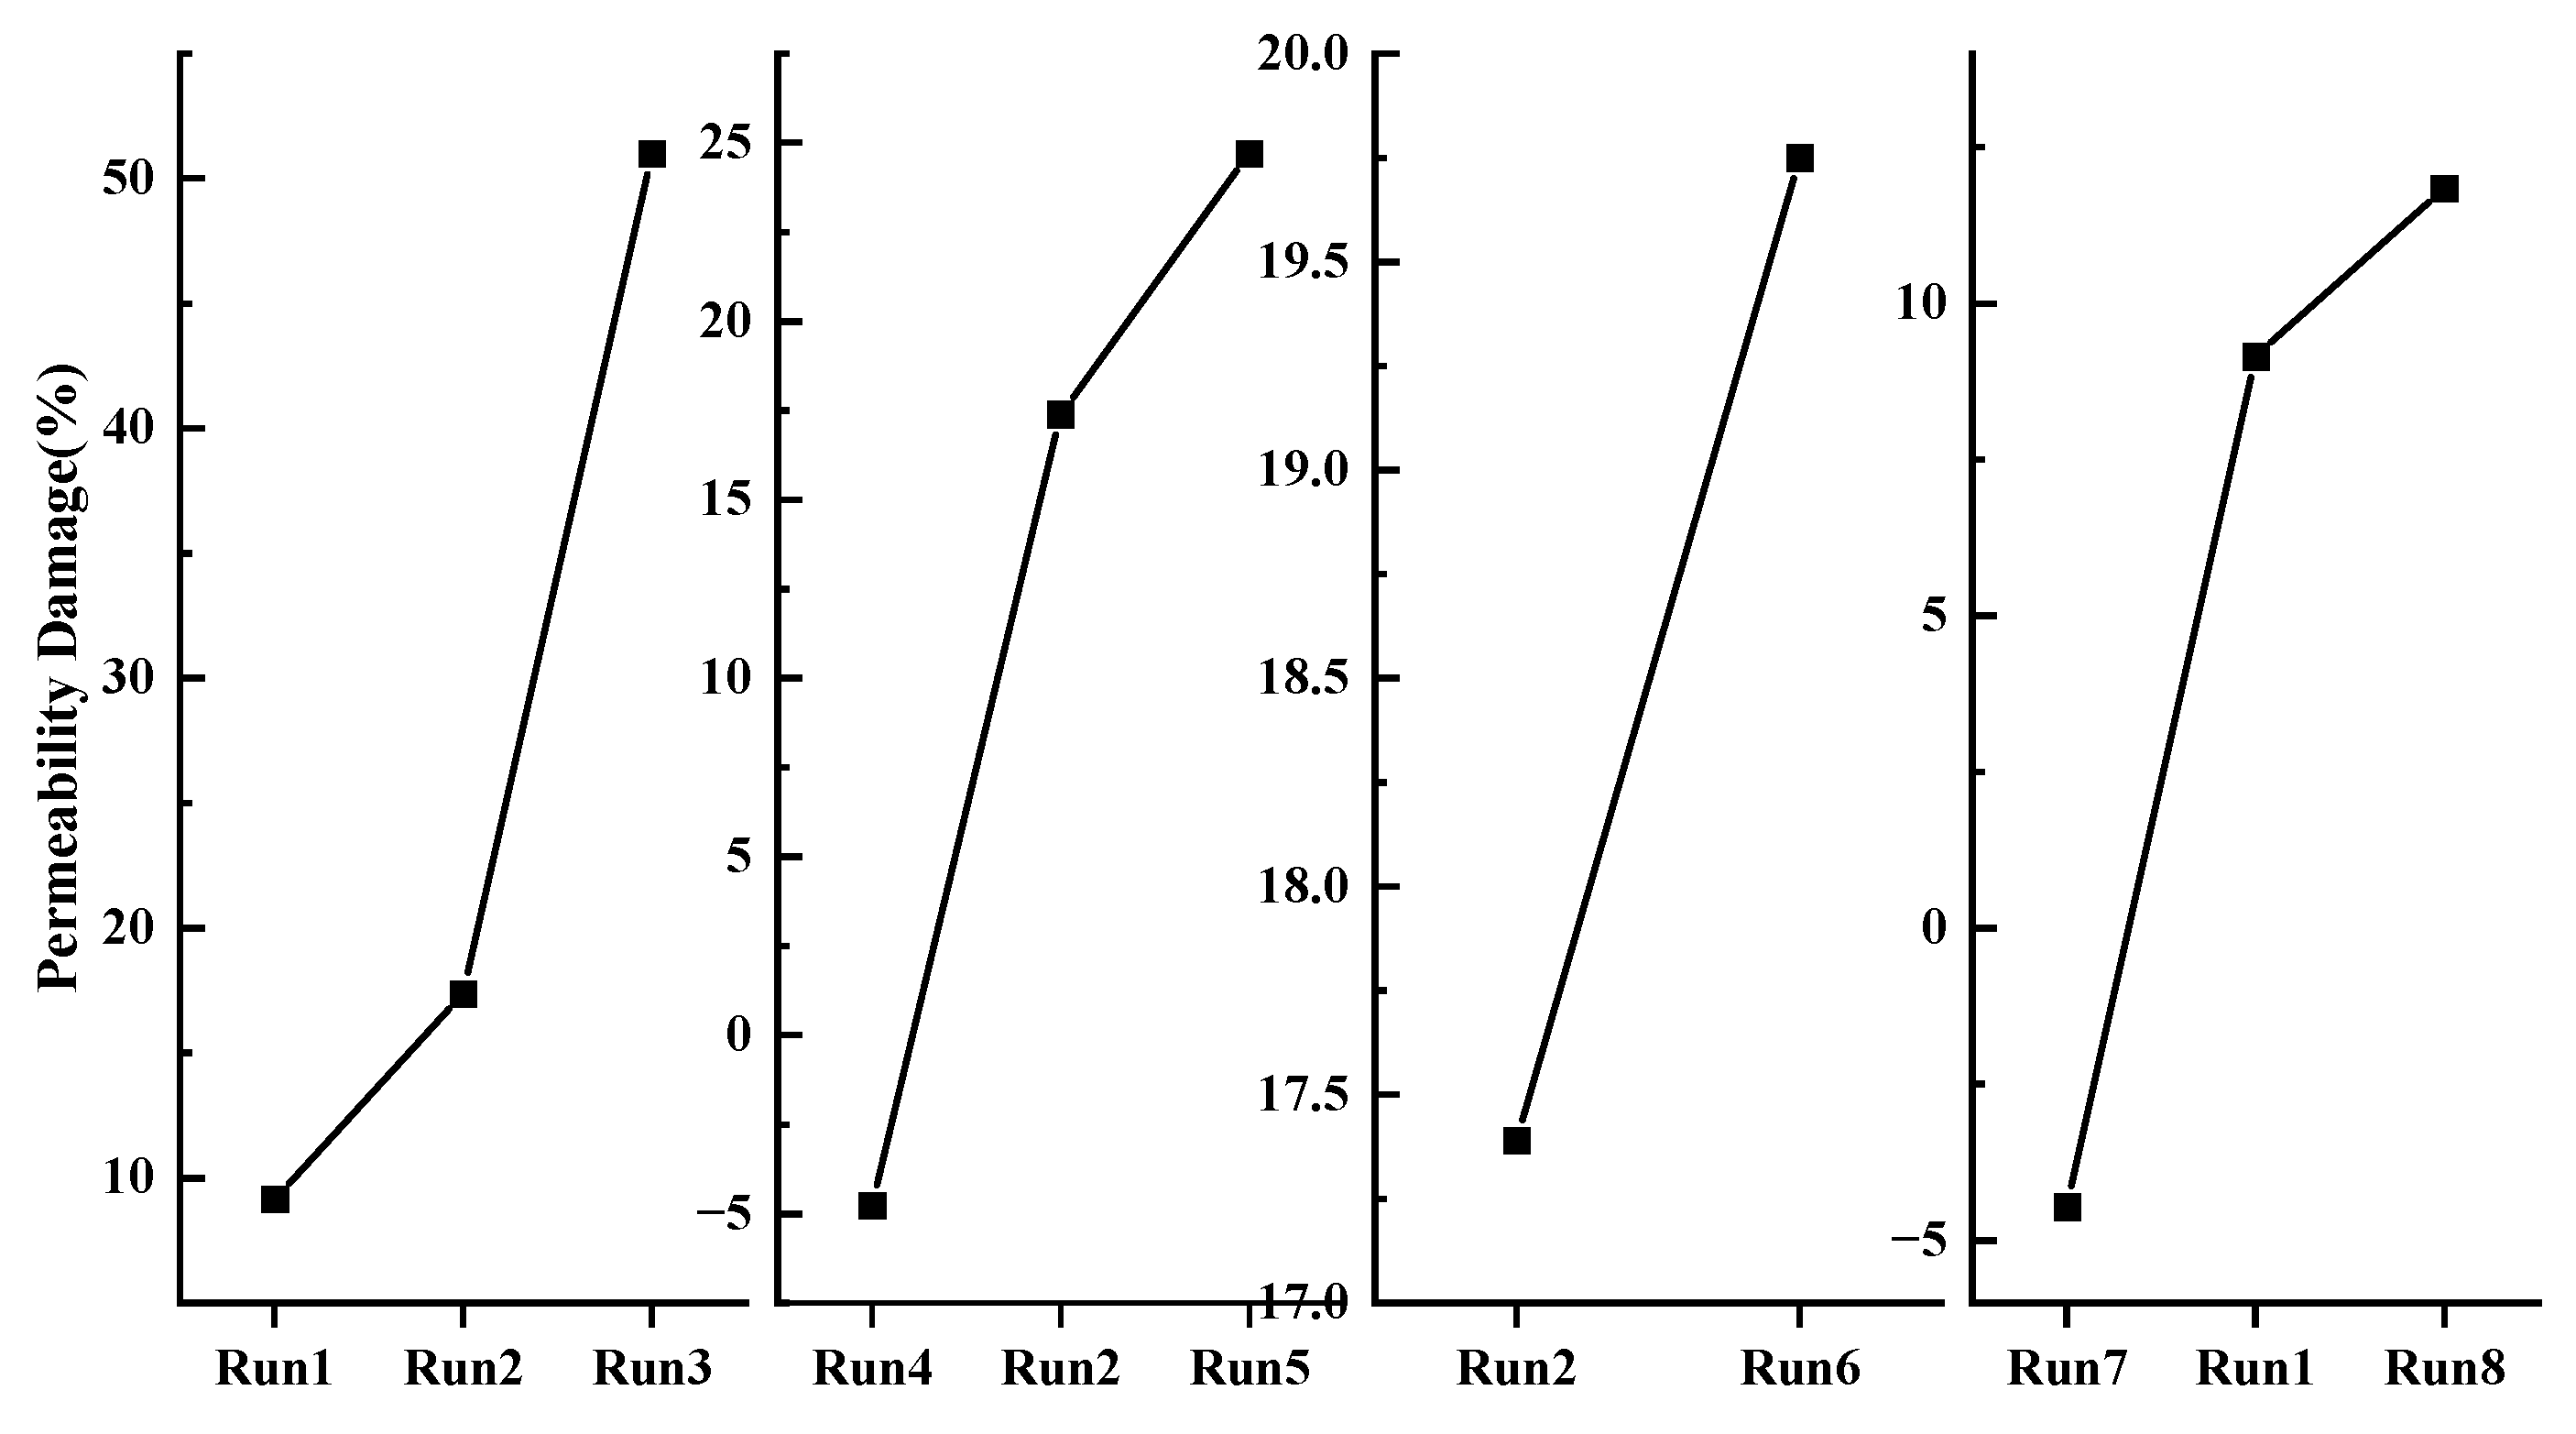
3.2. Sediment Permeability

The permeability of sediments is affected by the increase in effective pressure and the hydrate formation and decomposition process. As shown in Figure 8, the permeability of sediments decreased after the hydrate decomposed, except for the lower hydrate saturation and effective pressure. According to the discussion of displacement in Section 3.1, the displacement of sediments occurs due to the hydrate decomposition. Therefore, the seepage channel in the sediments is compressed, and the flow of gas and water in the sediments becomes worse and the permeability decreases. In addition, due to the unique water-sensitive effect of the clayey reservoir, water molecules are adsorbed on the surface of clay mineral particles such as montmorillonite and illite by electric field force, and gas flow in the clay is blocked as the water film becoming thick. Moreover, water molecules can easily enter the clay mineral crystals under the action of external pressure to promote hydration expansion, and the expansion of clay will also block the flow of gas and water, resulting in decreased permeability. It can also be seen from the figure that there are differences in the range of permeability damage in different experimental groups, which is expressed by the following dimensionless parameters:
K d = K 1 K 2 K 1
where Kd represents permeability damage, K1 represents the permeability of the original sediments, and K2 represents permeability after hydrate decomposition.
Figure 9 shows that, with the increase in sediment porosity, hydrate saturation, depressurization range, and initial effective pressure, the permeability damage also increased. After hydrate decomposition, the bound water wedged into the crystalline layer of soil particles, causing crystallization expansion and reducing the volume of pore space, thus damaging the permeability of sediments. In addition, there was great pressure generated by the expansion. When the system pressure is higher, part of the expansion pressure generated by the hydration expansion of clay can be offset [50] and the hydration expansion of clay is hindered. Therefore, the sediment permeability damage is less than that when the system pressure is lower. Meanwhile, the water saturation after hydrate decomposition is higher when the hydrate saturation is higher, and the contact area between clay and water expands, which accelerates the hydration expansion of sediments. In addition, the thickening of the bound water film could block the pore channel of sediments; hence, the permeability damage of sediments is greater when the hydrate saturation is higher. Due to the stress sensitivity of clayey reservoirs, when the sediment framework is subjected to a large effective pressure, the sediment pore space decreases, some pores close, gas and water flow is blocked, and the sediment permeability is greatly damaged. When the sediment porosity is higher, a large number of sediment pores are compressed under effective pressure and the permeability damage is greater.

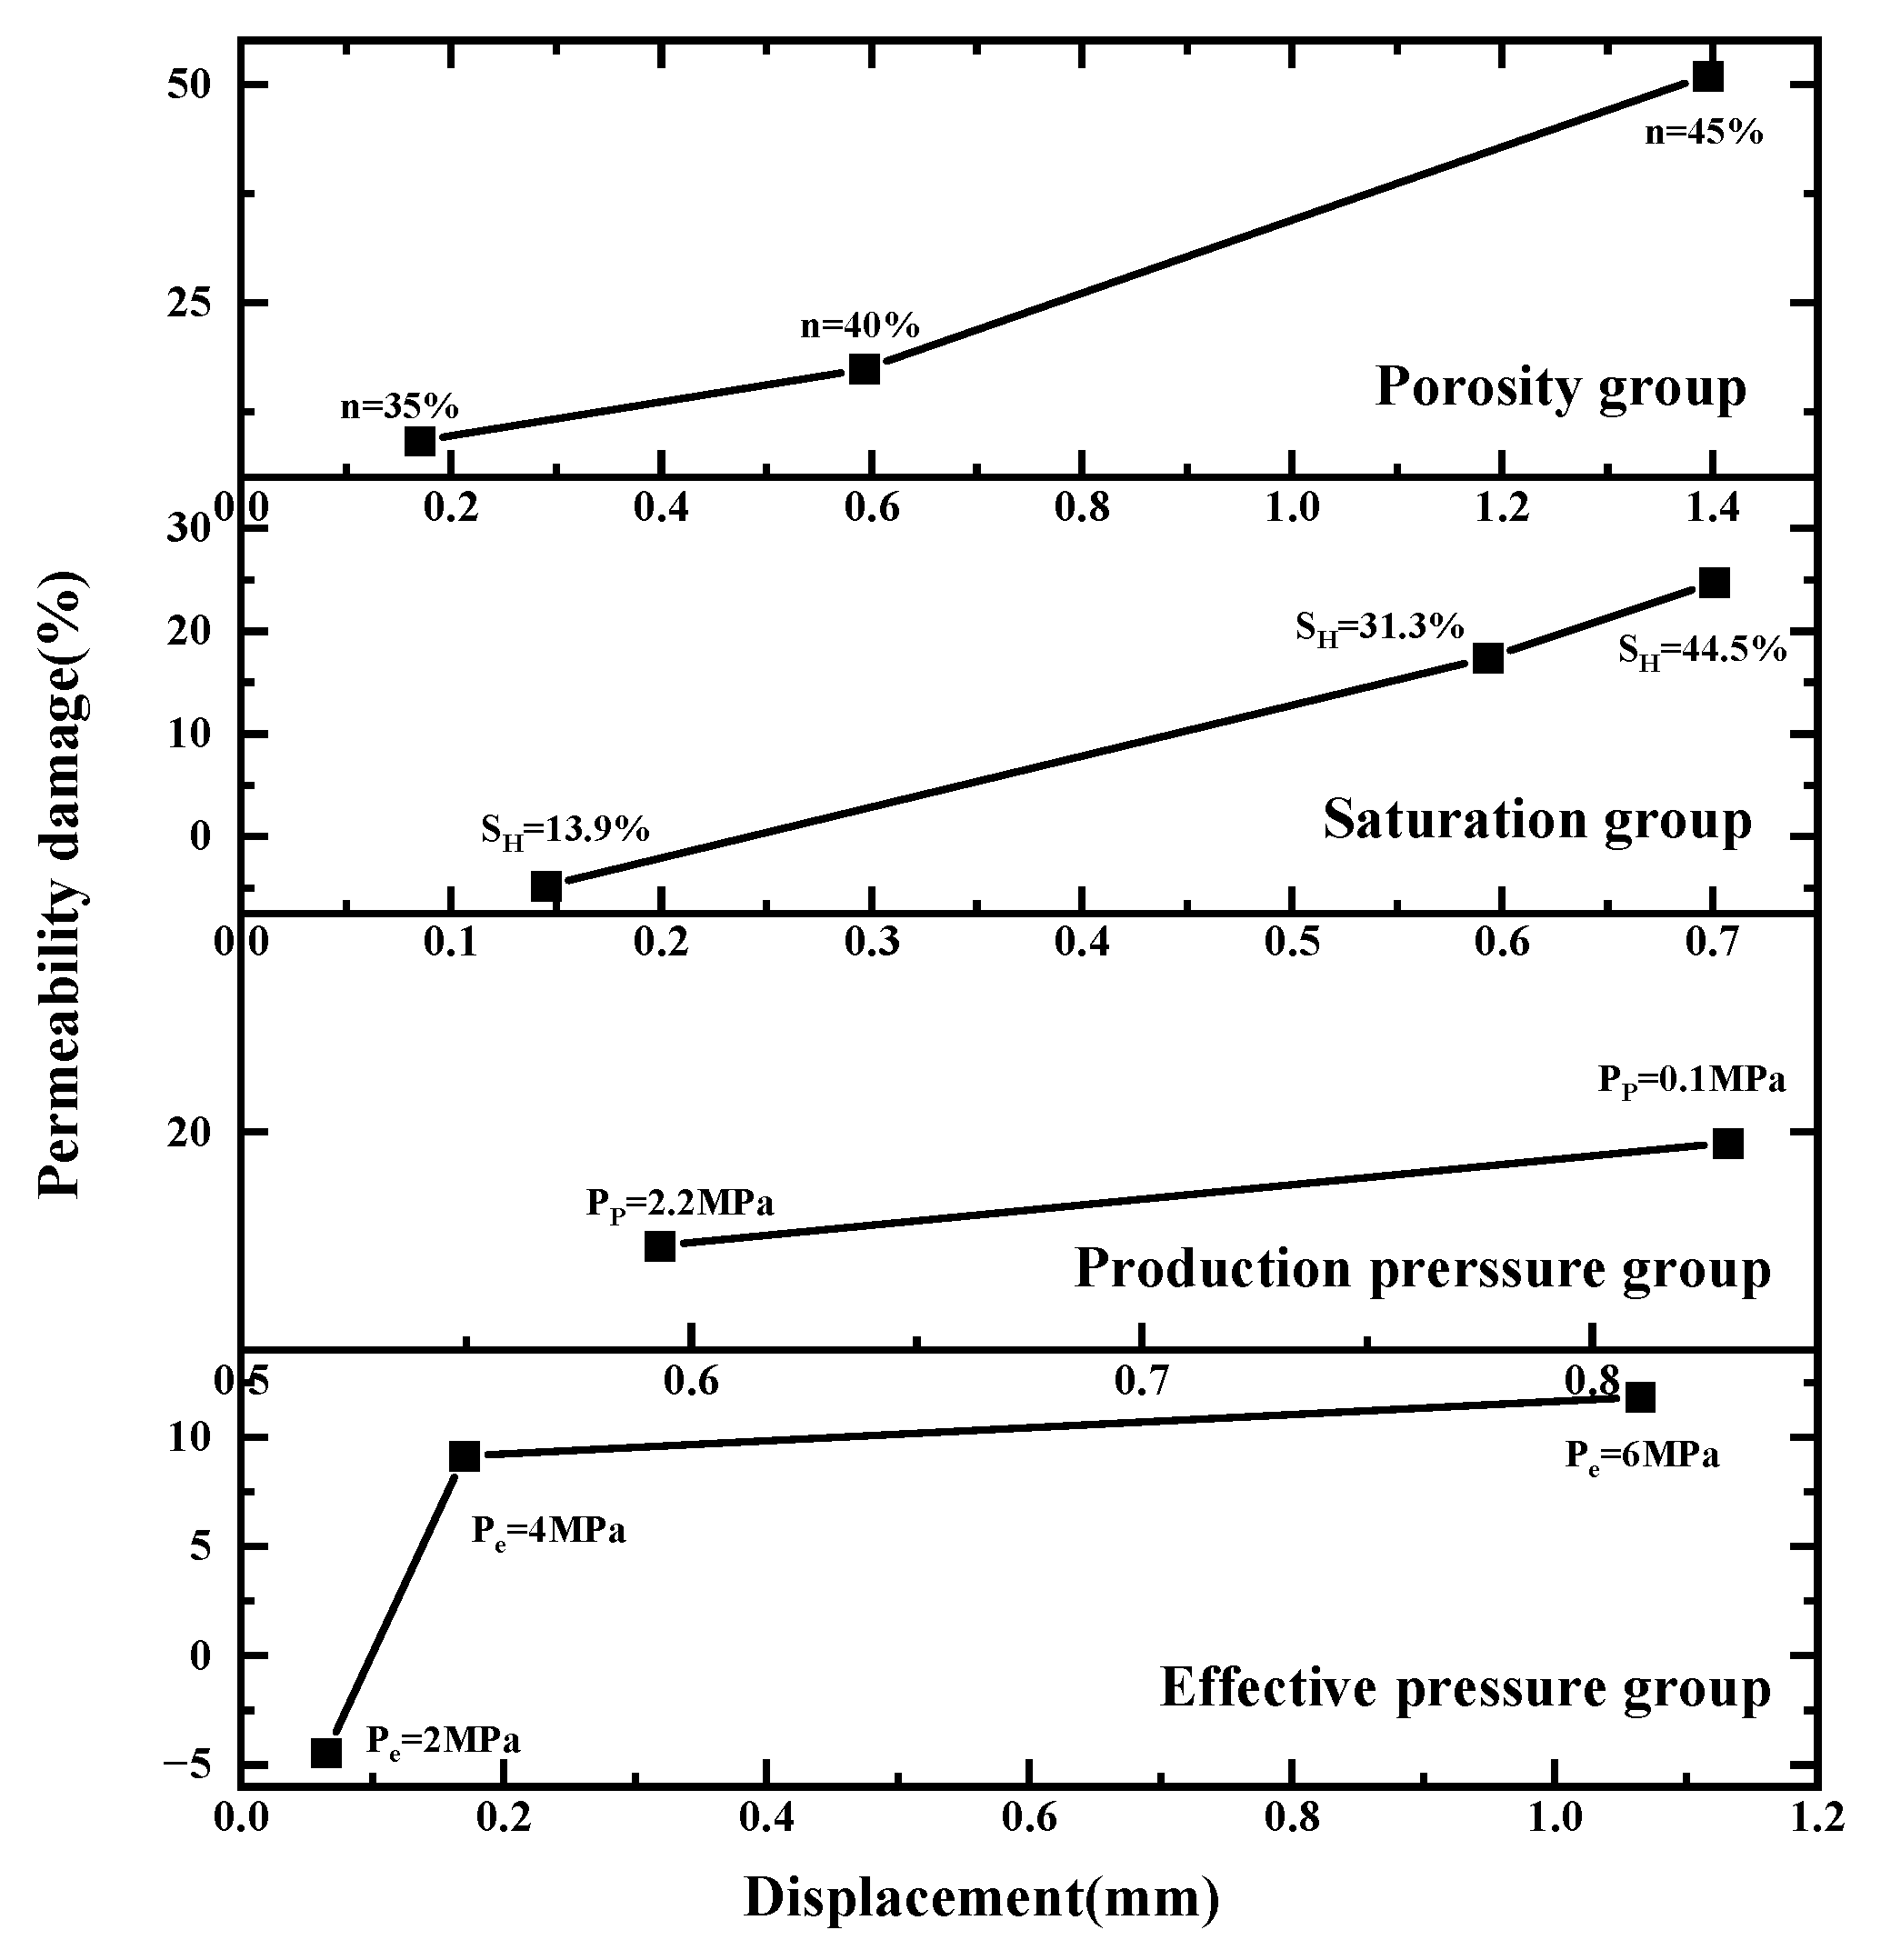
3.3. Relationship between Displacement and Permeability Damage

Figure 10 represents the relationship between sediment displacement and permeability damage in the process of hydrate decomposition. It can be seen from the figure that sediment displacement and permeability damage are positively correlated under the same influencing factors. Furthermore, with the increase in sediment porosity, hydrate saturation, depressurization range, and effective pressure, sediment displacement and permeability damage also increase. In the process of hydrate depressurization decomposition, the support effect of hydrate on sediments is weakened and, with the increase in effective pressure, the sediments gradually deform, which results in the sediment pore space being compressed and reduced, blocking the flow of gas and water. At the same time, the volume of sediment particles expands due to the hydration of clay, which leads to a narrowing of seepage channels and a decrease in sediment permeability. Therefore, the change in sediment displacement increases synchronously with the permeability damage. When the sediment displacement is larger, the permeability damage is also larger. However, it can be seen from Figure 10 that when the hydrate saturation is 13.9% and the initial effective pressure is 2 MPa, the permeability of the sediments was not damaged but increased. It can be found that when the hydrate saturation was 13.9%, the sediment displacement was much smaller than that when the hydrate saturation was 31.3% and 44.5%. It may be that sediment particles rotate and rearrange when sediment displacement is small, which leads to changes in pore structure and thus increased permeability. Moreover, when hydrate saturation is higher, clay particles may form aggregates during hydrate synthesis. As shown in Figure 11, the pores between aggregates were much larger than those between clay particles and the formation of aggregates may have pushed clay particles even closer together. The macropores between aggregates were compressed by effective pressure, so the permeability damage was much greater. When the initial effective pressure was 2 MPa, the sediment pore space was less compressed under the small effective pressure; hence, the sediment displacement was small and the seepage channel in the sediment changed little. In addition, the macropores formed by aggregates provided a good channel for gas flow during the process of hydrate synthesis, so the sediment permeability increased.

4. Conclusions

In this paper, the variation laws of sediment displacement and permeability damage during the depressurization and decomposition of clayey–silty hydrate sediments under different conditions were studied and the following conclusions were obtained:
  • The total displacement of sediments can be divided into three stages, namely, the displacement in the depressurization stage, the displacement in the process of hydrate decomposition, and the creep displacement. The sediments deform rapidly and the displacement is small in the depressurization stage. In the process of hydrate decomposition, the sediments deform slowly and the displacement is maximum. The creep stage has the slowest deformation and the smallest displacement.
  • The deformation of sediments continues at the end of hydrate decomposition when the initial sediments porosity and hydrate saturation are higher. When the hydrate saturation is lower, the sediment displacement reaches the stable state earlier. Furthermore, the deformation of the sediments is larger when the effective pressure in the process of hydrate decomposition is larger.
  • Sediment displacement and permeability damage increase correspondingly with the increase in sediment porosity, hydrate saturation, depressurization range, and effective pressure. Moreover, sediment displacement is positively correlated with permeability damage. However, no permeability damage occurs in the sediments when the hydrate saturation and effective pressure are low.
  • In this study, it is believed that there is no wall flow between the rigid wall of the reactor and the sample, and the accuracy of permeability is ensured through multiple tests of permeability under different flow conditions. However, in future research, it is best to use an experimental setup with a flexible wall to ensure that the fluid does not flow on the wall.

Author Contributions

Conceptualization, F.J. and G.Z.; Data curation, F.J.; Formal analysis, F.J.; Investigation, F.J.; Methodology, F.J.; Supervision, J.L.; Validation, F.H. and G.Z.; Writing—original draft, F.J.; Writing—review and editing, F.H., G.Z., B.L. and J.L. All authors have read and agreed to the published version of the manuscript.

Funding

This work was supported by the National Natural Science Foundation of China (No. 51991364).

Data Availability Statement

No new data were created or analyzed in this study. Data sharing is not applicable to this article.

Conflicts of Interest

The authors declare no conflict of interest.

References

  1. Makogon, Y.F.; Holditch, S.A.; Makogon, T.Y. Natural gas-hydrates—A potential energy source for the 21st Century. J. Pet. Sci. Eng. 2007, 56, 14–31. [Google Scholar] [CrossRef]
  2. Ren, S.R.; Liu, Y.J.; Liu, Y.X.; Zhang, W.D. Acoustic velocity and electrical resistance of hydrate bearing sediments. J. Pet. Sci. Eng. 2010, 70, 52–56. [Google Scholar] [CrossRef]
  3. Lu, S.M. A global survey of gas hydrate development and reserves: Specifically in the marine field (Retracted article. See vol. 64, pg. 851, 2016). Renew. Sustain. Energy Rev. 2015, 41, 884–900. [Google Scholar] [CrossRef]
  4. Winters, W.J.; Waite, W.F.; Mason, D.H.; Gilbert, L.Y.; Pecher, I.A. Methane gas hydrate effect on sediment acoustic and strength properties. J. Pet. Sci. Eng. 2007, 56, 127–135. [Google Scholar] [CrossRef] [Green Version]
  5. Wu, P.; Li, Y.; Liu, W.; Liu, Y.; Wang, D.; Song, Y. Microstructure Evolution of Hydrate-Bearing Sands During Thermal Dissociation and Ensued Impacts on the Mechanical and Seepage Characteristics. J. Geophys. Res. Solid Earth 2020, 125, e2019JB019103. [Google Scholar] [CrossRef]
  6. Mel’nikov, N.N.; Kalashnik, A.I. Geodynamic aspects of the development of offshore oil and gas deposits: Case study of Barents region. Water Resour. 2011, 38, 896–905. [Google Scholar] [CrossRef]
  7. Sun, X.; Luo, T.; Wang, L.; Wang, H.; Song, Y.; Li, Y. Numerical simulation of gas recovery from a low-permeability hydrate reservoir by depressurization. Appl. Energy 2019, 250, 7–18. [Google Scholar] [CrossRef]
  8. Yun, T.S.; Santamarina, J.C.; Ruppel, C. Mechanical properties of sand, silt, and clay containing tetrahydrofuran hydrate. J. Geophys. Res.-Sol. Ea. 2007, 112. [Google Scholar] [CrossRef] [Green Version]
  9. Masui, A.; Haneda, H.; Ogata, Y.; Aoki, K. Effects of Methane Hydrate Formation on Shear Strength of Synthetic Methane Hydrate sediments. In Proceedings of the Fifteenth (2005) International Offshore and Polar Engineering Conference, Seoul, Republic of Korea, 19–24 June 2005; pp. 364–369. [Google Scholar]
  10. Yoneda, J.; Jin, Y.; Katagiri, J.; Tenma, N. Strengthening mechanism of cemented hydrate-bearing sand at microscales. Geophys. Res. Lett. 2016, 43, 7442–7450. [Google Scholar] [CrossRef] [Green Version]
  11. Miyazaki, K.; Masui, A.; Sakamoto, Y.; Aoki, K.; Tenma, N.; Yamaguchi, T. Triaxial compressive properties of artificial methane-hydrate-bearing sediment. J. Geophys. Res-Sol. Ea. 2011, 116. [Google Scholar] [CrossRef]
  12. Jiang, M.J.; Peng, D.; Ooi, J.Y. DEM investigation of mechanical behavior and strain localization of methane hydrate bearing sediments with different temperatures and water pressures. Eng. Geol. 2017, 223, 92–109. [Google Scholar] [CrossRef] [Green Version]
  13. Li, Y.; Song, Y.; Yu, F.; Liu, W.; Wang, R. Effect of confining pressure on mechanical behavior of methane hydrate-bearing sediments. Pet. Explor. Dev. 2011, 38, 637–640. [Google Scholar] [CrossRef]
  14. Nariai, H.; Yamane, K.; Aya, I. Strength abnormarility of CO2 hydrate membrane at deep ocean storage site. In Proceedings of the international symposium DEEP SEA & CO2, Tsukuba, Japan, 18–22 January 2000; pp. 1–2. [Google Scholar]
  15. Ohmura, R.; Shigetomi, T.; Mori, Y.H. Bending tests on clathrate hydrate single crystals. Philos. Mag. A-Phys. Condens. Matter Struct. Defects Mech. Prop. 2002, 82, 1725–1740. [Google Scholar] [CrossRef]
  16. Hyodo, M.; Li, Y.H.; Yoneda, J.; Nakata, Y.; Yoshimoto, N.; Nishimura, A.; Song, Y.C. Mechanical behavior of gas-saturated methane hydrate-bearing sediments. J. Geophys. Res-Sol. Ea. 2013, 118, 5185–5194. [Google Scholar] [CrossRef] [Green Version]
  17. Hyodo, M.; Yoneda, J.; Yoshimoto, N.; Nakata, Y. Mechanical and dissociation properties of methane hydrate-bearing sand in deep seabed. Soils. Found. 2013, 53, 299–314. [Google Scholar] [CrossRef] [Green Version]
  18. Hyodo, M.; Li, Y.H.; Yoneda, J.; Nakata, Y.; Yoshimoto, N.; Nishimura, A. Effects of dissociation on the shear strength and deformation behavior of methane hydrate-bearing sediments. Mar. Pet. Geol. 2014, 51, 52–62. [Google Scholar] [CrossRef]
  19. Wang, Y.; Kou, X.; Feng, J.C.; Li, X.S.; Zhang, Y. Sediment deformation and strain evaluation during methane hydrate dissociation in a novel experimental apparatus. Appl. Energy 2020, 262, 114397. [Google Scholar] [CrossRef]
  20. Hu, C.; Liu, X.L.; Jia, Y.G.; Duan, Z.B. Permeability anisotropy of methane hydrate-bearing sands: Insights from CT scanning and pore network modelling. Comput. Geotech. 2020, 123, 103568. [Google Scholar] [CrossRef]
  21. Lijith, K.P.; Malagar, B.R.C.; Singh, D.N. A comprehensive review on the geomechanical properties of gas hydrate bearing sediments. Mar. Pet. Geol. 2019, 104, 270–285. [Google Scholar] [CrossRef]
  22. Nimblett, J.; Ruppel, C. Permeability evolution during the formation of gas hydrates in marine sediments. J. Geophys. Res.-Sol. Ea. 2003, 108. [Google Scholar] [CrossRef]
  23. Lu, S.M.; McMechan, G.A. Estimation of gas hydrate and free gas saturation, concentration, and distribution from seismic data. Geophysics 2002, 67, 582–593. [Google Scholar] [CrossRef]
  24. Liu, X.L.; Flemings, P.B. Dynamic multiphase flow model of hydrate formation in marine sediments. J. Geophys. Res.-Sol. Ea. 2007, 112. [Google Scholar] [CrossRef] [Green Version]
  25. Lei, X.; Yao, Y.; Sun, X.; Wen, Z.; Ma, Y. Permeability change with respect to different hydrate saturation in clayey-silty sediments. Energy 2022, 254, 124417. [Google Scholar] [CrossRef]
  26. Wang, Y.; Feng, J.C.; Li, X.S.; Zhang, Y.; Chen, Z.Y. Fluid flow mechanisms and heat transfer characteristics of gas recovery from gas-saturated and water-saturated hydrate reservoirs. Int. J. Heat Mass Transfer. 2018, 118, 1115–1127. [Google Scholar] [CrossRef]
  27. Wang, Y.; Feng, J.C.; Li, X.S.; Zhang, Y. Experimental and modeling analyses of scaling criteria for methane hydrate dissociation in sediment by depressurization. Appl. Energy 2016, 181, 299–309. [Google Scholar] [CrossRef]
  28. Delli, M.L.; Grozic, J.L.H. Experimental determination of permeability of porous media in the presence of gas hydrates. J. Pet. Sci. Eng. 2014, 120, 1–9. [Google Scholar] [CrossRef]
  29. Li, G.; Wu, D.M.; Li, X.S.; Lv, Q.N.; Li, C.; Zhang, Y. Experimental measurement and mathematical model of permeability with methane hydrate in quartz sands. Appl. Energy 2017, 202, 282–292. [Google Scholar] [CrossRef]
  30. Li, G.; Xu, Z.-L.; Li, X.-S.; Shen, P.-F.; Lv, Q.-N. Permeability investigation and hydrate migration of hydrate? Bearing silty sands and silt. J. Nat. Gas Sci. Eng. 2021, 89, 103891. [Google Scholar] [CrossRef]
  31. Moridis, G.J. TOUGH+HYDRATE v1.2 User’s Manual: A code for the simulation of system behavior in hydrate-bearing geologic media. Stereochem. Stereophys. Behav. Macrocycles 2014, 10. Available online: https://escholarship.org/uc/item/3mk82656 (accessed on 21 August 2022).
  32. Shen, P.; Li, G.; Li, B.; Li, X. Coupling effect of porosity and hydrate saturation on the permeability of methane hydrate-bearing sediments. Fuel 2020, 269, 117425. [Google Scholar] [CrossRef]
  33. Shen, P.; Li, G.; Li, B.; Li, X.; Liang, Y.; Lv, Q. Permeability measurement and discovery of dissociation process of hydrate sediments. J. Nat. Gas Sci. Eng. 2020, 75, 103155. [Google Scholar] [CrossRef]
  34. Liu, Z.C.; Kim, J.; Lei, L.; Ning, F.L.; Dai, S. Tetrahydrofuran Hydrate in Clayey SedimentsLaboratory Formation, Morphology, and Wave Characterization. J. Geophys. Res.-Sol. Ea. 2019, 124, 3307–3319. [Google Scholar] [CrossRef]
  35. Okwananke, A.; Hassanpouryouzband, A.; Yang, J.; Tohidi, B.; Chuvilin, E.; Bukhanov, B.; Istomin, V.; Cheremisin, A. Experimental study of gas permeation through gas hydrate-bearing sediments. In Proceedings of the 9th International Conference of Gas Hydrate, Denver, CO, USA, 25–30 June 2017. [Google Scholar]
  36. Ning, F.L.; Fang, X.Y.; Liu, Z.C.; Yu, Y.J.; Li, Y.L.; Wang, L.J.; Lu, H.F.; Sun, J.X.; Cao, X.X.; Shi, H.X. Sand production behaviors during gas recovery from sandy and clayey-silty hydrate-bearing sediments: A comparative analysis. Energy Sci. Eng. 2022, 10, 2224–2238. [Google Scholar] [CrossRef]
  37. Liu, C.L.; Ye, Y.G.; Meng, Q.G.; He, X.L.; Lu, H.L.; Zhang, J.; Liu, J.; Yang, S.X. The Characteristics of Gas Hydrates Recovered from Shenhu Area in the South China Sea. Mar. Geol. 2012, 307, 22–27. [Google Scholar] [CrossRef]
  38. Mohan, K.K.; Vaidya, R.N.; Reed, M.G.; Fogler, H.S. Water Sensitivity of Sandstones Containing Swelling and Non-Swelling Clays. Colloids Surf. A 1993, 73, 237–254. [Google Scholar] [CrossRef] [Green Version]
  39. Wu, Z.R.; Li, Y.H.; Sun, X.; Wu, P.; Zheng, J.A. Experimental study on the effect of methane hydrate decomposition on gas phase permeability of clayey sediments. Appl. Energy 2018, 230, 1304–1310. [Google Scholar] [CrossRef]
  40. Jing, M.X.; Yuan, X.L. Experiment research on core stress sensitivity of carbonate rock. Nat. Gas Ind. 2002, 20, 114–117. (In Chinese) [Google Scholar]
  41. Zhu, Y.M.; Chen, C.; Luo, T.T.; Song, Y.C.; Li, Y.H. Creep behaviours of methane hydrate-bearing sediments. Environ. Geotech. 2022, 9, 199–209. [Google Scholar] [CrossRef]
  42. Lyu, X.; Li, Q.; Ge, Y.; Zhu, J.; Zhou, S.; Fu, Q. Fundamental characteristics of gas hydrate-bearing sediments in the Shenhu area, South China Sea. Front Energy 2020, 15, 367–373. [Google Scholar] [CrossRef]
  43. Li, J.F.; Ye, J.L.; Qin, X.W.; Qiu, H.J.; Wu, N.Y.; Lu, H.L.; Xie, W.W.; Lu, J.A.; Peng, F.; Xu, Z.Q.; et al. The first offshore natural gas hydrate production test in South China Sea. China Geol. 2018, 1, 5–16. [Google Scholar] [CrossRef]
  44. Li, Y.H.; Wu, Z.R.; Liu, W.G.; Luo, T.T.; Song, Y.C. Effect of reformation of gas hydrate on the gas phase permeability of montmorillonite. Enrgy Proced. 2019, 158, 5269–5274. [Google Scholar] [CrossRef]
  45. Zhao, J.; Liu, Y.; Guo, X.; Wei, R.; Yu, T.; Xu, L.; Sun, L.; Yang, L. Gas production behavior from hydrate-bearing fine natural sediments through optimized step-wise depressurization. Appl. Energy 2020, 260, 114275. [Google Scholar] [CrossRef]
  46. Hyodo, M.; Nakata, Y.; Yoshimoto, N.; Ebinuma, T. Basic research on the mechanical behavior of methane hydrate-sediments mixture. Soils. Found. 2005, 45, 75–85. [Google Scholar]
  47. Miyazaki, K.; Tenma, N.; Aoki, K.; Yamaguchi, T. A Nonlinear Elastic Model for Triaxial Compressive Properties of Artificial Methane-Hydrate-Bearing Sediment Samples. Energies 2012, 5, 4057–4075. [Google Scholar] [CrossRef] [Green Version]
  48. Ebinuma, T.; Kamata, Y.; Minagawa, H.; Ohmura, R.; Nagao, J.; Narita, H. Mechanical properties of sandy sediment containing methane hydrate. In Proceedings of the International Conference on Gas Hydrates, Trondheim, Norway, 13–16 June 2005. [Google Scholar]
  49. Mody, F.K.; Hale, A.H. Borehole-stability model to couple the mechanics and chemistry of drilling-fluid shale interactions. J. Pet. Technol. 1993, 45, 1093–1101. [Google Scholar] [CrossRef]
  50. Liu, G.F.; Miao, X.Q. Influence factor analysis on hydrations swelling of clay minerals. Pet. Drill. Tech. 2009, 37, 81–84. [Google Scholar]
  51. Wu, Z.R. Study on Seepage Characteristics of Methane Hydrate Sedimennts under Effective Stress. Ph.D. Thesis, Dalian University of Technology, Dalian, China, 2020. [Google Scholar]
Figure 1. Grain size distribution of sediment.
Energies 16 05005 g001
Figure 2. Diagram of the experimental apparatus.
Energies 16 05005 g002
Figure 3. Changes in pressure and displacement of sediments during hydrate depressurization decomposition with different porosity groups.
Energies 16 05005 g003
Figure 4. Changes in pressure and displacement of sediments during hydrate depressurization decomposition with different hydrate saturation groups.
Energies 16 05005 g004
Figure 5. Changes in pressure and displacement of sediments during hydrate depressurization decomposition with different production pressure groups.
Energies 16 05005 g005
Figure 6. Changes in pressure and displacement of sediments during hydrate depressurization decomposition with different effective pressure groups.
Energies 16 05005 g006
Figure 7. The proportion diagram of three stages for the sediment displacement change.
Energies 16 05005 g007
Figure 8. Relationship between permeability before hydrate formation and after decomposition.
Energies 16 05005 g008
Figure 9. Permeability damage.
Energies 16 05005 g009
Figure 10. Relationship between displacement and permeability damage.
Energies 16 05005 g010
Figure 11. Schematic diagram of sediment sample structure during hydrate formation [51].
Energies 16 05005 g011
Table 1. Sediment parameters.
Average Particle Size (μm)Quartz Sand Content (%)Clay Content (%)Carbonate Content (%)Density (g/cm3)
Montmorillonite Illite Quartz Sand Clay Carbonate
Sediments of this study<11.44541020162.652.752.7
Sediments of South China Sea125326~30162.652.582.71
Table 2. Basic experimental parameters for Runs 1–8.
Main ParametersRun 1Run 2Run 3Run 4Run 5Run 6Run 7Run 8
Quartz sand mass (g)182.54168.50154.46168.50168.50168.50182.54182.54
Montmorillonite mass (g) 35.0832.3829.6832.3832.3832.3835.0835.08
Illite mass (g)70.1664.7659.3764.7664.7664.7670.1670.16
Calcite mass (g)55.1150.8746.6350.8750.8750.8755.1155.11
Water saturation0.600.600.600.300.700.600.600.60
SH0.3450.3130.3390.1390.4450.3400.2780.313
n0.350.400.450.400.400.400.350.35
Pe (MPa)44444426
Pp (MPa)2.22.22.22.22.20.12.22.2
Note. SH: Hydrate Saturation; n: Porosity; Pe: Initial Effective Pressure; Pp: Production Pressure.
Disclaimer/Publisher’s Note: The statements, opinions and data contained in all publications are solely those of the individual author(s) and contributor(s) and not of MDPI and/or the editor(s). MDPI and/or the editor(s) disclaim responsibility for any injury to people or property resulting from any ideas, methods, instructions or products referred to in the content.

