Article

Environmental Impact Assessment of Autonomous Transportation Systems

1
Department of Civil and Environmental Engineering, South Dakota School of Mines and Technology, Rapid City, SD 57701, USA
2
Department of Mechanical Engineering, South Dakota School of Mines and Technology, Rapid City, SD 57701, USA
3
Department of Chemistry, Biology, and Health Sciences, South Dakota School of Mines and Technology, Rapid City, SD 57701, USA
*
Author to whom correspondence should be addressed.
Energies 2023, 16(13), 5009; https://doi.org/10.3390/en16135009
Submission received: 31 May 2023 / Revised: 23 June 2023 / Accepted: 26 June 2023 / Published: 28 June 2023
(This article belongs to the Section B: Energy and Environment)

Abstract

:
The transportation industry has led efforts to fight climate change and reduce air pollution. Autonomous electric vehicles (A-EVs) that use artificial intelligence, next-generation batteries, etc., are predicted to replace conventional internal combustion engine vehicles (ICEVs) and electric vehicles (EVs) in the coming years. In this study, we performed a life cycle assessment to analyze A-EVs and compare their impacts with those from EV and ICEV systems. The scope of the analysis consists of the manufacturing and use phases, and a functional unit of 150,000 miles·passenger was chosen for the assessment. Our results on the impacts from the manufacturing phase of the analyzed systems show that the A-EV systems have higher impacts than other transportation systems in the majority of the impacts categories analyzed (e.g., global warming potential, ozone depletion, human toxicity-cancer) and, on average, EV systems were found to be the slightly more environmentally friendly than ICEV systems. The high impacts in A-EV are due to additional components such as cameras, sonar, and radar. In comparing the impacts from the use phase, we also analyzed the impact of automation and found that the use phase impacts of A-EVs outperform EV and ICEV in many aspects, including global warming potential, acidification, and smog formation. To interpret the results better, we also investigated the impacts of electricity grids on the use phase impact of alternative transportation options for three representative countries with different combinations of renewable and conventional primary energy resources such as hydroelectric, nuclear, and coal. The results revealed that A-EVs used in regions that have hydropower-based electric mix become the most environmentally friendly transportation option than others.

1. Introduction

The effects of burning fossil fuels on climate change have grown enormously since the late 19th century [1]. Currently, seven billion tons of carbon dioxide are released into the atmosphere each year [2]. The United States of America alone has emitted nearly a quarter of greenhouse gas emissions globally [3]. The 30-year national inventory conducted by the United States Environmental Protection Agency found that transportation was responsible for the largest greenhouse emissions of all use sectors [3]. Upon further investigation, we found that a typical passenger vehicle with a gross weight of <8500 lbs emits 4.6 metric tons of carbon dioxide per year, leading to 57% of the total transportation emissions [4]. Given the increase in personal vehicle usage, the potential impacts of transportation systems on environmental degradation are becoming more apparent.
In recent years there has been a consistent trend by the government and industry to reduce greenhouse gas emissions with a wide adaptation of electric vehicles (EV) [5]. Since 2018, over one million EVs have been sold worldwide [6]. Growing demand for EVs parallels the fusion of several technologies, including hybrid, fuel-cell, and plug-in hybrid EVs [7]. EVs maintain traffic demands quietly and efficiently while decreasing air pollution and dependency on fossil fuels [6]. EVs offer competitive advantages over internal combustion engine vehicles (ICEVs) in lower maintenance requirements because they have fewer moving parts [8,9]. To date, the life cycle assessment (LCA) methodology has been adopted to analyze the environmental impacts of EVs and ICEV [10,11,12]. The manufacturing of chemicals in batteries (e.g., lithium-ion, nickel manganese cobalt, lead-acid), energy sources (e.g., coal, wind, solar), and disposal of vehicles are all crucial aspects of potential environmental impacts of an EV’s life cycle [13]. An LCA study revealed that EVs have lower carbon emissions over the life of the vehicle, whereas manufacturing phase impacts of EVs are greater than ICEVs due to the use of rare metals in lithium-ion batteries [14]. Similarly, another study conducted by European Environmental Agency also indicated that higher manufacturing phase greenhouse gas and air emissions of EVs are associated with energy-intensive processes used in battery manufacturing [15]. Verma et al. concluded that while EVs cut greenhouse gas emissions, they increase human toxicity due to the use of rare earth metals [7]. Pipitone et al. found that battery manufacturing during the manufacturing phase of EVs causes about two to five times more times global warming, acidification, particulate matter, and resource depletion impacts than ICEVs [16]. Shafique et al. also found that lithium-ion batteries contribute greatly to manufacturing phase impacts [17]. In another study, Shafique et al. compared the environmental impacts of EVs in different countries using current and 2030 electricity mixes [18]. Koroma et al. assessed the environmental performance of EVs by employing various strategies such as switching to renewable energy, battery refurbishment, and recycling [19]. It is also noted that battery chemistry and manufacturing improvements are needed for more environmentally sustainable EV technology that can outperform ICEV [20].
To optimize global emissions in the transportation sector, one promising alternative is increasing the efficiency of EVs in their use phase by transitioning into fully autonomous driving [21,22]. Autonomous electric vehicles (A-EV) represent one of the biggest technological advancements in transportation [23,24]. A-EVs utilize artificial intelligence, cameras, laser imaging, detection, ranging systems, and radar sensors to perceive the surrounding environment and use artificial intelligence to control the actuators for vehicle control with or without human input [25,26]. The National Highway Traffic Safety Administration has defined six levels of automation: level zero is no automation, level one is driver assistance, level two is partial automation, level three is conditional automation, level four is high automation, and level five is full automation [27]. The full automation system is anticipated to improve driving safety, energy utilization, sustainability, and traffic congestion [23]. Daily driving an autonomous vehicle can increase energy utilization by up to 200%, zero greenhouse gas emissions during travel, and decrease stagnate emissions in traffic are all expected [28].
While A-EVs have attracted significant scientific attention, numerous studies have also been conducted to assess the environmental sustainability of A-EVs as well [11,29,30,31,32,33]. Vahidi et al. studied the energy-saving potential of A-EV technology [29]. Ross et al. studied the effect of partial and full automation, as well as additional influencing parameters, on the energy intensity of A-EVs [30]. Brown et al. highlighted the major factors determining the A-EV’s environmental impacts [34]. Zhong et al. discussed the influence of different pricing scenarios for low-carbon shared autonomous vehicles [35]. Kontar et al. conducted LCA to analyze the environmental impacts of A-EVs during the use phase [36]. Gawron et al. provided LCA on A-EVs and found lower greenhouse gas emissions due to enhanced efficiency after incorporating sensing and computing components [11]. Cox et al. conducted an LCA of A-EV at a different operational level by considering changes to driving patterns by applying exponential smoothing of the driving cycle [31]. Biramo et al. examined the impact of the degree of automation levels on the A-EVs emissions [32]. According to the findings of this study, fully automated vehicles can emit 38% less carbon monoxide, 17% less carbon dioxide, 36% less hydrocarbons, and 28% less particulate matter emissions [32]. Massar et al. discussed the influence of automation levels on greenhouse gas emissions of A-EVs [33]. A recent LCA study conducted on automated minibuses found that over 60% of the total environmental impacts are attributed to the use phase, which is greatly influenced by the source of energy i.e., electricity mix used during operations [37]. Ahmed et al. found that integrating the 2050 US clean energy mix and circular economy practices in the life cycle of shared autonomous vehicles can reduce the global warming potential impacts by 70% when compared to the current electricity mix [38]. However, the existing literature on A-EV still has gaps since no comprehensive LCA study provides comparisons between A-EV systems and EV and ICEV and detailed analyses on various levels of automation.
In this study, we performed an LCA to directly compare ICEV, EV, and A-EV technologies. For A-EV systems, we categorized the vehicles from level zero through two (A-EV1) and level-three-through five (A-EV2). A-EV1 refers to where a human monitors the driving environment with a level of autonomy, including features such as cruise control and lane assist. A-EV2 refers to an automated system that monitors the driving environment with features such as environmental detection, automation through geofencing, and complete automation. We focused on assessing the impact of increased automation on reducing usage emissions. To interpret the results more clearly, we investigated the impacts of electricity grids in Poland, Norway, and France. To our knowledge, this is the first study that provides a comprehensive analysis of the three transportation options such as ICEV, EV, and A-EVs, while also assessing the impact of various levels of automation and primary energy sources of electricity consumed during the use phase of vehicles.

2. Materials and Methods
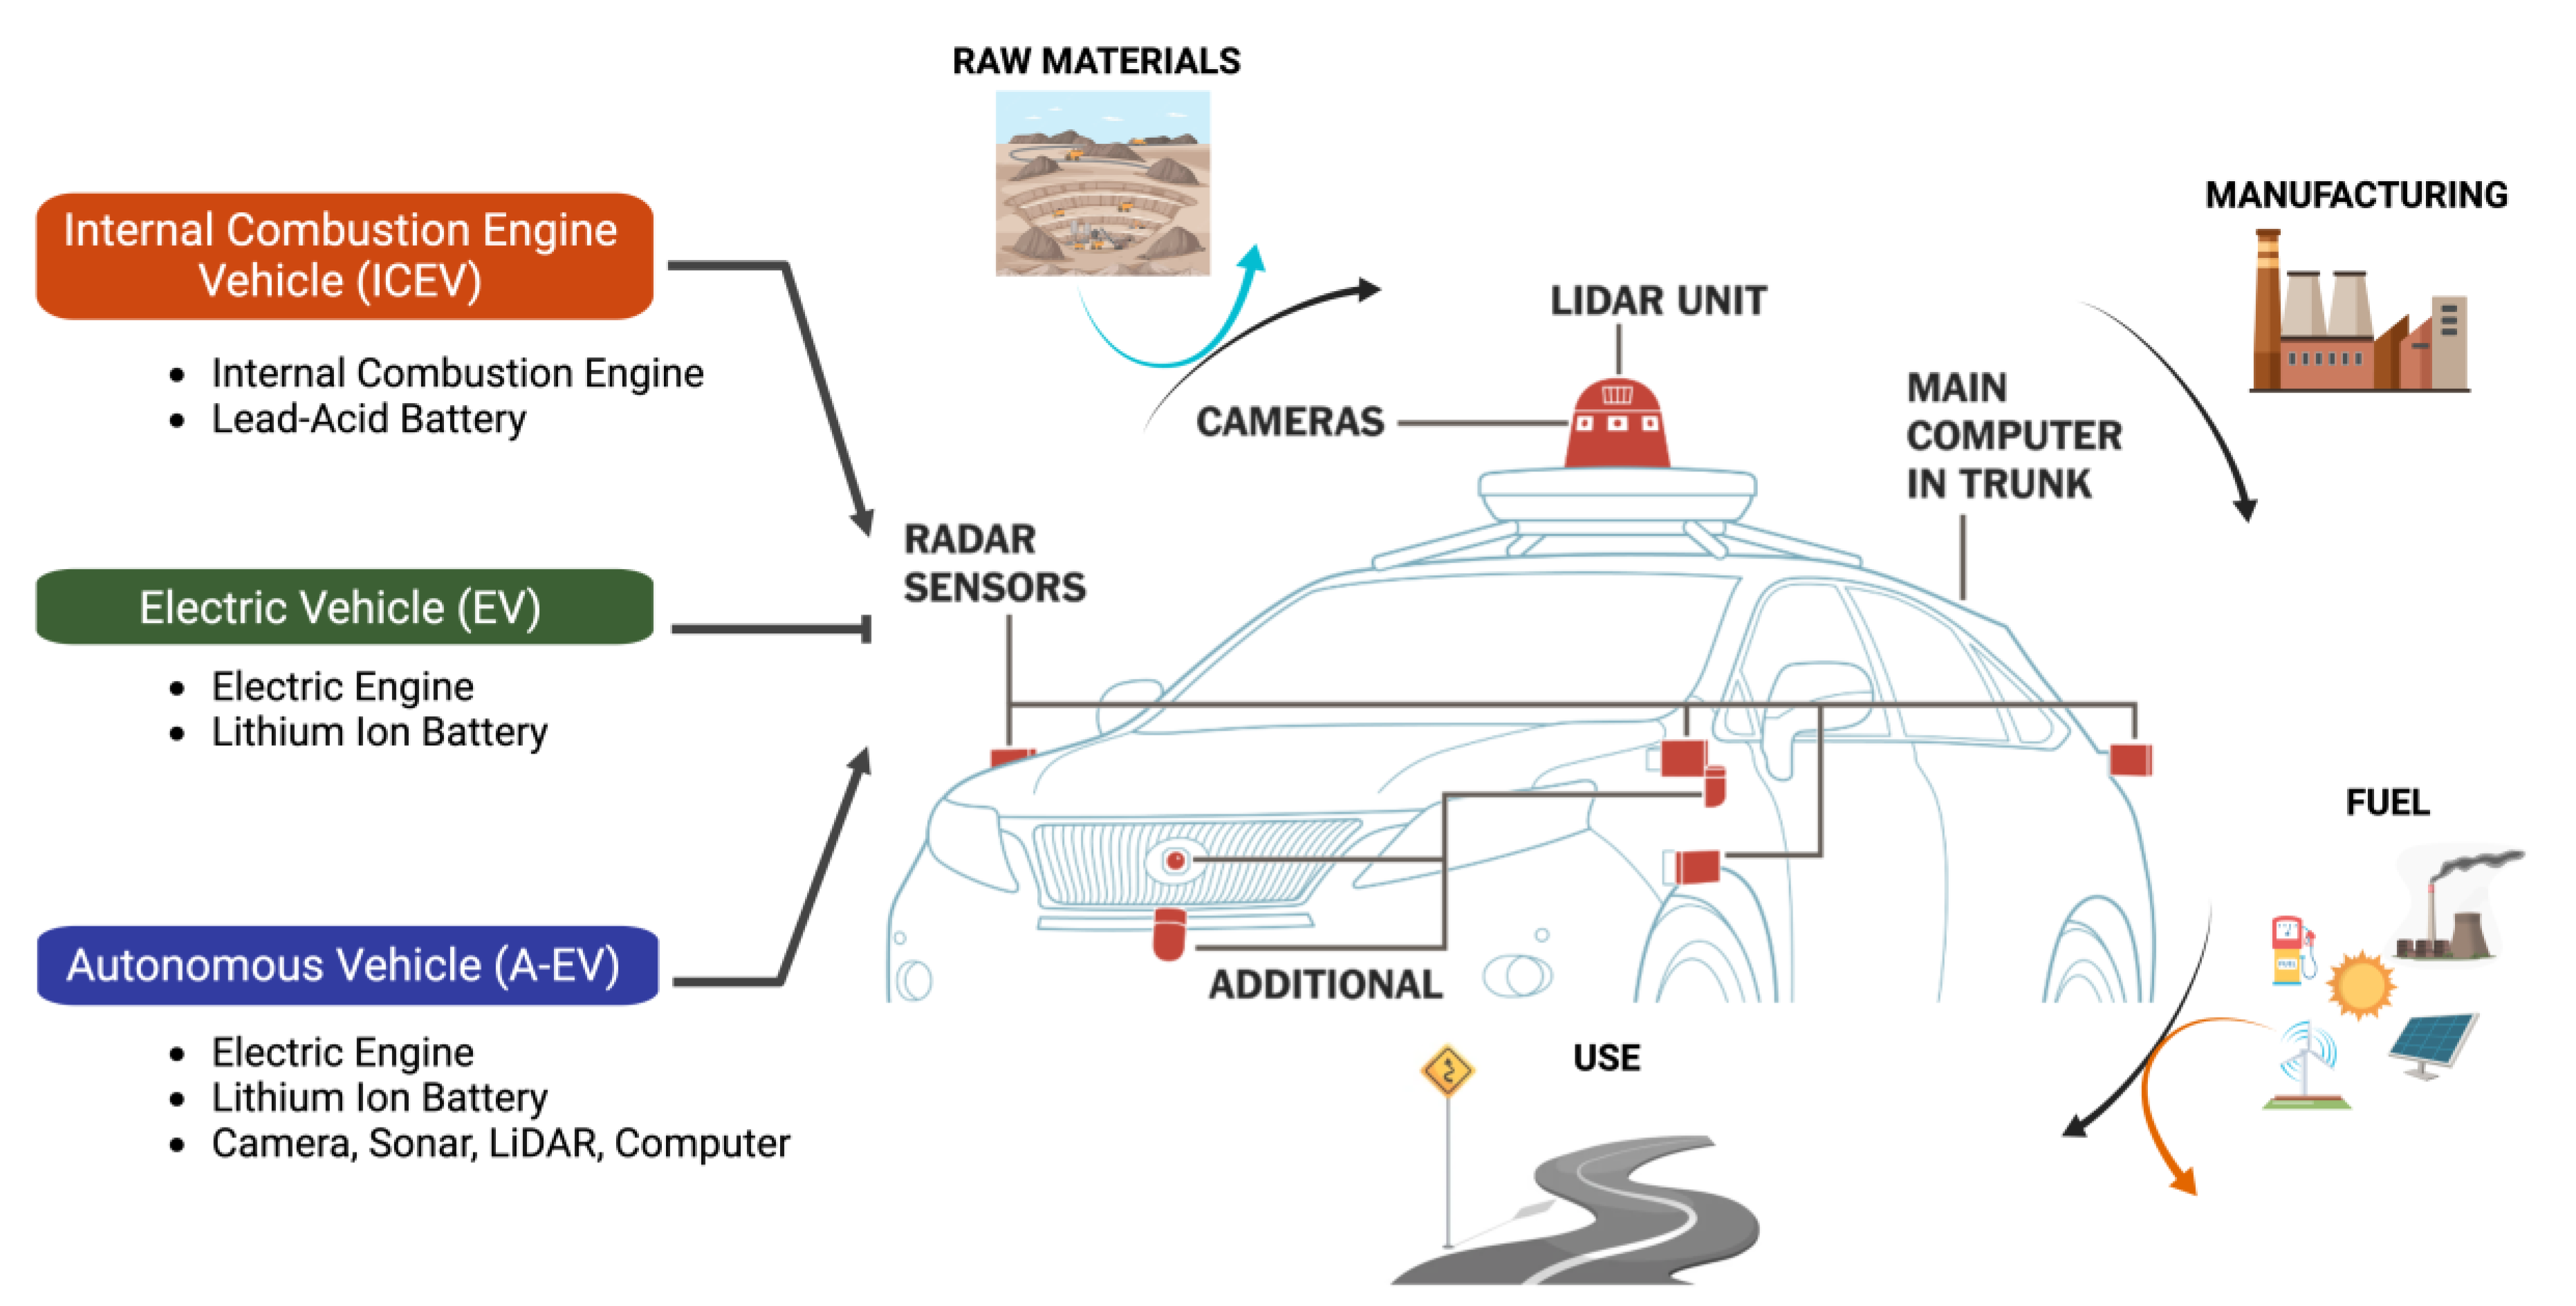
2.1. Goal and Scope

The goal of this study was to compare the life cycle environmental impacts of ICEVs, EVs, and A-EVs. The results of the LCA will help inform policy and lawmakers in their decision-making to achieve the zero-carbon emission target [2]. The LCA work in this study was performed following the ISO (International Standards Organization) recommended practices 14,040:2006 and 14,044:2006 standards [39,40].
The cradle-to-use phase system boundary includes producing raw materials, the materials, and energy used in the manufacturing and use phase of three vehicle types. We excluded the end-of-life phase from the system boundary due to limited data available [11]. For a fair comparison, a functional unit of 150,000 miles·passenger (about 241,402 km·passenger) was chosen to compare the environmental performance of ICEVs, EVs, and A-EVs during the vehicle’s lifetime [17]. The data for materials and energy were extracted from Ecoinvent V. 3.8 Database [41]. For the quantify environmental impacts associated with the manufacturing and use phase, GaBi ts 10.0 software was used [42]. We employed Tools for the reduction and assessment of chemical and other environmental impacts (TRACI) used in this study [43]. TRACI allows for quantifying stressors that have potential effects providing insights into the processes and their environmental impacts. Ten midpoint environmental categories were modeled using the TRACI impact assessment model: acidification (kg SO2-eq), ecotoxicity (CTUe), eutrophication (kg Neq), global warming potential (kg CO2-eq), human toxicity cancer (CTUh), human toxicity non-cancer (CTUh) human health particulate air (kg PM2.5-eq), ozone depletion air (kg CFC11eq), resources (MJ surplus energy), and smog air (kg O3-eq).

2.2. Modeling Approach

The framework for this study can be seen in Figure 1. The vehicle inventories were divided into engines, batteries, additional autonomous components, and energy use. It was assumed that the remaining materials used in all vehicles (e.g., steel, aluminum, plastics) are the same. Both electric and autonomous vehicles engines and batteries are assumed to be the same electric motors and lithium-ion batteries. ICEV engines included additional parts such as cast iron, aluminum, and copper. The batteries in internal combustion vehicles are most commonly lead-acid batteries [11]. Autonomous vehicles need additional components such as cameras, sonar, radars, laser imaging, detection, and ranging sensors, a global positioning system with an inertial navigation system, dedicated short-range communication equipment, computers, harnesses, and structure [11]. The engine composition used in standard, electric and autonomous vehicles was used to build inventories.

2.3. Life Cycle Inventories

The life cycle inventories were categorized into manufacturing and use phase components and shown in Table 1. The manufacturing phase includes engines, batteries, additional parameters, and energy utilized during the production of three different vehicle types [9,11,17,44]. The choice of lead-acid and lithium-ion batteries was justified due to their wide adaptation in combustion and electric vehicles. Battery inventories were adapted from literature [45]. The energy used during the manufacturing of ICEV, EV, and A-EVs varies. The electricity required for manufacturing EVs and A-EVs is more than the ICEVs since both EVs and A-EVs require advanced equipment and infrastructure [15]. The average electricity consumption for compact car manufacture was calculated to be 20 MJ/kg of vehicle [14]. The average mass of the ICEV and EV/A-EVs is considered as 1355 kg and 1450 kg [14]. In the use phase, fuel and electricity consumption were chosen at 21.79 km (km) per liter for ICEV [17], 206 Wh/km for EV [9], and 177.16 Wh/km for A-EV [11].

2.4. Limitations and Uncertainty

The variation in inventory data may influence the LCA results substantially. To interpret the results, we investigated the impact of the electricity grid by analyzing the data for three representative countries with different combinations of renewable and conventional primary energy resources, such as Norway (92% of electricity is supplied from hydropower plants) [46], Poland (87% of electricity is from coal) [47], and France (nuclear plants provide 74.5% of electricity) [48]. Note that the electricity data were representative of 2019 inventories. Sensitivity analysis was carried out using the one-variable-at-a-time method by varying one parameter at a time to determine the sensitivity of parameters to variation in input.

3. Results and Discussion

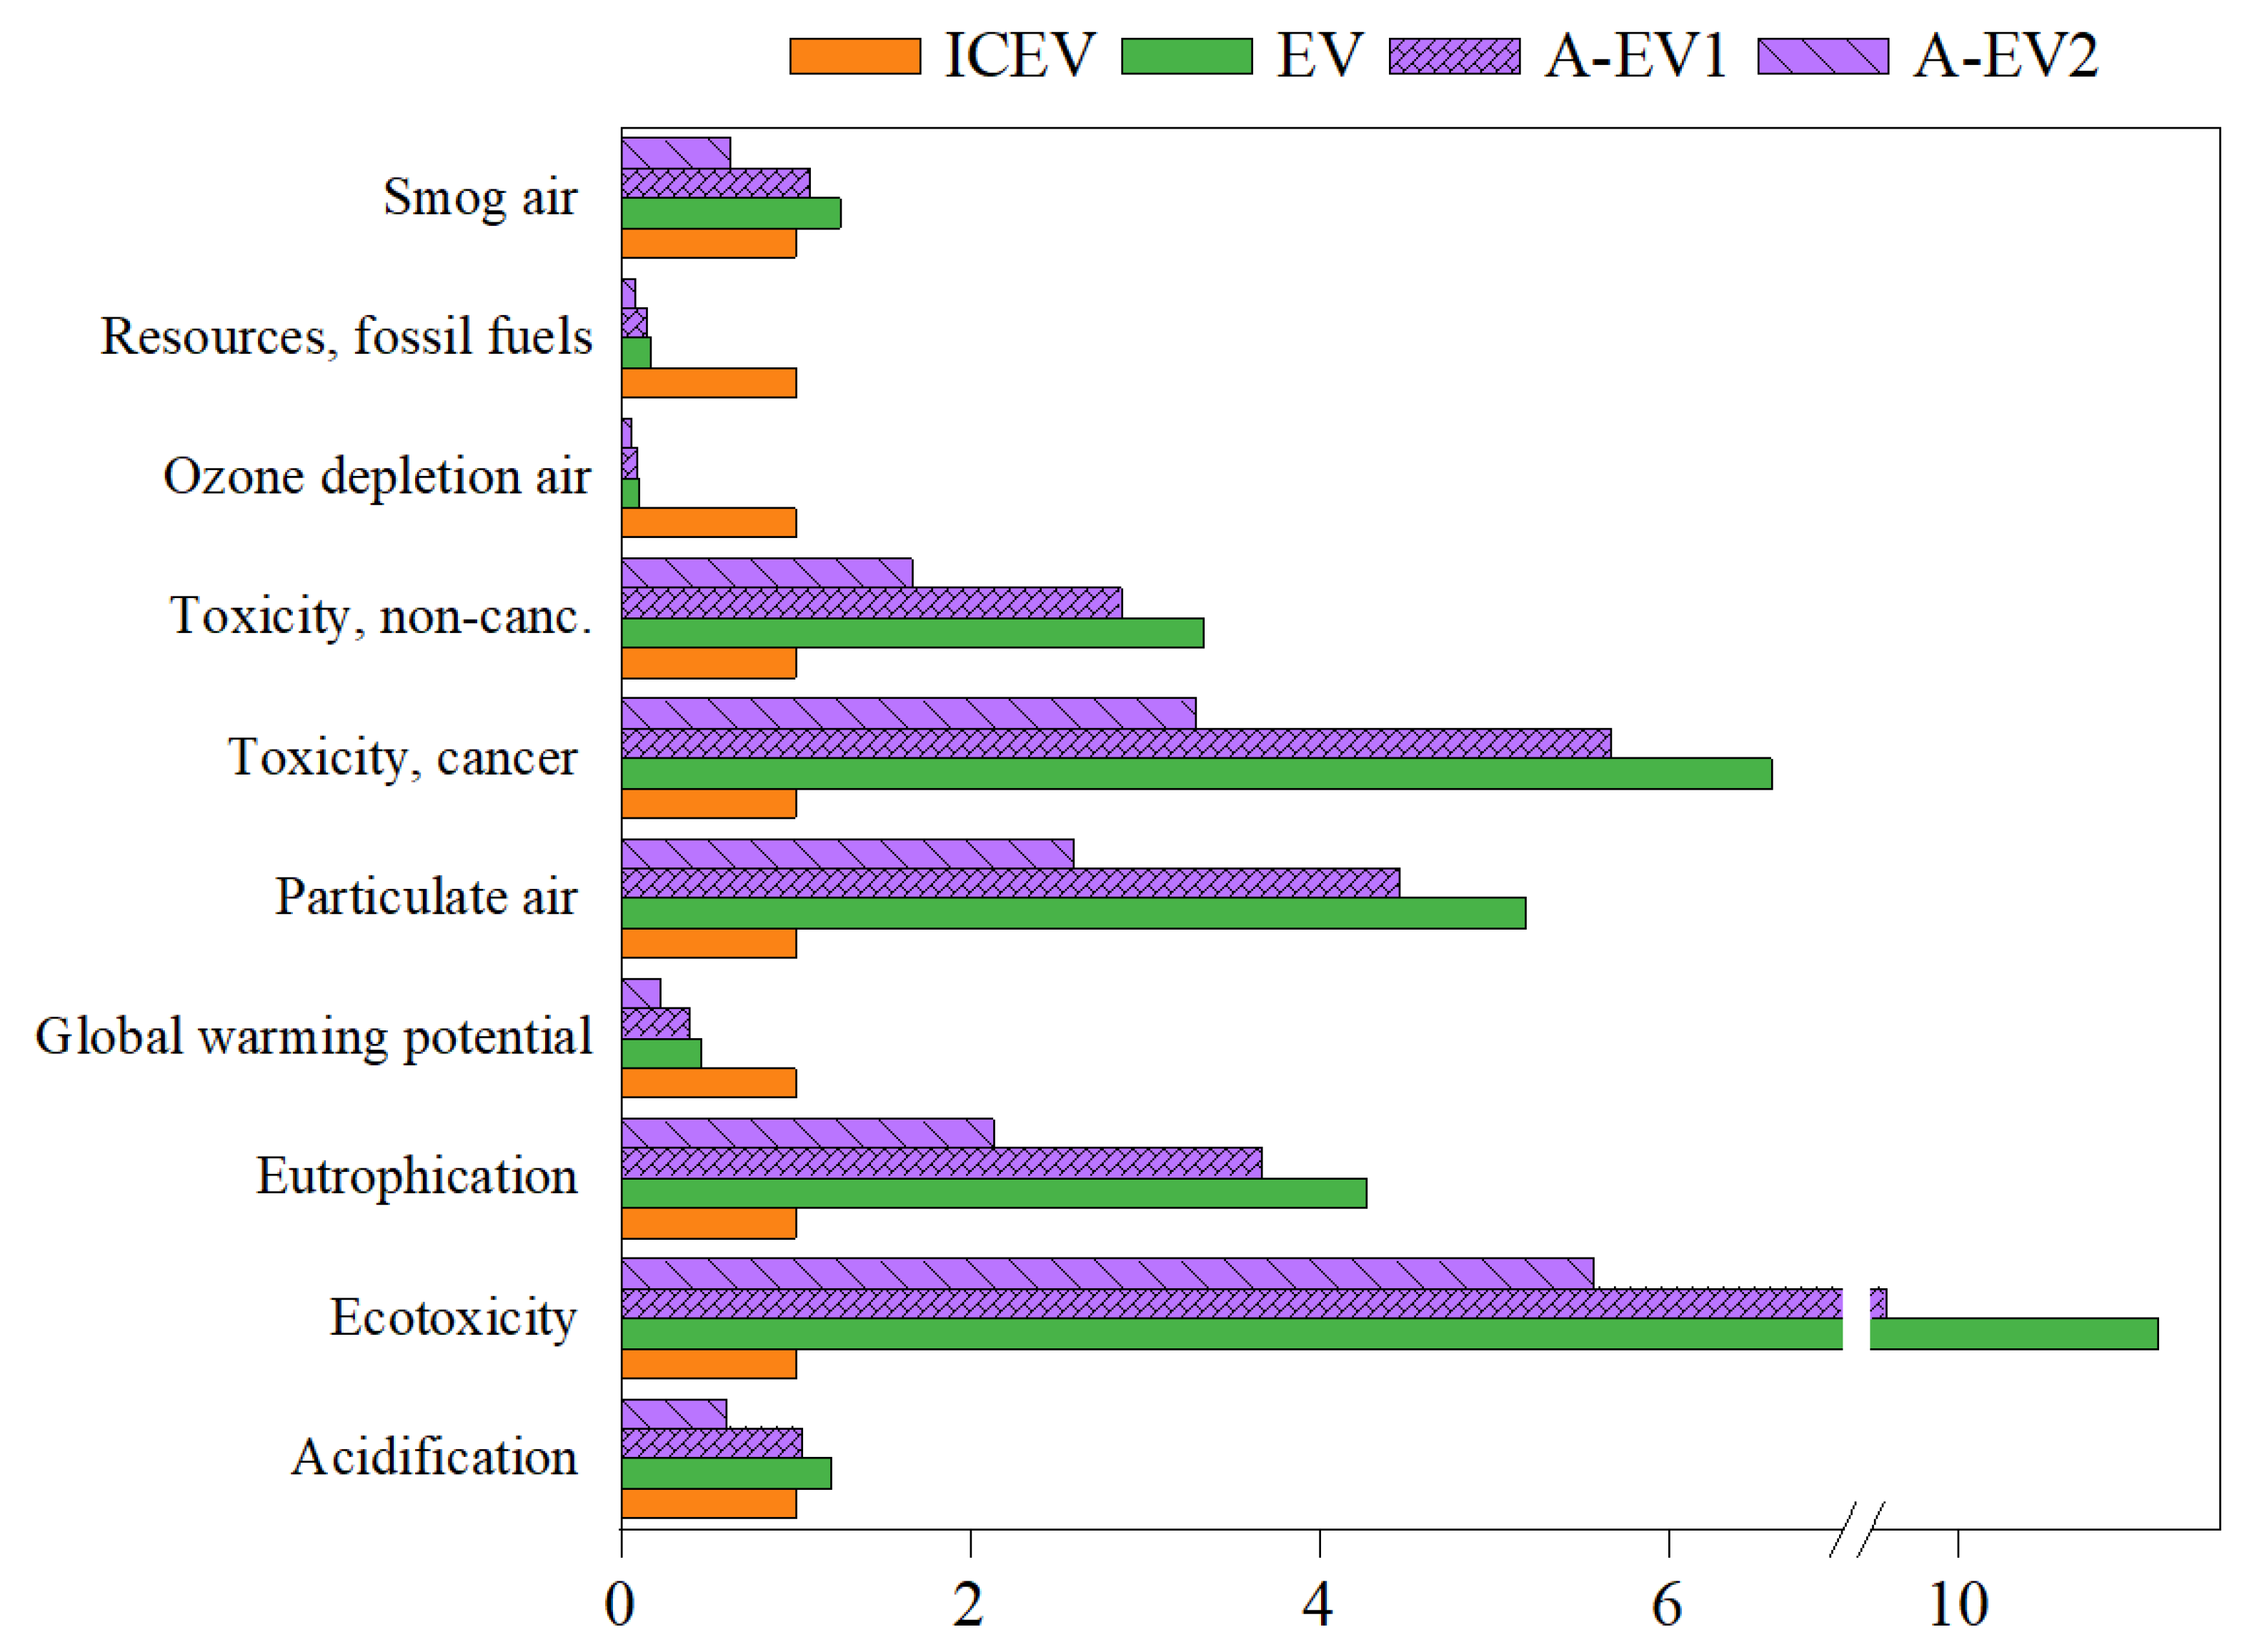
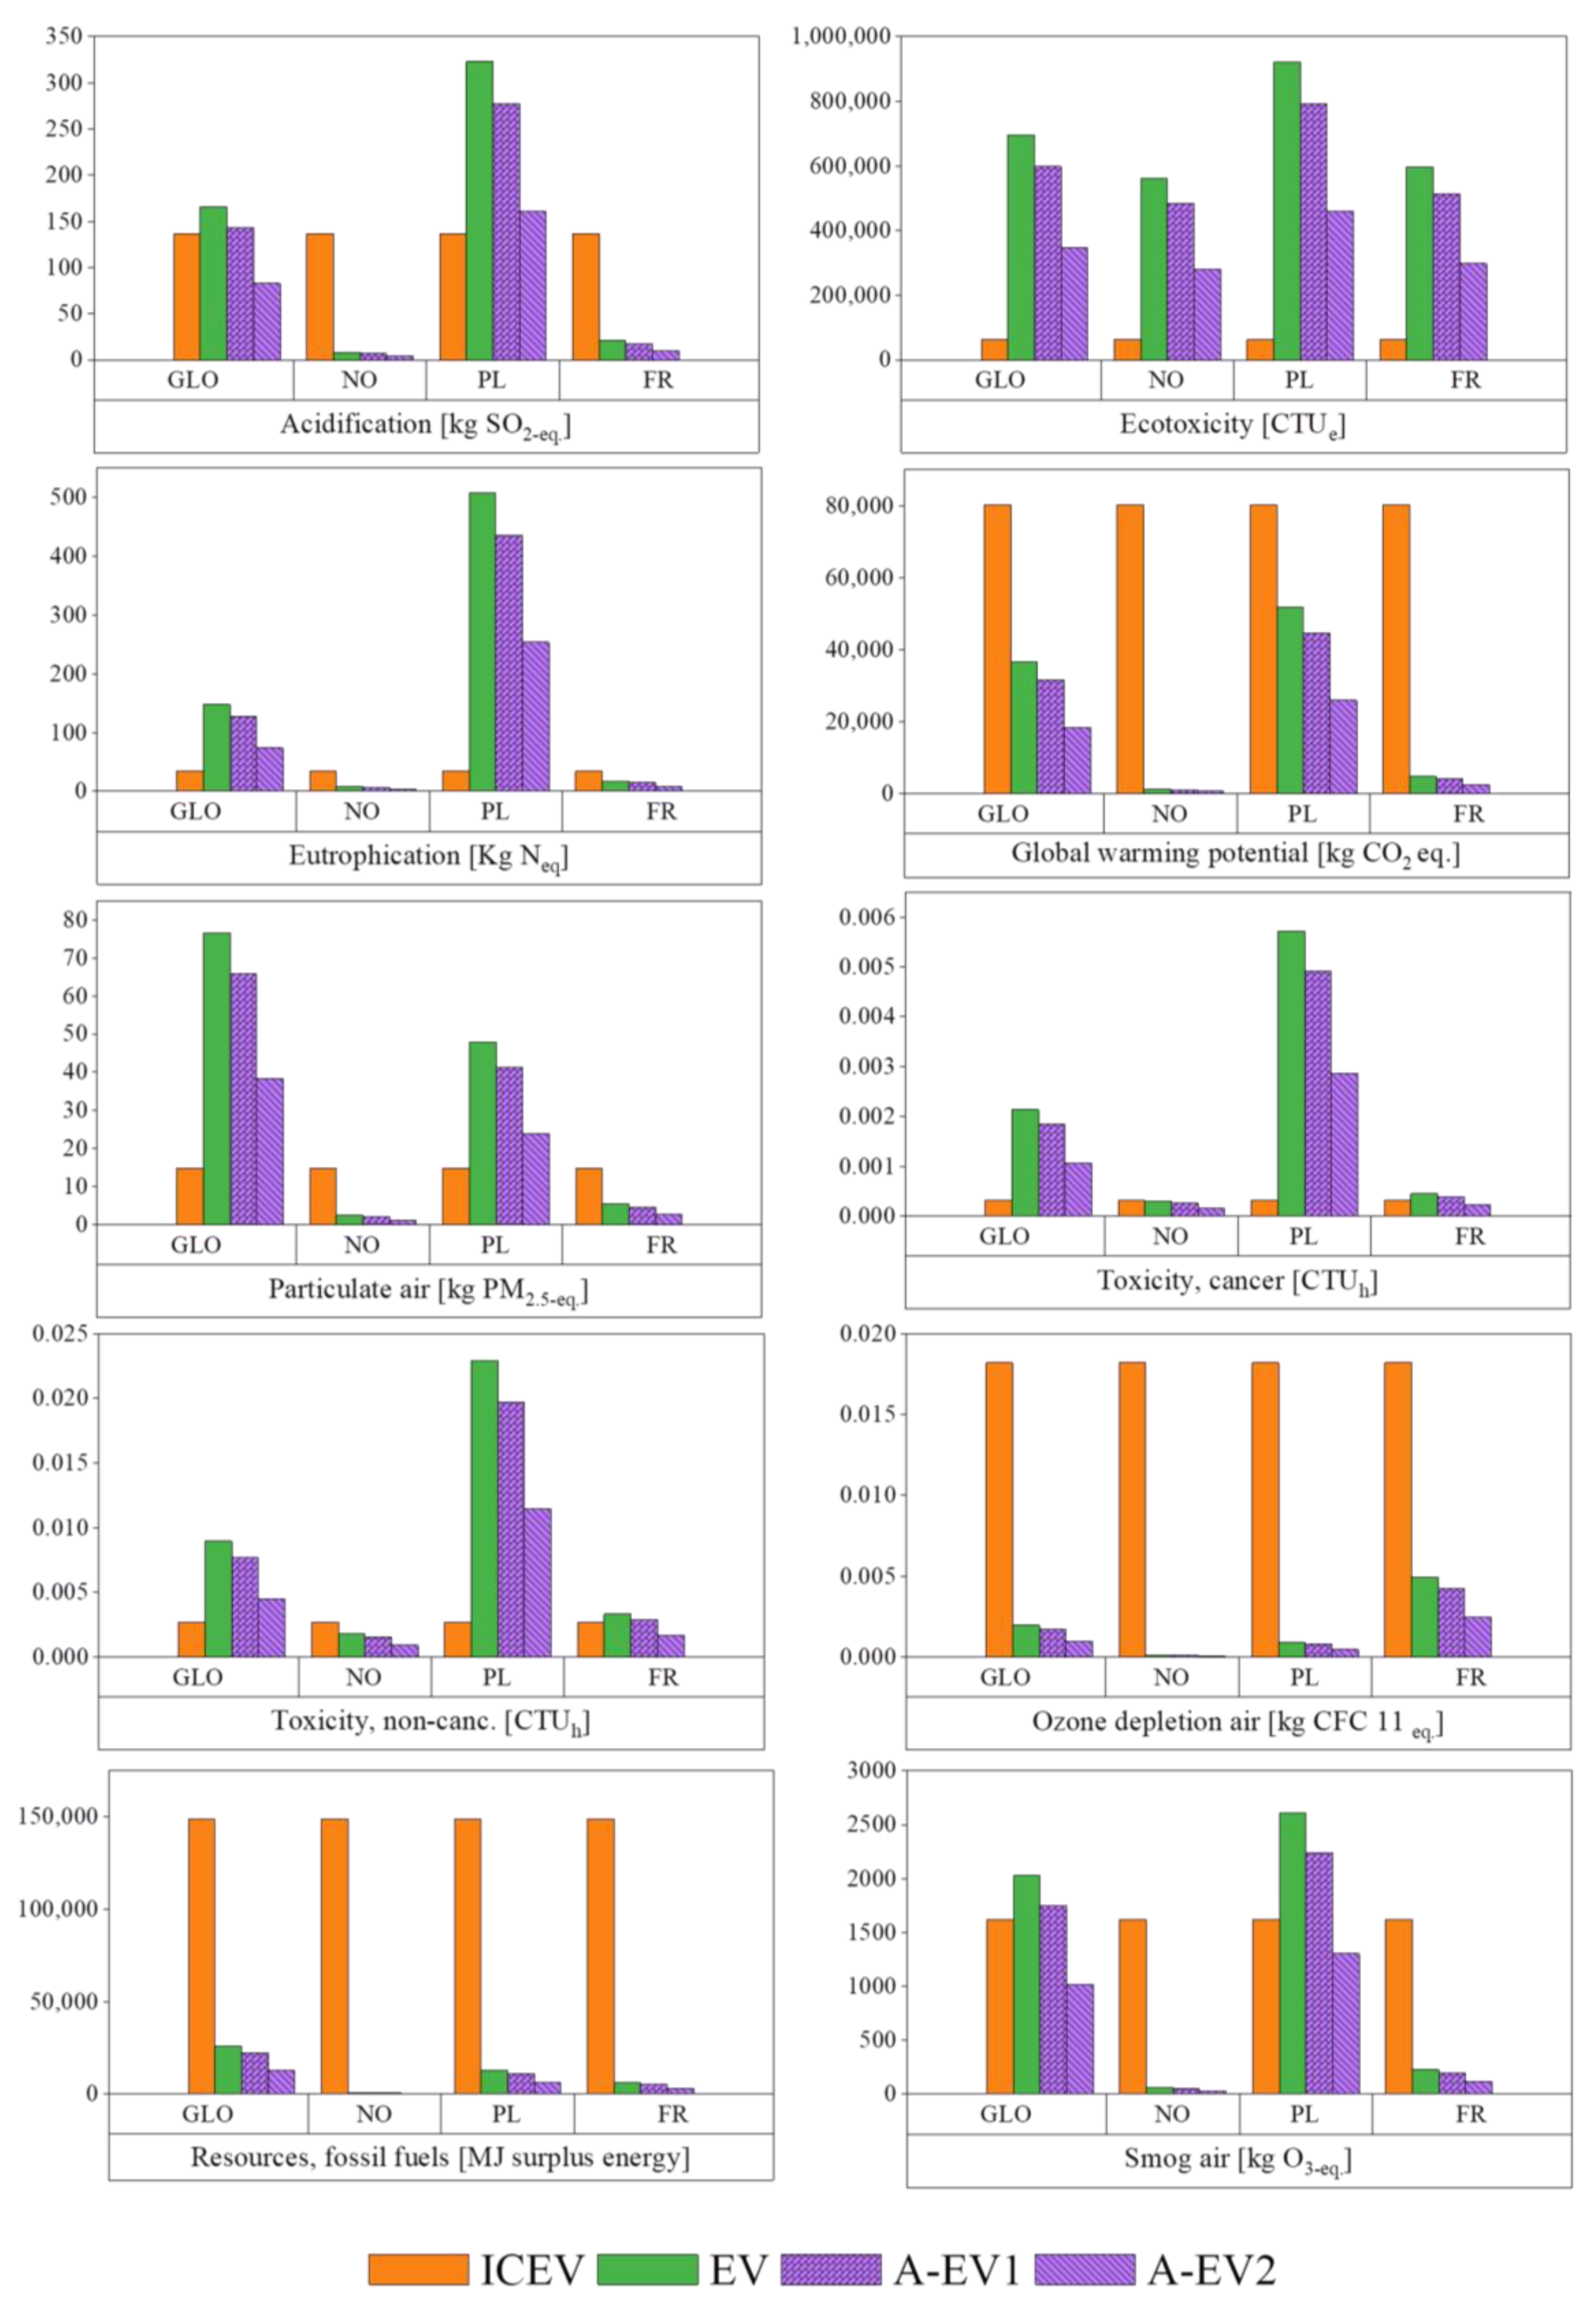
3.1. Life Cycle Impact Assessment

Figure 2 compares the environmental performance of three transportation technologies based on their manufacturing phase impacts. The normalized environmental impacts of the manufacturing phase show that in most of the impacts analyzed, the A-EV systems have slightly higher impacts than other transportation systems, and EV systems were found to be more environmentally friendly than ICEV systems. The higher impacts for A-EV are the increased impacts from cameras, sonar, radar, global positioning systems, laser imaging, detection, and ranging systems, dedicated short-range communication equipment, and computers needed for autonomy. A-EVs were found to have better environmental performance in acidification impact categories. The higher acidification impacts of ICEVs are due to the usage of platinum group metals used in catalytic converters [9,15]. In the following impact categories, the ICEV systems were found to be better than EV systems: global warming potential, ozone depletion, human health particulate, and resource depletion. The reason for higher impacts for EV systems in these categories is attributed to energy used for manufacturing. Battery production is responsible for the higher energy usage in the EV manufacturing phase. These results were consistent with the previous LCA study findings [9,15,17]. Similar to our findings, Shafique et al. found that lithium-ion batteries used in the EVs contributed majorly (more than 45%) to the manufacturing phase global warming potential, ozone depletion, and fossil fuel depletion impacts [17]. The European Environmental Agency conducted an LCA study on EVs and found that the energy used for battery production in the manufacturing phase emits about twice as much NOx, SO2, and PM emissions as ICEV production [15]. This study also reported that the manufacturing phase impacts of EVs were more than ICEVs in global warming potential, human health particulate air, and resource depletion categories [15].
Figure 3 provides a comparison between ICEV, EV, and two types of A-EV systems (A-EV1 and A-EV2) based on use phase environmental impacts. First, we found that the ICEVs have higher impacts during the use phase than EV and A-EV systems in three significant impact categories such as global warming potential, ozone depletion, and resource depletion. As EVs and A-EVs have nearly zero exhaust emissions, most of the associated air-related emissions are from electricity consumed by EV motors. Therefore, for EVs and A-EVs, the upstream processes due to the combustion-based power generation system where the electricity is generated were found to be the primary reasons for air-related emission [49,50]. Note that pollutants, such as CO2, N2O, and CH4, as well as solid particulate matter, considerably impact climate change and particulate matter formation (e.g., PM2.5 and PM10) [51]. Other contaminants include different metal elements, NOx, and phosphate, which promotes eutrophication [52], and sulfur dioxide (SO2) starts the acidification process (nickel, beryllium, cobalt, vanadium, copper, and barium) [53]. These results are consistent with the literature. Shafique et al. found that use phase global warming potential, ozone, and resource depletion impacts of ICEVs are almost three times greater than EV [17]. Another comparative study also reported that the use phase global warming potential and resource depletion impacts of ICEVs is about three times higher than EVs [16]. A comparison of ICEV and A-EV also revealed that applying potential operational effects for A-EV could result in roughly 10% lower global warming potential impacts than ICEV [11]. Second, in the acidification and formation of smog categories, we observed minor differences in the use of phase-associated impacts of A-EV1 and ICEV. We also noted that increasing automation to A-EV2 resulted in a ~40% reduction of impacts compared to A-EV1 in these impact categories. This is mostly because greater levels of automation are boosting fuel efficiency. Massar et al. also found that increasing automation by more than 60% could minimize environmental impacts [33]. Last but not least, we found that A-EVs’ impacts are two to three times higher compared to ICEV in human health particulate, ecotoxicity, eutrophication, and human toxicity categories. The reason for particulate matter formation is associated with electricity production. On average, the global electricity mix contains an average of ~37% of primary energy from coal-fired power plants [54]. Therefore, even with significant improvement in fuel efficiency of A-EV2, fine particulate matter was still 2.5-fold higher than ICEVs. The higher impacts in ecotoxicity impact are due to the additional metal consumption of A-EV and EV systems. Heavy metals, the anthropogenic sources, including coal mining and combustion, are mainly associated with ecotoxicity [55]. The high eutrophication impacts are related to water discharges from mining activities required for electricity generation [15]. The production of electricity from coal power plants utilized for batteries during the use phase of the EV and A-EVs is responsible for the greater human toxicity impacts [9].
Table 2 provides the cradle-to-end-of-use impacts of manufacturing and use phase impacts. EV and A-EVs’ combined normalized environmental impacts were lower than ICEV in the global warming potential, ozone depletion, and resource depletion categories. Previous research yielded comparable results in these categories [9,14,16,17]. According to our findings, for all transportation systems, the use phase contributes more than 70%, and the manufacturing phase contributes around 30% in most impact categories. Shafique et al. also reported that the use phase impacts of ICEV and EVs account for ~50–80% of total life cycle impacts across all impact categories [17]. We observed lower contributions of the use phase on total impacts in other studies, attributed to differences in the electricity mix employed in those studies [16,37].

3.2. Sensitivity Analysis

LCA results show significant variabilities compared to the A-EV system alternative’s environmental performances, primarily attributed to differences in electricity consumption during their use phase. Depending on where electricity is produced, those impacts change. For example, the global warming potential impact of 1 kWh of electricity produced in Norway is about ~45 times more environmentally friendly than the same amount of electricity produced in Poland. As such, energy-intensive processes such as photovoltaic panel production and chip manufacturing are also more environmentally friendly in Norway than in Poland [56]. Thus, it is crucial to consider the impact of various electricity grids of different countries to provide a detailed comparison between A-EV, EV, and ICEV systems.
The influence of electricity from different countries with various primary energy sources such as coal, hydroelectric, and nuclear on the environmental performance of alternative transportation options is shown in Figure 4. We found that the composition of the electricity mix highly affects the usage phase impacts, and with a grid dominated by renewable energy such as hydropower plants, A-EV1 and A-EV2 will have the least impact in almost ten assessed impacts categories. Furthermore, using A-EVs in coal-dominated grids such as Poland is worse than using the current global electricity grid mix. However, using a grid dominated by nuclear power such as France will have similar impacts as using a renewable-dominated grid, except for ozone depletion. Considering the usage of EVs and A-EVs is primarily focused on reducing the global warming impacts along with the reduced release of ozone-depleting substances, the use of A-EVs and EVs in nuclear power grid would have a higher impact. It can be traced back to higher chlorofluorocarbon used during uranium enrichment, the source for nuclear plants [57]. EVs and A-EVs would be most feasible in grids dominated by renewable energy.
We found similar observations in the literature. Pipitone et al. compared the electricity mix of Europe, Norway, and Poland on the life cycle environmental performance of ICEV and EVs [16]. The findings from this study show that by considering renewable energy dominated grid (i.e., Norway), EVs have significantly lower use phase environmental impacts compared to Europe’s average and Poland’s electricity grids [16]. Another study also found that switching the electricity source in electric automated minibusses from a Europe electricity mix to a 100% renewable energy source can reduce the potential global warming impacts by 58% [37]. Kucukvar et al. found that the use of phase environmental efficiency for EV implementation in France is three times more efficient than in Poland [58].

4. Conclusions

A comparative environmental impact assessment of ICEV, EV, and A-EV was undertaken using the TRACI method. Based on the evaluation of vehicle manufacturing, we found that the A-EV systems have higher impacts than other transportation systems in most of the impacts categories analyzed (e.g., global warming potential, ozone depletion, human toxicity, cancer, etc.) and on average, EV systems were found to be the slightly more environmentally friendly than ICEV systems. This is due to the excess materials needed for manufacturing the A-EV system. The results for the use phase show that EV and A-EV have larger impacts than ICEV in acidification, ecotoxicity, eutrophication, human health particulate air, human toxicity (cancer), human toxicity (non-cancer), and smog air. A-EV has less impact in all impact categories than EV. Increasing the automation level from A-EV1 to A-EV2 decreases the impacts by 40%. To interpret the results, we also investigated the impacts of electricity grids used in the Global (average), Poland, Norway, and France on the use phase impacts of ICEV, EV, and A-EV transportation systems. Using a renewable grid, primarily contributed by hydropower plants, can make the use of EVs and A-EVs feasible with less impact on the ten categories.

Author Contributions

Conceptualization, I.C.; methodology, S.H., E.E., C.A., A.R. and D.R.; data curation, S.H., E.E., C.A., A.R. and D.R.; writing—original draft, S.H., E.E., C.A., A.R. and D.R.; writing—review and editing, A.R., V.G., S.S.D. and I.C.; visualization, C.A., A.R. and D.R. All authors have read and agreed to the published version of the manuscript.

Funding

This work is supported by the South Dakota School of Mines and Technology, a Start-up grant under the Provost Office. S. H and E. E were partially supported by Undergraduate Research Funding from the Department of Civil and Environmental Engineering at the South Dakota School of Mines and Technology. A.R. is partially funded by South Dakota EPSCoR (Established Program to Stimulate Competitive Research) Office and National Science Foundation Grant # NSF (National Science Foundation) 2239755. V.G. and C.A. acknowledge partial funding support from the NSF RII FEC awards (#1849206, #1920954).

Data Availability Statement

Data are available upon a reasonable request.

Conflicts of Interest

The authors declare no conflict of interest.

Nomenclature

AbbreviationsDescription
A-EVAutonomous electric vehicles
A-EV1Autonomous electric vehicles with automation from level zero through two
A-EV2Autonomous electric vehicles with automation from level-three through five
EVElectric vehicles
ICEVInternal combustion engine vehicles
LCALife cycle assessment
TRACITools for the reduction and assessment of chemical and other environmental impacts
PMParticulate matter
NOxThe gases of nitric oxide and nitrogen dioxide
BMSBattery management system

References

  1. Roose, B.; Tennyson, E.M.; Meheretu, G.; Kassaw, A.; Tilahun, S.A.; Allen, L.; Stranks, S.D. Local Manufacturing of Perovskite Solar Cells, a Game-Changer for Low- and Lower-Middle Income Countries? Energy Environ. Sci. 2022, 15, 3571–3582. [Google Scholar] [CrossRef]
  2. United Nations Climate Change the Paris Agreement. Available online: https://unfccc.int/process-and-meetings/the-paris-agreement (accessed on 24 May 2023).
  3. US Environmental Protection Agency Sources of Greenhouse Gas Emissions. Available online: https://www.epa.gov/ghgemissions/sources-greenhouse-gas-emissions (accessed on 24 May 2023).
  4. Cage, F. The Long Road to Electric Cars in the U.S. Available online: https://www.reuters.com/graphics/AUTOS-ELECTRIC/USA/mopanyqxwva/ (accessed on 24 May 2023).
  5. Baars, J.; Domenech, T.; Bleischwitz, R.; Melin, H.E.; Heidrich, O. Circular Economy Strategies for Electric Vehicle Batteries Reduce Reliance on Raw Materials. Nat. Sustain. 2021, 4, 71–79. [Google Scholar] [CrossRef]
  6. International Energy Agency Global Electric Car Sales Have Continued Their Strong Growth in 2022 after Breaking Records Last Year. Available online: https://www.iea.org/news/global-electric-car-sales-have-continued-their-strong-growth-in-2022-after-breaking-records-last-year (accessed on 24 May 2023).
  7. Verma, S.; Dwivedi, G.; Verma, P. Life Cycle Assessment of Electric Vehicles in Comparison to Combustion Engine Vehicles: A Review. Mater. Today Proc. 2022, 49, 217–222. [Google Scholar] [CrossRef]
  8. Wu, S.R.; Shirkey, G.; Celik, I.; Shao, C.; Chen, J. A Review on the Adoption of AI, BC, and IoT in Sustainability Research. Sustainability 2022, 14, 7851. [Google Scholar] [CrossRef]
  9. Hawkins, T.R.; Singh, B.; Majeau-Bettez, G.; Strømman, A.H. Comparative Environmental Life Cycle Assessment of Conventional and Electric Vehicles. J. Ind. Ecol. 2013, 17, 53–64. [Google Scholar] [CrossRef]
  10. Egede, P.; Dettmer, T.; Herrmann, C.; Kara, S. Life Cycle Assessment of Electric Vehicles—A Framework to Consider Influencing Factors. Procedia CIRP 2015, 29, 233–238. [Google Scholar] [CrossRef]
  11. Gawron, J.H.; Keoleian, G.A.; De Kleine, R.D.; Wallington, T.J.; Kim, H.C. Life Cycle Assessment of Connected and Automated Vehicles: Sensing and Computing Subsystem and Vehicle Level Effects. Environ. Sci. Technol. 2018, 52, 3249–3256. [Google Scholar] [CrossRef] [PubMed]
  12. Pehrson, I. Integrating Planetary Boundaries into the Life Cycle Assessment of Electric Vehicles A Case Study on Prioritising Impact Categories through Environmental Benchmarking in Normalisation and Weighting Methods When Assessing Electric Heavy-Duty Vehicles; KTH Royal Institute of Technology: Stockholm, Sweden, 2020; Available online: http://kth.diva-portal.org/smash/record.jsf?pid=diva2%3A1470529&dswid=-6750 (accessed on 23 June 2023).
  13. Faria, R.; Marques, P.; Moura, P.; Freire, F.; Delgado, J.; De Almeida, A.T. Impact of the Electricity Mix and Use Profile in the Life-Cycle Assessment of Electric Vehicles. Renew. Sustain. Energy Rev. 2013, 24, 271–287. [Google Scholar] [CrossRef]
  14. Balpreet Kukreja. Lifecycle Analysis of Electric Vehicles. Available online: https://sustain.ubc.ca/about/resources/lifecycle-analysis-electric-vehicles (accessed on 16 June 2023).
  15. European Environment Agency. Electric Vehicles from Life Cycle and Circular Economy Perspectives; European Environment Agency: Copenhagen, Denmark, 2018; ISBN 978-92-9213-985-8. [Google Scholar]
  16. Pipitone, E.; Caltabellotta, S.; Occhipinti, L. A Life Cycle Environmental Impact Comparison between Traditional, Hybrid, and Electric Vehicles in the European Context. Sustainability 2021, 13, 10992. [Google Scholar] [CrossRef]
  17. Shafique, M.; Azam, A.; Rafiq, M.; Luo, X. Life Cycle Assessment of Electric Vehicles and Internal Combustion Engine Vehicles: A Case Study of Hong Kong. Res. Transp. Econ. 2022, 91, 101112. [Google Scholar] [CrossRef]
  18. Shafique, M.; Luo, X. Environmental Life Cycle Assessment of Battery Electric Vehicles from the Current and Future Energy Mix Perspective. J. Environ. Manag. 2022, 303, 114050. [Google Scholar] [CrossRef]
  19. Koroma, M.S.; Costa, D.; Philippot, M.; Cardellini, G.; Hosen, M.S.; Coosemans, T.; Messagie, M. Life Cycle Assessment of Battery Electric Vehicles: Implications of Future Electricity Mix and Different Battery End-of-Life Management. Sci. Total Environ. 2022, 831, 154859. [Google Scholar] [CrossRef] [PubMed]
  20. Ziegler, M.S.; Trancik, J.E. Re-Examining Rates of Lithium-Ion Battery Technology Improvement and Cost Decline. Energy Environ. Sci. 2021, 14, 1635–1651. [Google Scholar] [CrossRef]
  21. Faisal, A.; Kamruzzaman, M.; Yigitcanlar, T.; Currie, G. Understanding Autonomous Vehicles. J. Transp. Land Use 2019, 12, 45–72. [Google Scholar] [CrossRef] [Green Version]
  22. Taiebat, M.; Stolper, S.; Xu, M. Forecasting the Impact of Connected and Automated Vehicles on Energy Use: A Microeconomic Study of Induced Travel and Energy Rebound. Appl. Energy 2019, 247, 297–308. [Google Scholar] [CrossRef] [Green Version]
  23. Patella, S.M.; Scrucca, F.; Asdrubali, F.; Carrese, S. Carbon Footprint of Autonomous Vehicles at the Urban Mobility System Level: A Traffic Simulation-Based Approach. Transp. Res. Part D Transp. Environ. 2019, 74, 189–200. [Google Scholar] [CrossRef]
  24. Yu, Y.; Shi, C.; Shan, D.; Lippiello, V.; Yang, Y. A Hierarchical Control Scheme for Multiple Aerial Vehicle Transportation Systems with Uncertainties and State/Input Constraints. Appl. Math. Model. 2022, 109, 651–678. [Google Scholar] [CrossRef]
  25. Rajasekhar, M.V.; Jaswal, A.K. Autonomous Vehicles: The Future of Automobiles. In Proceedings of the 2015 IEEE International Transportation Electrification Conference (ITEC), Chennai, India, 27–29 August 2016; pp. 1–6. [Google Scholar] [CrossRef]
  26. Yu, Y.; Shan, D.; Benderius, O.; Berger, C.; Kang, Y. Formally Robust and Safe Trajectory Planning and Tracking for Autonomous Vehicles. IEEE Trans. Intell. Transp. Syst. 2022, 23, 22971–22987. [Google Scholar] [CrossRef]
  27. US Department of Transportation Automated Vehicle Safety|NHTSA. Available online: https://www.nhtsa.gov/technology-innovation/automated-vehicles-safety#issue-road-self-driving (accessed on 24 May 2023).
  28. Stephens, T.S.; Gonder, J.; Chen, Y.; Lin, Z.; Liu, C.; Gohlke, D. Estimated Bounds and Important Factors for Fuel Use and Consumer Costs of Connected and Automated Vehicles; National Renewal Energy Laboratory: Golden, CO, USA, 2016. [Google Scholar]
  29. Vahidi, A.; Sciarretta, A. Energy Saving Potentials of Connected and Automated Vehicles. Transp. Res. Part C Emerg. Technol. 2018, 95, 822–843. [Google Scholar] [CrossRef]
  30. Ross, C.; Guhathakurta, S. Autonomous Vehicles and Energy Impacts: A Scenario Analysis. Energy Procedia 2017, 143, 47–52. [Google Scholar] [CrossRef]
  31. Cox, B.; Mutel, C.L.; Bauer, C.; Mendoza Beltran, A.; Van Vuuren, D.P. Uncertain Environmental Footprint of Current and Future Battery Electric Vehicles. Environ. Sci. Technol. 2018, 52, 4989–4995. [Google Scholar] [CrossRef] [PubMed]
  32. Biramo, Z.B.; Mekonnen, A.A. Modeling the Potential Impacts of Automated Vehicles on Pollutant Emissions under Different Scenarios of a Test Track. Environ. Syst. Res. 2022, 11, 22. [Google Scholar] [CrossRef] [PubMed]
  33. Massar, M.; Reza, I.; Rahman, S.M.; Abdullah, S.M.H.; Jamal, A.; Al-Ismail, F.S. Impacts of Autonomous Vehicles on Greenhouse Gas Emissions—Positive or Negative? Int. J. Environ. Res. Public Health 2021, 18, 5567. [Google Scholar] [CrossRef]
  34. Brown, A.; Gonder, J.; Repac, B.; Meyer, G.; Beiker, S.; Brown, A.; Gonder, J.; Repac, B. An Analysis of Possible Energy Impacts of Automated Vehicles. In Road Vehicle Automation; Lecture Notes in Mobility; Springer: Cham, Switzerland, 2014; pp. 137–153. [Google Scholar] [CrossRef]
  35. Zhong, S.; Liu, A.; Jiang, Y.; Hu, S.; Xiao, F.; Huang, H.-J.; Song, Y. Energy and Environmental Impacts of Shared Autonomous Vehicles under Different Pricing Strategies. NPJ Urban Sustain. 2023, 3, 8. [Google Scholar] [CrossRef]
  36. Kontar, W.; Ahn, S.; Hicks, A. Autonomous Vehicle Adoption: Use Phase Environmental Implications. Environ. Res. Lett. 2021, 16, 064010. [Google Scholar] [CrossRef]
  37. Huber, D.; Viere, T.; Horschutz Nemoto, E.; Jaroudi, I.; Korbee, D.; Fournier, G. Climate and Environmental Impacts of Automated Minibuses in Future Public Transportation. Transp. Res. Part D Transp. Environ. 2022, 102, 103160. [Google Scholar] [CrossRef]
  38. Ahmed, A.A.; Nazzal, M.A.; Darras, B.M.; Deiab, I.M. Global Warming Potential, Water Footprint, and Energy Demand of Shared Autonomous Electric Vehicles Incorporating Circular Economy Practices. Sustain. Prod. Consum. 2023, 36, 449–462. [Google Scholar] [CrossRef]
  39. ISO14040:2006; International Organization for Standardization Environmental Management—Life Cycle Assessment—Principles and Framework. Available online: https://www.iso.org/standard/37456.html (accessed on 15 June 2023).
  40. ISO14044:2006; International Organization for Standardization Environmental Management—Life Cycle Assessment—Requirements and Guidelines. Available online: https://www.iso.org/standard/38498.html (accessed on 15 June 2023).
  41. Wernet, G.; Bauer, C.; Steubing, B.; Reinhard, J.; Moreno-Ruiz, E.; Weidema, B. The Ecoinvent Database Version 3 (Part I): Overview and Methodology. Int. J. Life Cycle Assess. 2016, 21, 1218–1230. [Google Scholar] [CrossRef]
  42. Sphera Life Cycle Assessment (LCA) Software. LCA for Experts (GaBi). Available online: https://sphera.com/life-cycle-assessment-lca-software/ (accessed on 15 June 2023).
  43. Bare, J. Tool for the Reduction and Assessment of Chemical and Other Environmental Impacts (TRACI). Version 2.1—User’s Manual; EPA/600/R-12/554; U. S. EPA Office of Research and Development: Washington, DC, USA, 2014.
  44. Sato, F.E.K.; Nakata, T. Energy Consumption Analysis for Vehicle Production through a Material Flow Approach. Energies 2020, 13, 2396. [Google Scholar] [CrossRef]
  45. Fernando, C.; Soo, V.K.; Compston, P.; Kim, H.C.; de Kleine, R.; Weigl, D.; Keith, D.R.; Doolan, M. Life Cycle Environmental Assessment of a Transition to Mobility Servitization. Procedia CIRP 2020, 90, 238–243. [Google Scholar] [CrossRef]
  46. IEA Executive Summary—Norway 2022. Available online: https://www.iea.org/reports/norway-2022/executive-summary (accessed on 15 June 2023).
  47. IEA Executive Summary—Poland 2022. Available online: https://www.iea.org/reports/poland-2022/executive-summary (accessed on 15 June 2023).
  48. World Nuclear Ssociation Nuclear Power in France|French Nuclear Energy. Available online: https://world-nuclear.org/information-library/country-profiles/countries-a-f/france.aspx (accessed on 15 June 2023).
  49. Bello, A.S.; Zouari, N.; Da’ana, D.A.; Hahladakis, J.N.; Al-Ghouti, M.A. An Overview of Brine Management: Emerging Desalination Technologies, Life Cycle Assessment, and Metal Recovery Methodologies. J. Environ. Manag. 2021, 288, 112358. [Google Scholar] [CrossRef]
  50. Volkart, K.; Bauer, C.; Boulet, C. Life Cycle Assessment of Carbon Capture and Storage in Power Generation and Industry in Europe. Int. J. Greenh. Gas Control 2013, 16, 91–106. [Google Scholar] [CrossRef]
  51. Celik, I. Eco-Design of Emerging Photovoltaic (PV) Cells. Ph.D. Thesis, University of Toledo, Toledo, OH, USA, 2018; p. 133. [Google Scholar]
  52. Finnveden, G.; Hauschild, M.Z.; Ekvall, T.; Guinée, J.; Heijungs, R.; Hellweg, S.; Koehler, A.; Pennington, D.; Suh, S. Recent Developments in Life Cycle Assessment. J. Environ. Manag. 2009, 91, 1–21. [Google Scholar] [CrossRef]
  53. Wang, Y.; Pan, Z.; Zhang, W.; Borhani, T.N.; Li, R.; Zhang, Z. Life Cycle Assessment of Combustion-Based Electricity Generation Technologies Integrated with Carbon Capture and Storage: A Review. Environ. Res. 2022, 207, 112219. [Google Scholar] [CrossRef]
  54. IEA World Energy Balances: Overview, IEA, Paris. Available online: https://www.iea.org/reports/world-energy-balances-overview/world (accessed on 24 May 2023).
  55. Zhang, Y.; Wu, D.; Wang, C.; Fu, X.; Wu, G. Impact of Coal Power Generation on the Characteristics and Risk of Heavy Metal Pollution in Nearby Soil. Ecosyst. Health Sustain. 2020, 6, 1787092. [Google Scholar] [CrossRef]
  56. Celik, I.; Song, Z.; Cimaroli, A.J.; Yan, Y.; Heben, M.J.; Apul, D. Life Cycle Assessment (LCA) of Perovskite PV Cells Projected from Lab to Fab. Sol. Energy Mater. Sol. Cells 2016, 156, 157–169. [Google Scholar] [CrossRef] [Green Version]
  57. Villalba, G.; Ayres, R.U.; Schroder, H. Accounting for Fluorine: Production, Use, and Loss. J. Ind. Ecol. 2007, 11, 85–101. [Google Scholar] [CrossRef]
  58. Kucukvar, M.; Onat, N.C.; Kutty, A.A.; Adella, G.M.; Bulak, M.E.; Ansari, F.; Kumbaroglu, G. Environmental Efficiency of Electric Vehicles in Europe under Various Electricity Production Mix Scenarios. J. Clean. Prod. 2022, 335, 130291. [Google Scholar] [CrossRef]
Figure 1. System boundary and components of distinct types of vehicles.
Energies 16 05009 g001
Figure 2. Normalized environmental impacts of different types of vehicles at the manufacturing phase. The environmental impact of each type was normalized according to the impacts from ICEV at the manufacturing phase. The normalized environmental impacts of ICEVs in each category were equal to one (reference point), and a comparative analysis was conducted based on this reference point.
Energies 16 05009 g002
Figure 3. Normalized environmental impacts of different types of vehicles in the use phase.
Energies 16 05009 g003
Figure 4. The use phase impacts of alternative transportation systems based on different electricity grids of distinct locations, such as Norway (NO), Poland (PL), and France (FR). Note that the baseline analysis was done based on the global average (GLO) of the electricity mix. The impact from each environmental category was normalized to the impacts from ICEV.
Energies 16 05009 g004
Table 1. Inventories for manufacturing and use phase of ICEV, EV, and A-EVs types. For the use phase, A-EVs were categorized into A-EV1(automation levels zero through two) [11] and A-EV2 (automation levels three through five) [30]. * indicates electricity utilized for A-EV1, and ** indicates energy utilized for A-EV2 types during the use phase.
PhaseComponentsICEVEVA-EV
MaterialsUnitsMass MaterialsUnitsMassMass
Manufacturing PhaseEnginesCast Ironkg102Copperkg4.504.51
Aluminumkg61.4Steelkg23.923.9
Steelkg20.5NdFeBkg1.301.32
Plastickg9.20----
Rubberkg9.20----
Copperkg2.00----
BatteryPbSb 2.5%kg1.10Battery cellkg152152
Leadkg0.01Anodekg59.059.0
Sulfuric Acidkg0.80Cathodekg65.065.0
Water (Deionized)kg0.86Separatorkg3.303.30
Paper/Glass kg0.38Electrolytekg24.024.0
Polypropylenekg1.04Cell containerkg1.001.00
Distilled Waterg2.00Battery casekg81.081.0
Pulp Paperkg0.40BMSkg9.409.42
Foilg2.01Cooling kg10.010.0
Ironkg0.04----
Additional---Cast Iron--0.20
---Aluminum--9.40
---Copperkg 0.70
---Steelkg-0.30
---Glasskg-0.10
---Rare earth metalskg-0.20
---Plastickg-1.60
---Electronicskg-3.90
EnergyElectricityGJ27.0ElectricityGJ29.029.0
Use PhaseEnergy UsePetroleumlit/km0.05ElectricityWh/km206177 *
103 **
Table 2. Normalized combined (manufacturing and use phase) environmental impacts of ICEV, EV, and A-EVs per 150,000 miles per passenger. The environmental impacts are normalized with respect to ICEV combined impacts. The actual environmental impacts of ICEVs are shown in the last column.
Impact CategoriesEVA-EV1A-EV2ICEVICEV
(150,000 Miles·Passenger)
Acidification1.141.020.671.001.70 × 102 (kg SO2-eq)
Ecotoxicity3.863.512.341.002.14 × 105 (CTUe)
Eutrophication2.662.421.611.006.56 × 10 (kg Neq)
Global warming0.500.440.281.008.59 × 104 (kg CO2-eq)
Human health particulate3.322.941.911.002.69 × 10 (kg PM2.5-eq)
Human tox., cancer3.383.072.061.007.57 × 10−4 (CTUh)
Human tox., non-can1.861.811.271.006.02 × 10−3 (CTUh)
Ozone depletion0.120.110.071.001.85 × 10−2 (kg CFC 11eq)
Resources0.200.180.111.001.53 × 105 (MJ energy)
Smog Air1.221.080.711.001.95 × 103 (kg O3-eq)
Disclaimer/Publisher’s Note: The statements, opinions and data contained in all publications are solely those of the individual author(s) and contributor(s) and not of MDPI and/or the editor(s). MDPI and/or the editor(s) disclaim responsibility for any injury to people or property resulting from any ideas, methods, instructions or products referred to in the content.

