1. Introduction
AC electrical power transmission and distribution networks have been massively developed for industrial and societal needs since the end of the XIXth century. However, over the last two decades, changes have appeared. The emergence of quantum and digital technologies has led to the development of new renewable energy sources [
1,
2] and energy storage systems (photovoltaic panels, wind turbines, fuel cells, batteries, etc.). Additionally, the massive arrival of power electronics in much traditional equipment (lighting, power supply of various appliances, etc.) or new uses (electric vehicles, decentralized production, etc.) generates a considerable increase in the level of disturbance in the AC networks.
Instrument transformers (ITs) are used to transform the voltage or the current between its primary and secondary terminals, ensuring safe electrical isolation between both terminals. These high-accuracy electrical devices are installed on the high- and medium-voltage (HV and MV) electrical networks and are often used to measure voltage or current with impact on energy management. Thus, ITs are exposed to the current environment of smart grids and the existing power quality phenomena [
3]. Their characterization in conditions as close to reality as possible is necessary and requested [
4].
Inductive voltage transformers are designed to respect their accuracy class in conditions defined by the family of standards IEC 61869 [
5,
6,
7]. The effect of several quantities, such as burden, temperature, magnetic and electric fields produced by adjacent phases and the proximity effect, is considered. However, only one quantity is evaluated at a time. The simultaneous presence of different influence factors often occurs on-site and can lead to an increase or decrease in IT errors. Additionally, the installed ITs are exposed to the distorted signals flowing through the electric networks. How much confidence can we have in the indications of these transformers? Neither the current standards nor the publications in this field provide indications on the performance of ITs or on the specific tests to be performed in the presence of combined influence factors.
In order to increase knowledge and bring clarification on these subjects, a European project started in 2020, the EMPIR 19NRM05 IT4PQ project, focused on the characterization of ITs used for PQ measurements [
8,
9]. The work presented in this paper was performed within the project framework. It focuses on the influence of three combined factors: temperature, vibrations and harmonics, on the performance of a medium-voltage inductive IT. Harmonics are analyzed from two points of view: as an influencing factor and as a parameter to measure.
The novelty of the presented work lies in the realization of a complete system allowing the study of combined factors of influence on the performance of an inductive medium-voltage instrument transformer. Temperature constraints, vibrations and harmonics are applied during the operation of the transformer when it is energized. Indeed, the current versions of international standards in the IEC 61869-X series about IT testing take into account the effect of several influence quantities but do not take into account the influence of vibration as an influence factor. In fact, ITs are usually operating in locations subject to vibration produced by different sources (wind turbines, traffic roads, railroads, power transformers, etc.). Generally, the vibration tests are usually performed without powering them, only to validate the mechanical structure. Vibration as an influence factor has never been studied in the past. At the European level, there is a lack of a platform able to combine high voltage and vibrations. The developed platform will be available for industries to test their ITs at the fundamental frequency of 50 Hz and at PQ measurements up to 9 kHz in the presence of vibrations but also combined with temperature, which is one of the most important parameters to handle. In this paper, a medium-voltage IT is tested, and it is demonstrated that at 50 Hz, the influence of temperature is more visible than the vibration. At PQ measurements, it is demonstrated that the vibrations influence the frequency response of the voltage IT at very low temperatures. This last piece of information has to be taken into account by bodies dealing with grid PQ measurements.
The paper is structured as follows:
Section 2 describes the whole test platform with a focus on the system used to generate harmonics up to 9 kHz and superpose them with the 50 Hz high voltage. It also describes the test conditions (applied temperature profile, vibration parameters and generated harmonics);
Section 3 presents the voltage IT characterization results; and
Section 4 concludes this paper.
2. Theoretical Model of ITs in the Presence of Vibration and Temperature
Mechanical vibrations, depending on how the internal structure of the IT is designed, could lead to the displacement of the windings and the core or to the separation and compression of the turns. Any change in the internal mechanical structure (windings and core) ultimately affects the stray capacitances of the IT, leading to a change in its frequency response. In the worst cases, the vibration could produce friction on the magnetic core, affecting its integrity and hence its magnetizing inductance and reducing its life. Excessive vibrations could be seen as a major cause of winding displacement and deformation.
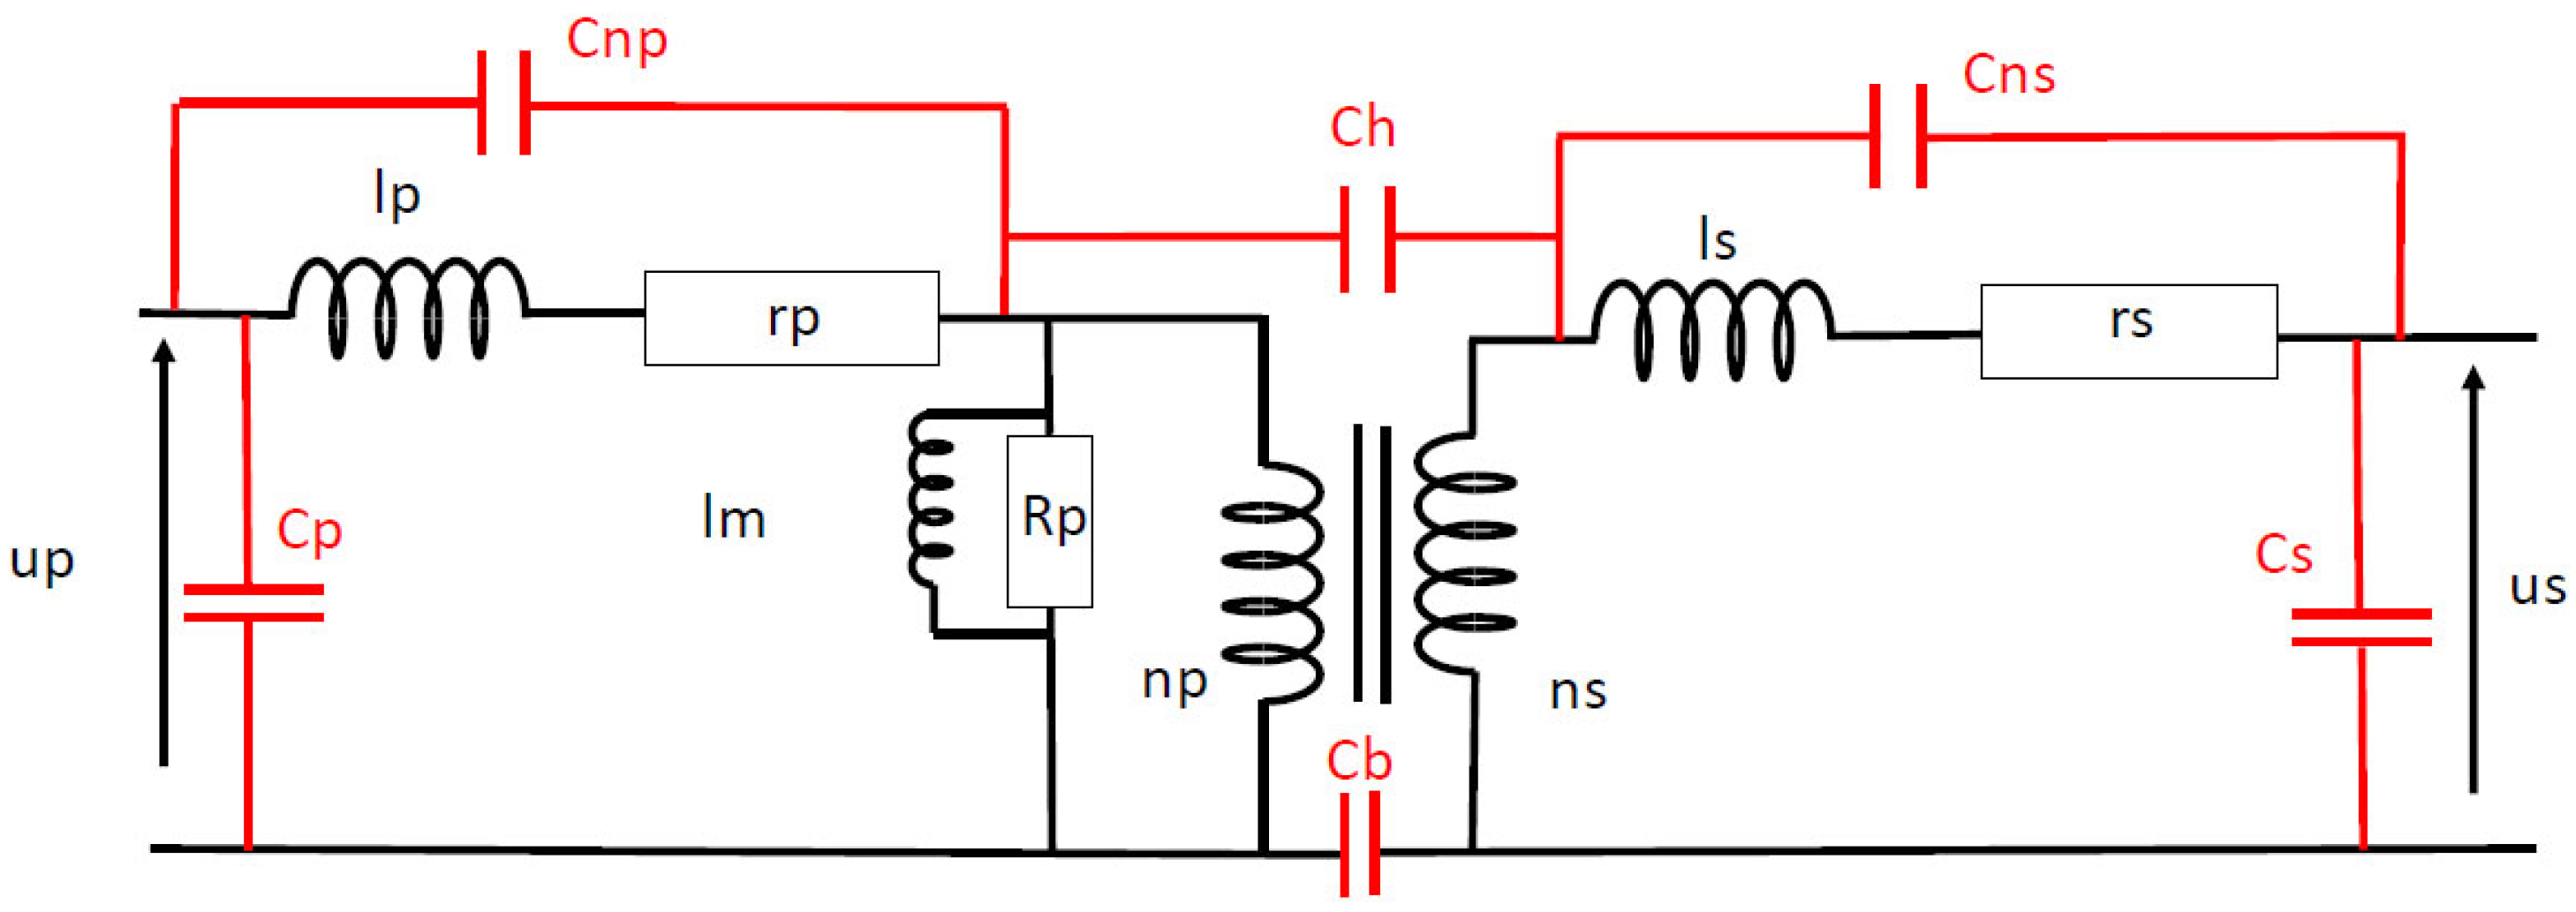
The frequency response of ITs is affected by the stray capacitances as presented in
Figure 1, which represents the equivalent circuit of the transformer. There are three types of stray capacitance: The capacitances between turns (Cnp for the primary winding and Cns for the secondary winding, respectively). The internal capacitance of the primary and secondary windings, which are Cp and Cn, respectively. The capacitances between the windings are, respectively, Cb and Ch. In
Figure 1, lp and ls are the loss-free coils of the windings, rp and rs are the resistance of the windings, Rp represents the iron and core losses, and “lm” is the magnetizing inductance. At industrial frequencies, the ratio between the primary and secondary voltages is the ratio between the number of turns between the primary and secondary windings. At frequencies up to a few kilohertz, the stray capacitances could affect the frequency response of the IT.
The model in
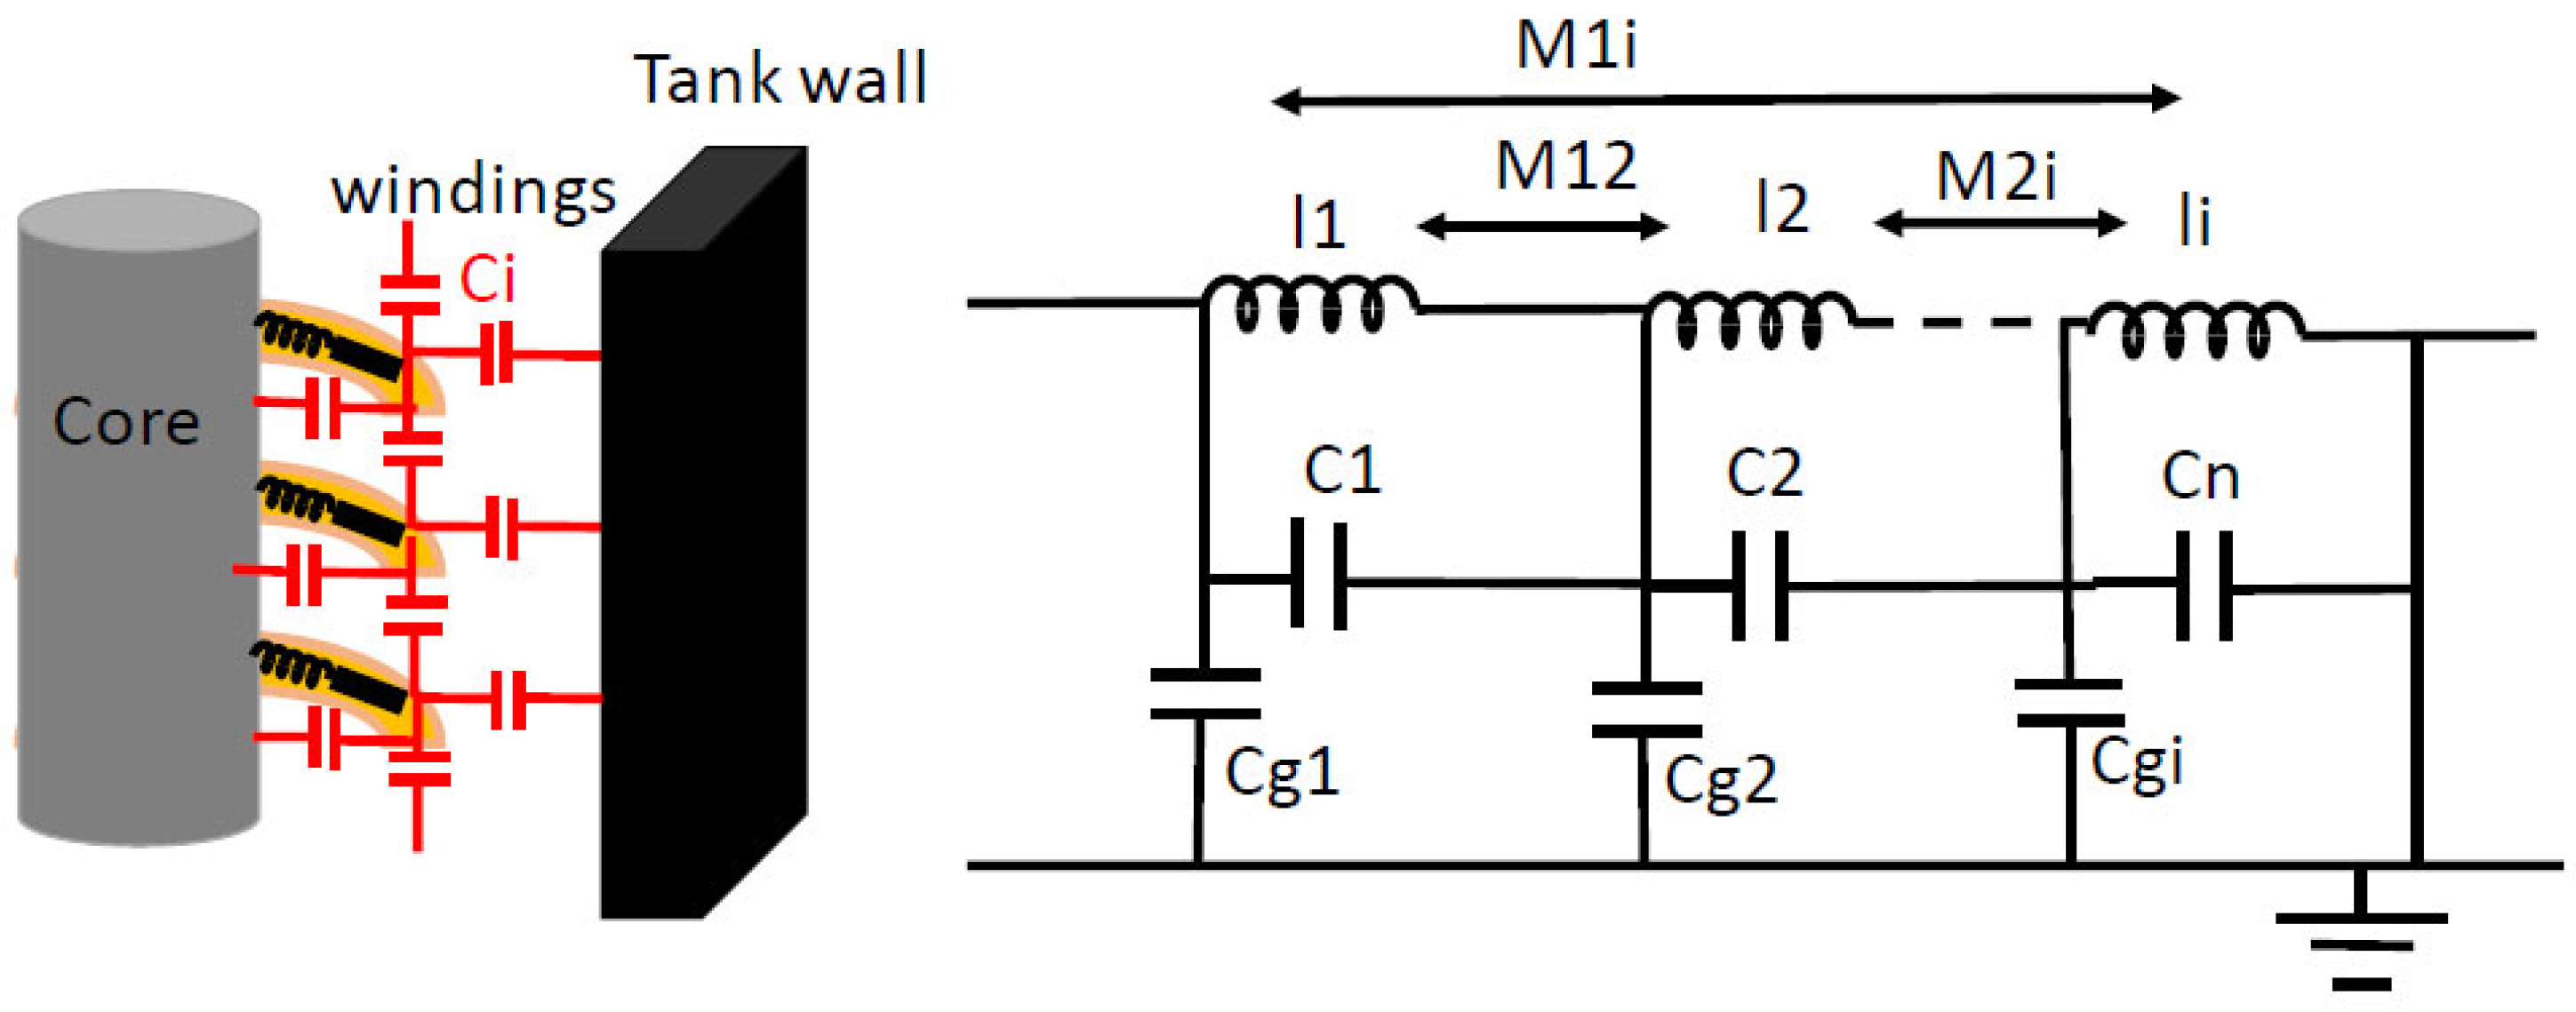
Figure 1 could only be valid up to a few kilohertz; for higher frequencies, it is not sufficiently explicit, particularly at the structural scale of the windings. Therefore, a model based on a “discretization” of the windings is preferable.
Figure 2 shows that it takes into account all the influences: The specific inductance of each turn, the mutual induction between each turn, the winding resistance, the capacitance between each turn, and the capacitance between each turn and the ground. Since the coil is a continuous wire, the model is composed of a chain of elementary cells, with each cell representing a turn.
Any interaction, displacement, separation and compression of these successive elements will lead to a modification of the stray capacitance and then the frequency response of the ITs. Axial vibrations will separate or compress the turns; radial vibrations will separate the turns from the core; and vectorial vibrations will produce a complete deformation of the winding.
Regarding the temperature, all the elements constituting the transformer are subject to a change in their electrical properties with the change in temperature. For example, passive components such as resistances, capacitances and inductances are temperature-dependent. The permeability of the magnetic core and the permittivity of the insulating materials (oil, epoxy, etc.) have electrical properties that change with temperature. When designing the mechanical structure with different materials, thermoelectric effects such as the Peltier effect and the Seebeck effect could appear inside or outside the IT, especially where different materials are connected together. As with all electrical devices, a fraction of energy is transformed into heat, producing a rise in IT temperature. For all these aspects, the temperature is one of the influence parameters that is not easy to handle. IT manufacturers have put in a lot of effort to increase the performance of IT at extreme temperatures by using adequate materials with low-temperature dependency, adequate mechanical structures and temperature compensation techniques.
3. Measurement Set-Up and Testing Platform
3.1. Principle
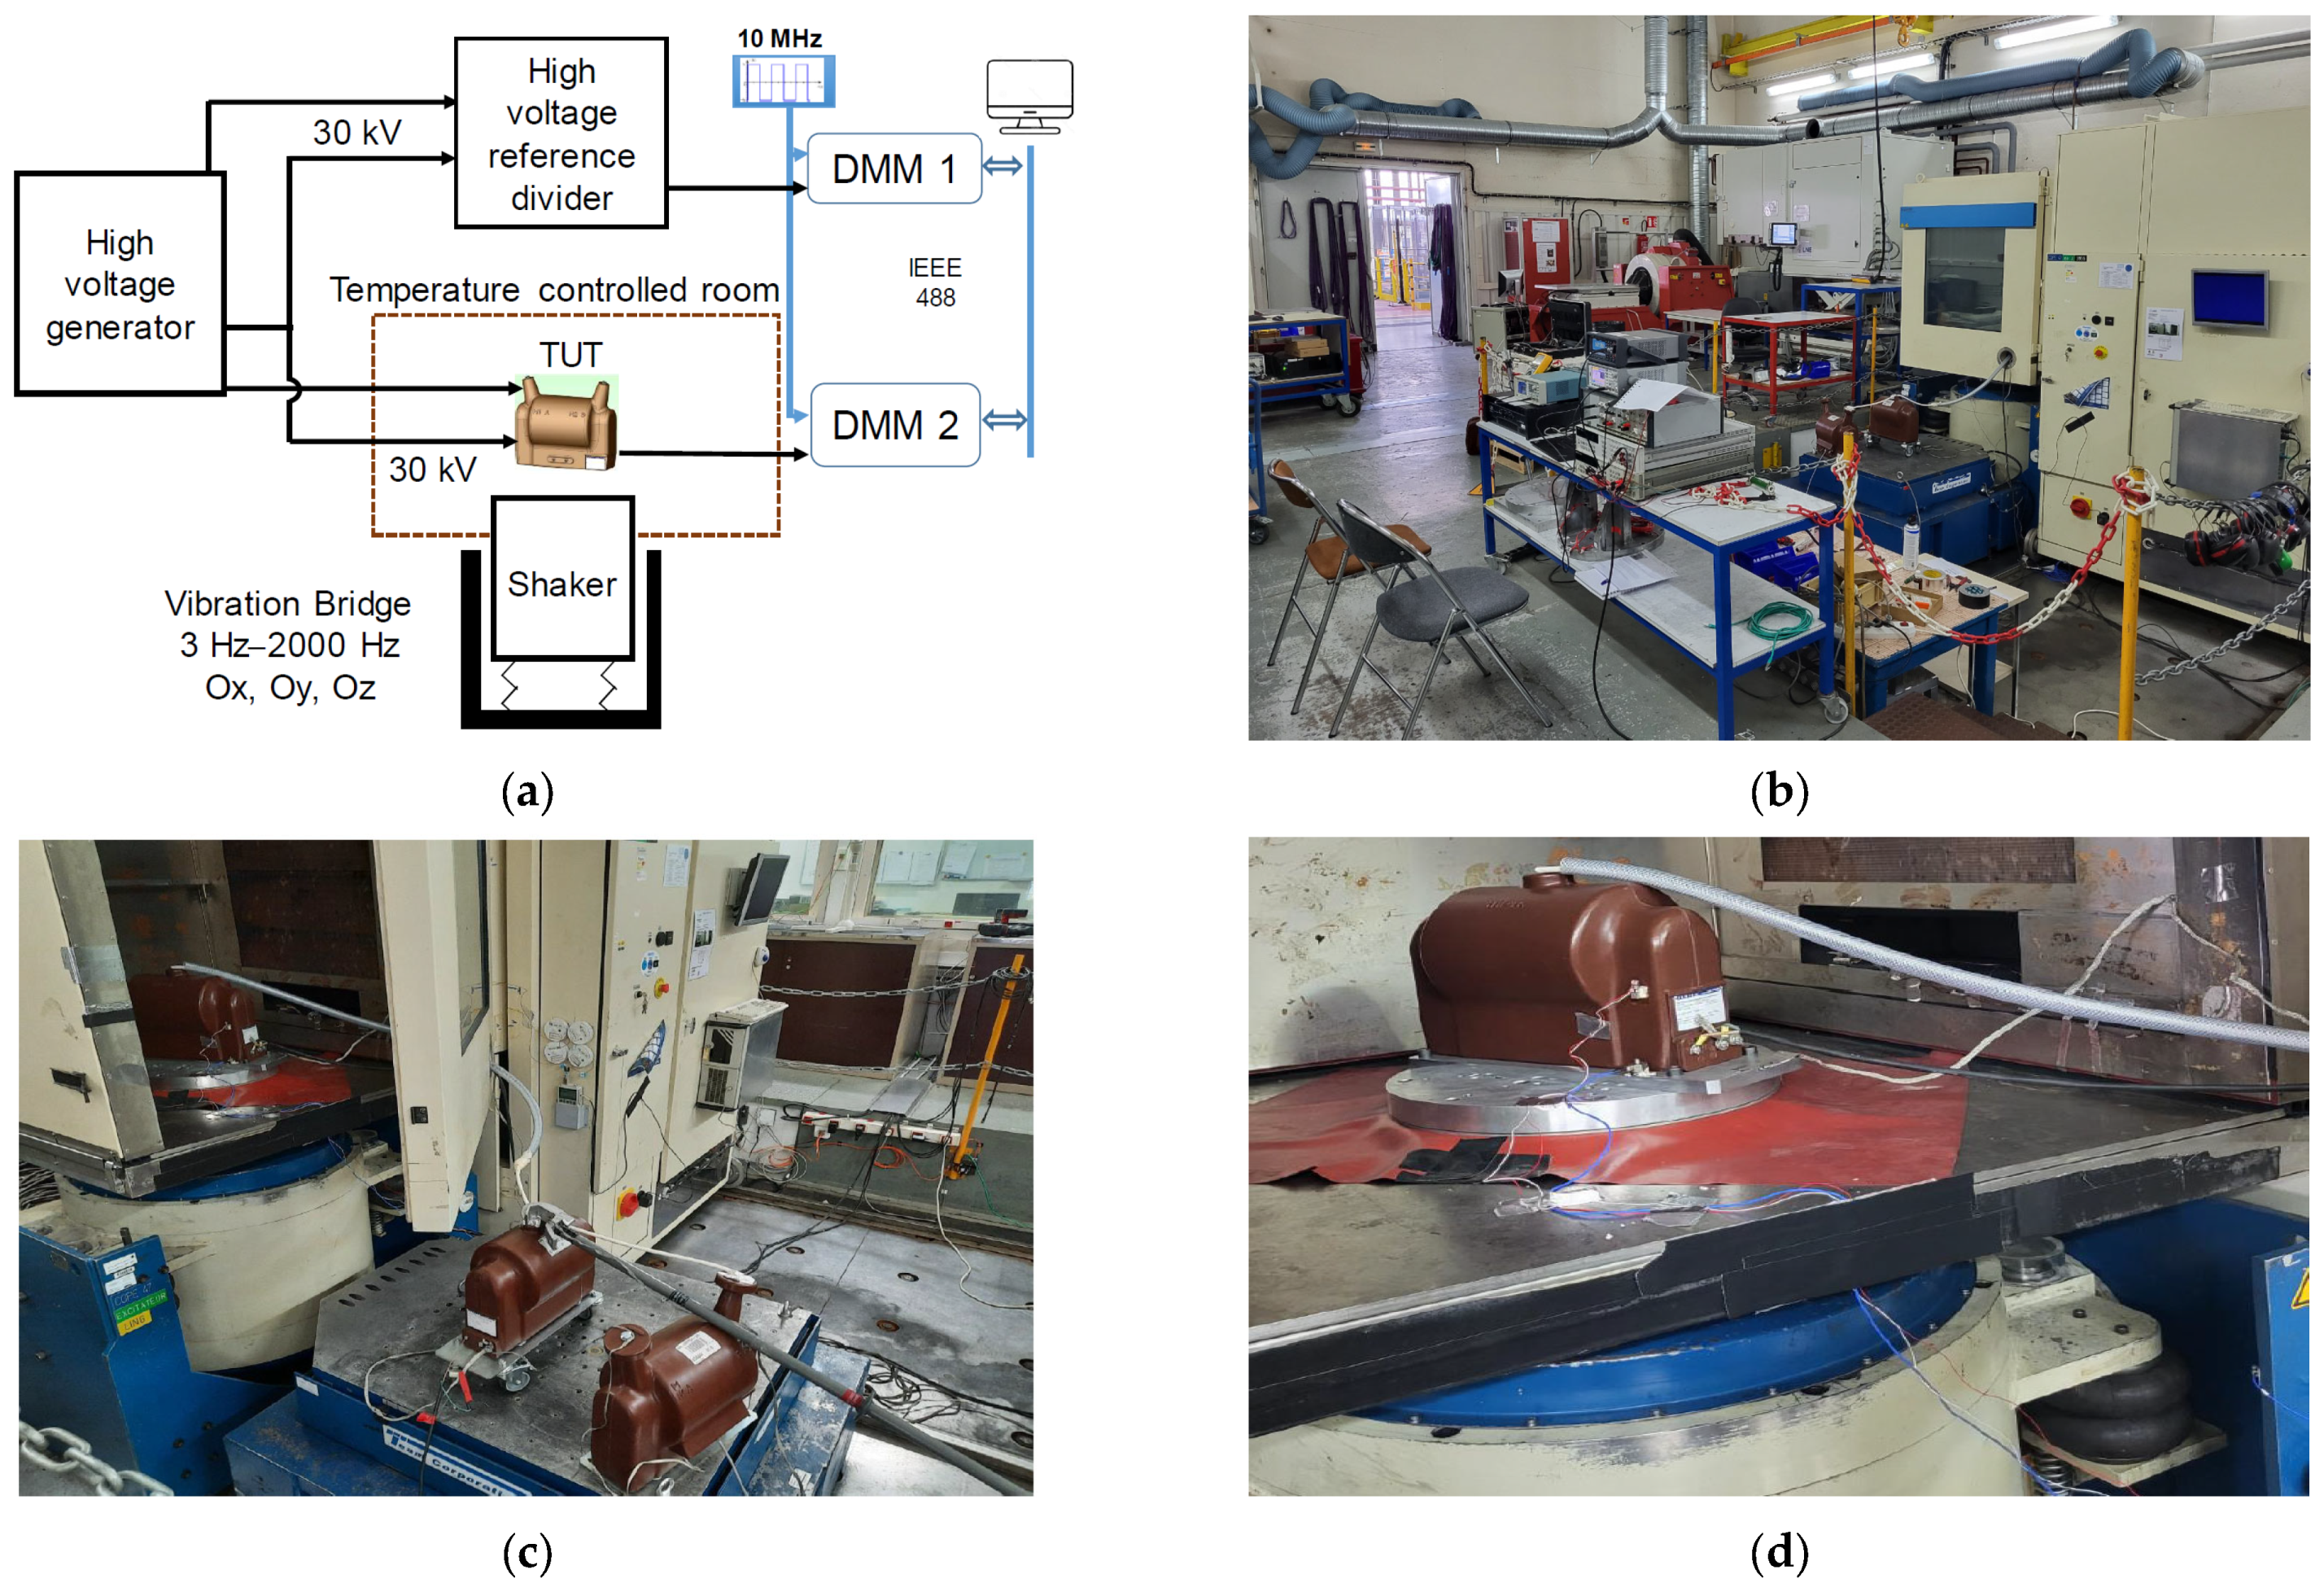
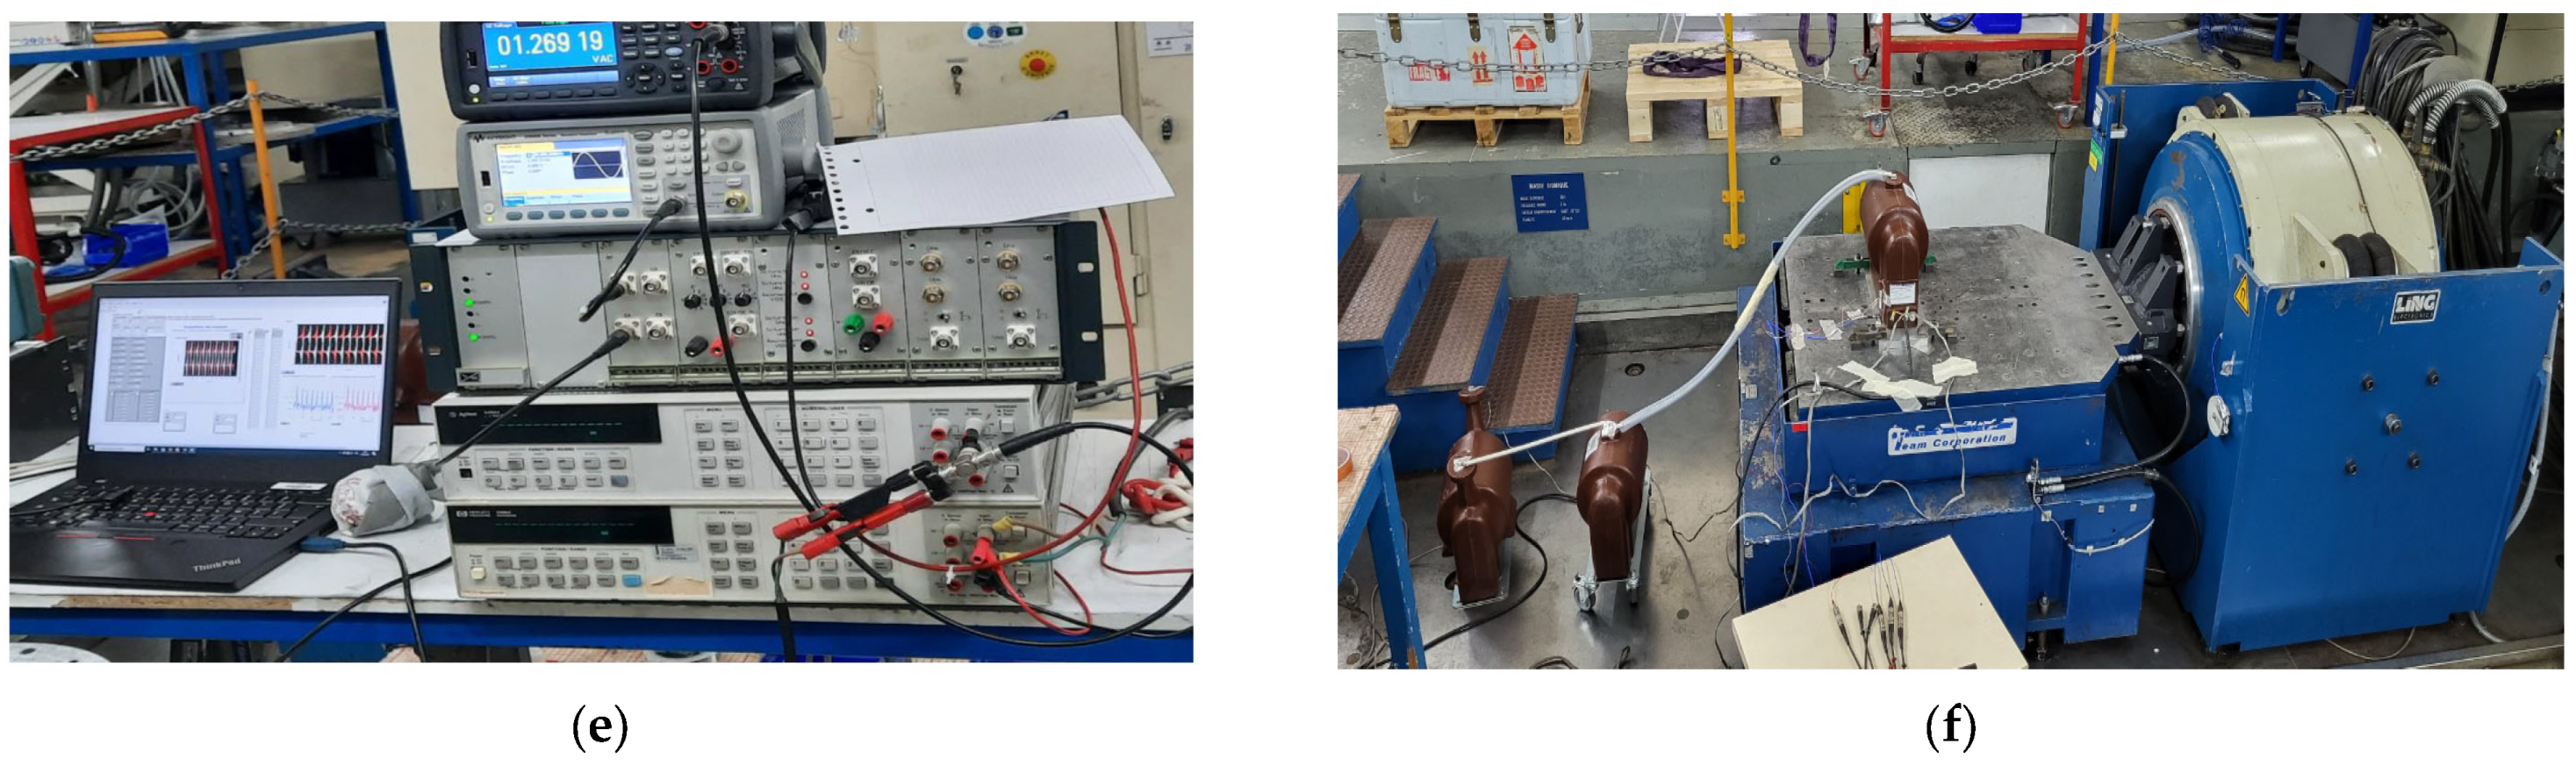
The combined temperature, vibration and harmonic measurement setup is presented in
Figure 3. The traceable calibration of IT is carried out by comparison with a standard high-voltage divider. The secondary voltages are measured using two accurate, synchronized digitizers. The measured quantities for the fundamentals and harmonics are the ratio error (Equation (1)) and the phase displacement (Equation (2)). A first calibration of the Transformer Under Calibration (TUT) is performed with sinusoidal waveforms in a controlled environment at (23.0 ± 0.5) °C. Then, its performance is evaluated in the presence of temperature, vibration and harmonic influence factors. A climatic chamber with a 1.0 m
3 volume and controlled temperature and humidity variation is used for the tests. Only the TUT is placed inside the climate chamber, which is installed on a mobile rank.
For the vibration tests, an electrodynamic LDS shaker was used. The shaker can vibrate with frequencies ranging from 3 Hz to 2 kHz, generate peak-to-peak displacements from 25 mm to 75 mm, and exert a force from 27 kN to 80 kN. Sinusoidal vibrations were applied along three axes (x, y and z). The climatic chamber, with the TUT inside, was placed over the electromagnetic shaker during the vertical vibrations. The shaker position changes for horizontal vibrations such as those that move the platform hosting the TUT.
3.2. Measuring System
The measuring system is composed of a high-voltage divider associated with two accurate, synchronized sampling voltmeters (DMM 1 and DMM 2). When the measurement is performed at only 50 Hz, a standard transformer is used, and for frequencies up to 9 kHz, a capacitive divider is used. The LNE voltage dividers are characterized in terms of temperature coefficient, voltage coefficient and frequency response.
The uncertainty of the calibration of the standard divider is a function of frequency f. It is equal to (0.13 × f + 20) ppm for the ratio error (ppm is a relative value, which means parts per million; 1 ppm = 1 µV/V) and (0.13 × f + 20) µrad for the phase displacement. For the fundamental frequency, the uncertainties are 26.5 ppm for the ratio error and 26.5 µrad for the phase displacement, respectively. At 9 kHz, the uncertainties are 0.11% for the ratio error and 1.1 mrad for the phase displacement.
The sampling voltmeters are the 3458A type from Keysight. They were configured in DC sampling mode, which allows the digitization of signals with a sampling rate of up to 100 kHz. In order to avoid errors resulting from the approximation of an infinite signal by a finite signal when the Discrete Fourier Transform is processed, the signal was sampled over a whole number of periods to satisfy the equation fs = (N/M) × fv. Where fs is the sampling frequency, fv is the frequency of the signal, M is the number of periods, and N is the number of samples. The sampling frequencies were varied depending on the harmonic content to be measured in order to have the best accuracy. Frequencies of 6.4 kHz, 12.8 kHz and 25.6 kHz are used to cover the range of harmonics up to 9 kHz. The resolution of the sampling voltmeters was kept at 18 bits in order to allow a very low voltage quantification error. Each measurement was repeated 10 times to reduce the random errors. The accuracy of the ADCs was checked in terms of voltage ratio and phase error before the measurements.
The temperature inside the controlled room is measured using a calibrated thermocouple fixed on one of the sides of the TUT. Two accelerometers are also fixed on the TUT to check its vibration frequency.
Figure 3d indicates their locations.
The measured quantities are the ratio error ε
n and the phase displacement φ
n. They are defined, respectively, by:
where:
εn is the ratio error at the frequency n,
kr = Vp/Vs is the rated scale factor of the TUT,
V(Pn) is the value of the primary voltage at the frequency n,
V(Sn) is the value of the secondary voltage at the frequency n,
φn is the phase displacement defined as the phase difference between the secondary V(Sn) and primary V(Pn) voltages. The phase displacement is considered positive when the secondary voltage phasor leads the primary voltage phasor.
The frequency varies from 50 Hz (n = 0) to the highest studied harmonic frequency 9 kHz (n = 180).
3.3. Generation Systems
An important aspect studied and presented in this paper concerns the performance of an inductive voltage IT in the presence of harmonics as well as its frequency response. Research work was performed by the consortium of the IT4PQ project in order to define the maximum amplitudes of harmonics and interharmonics up to 9 kHz present in MV grids. This research is based on the literature [
10,
11,
12], the expressed need by the standardization committees, and the transient phenomena currently present in medium-voltage grids.
Table 1 presents these amplitudes for voltage transformers.
The IT4PQ project aims to study IT performance up to the same frequency range. Generating harmonics and superposing them with a 30 kV, 50 Hz supply voltage is not a trivial task [
13]. On MV grids, the generation of harmonics at frequencies up to 9 kHz occurs in an uncontrolled manner. In order to evaluate the ITs under controlled conditions, there is a need to develop generators that are not yet available on the market. National metrology institutes around the world have put in big efforts to improve generation systems up to at least 9 kHz. Typically, the best NMI facilities for voltage generation do not go beyond 10 kHz and have very small amplitudes (a few tens of volts) superposed to 35 kV and 50 Hz fundamental. Indeed, the most popular devices are high-voltage amplifiers able to generate up to 35 kV/50 Hz, but due to their limited bandwidth, they cannot supply high amplitudes at high frequencies. Validated and stable generators remain an important tool and are considered an essential part of the test circuit. The generation set-up has to be designed so as to ensure the safety of the devices by avoiding the propagation of harmonics in the 50 Hz generation part. Two methods are developed: one for generating voltage harmonics up to 4 kHz and another for up to 9 kHz.
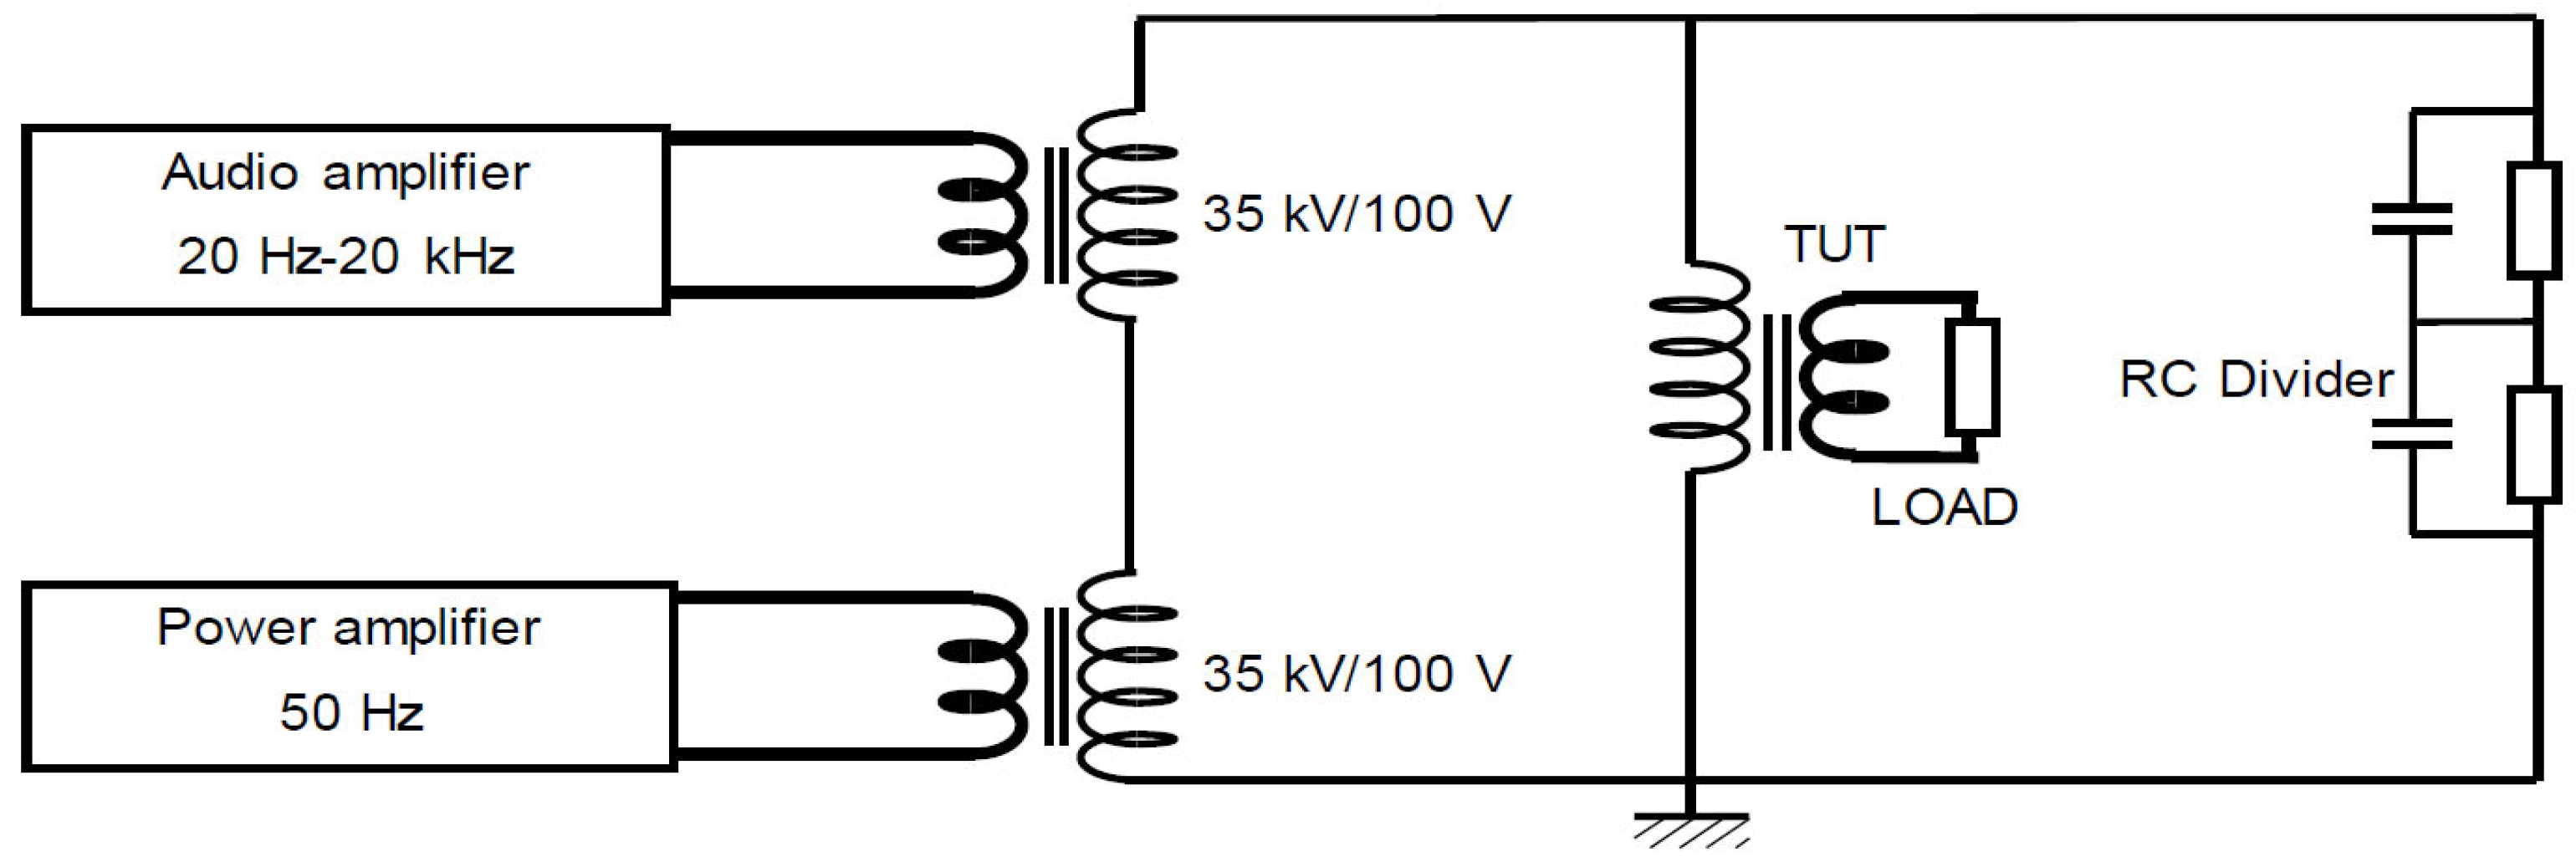
Two-generation systems were developed to study the performance of the TUT when a distorted signal is applied: a 50 Hz fundamental frequency superimposed with one harmonic that might go up to 9 kHz. A first set-up is used to generate harmonics up to 4 kHz and relies on two step-up transformers of 100 V/35 kV series connected, as illustrated in
Figure 4. An audio amplifier with 20 kHz bandwidth and 15 A/120 V output power pilots one voltage transformer to generate the target harmonics. It supplies pure sinusoidal signals with very low total harmonic distortion (typically lower than 0.1%). The audio amplifier is practically suitable for the generation of controlled high-voltage harmonics, or interharmonics when it is associated with a step-up transformer. For the generation of the voltage up to 35 kV and 50 Hz, a power amplifier of type APX160 is used to supply and pilot the second step-up transformer.
Figure 4 illustrates the principle of this first method. An RC divider was used to acquire the signals; it has a ratio of 1000 and a flat frequency response up to several hundreds of kHz. Its input impedance is equivalent to a resistor of 100 MΩ in parallel with a capacitance of 10 pF. This low impedance is needed in order to keep the capacitive load as small as possible.
The harmonic generation capabilities of the first generator are presented in
Table 2. According to the requirements mentioned in
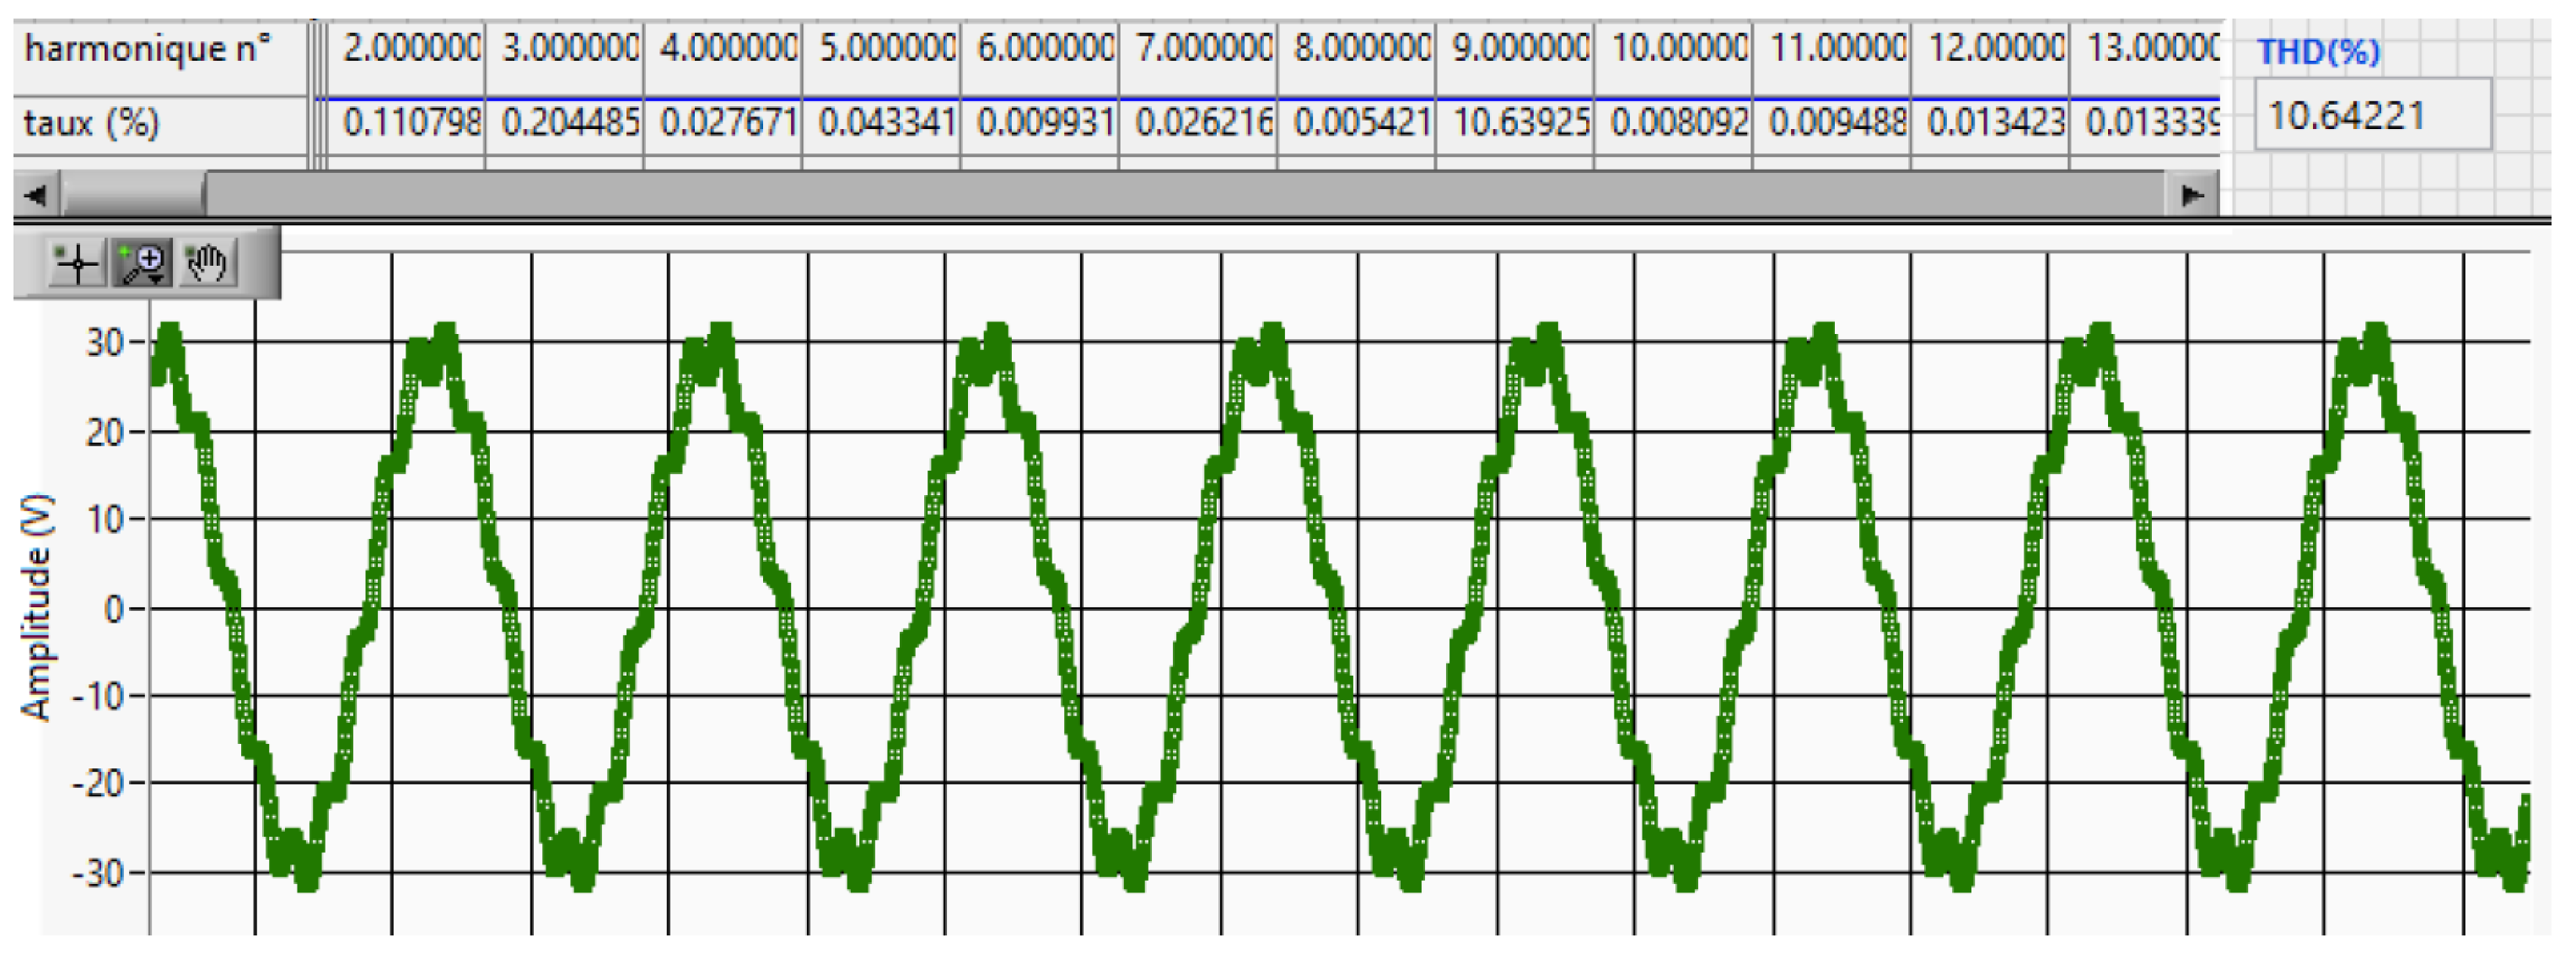
Table 1, the objective was achieved up to the 50th order and partially covered for orders up to the 100th. It was observed that a relative level of 10% is successfully tested up to the 60th order and 3.3% up to the 84th. Above the 84th order, the capability of generation decreases dramatically, e.g., 0.33% for the 96th order. These limitations at high frequencies are essentially due to the maximum permissible admitted secondary current of the step-up transformer, which was 10 A RMS. An example of a generated waveform is presented in
Figure 5. It represents the output of the signals measured at the output of the voltage divider via a Labview v.2020 software algorithm and FFT signal processing for the calculation of the quantities to be measured.
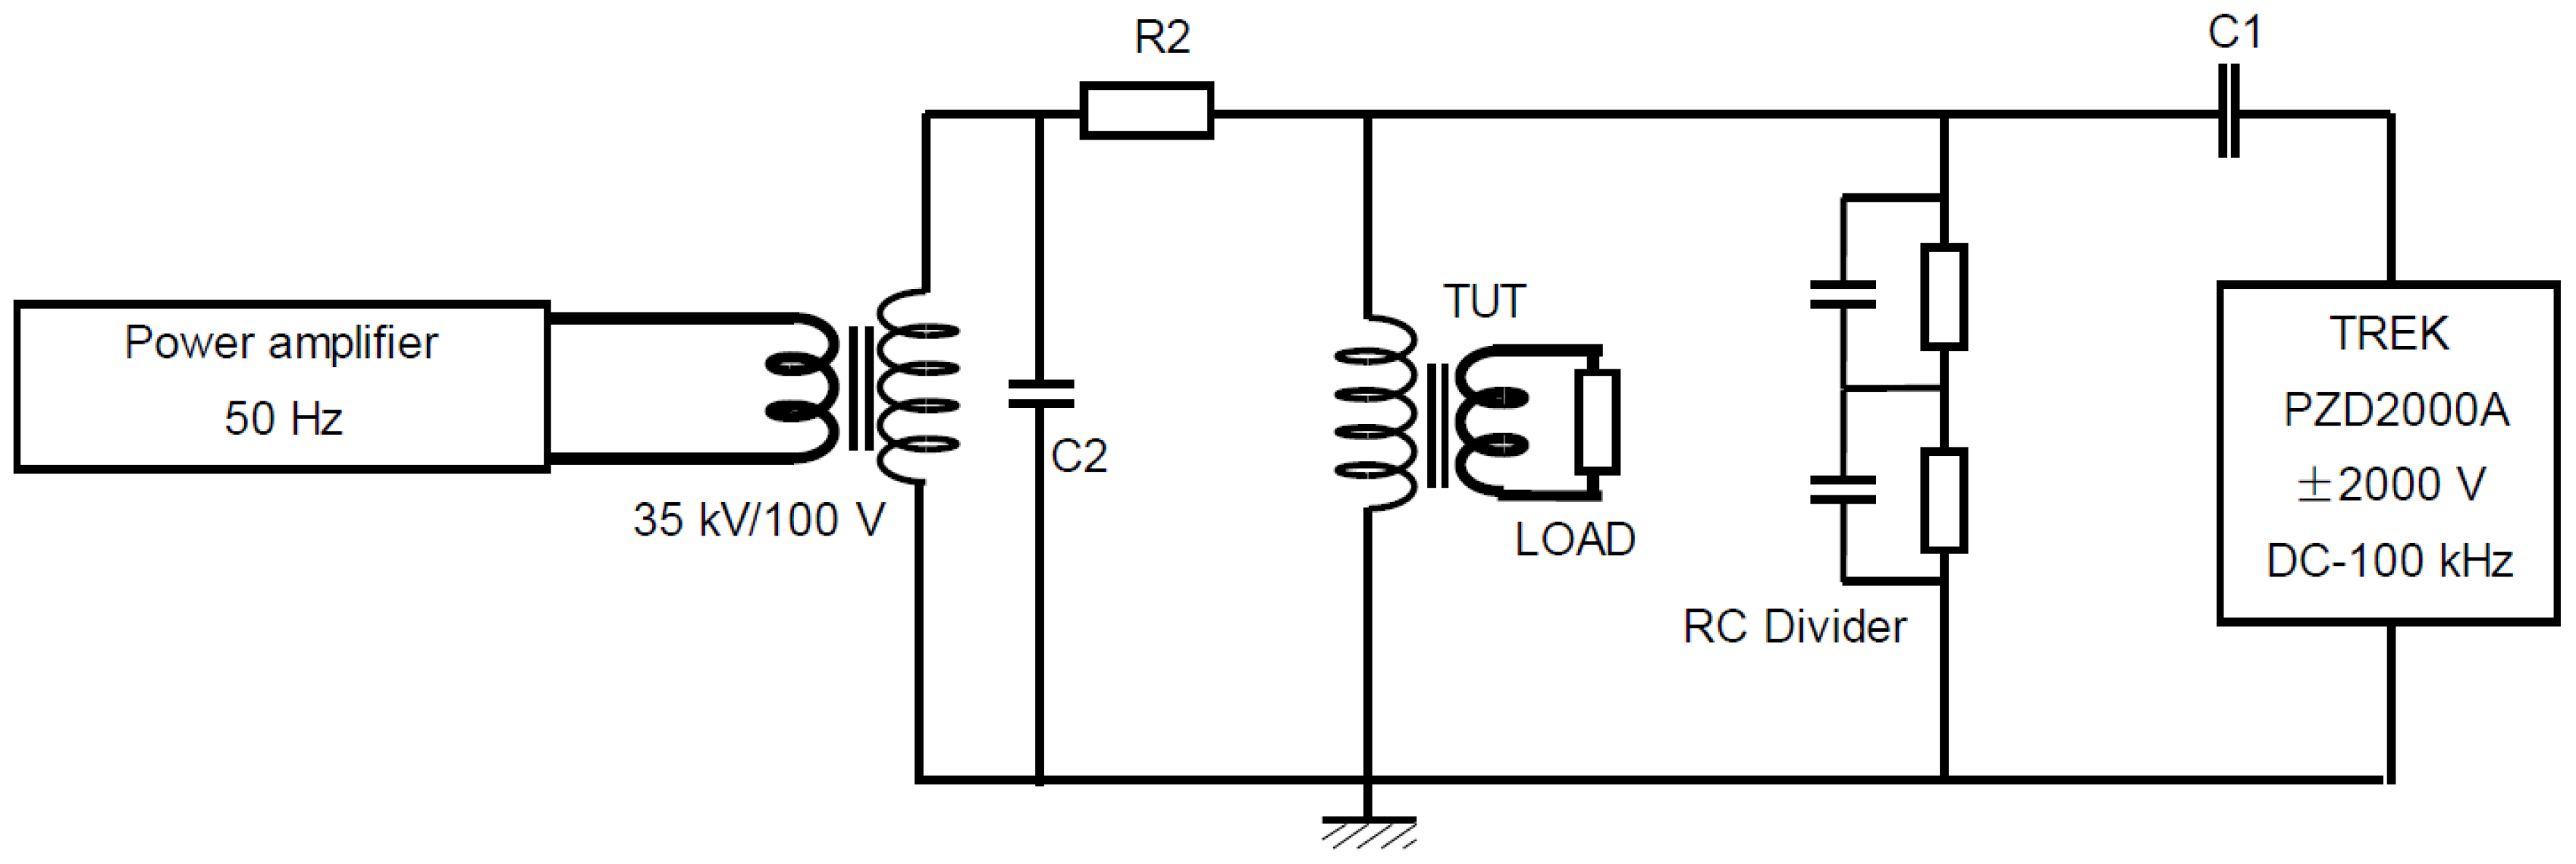
A second generator was set in order to increase the amplitude of the harmonics above the 84th order. This one, used to generate harmonics with frequencies between 4 kHz and 9 kHz, relies on a paralleled arrangement of two generators, according to
Figure 6. The 50 Hz high voltage (30 kV) is produced with the same devices as in the first set-up: the APX160-6 kVA amplifier and the step-up transformer. The harmonics from 4 kHz to 9 kHz are generated using a high-voltage amplifier, the TREK PZD2000A, able to deliver peak voltages up to ±2 kV for frequencies up to 100 kHz and peak currents up to ±200 mA. Two active filters are added in order to protect each generator from the other. A high-voltage capacitor C1, 3 nF/50 kV, is used on the amplifier side. It forms, with the output impedance R1 of the amplifier, an R1C1 high-pass filter with a cutoff frequency in the range of several tens of kHz. A resistor R2 with a value between 100 kΩ and 500 kΩ and a capacitor C2 of 10 nF/50 kV are used to protect the transformer from the high-frequency components. They form a low pass filter with a cut-off frequency in the range of tens of hertz.
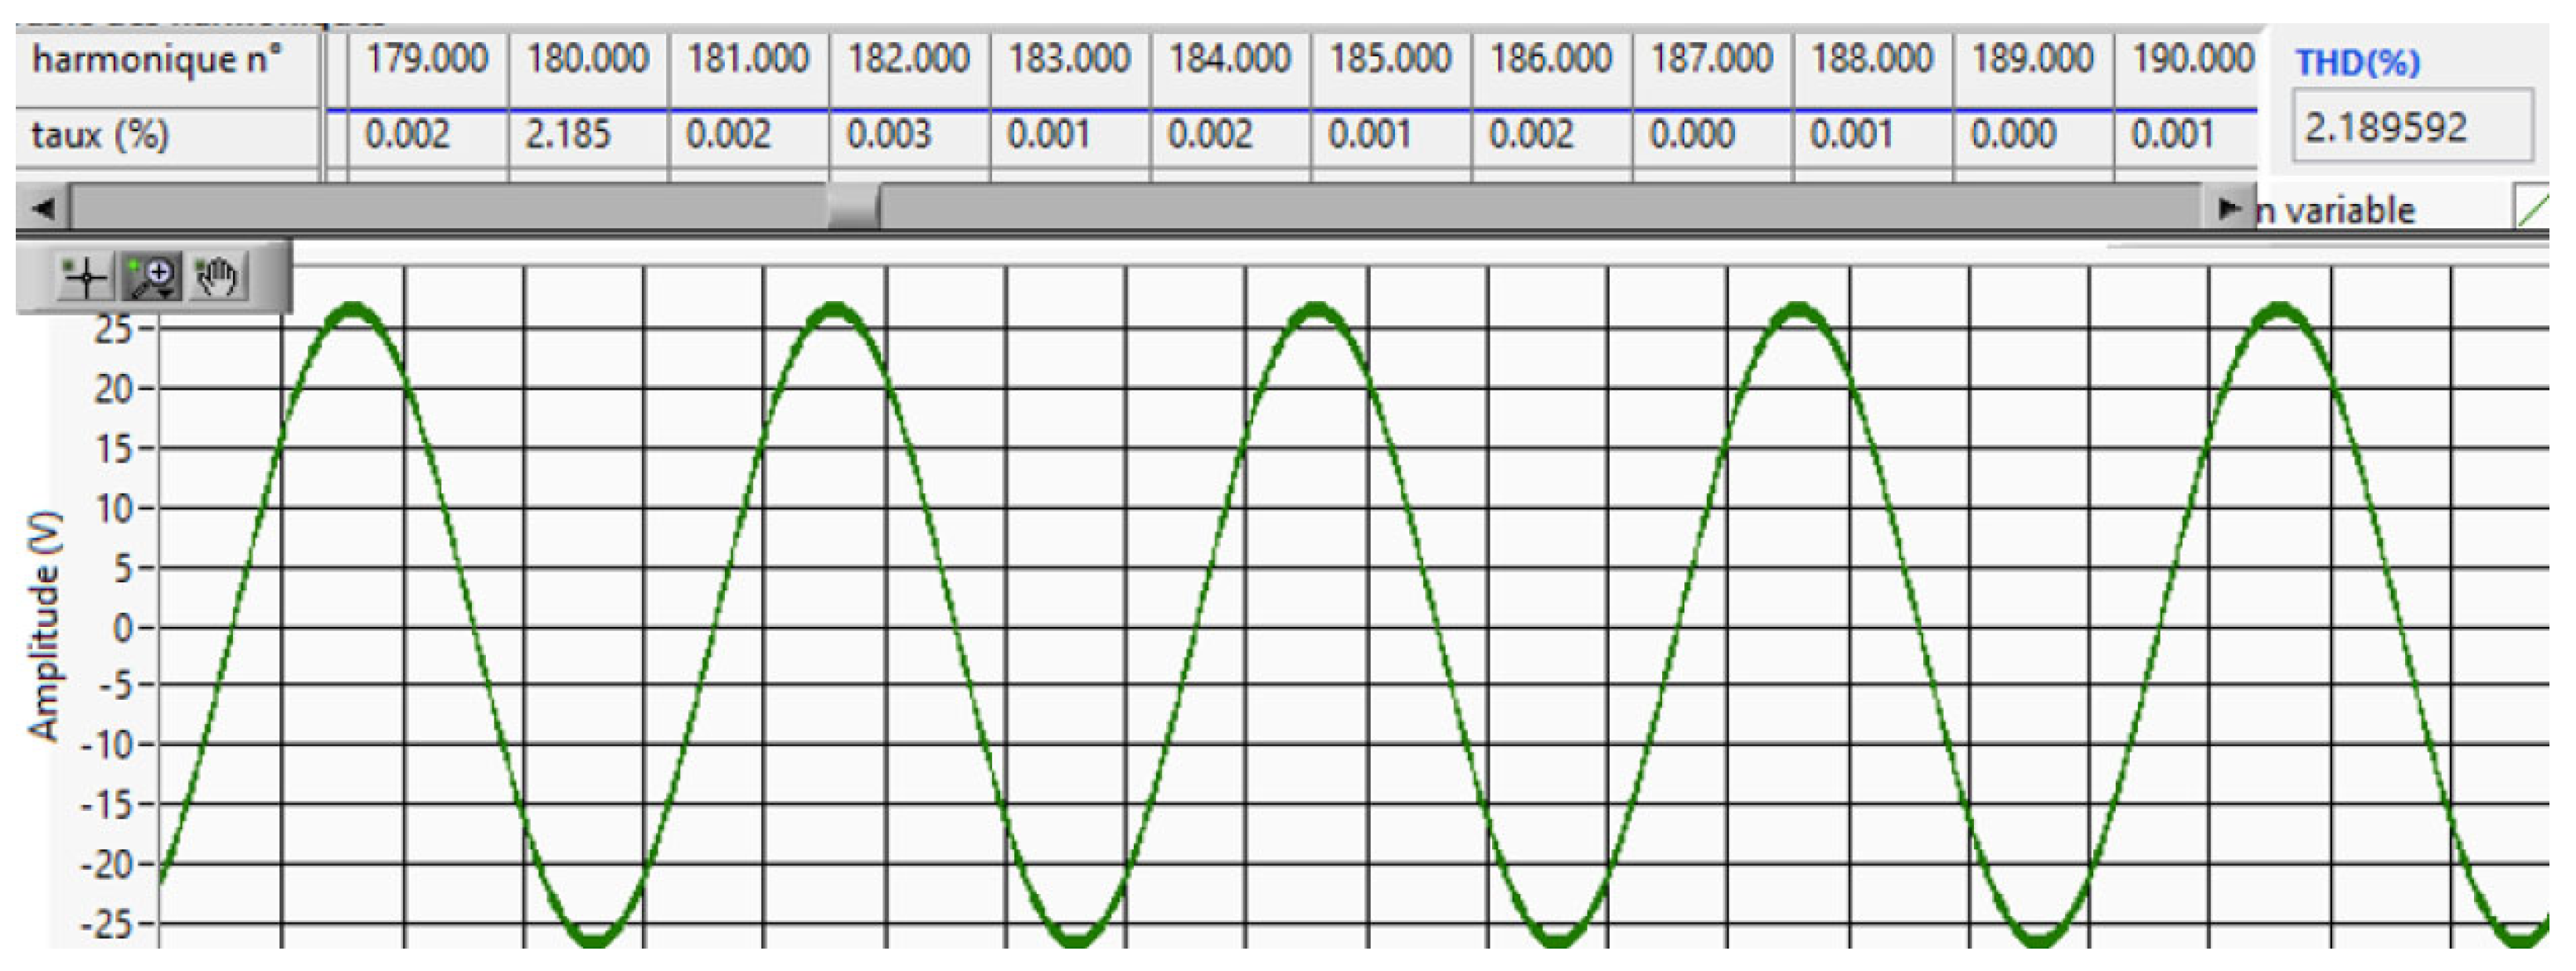
The possibilities of this second generator are presented in
Table 3. The maximum amplitudes of the harmonics between 4 kHz and 9 kHz depending on the fundamental amplitude. At 20 kV RMS and 11 kV RMS, harmonic amplitudes of 2% (400 V) and 9% (1000 V) were achieved, respectively. At 30 kV RMS, the harmonic amplitude is 1.5% and responds to the objective mentioned in
Table 1. This outstanding performance could be enhanced significantly. Indeed, the voltage quantities that might be generated with the second generator depend on the impedance of the transformer under test and the maximum current generated by both generators. Despite using a high-pass filter on the transformer side, there remains a residual high-frequency voltage on the primary side of the transformer, creating resonance phenomena and current consumption. One possible solution is to increase the value of the resistor R2 and use a step-up transformer with higher voltage levels to compensate for the voltage drop at 50 Hz in R2.
An example of a generated waveform is presented in
Figure 7. It represents the signals measured at the output of the voltage divider via a Labview v.2020 software algorithm and FFT signal processing for the calculation of the quantities to be measured.
3.4. Definition of the Test Conditions
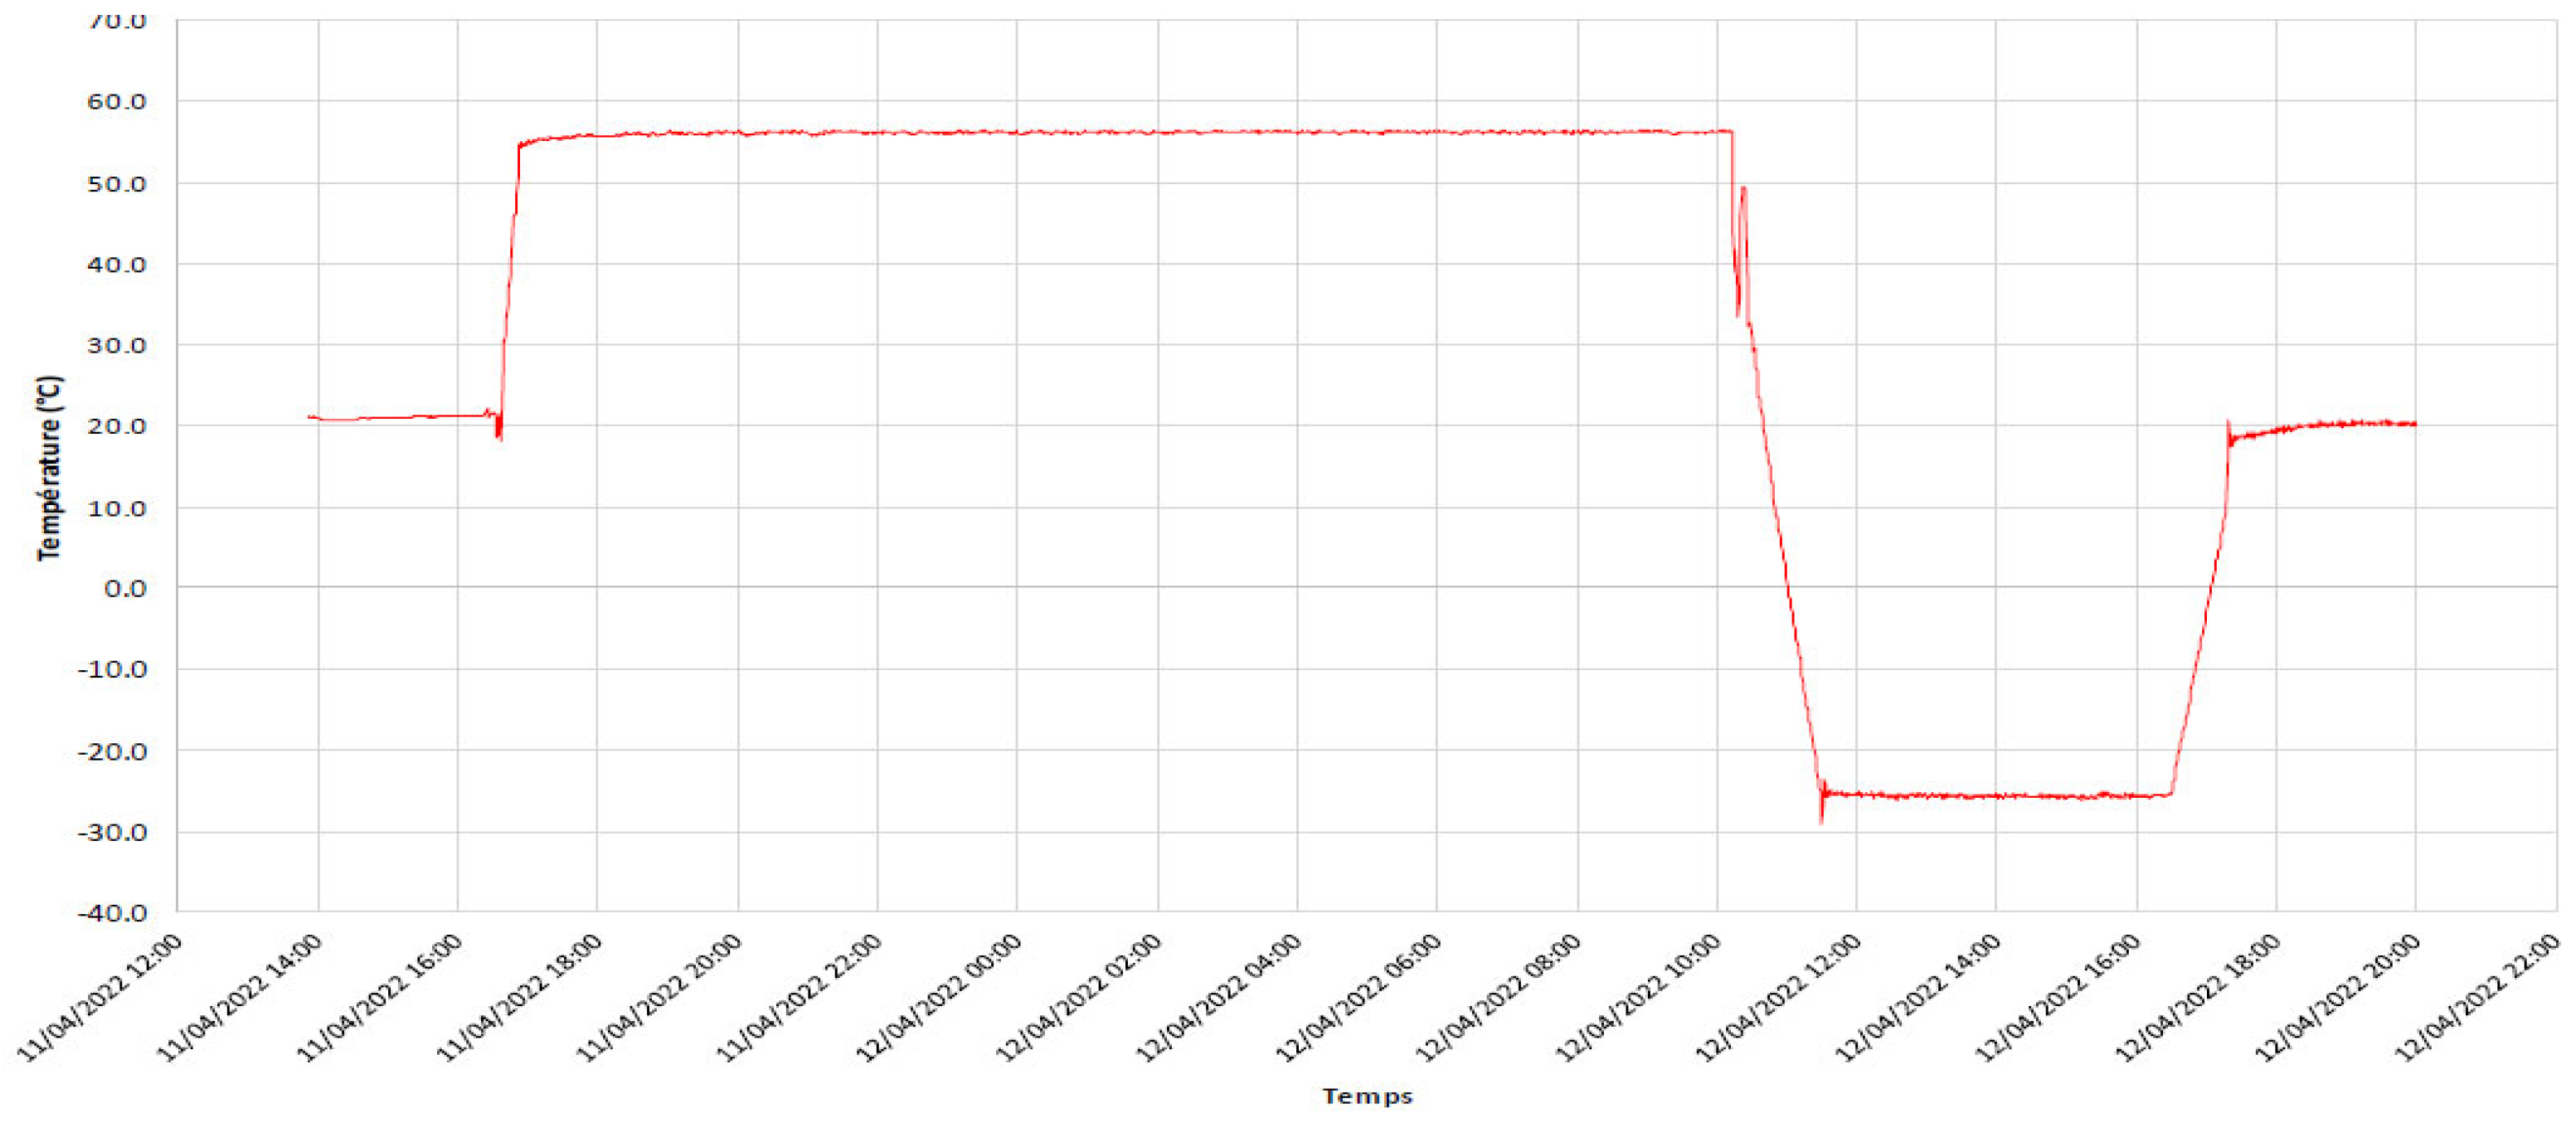
The requirements for ITs are specified in the IEC 61869 series for temperature intervals varying from −5 °C to +40 °C. This interval is wider, from −25 °C to +55 °C, in IEC 60721-3-3 [
14] for places without temperature control. Since the possibilities of the LNE test platform allow reaching these extreme temperatures, the chosen test interval was the largest. The voltage transformer under test was placed inside the climatic chamber, where the target temperature was maintained within ± 0.5 °C. The applied temperature profile is illustrated in
Figure 8 and follows the temperature cycle accuracy test according to [
15].
More challenges appear when designing the tests on ITs in the presence of external vibrations since no procedure or particular specifications exist. Several sources [
16,
17,
18,
19,
20,
21,
22] were analyzed in order to identify the most appropriate environmental factors. The main parameters that were varied and studied in this work are the frequency, acceleration and orientation of an external vibration to which a transformer is exposed.
The IEC 61869 series indicates seismic vibrations [
5], which are usually neglected due to the low vibration frequency of 0.1 Hz. The frequencies of road traffic vibrations are situated between 2 Hz and 6 Hz [
16], with a maximum of 30 Hz. The wind turbines generate similar few Hz vibrations [
17], depending on the speed of the wind. Higher-frequency vibrations exist in railway applications [
18], with vibration frequencies up to 150 Hz. During switching high-voltage circuit breakers, vibration frequencies up to 150 Hz could be generated. Other information on vibration parameters as test factors exists in different standards, defining the environmental test conditions [
19,
20,
21,
22] for civilian applications and dealing with vibration frequencies up to 150 Hz.
In this work, the frequency of vibration was then varied from 3 Hz to 150 Hz to cover a large range, applied following the three orientations with respect to the Its, and with a maximum acceleration of 4.90 m/s2. Mechanical vibrations of the transformers are among the factors likely to occur on-site. The main parameters that characterize vibrations are:
The frequency (in Hz) corresponds to the number of oscillations per second;
The orientation is vertical (Z) or horizontal (longitudinal X or transversal Y);
The amplitude of the movement felt by the exposed object is evaluated by the acceleration (in m/s2).
The study of existing standards and published work [
16,
17,
18,
19,
20,
21,
22] correlated with the purpose of this study and led to the generation of sinusoidal vibrations with frequencies of 3 Hz, 20 Hz, 100 Hz and 150 Hz. Thus, wide sources are covered, from road traffic vibrations up to railway or circuit breakers, among the typically generated ones. The vibrations were applied in the following three orientations: vertical, longitudinal and transversal. The tests described in this paper are performed with accelerations of vibrations varying between 0.98 m/s
2 and 4.90 m/s
2. The acceleration values are provided as a factor of the gravitational acceleration, g = 9.81 m/s
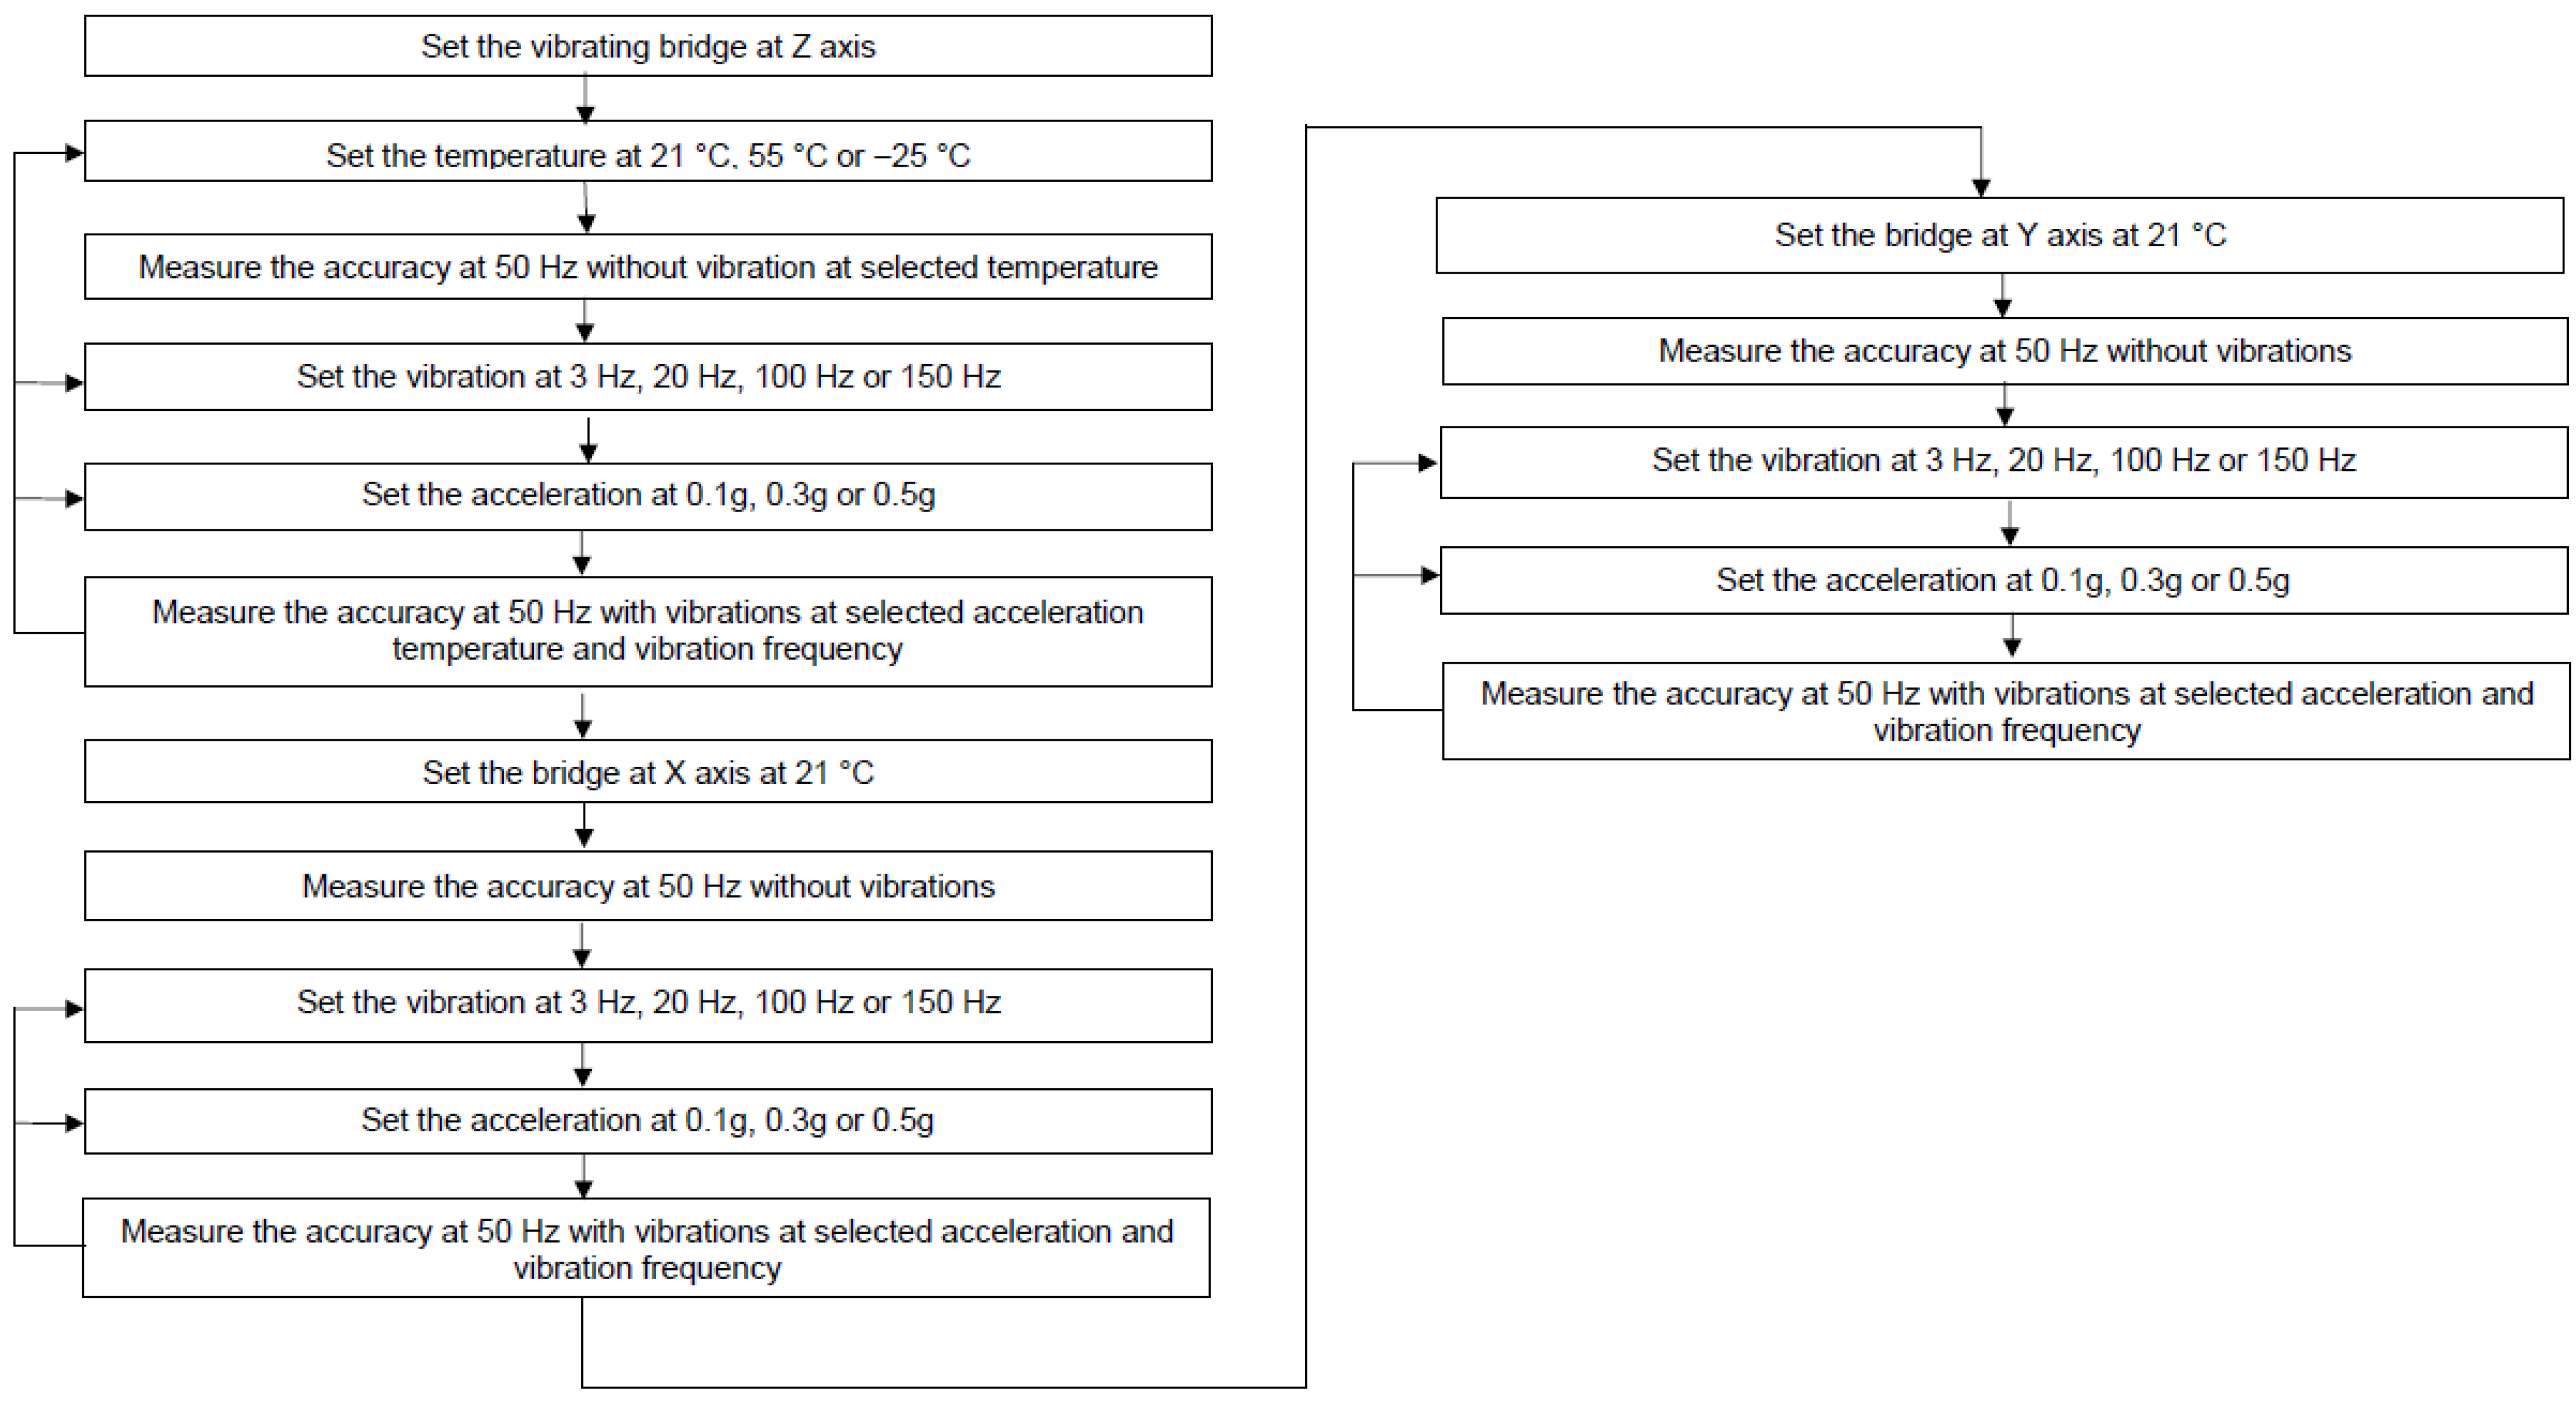
2. The values were 0.1 g, 0.3 g and 0.5 g, respectively. A Flowchart describing the methodology used to test the accuracy of the TUT at 50 Hz under temperature and vibration is presented in
Figure 9.
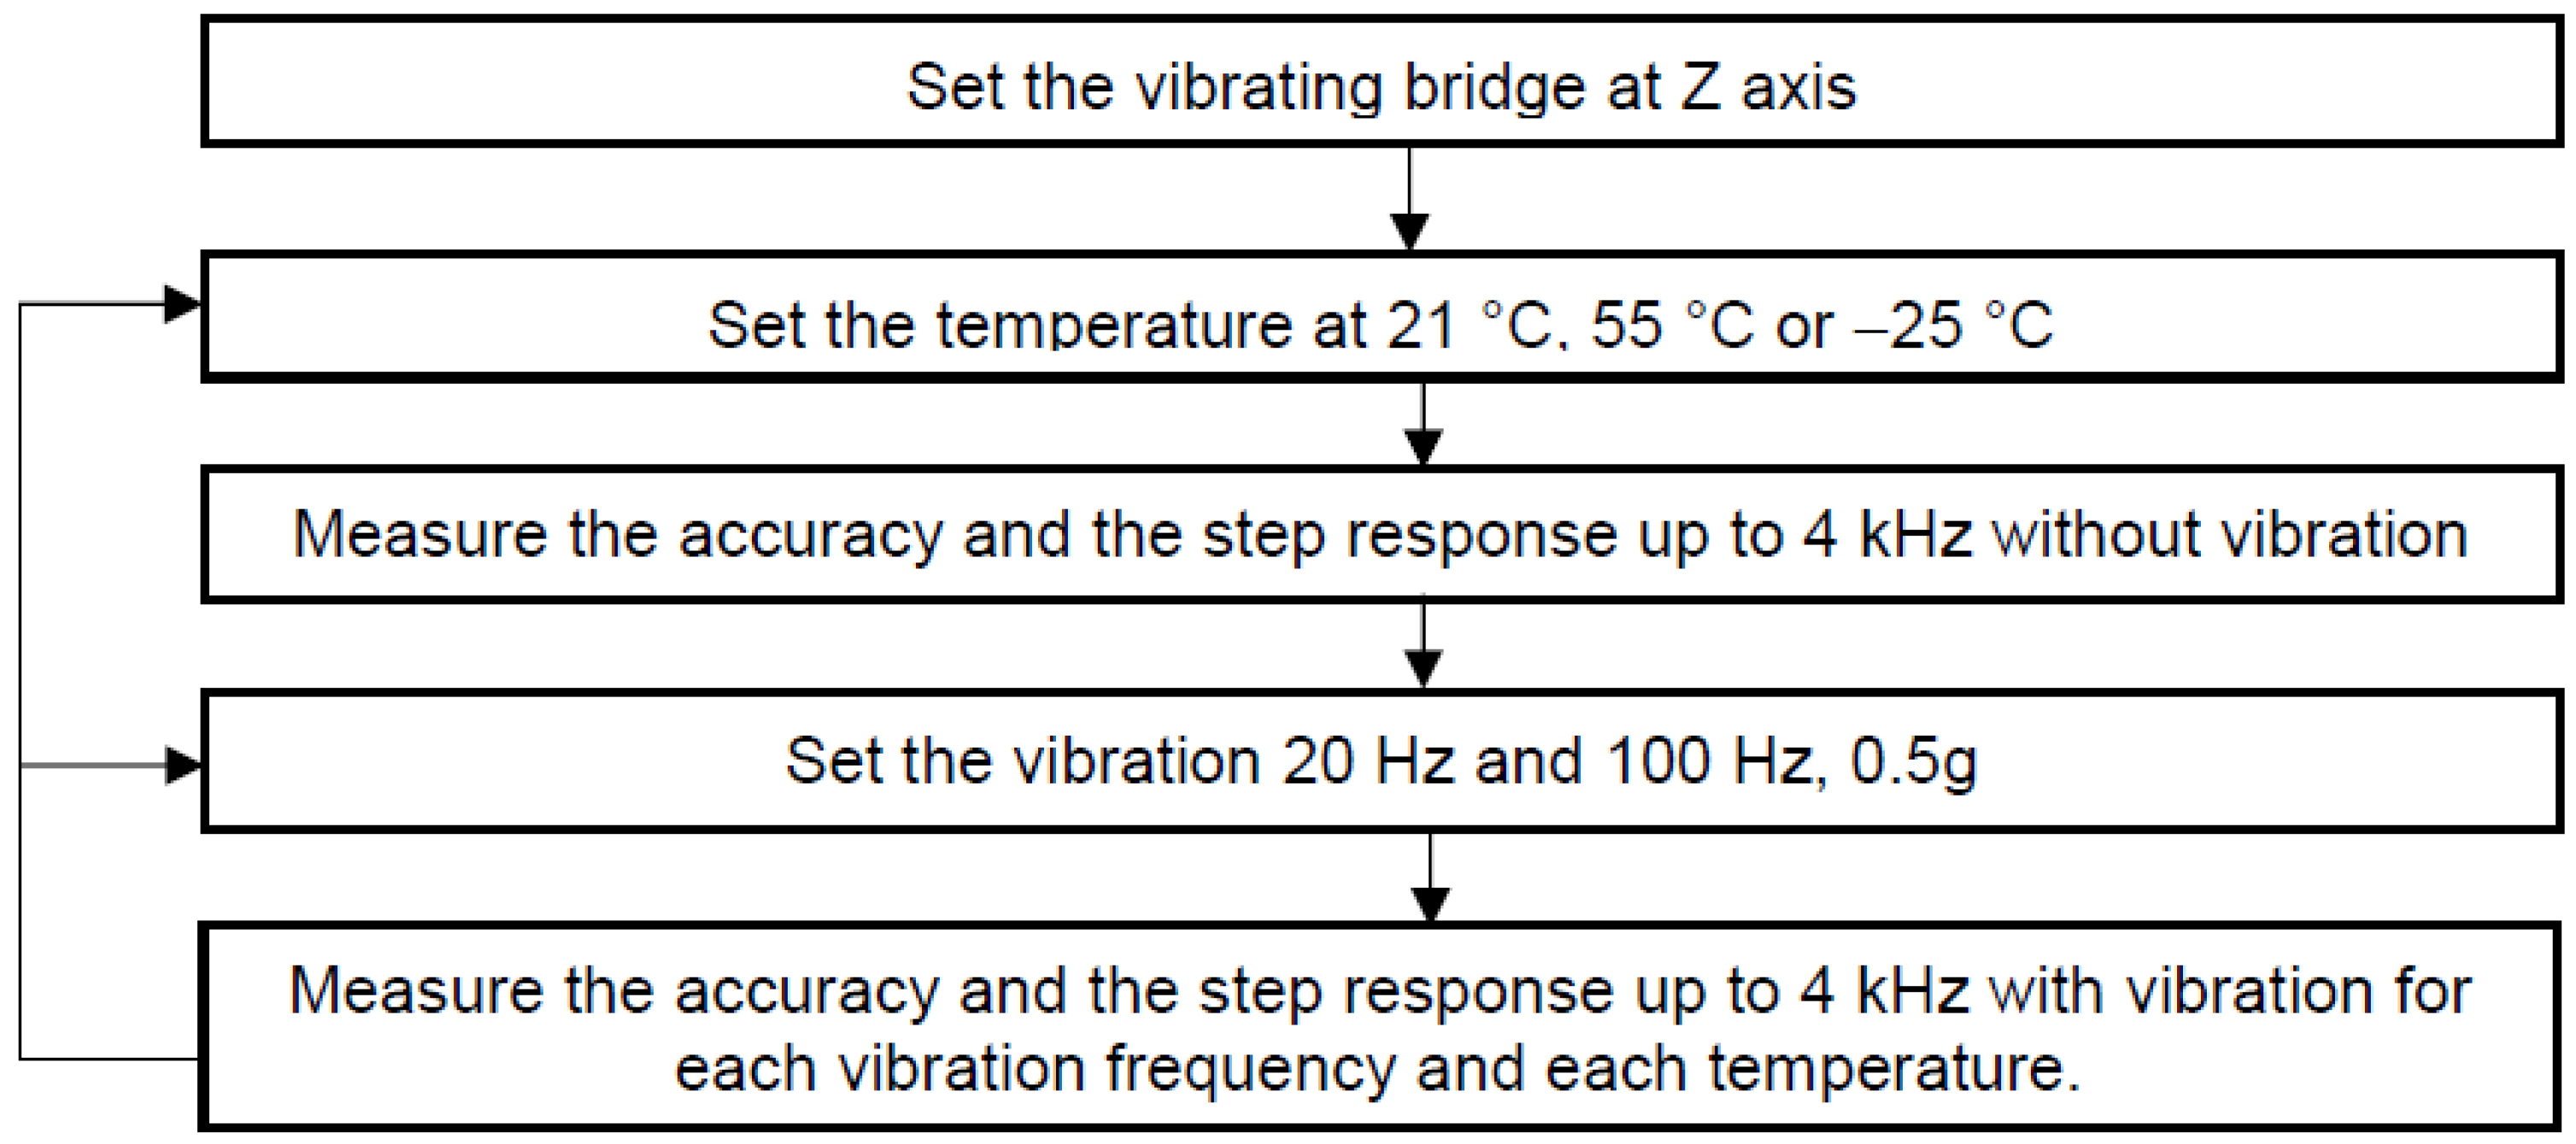
To study the influence of harmonics combined with temperature and vibration factors, a low-level, high-frequency sinusoidal voltage was superimposed on the 50 Hz high voltage. The amplitude of voltages with frequencies from 150 Hz to 2000 Hz was 5% of the nominal voltage of the tested transformer, while higher frequencies up to 3000 Hz were generated with 3% of the nominal voltage. A flowchart of the methodology used to determine the frequency response of the TUT under temperature and vibration is presented in
Figure 10.
4. Instrument Transformer Tests
The transformer under test (TUT) is a 1% class and is designed to work in a temperature range of −25 °C to +55 °C. The tests were performed with a resistive burden of 1 VA. The measurement setup was calibrated before every series of tests, and the corresponding corrections were applied. The influence of each factor is analyzed first, followed by the results obtained when combined temperature, vibration and harmonics were generated.
4.1. Influence of Temperature on Accuracy at 50 Hz
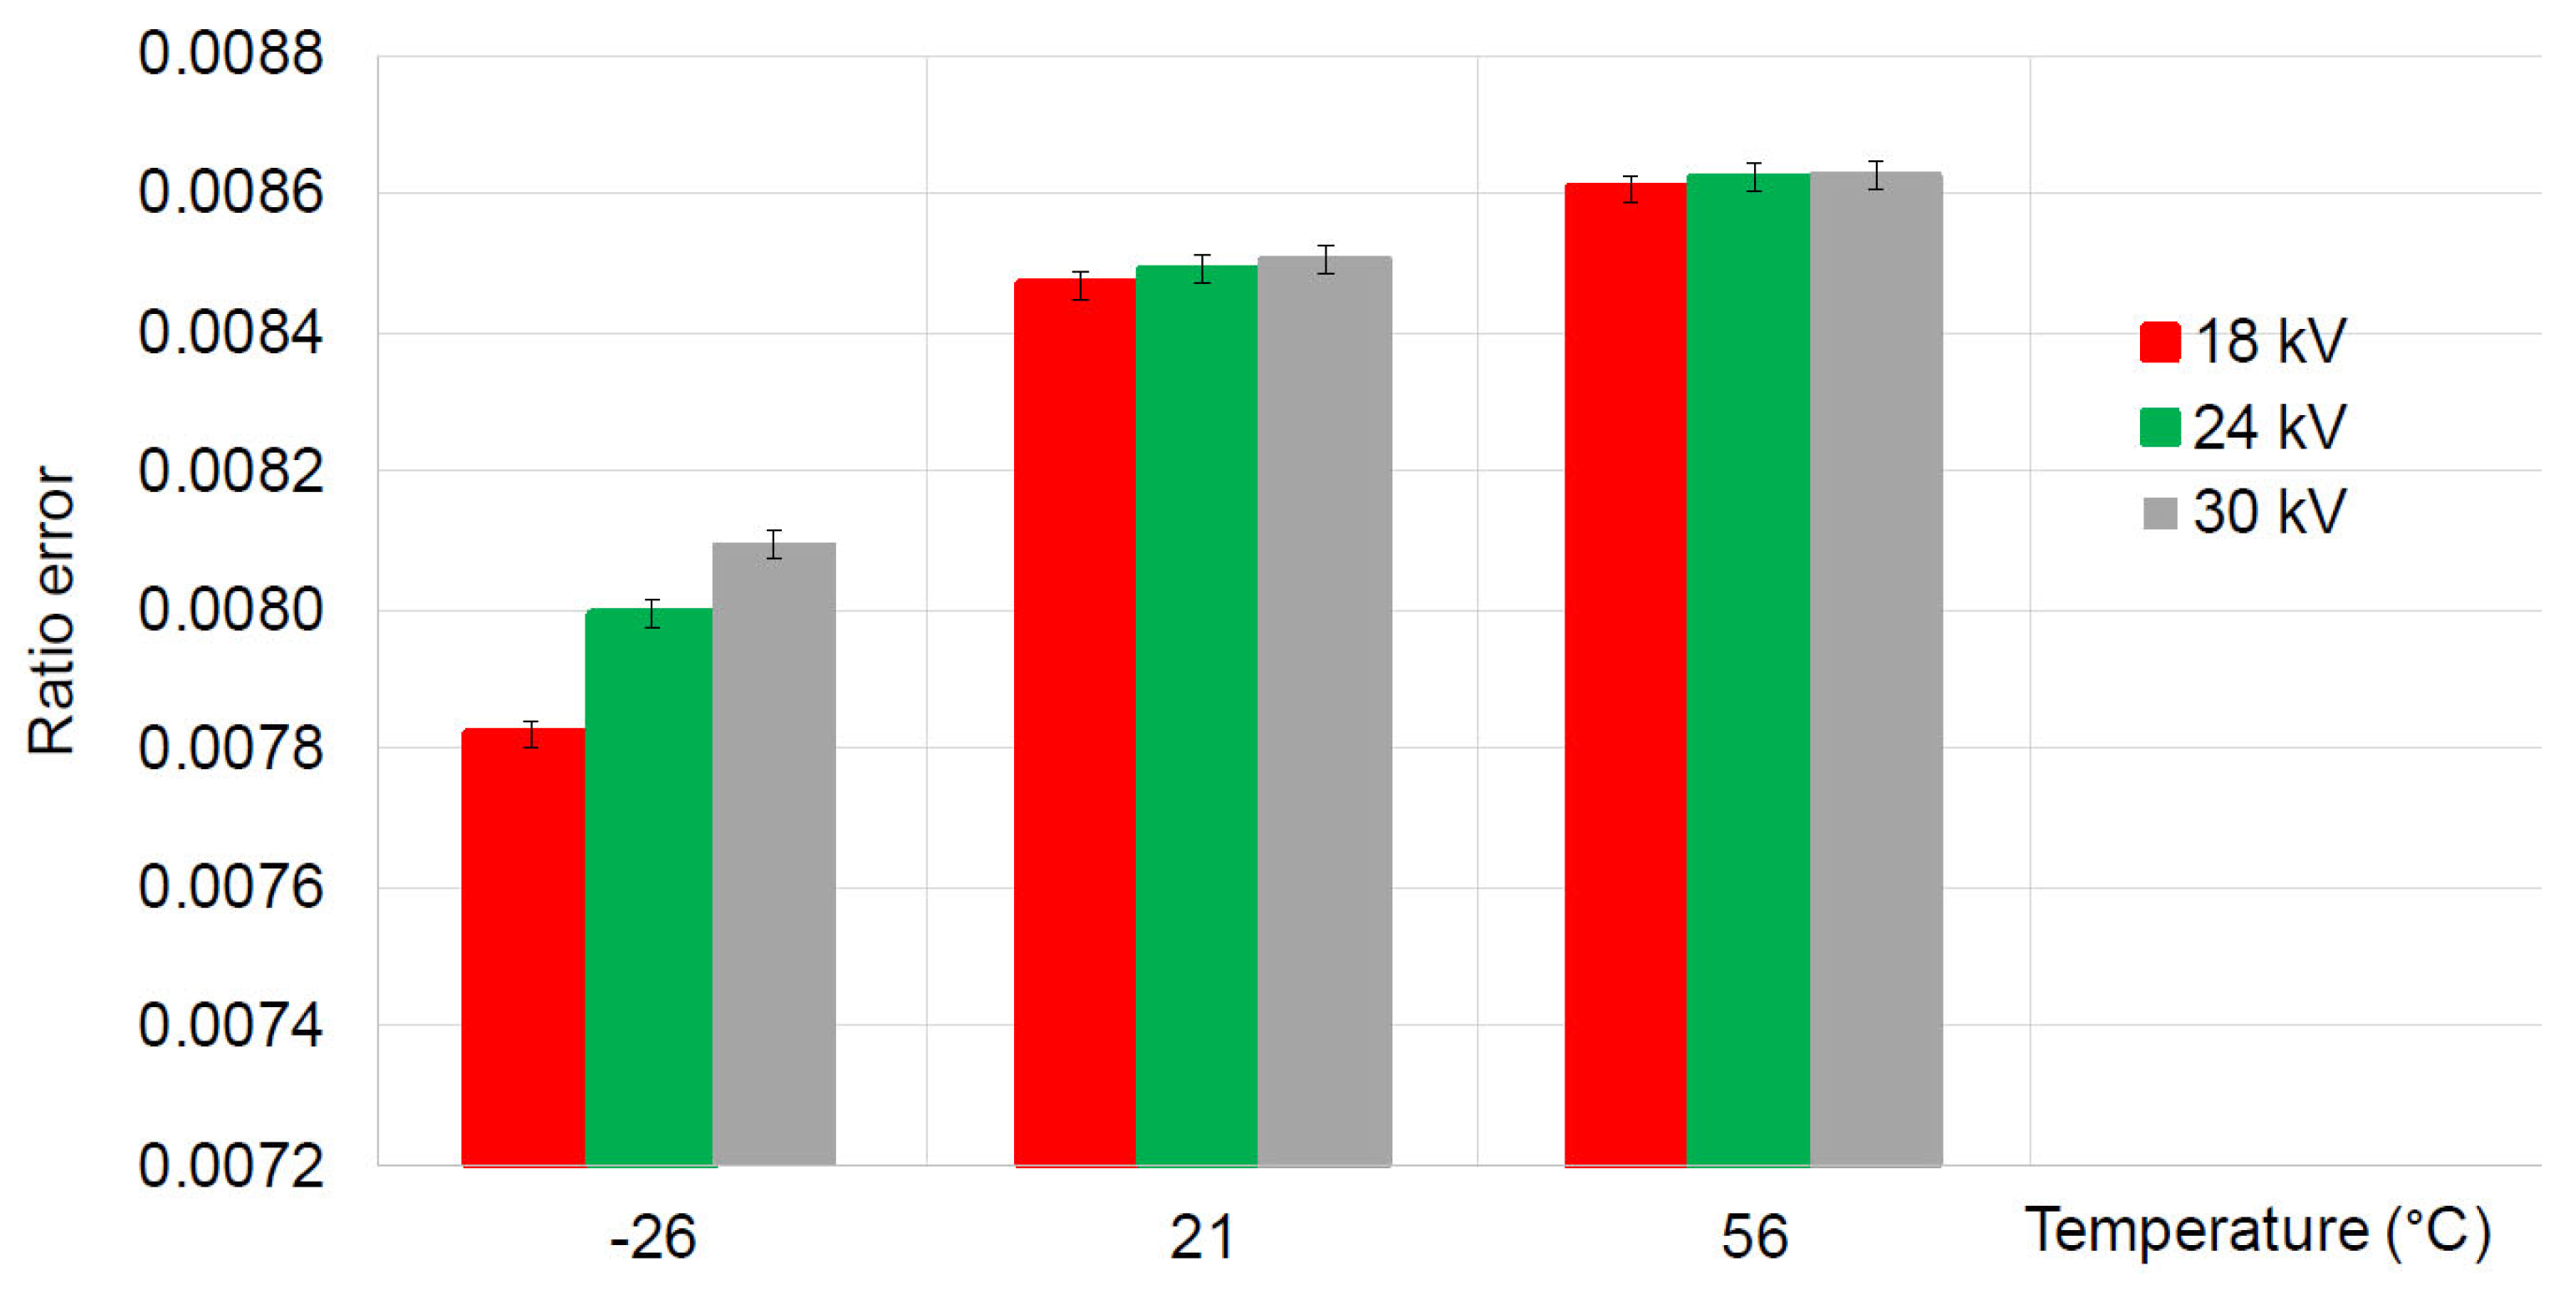
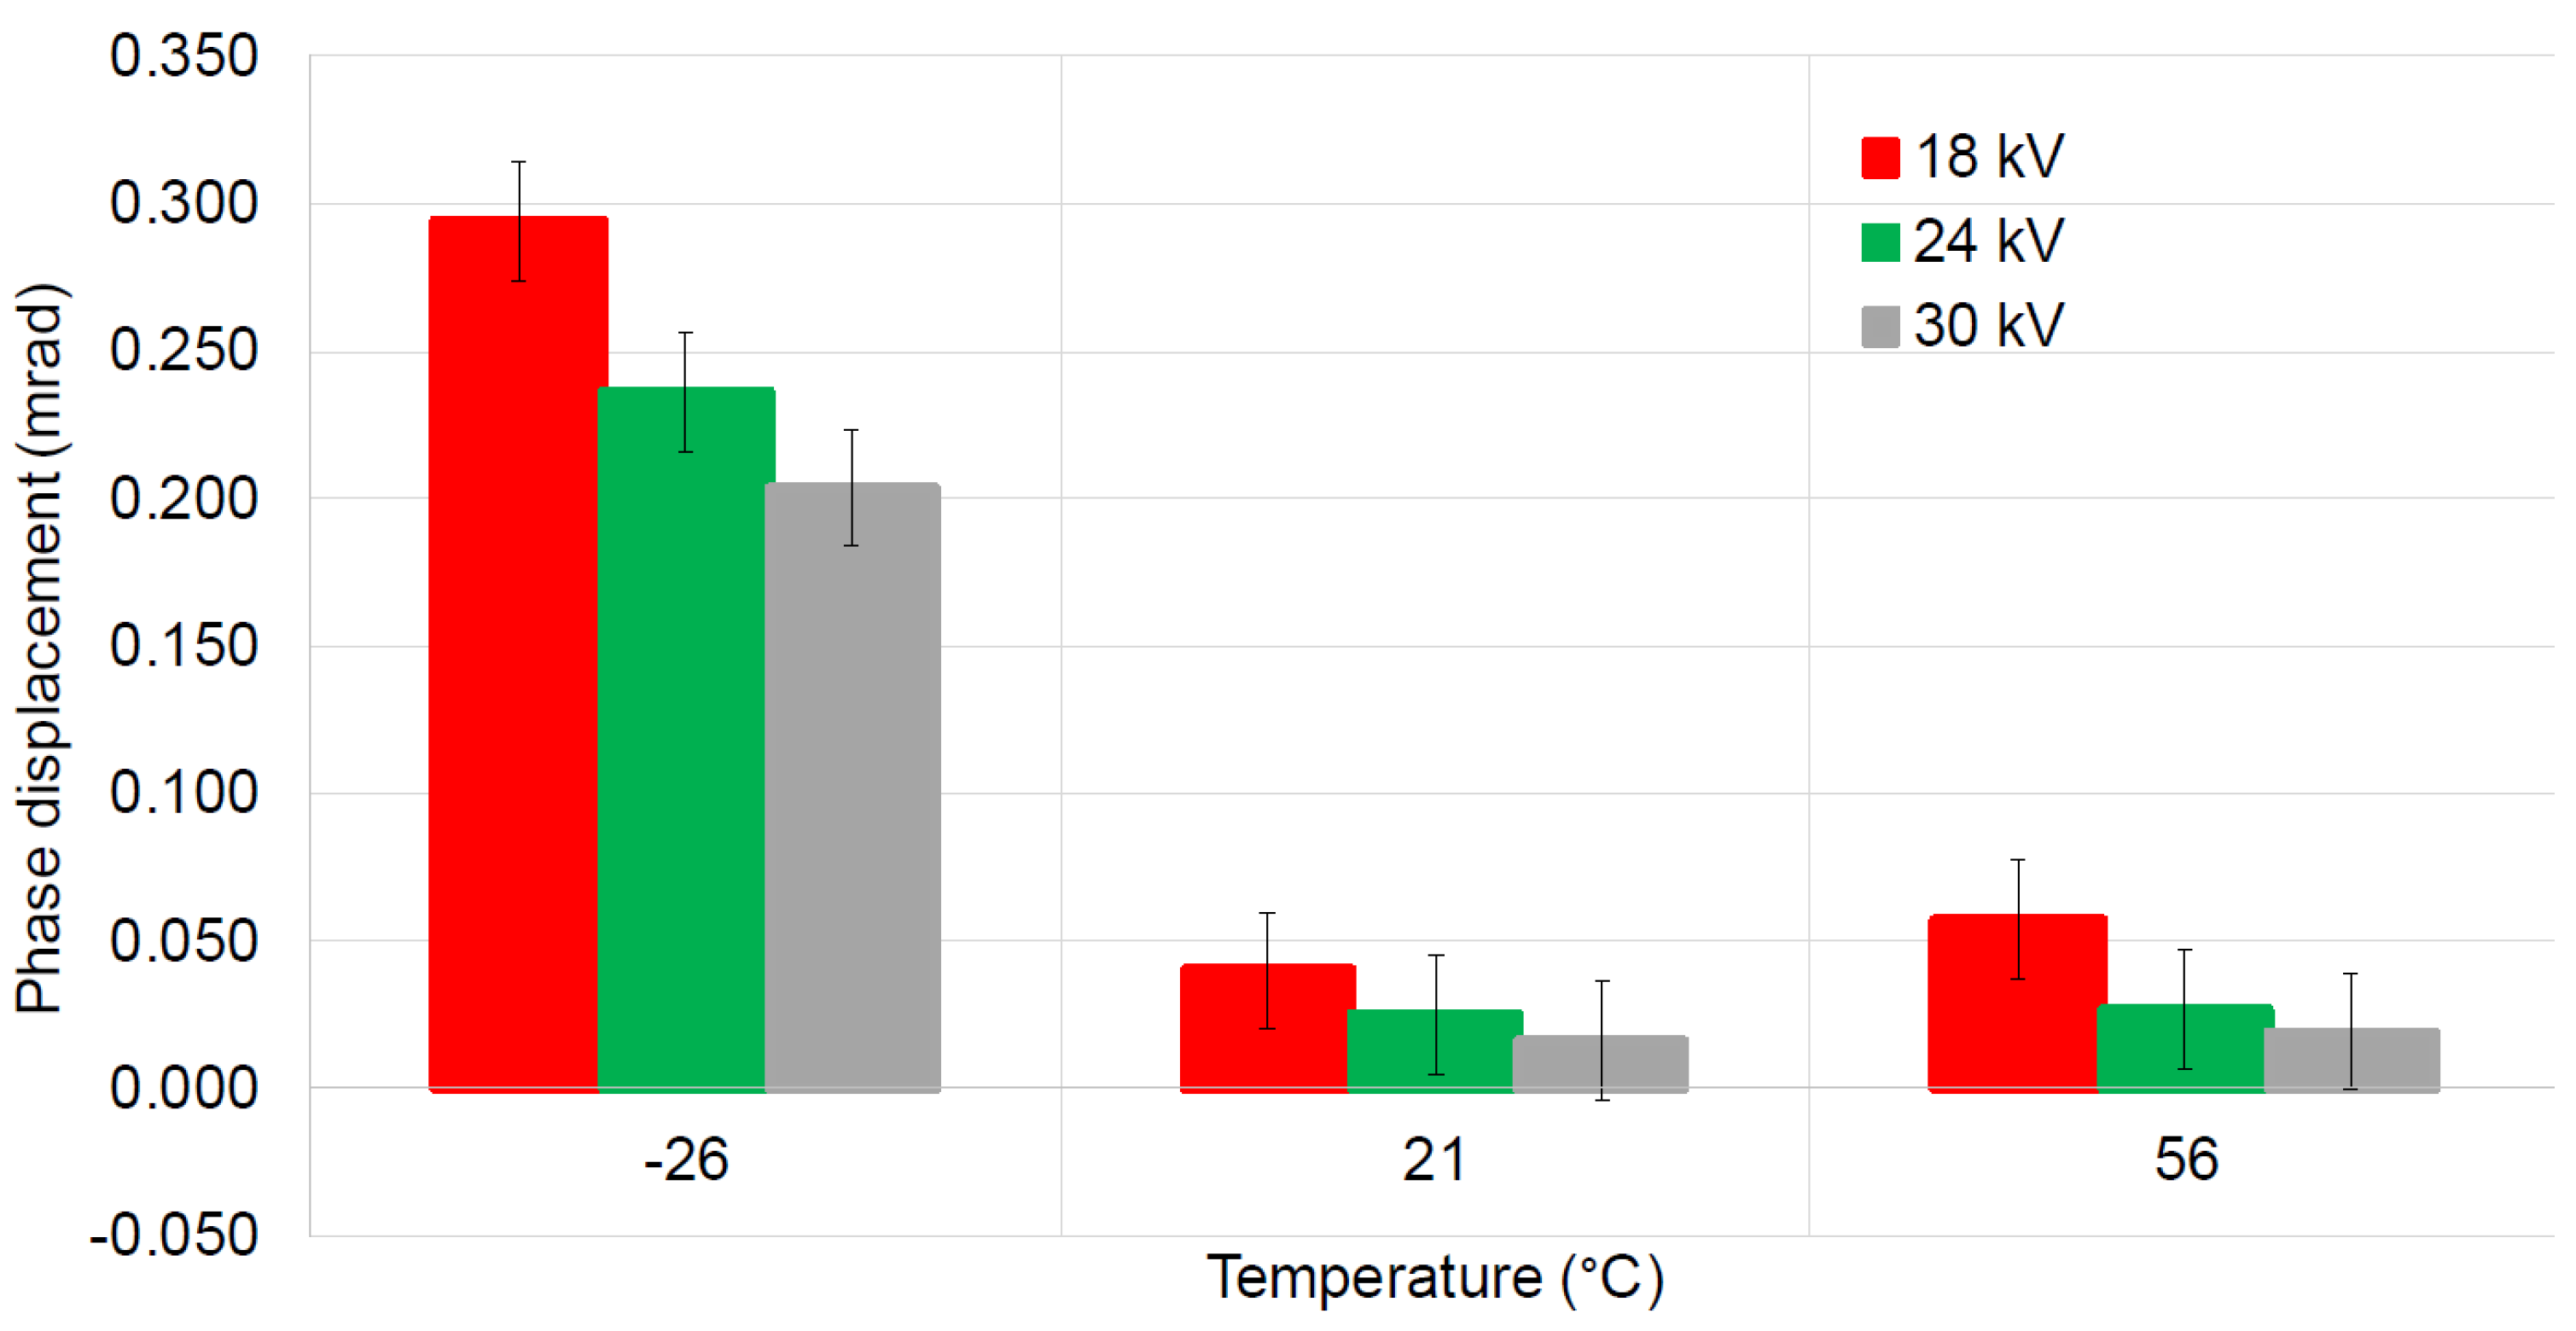
The TUT was calibrated at 18 kV, 24 kV and 30 kV for each temperature level. The values of ratio error and phase displacement obtained at 21 °C are considered references, and the variations of the measured quantities from the reference values are listed in
Table 4 for the tested temperature. The obtained results,
Figure 11 and
Figure 12, outline that the highest influence of the temperature on the TUT performance appears at 18 kV and −25 °C. Variations of 650 ppm in ratio error and 254 µrad in phase displacement, with respect to the reference values, are obtained.
It was also observed that the voltage deviation from 18 kV to 30 kV is more visible at low temperatures. For the ratio error, we observed a voltage deviation of about 275 ppm at −25 °C and less than 30 ppm at 21 °C and 55 °C. For the phase displacement, the voltage deviation is about 90 µrad at −25 °C and less than 40 µrad at 21 °C and 55 °C. These results are in agreement with similar work performed in the JRP IT4PQ [
23].
The magnetic properties of the materials used to realize the voltage transformers change with thermal and mechanical treatment and with frequency, too. The temperature affects the magnetic properties of materials by varying their electromagnetic parameters like saturation magnetization and magnetocrystalline anisotropy [
24]. Thermal compensation techniques that rely on the use of adapted alloys are applied by transformer manufacturers. However, −25 °C remains an extremely low temperature. The deviations obtained reflect both types of changes: internal to the TUT and external, related to the connections and the cable. It is to be noted that the 10
−4 order deviations increase the errors but are not outside the precision class of the studied transformer.
4.2. Influence of Vibration on Accuracy at 50 Hz
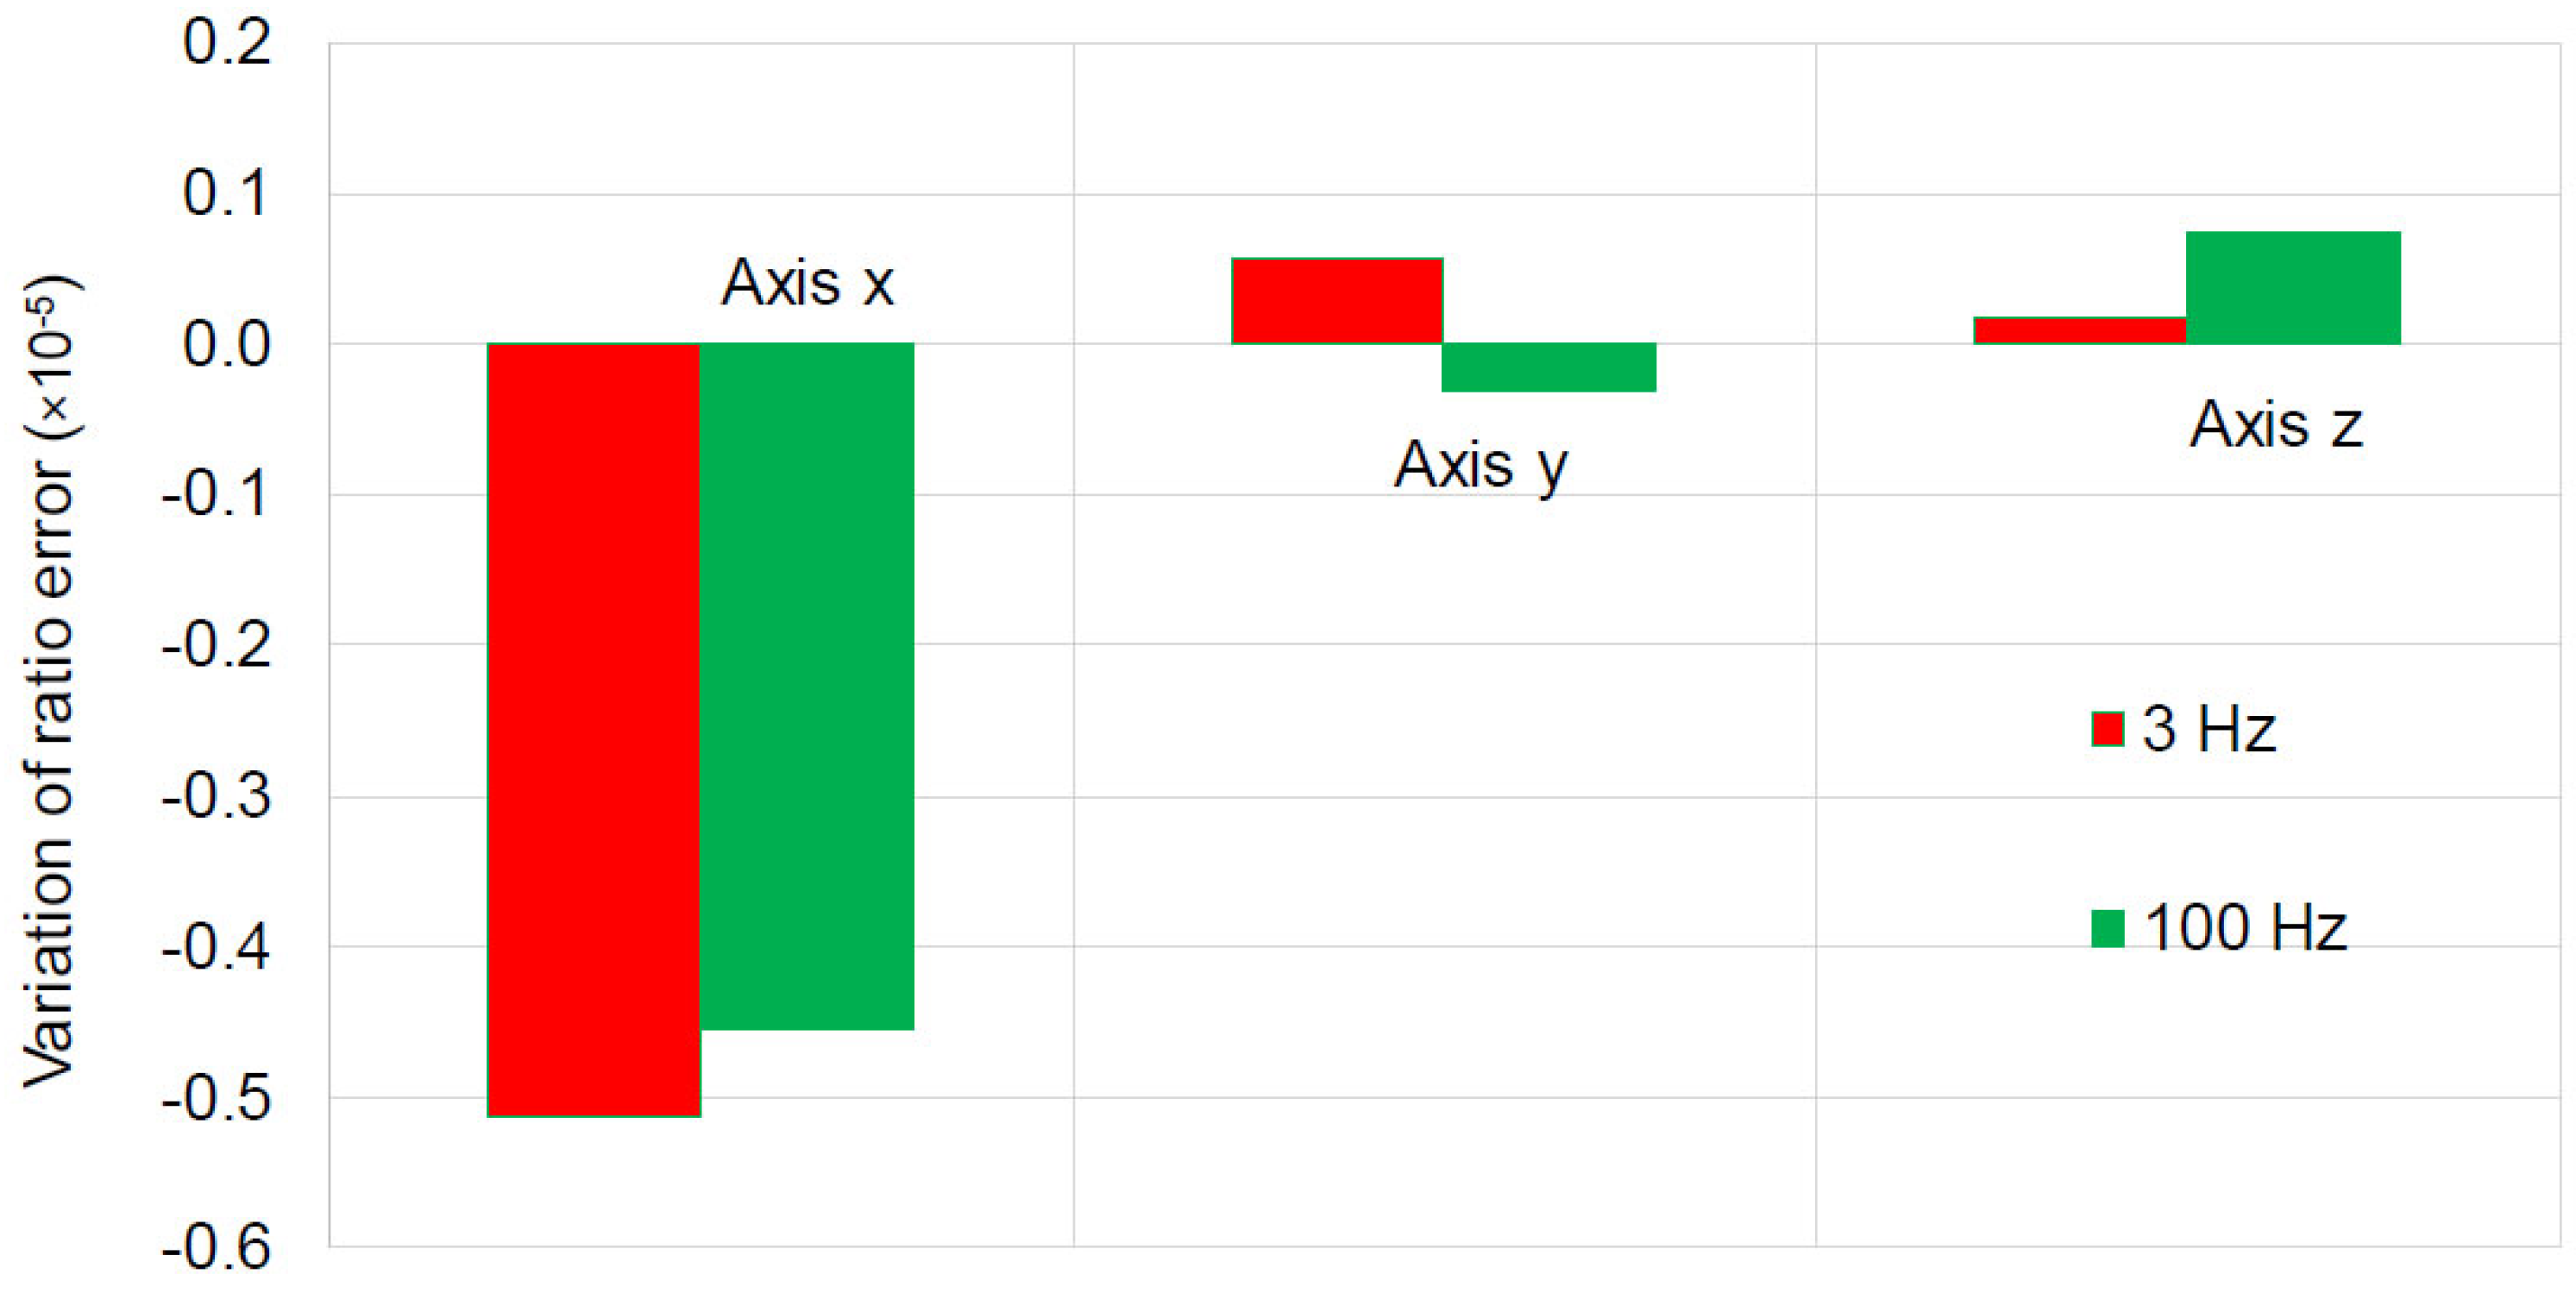
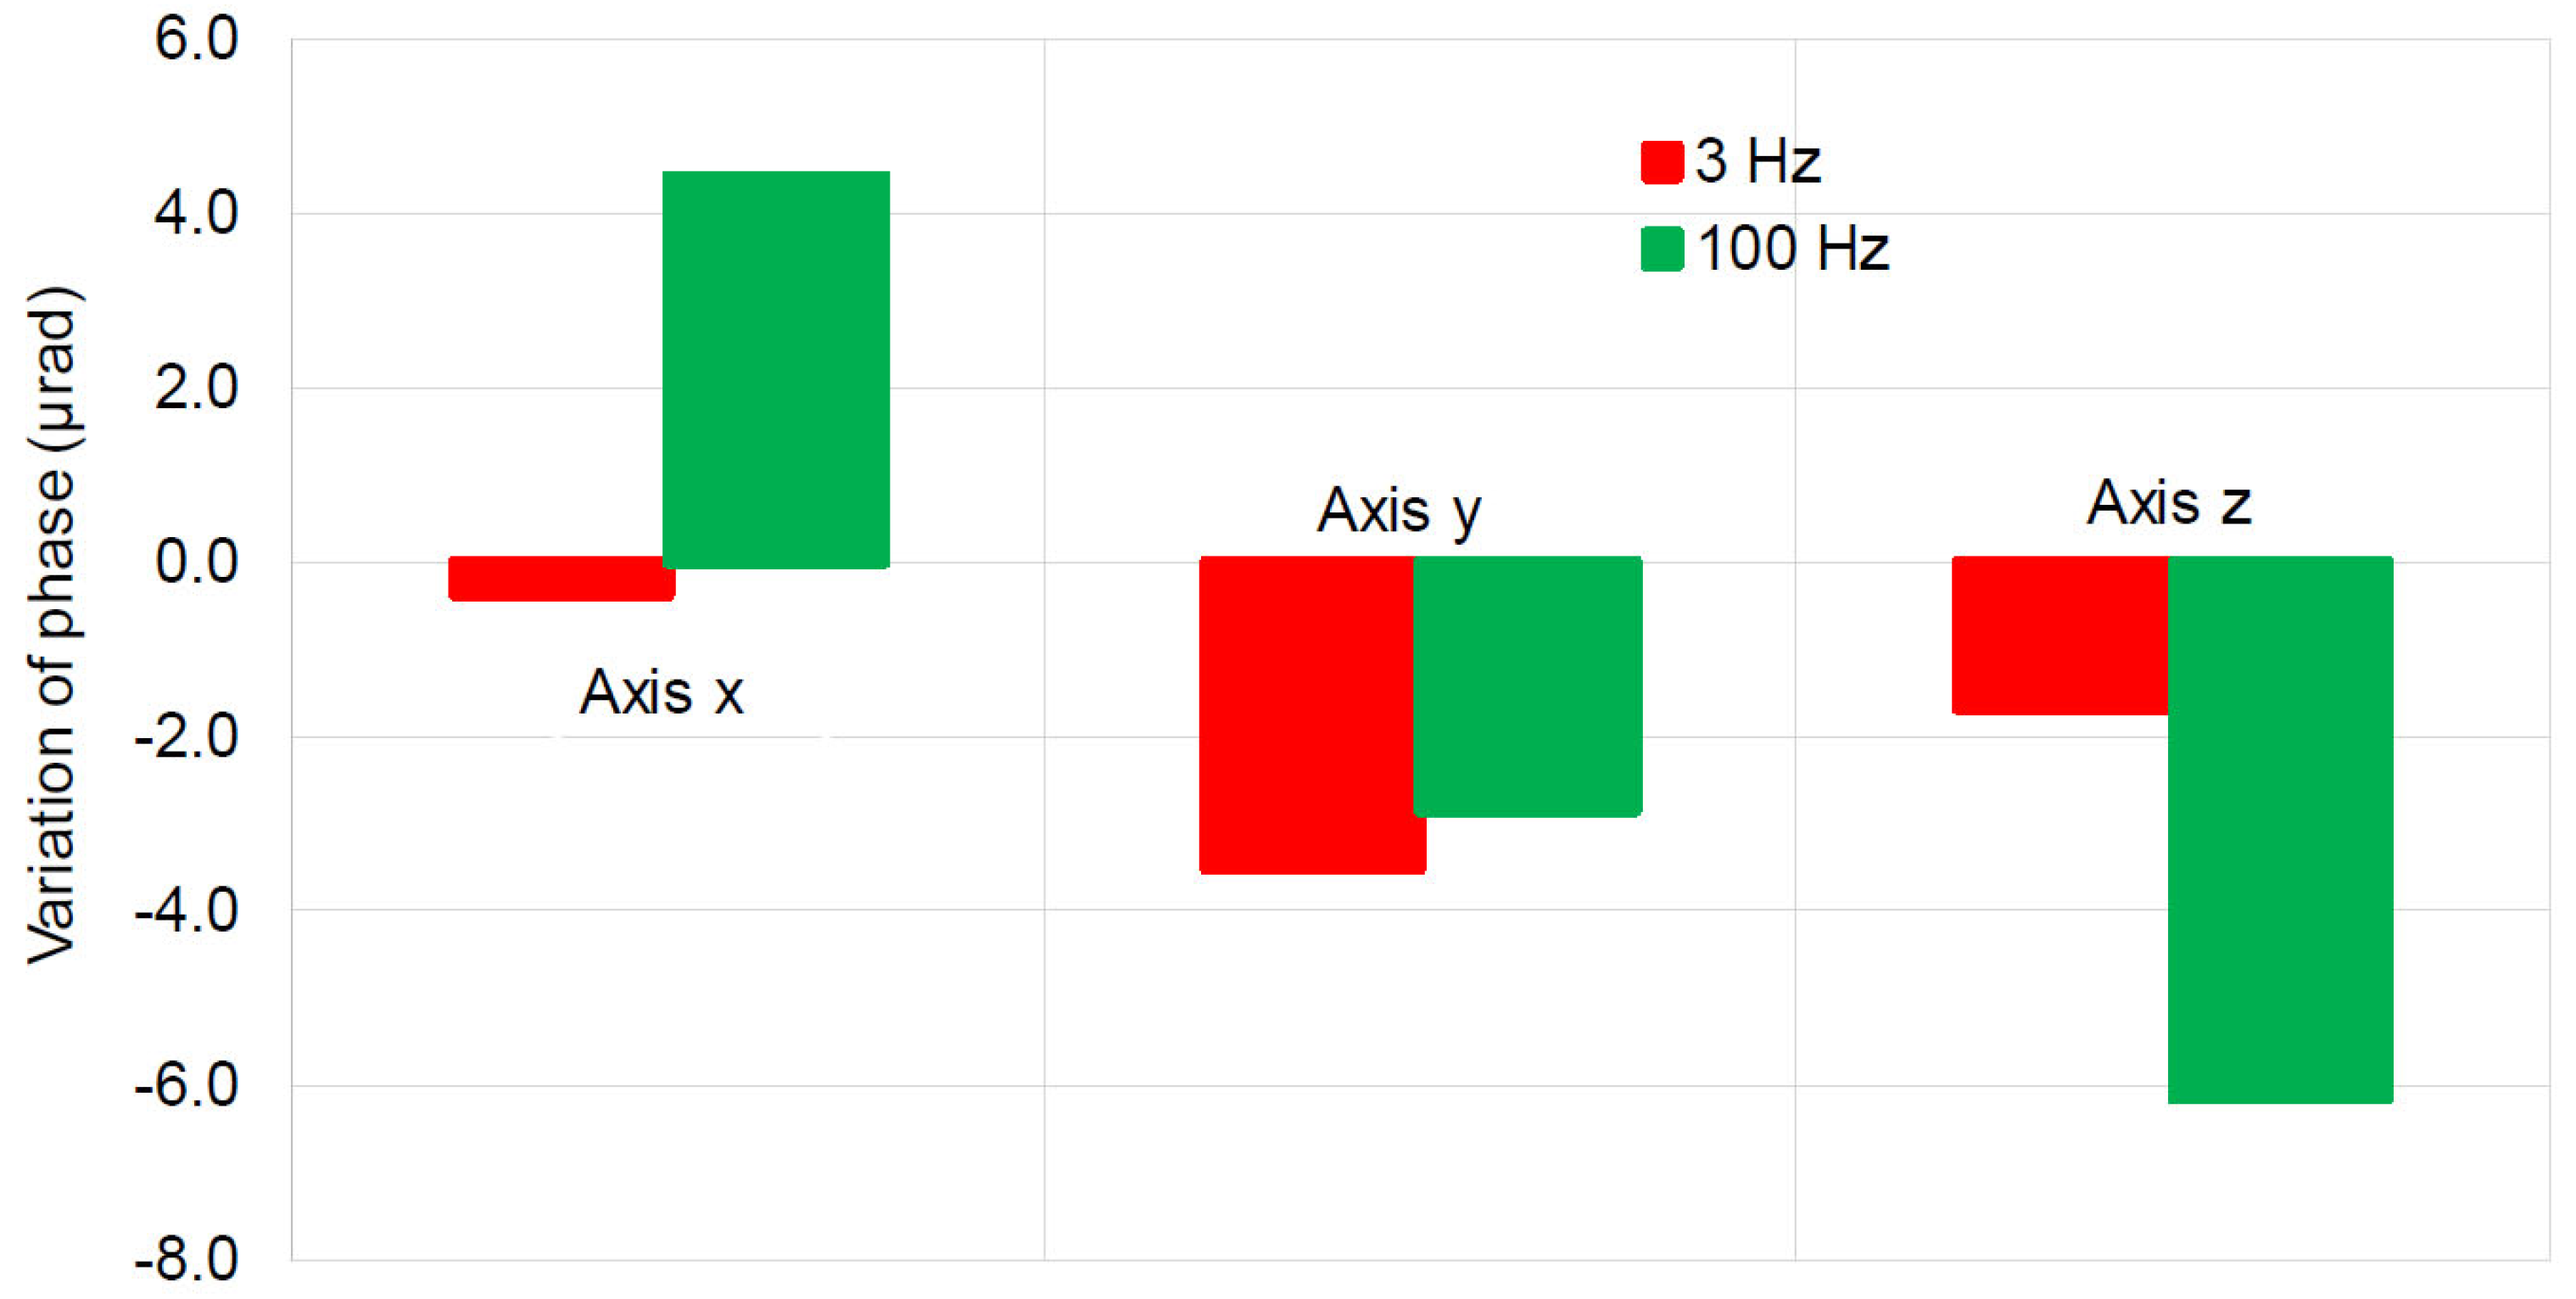
As for the temperature, the measurements without any vibrations are considered the reference for each axis and are compared with the measurements when vibrations are applied. The analysis of the results obtained after varying the three vibration parameters: orientation, frequency and acceleration, did not reveal deviations higher than those produced by the temperature.
The most important deviations are observed when transversal vibrations (along the width of the TUT,
X-axis) are applied. These variations are shown in
Figure 13 and
Figure 14 for two vibration frequencies: 3 Hz and 100 Hz, respectively, but at the same acceleration of 0.5g (m/s
2). These values correspond to the 24 kV, 50 Hz supply voltage of the TUT.
Their effects are on the order of 50 ppm deviation for the ratio error and 6 µrad for the phase displacement.
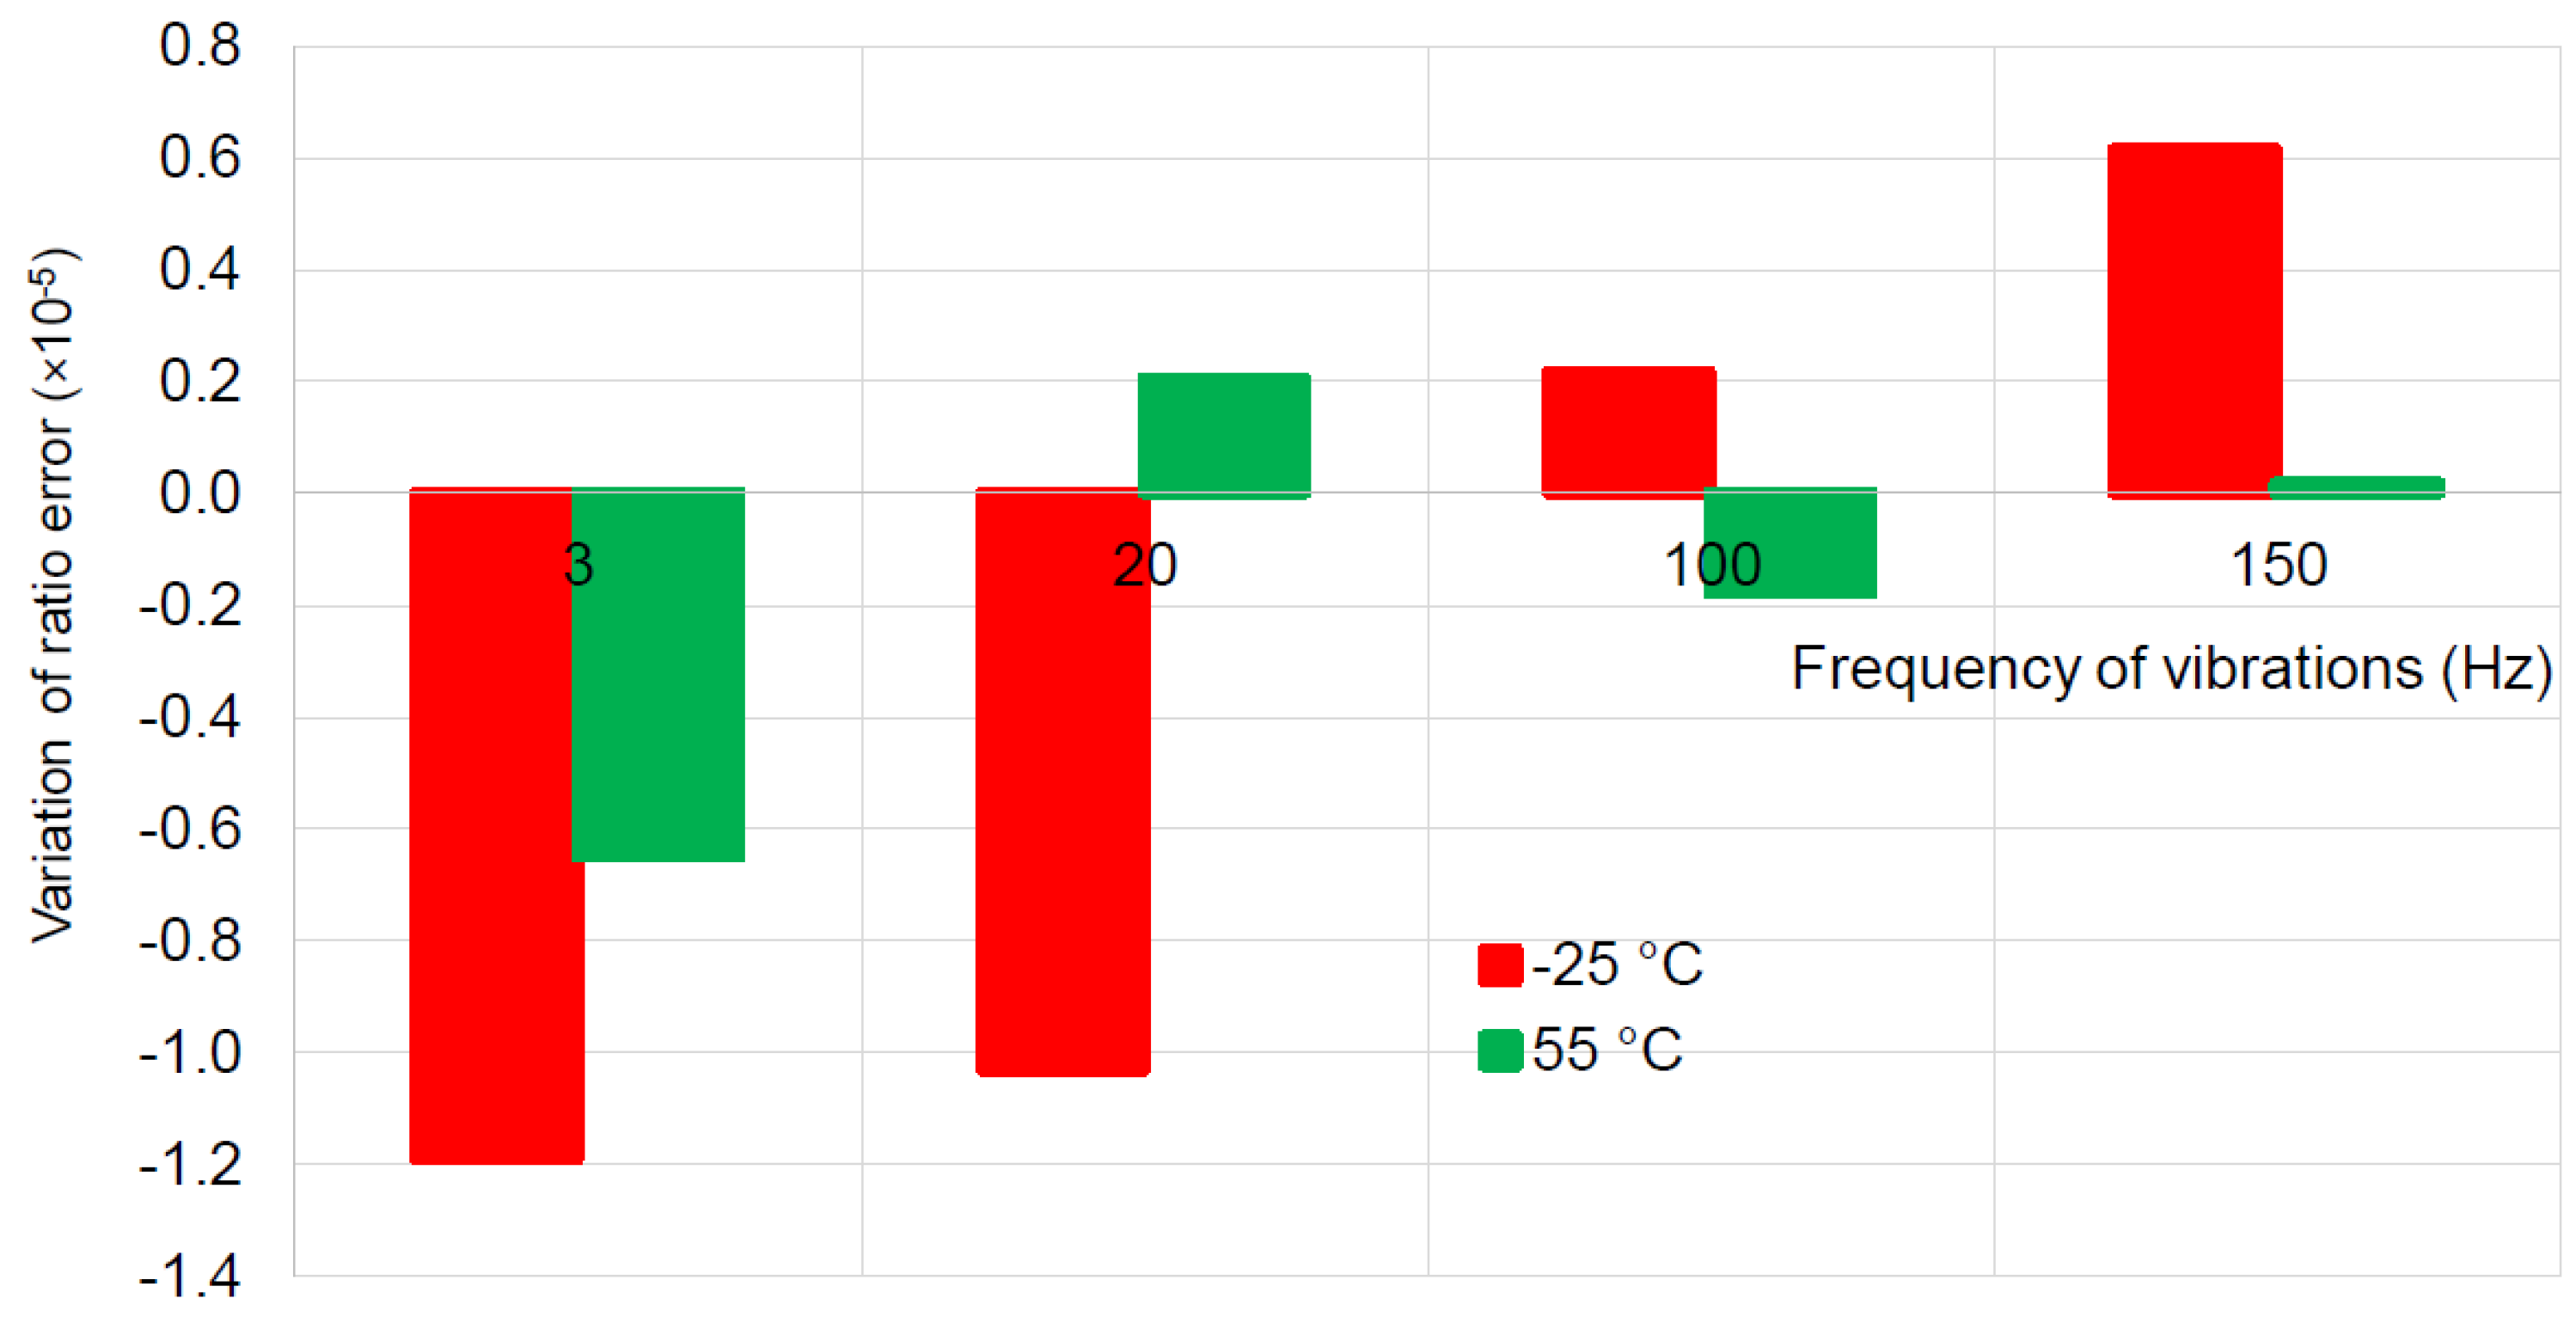
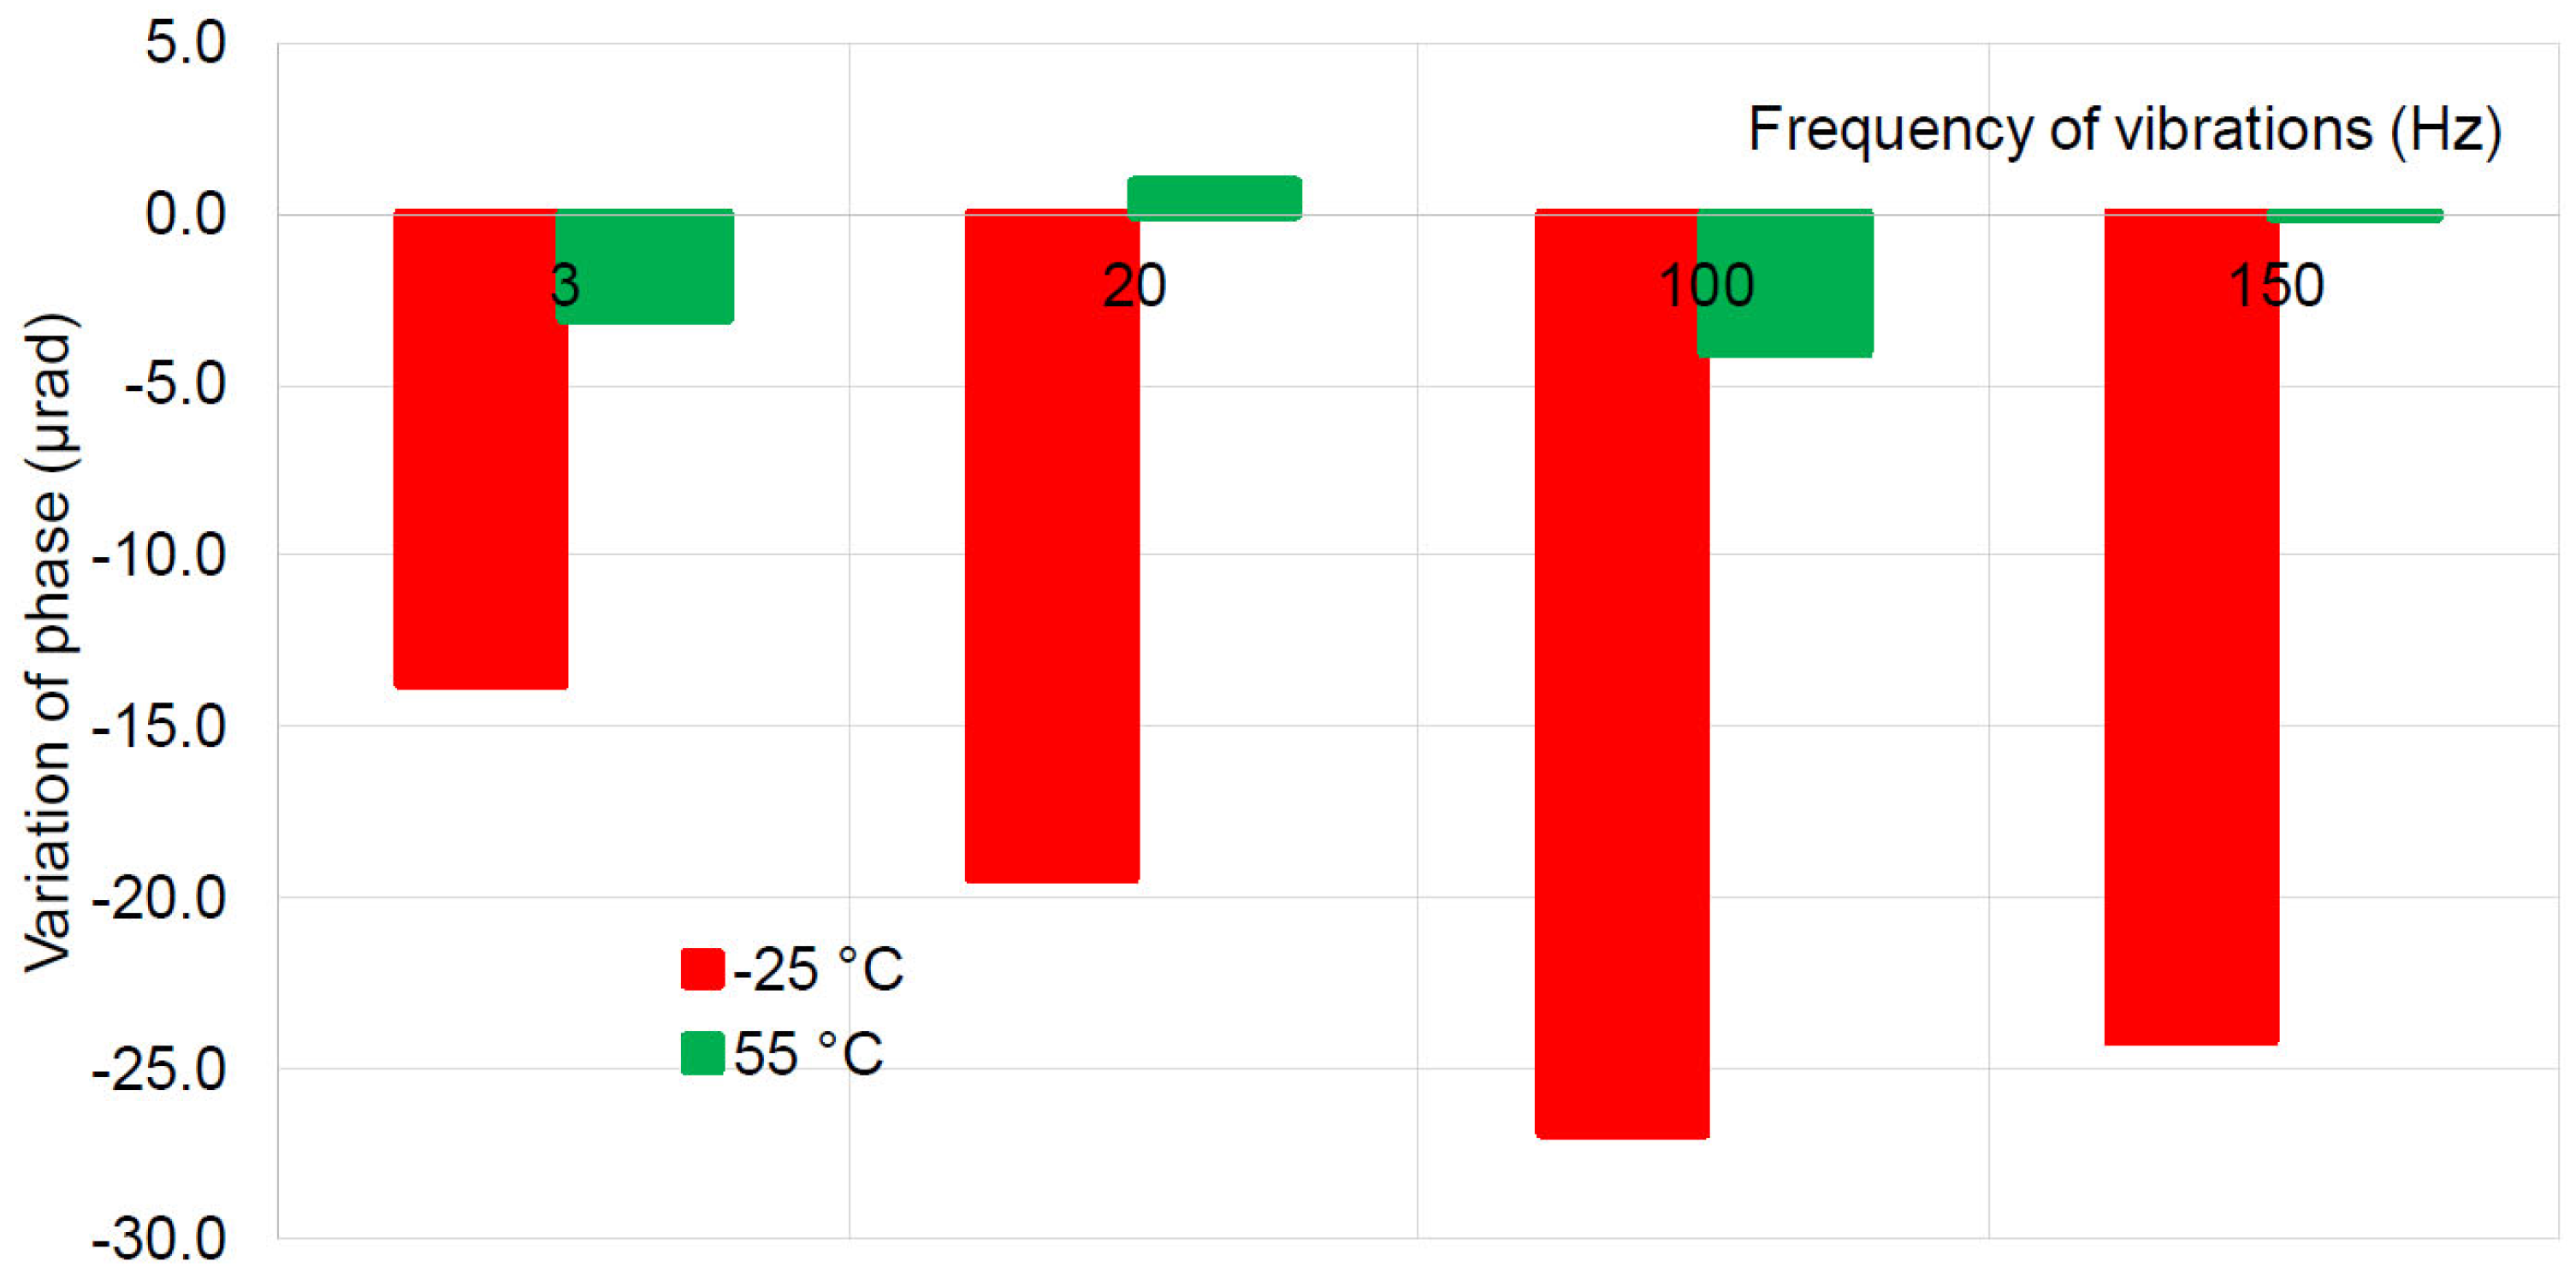
4.3. Influence of Combined Temperature and Vibration on Accuracy at 50 Hz
According to the flowchart in
Figure 9, the combined temperature and vibrations affect the accuracy at 50 Hz at vertical vibration (
Z-axis). The influence of both parameters, temperature and vertical vibration, applied simultaneously, can be analysed from
Figure 15 for ratio error and from
Figure 16 for phase displacement. It can be noticed that the highest deviation from the reference situation (no vibration at 30 kV) is obtained at −25 °C. The ratio error varies by −1.2 × 10
−5 from the reference situation when the transformer vibrates vertically at 3 Hz. The impact on the phase displacement is more visible for 100 Hz vertical vibration at −25 °C. The highest difference with respect to the reference situation is −27 µrad. The influence of the two parameters, temperature and vibration, applied simultaneously did not reveal greater effects than when they were applied separately.
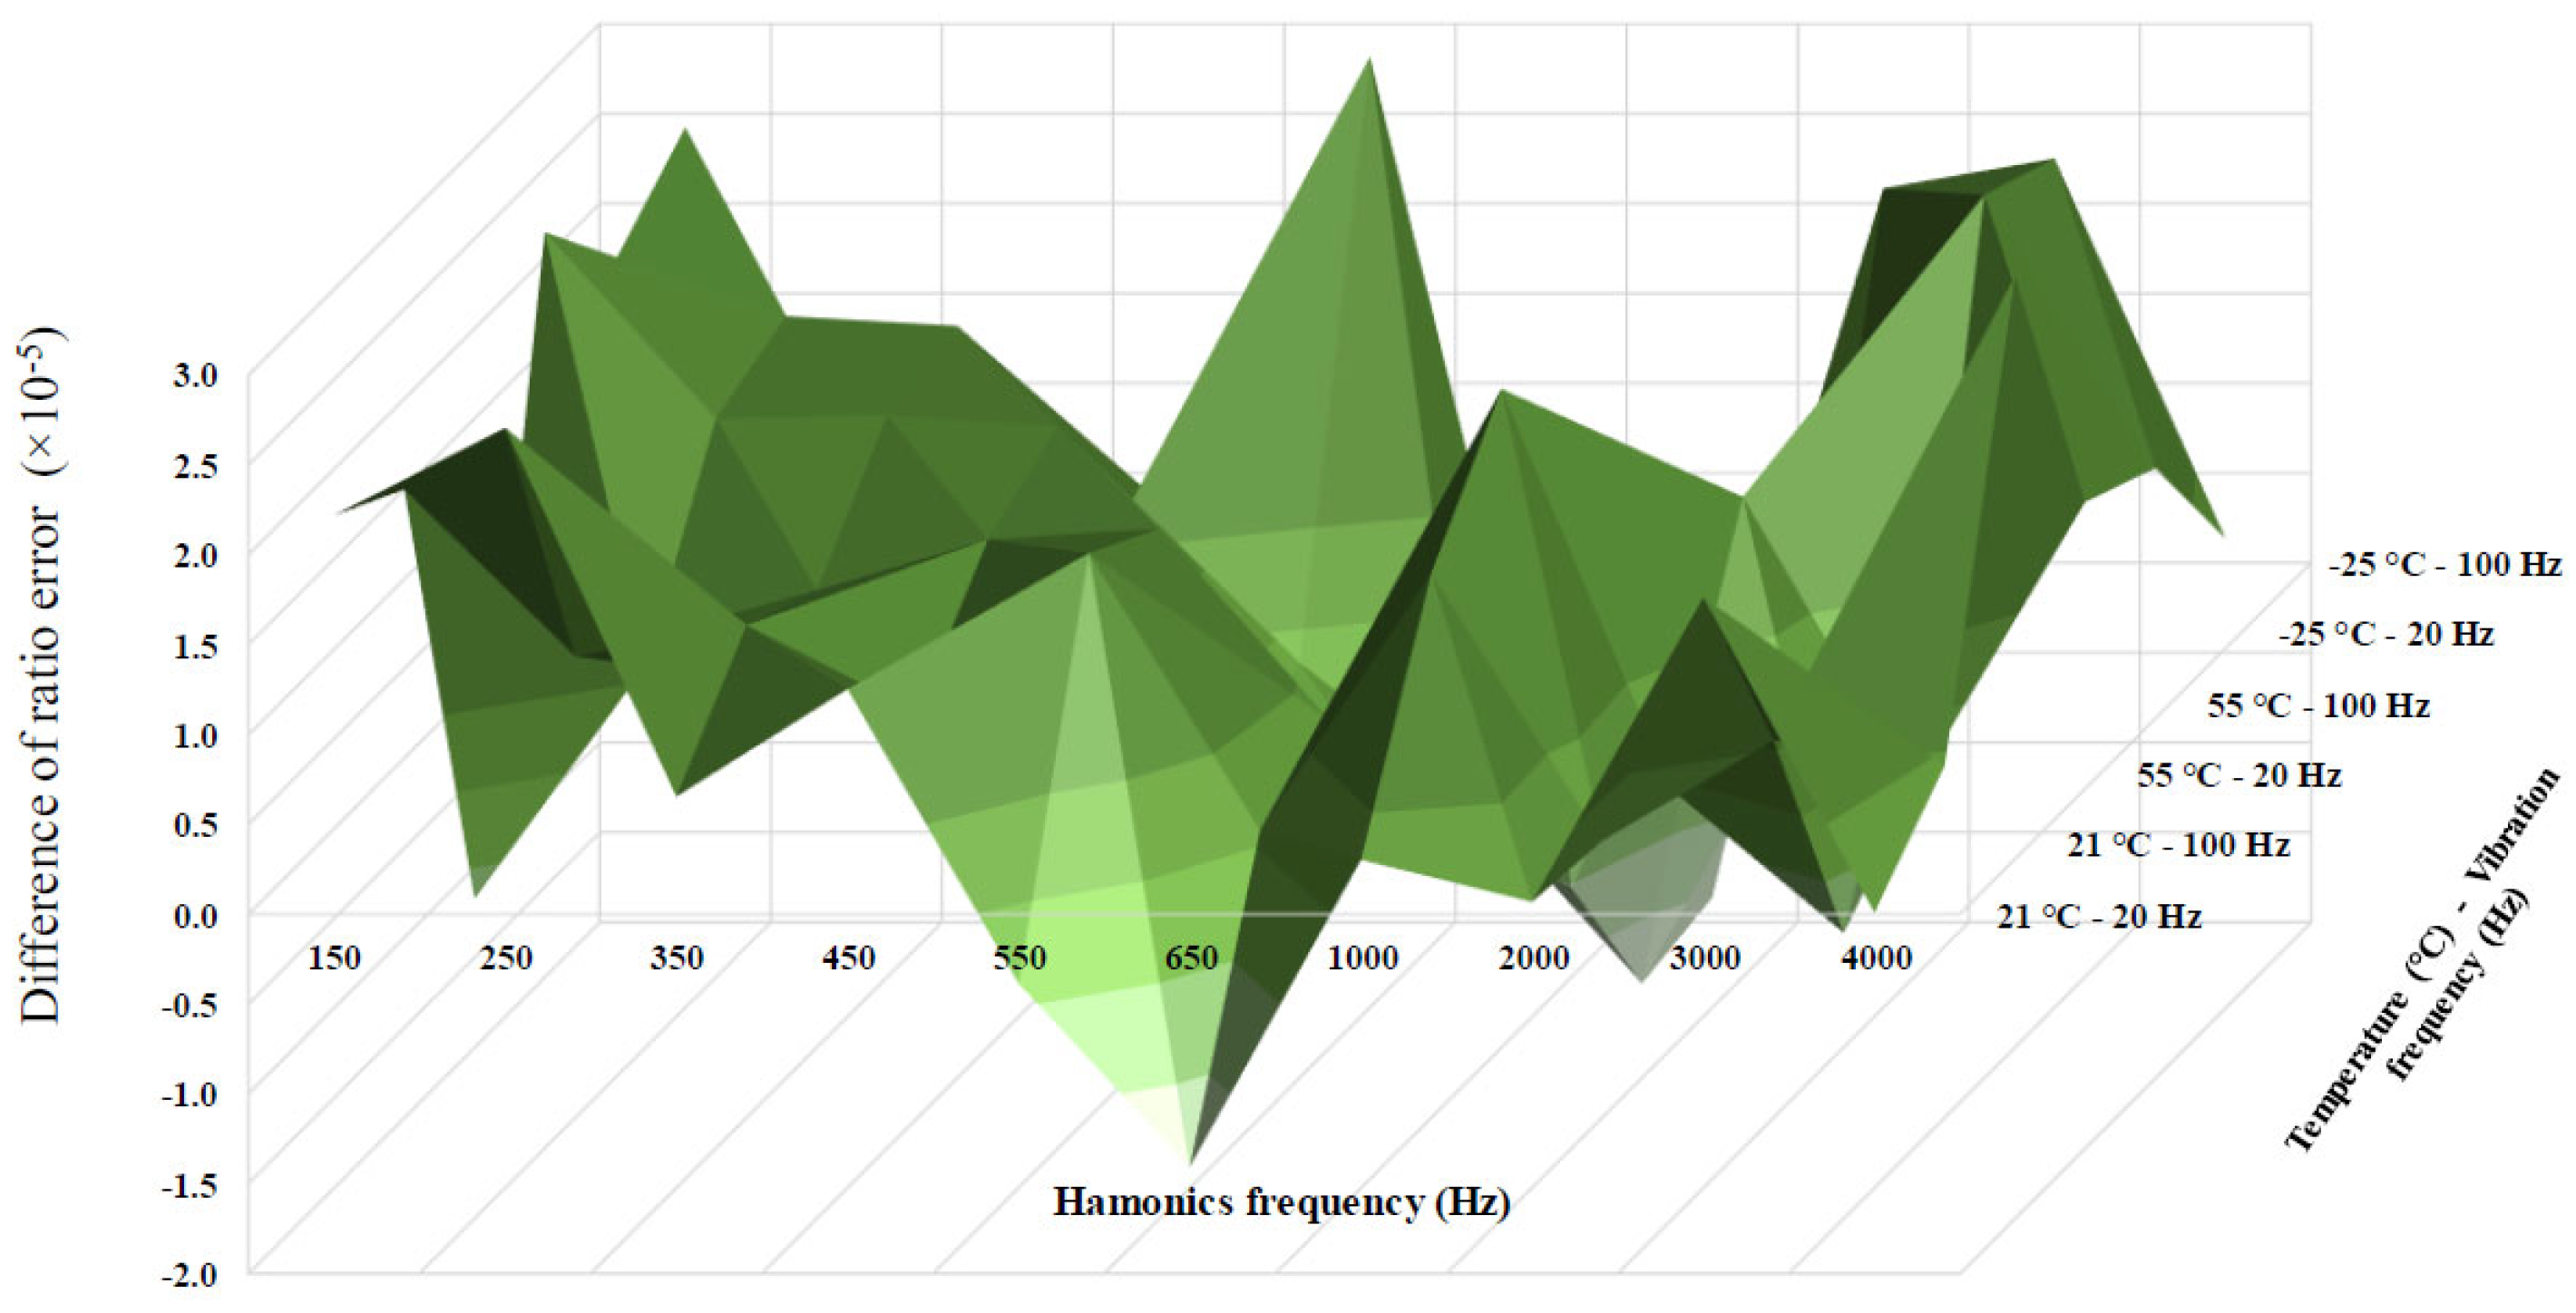
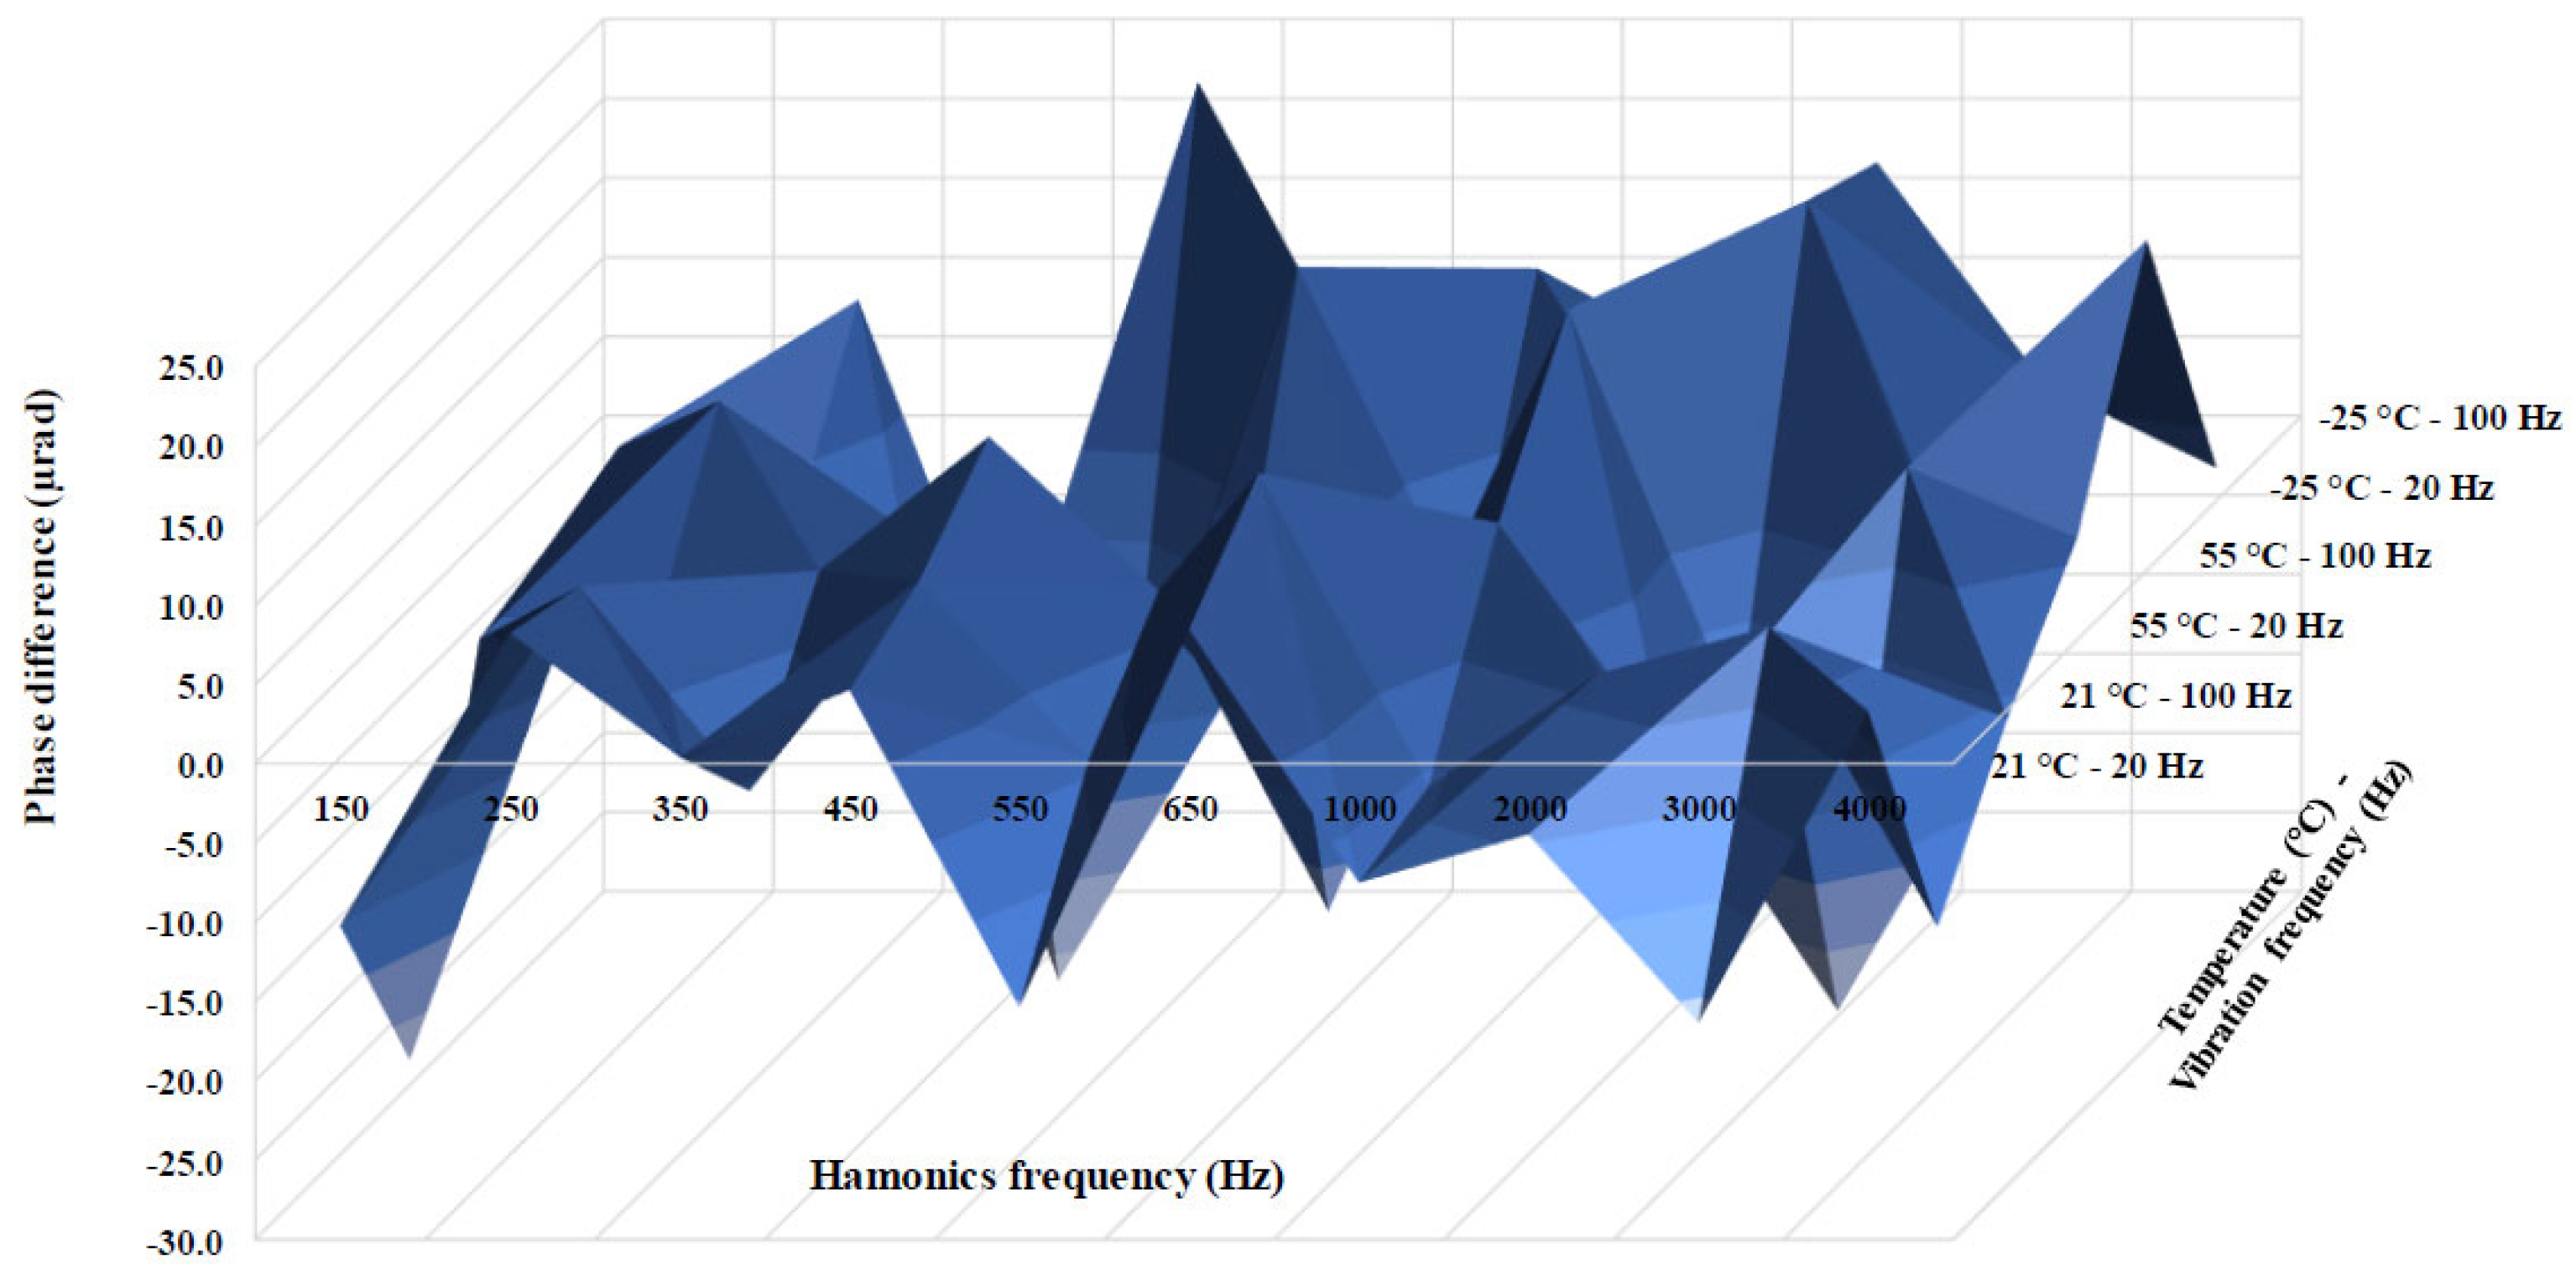
4.4. Influence of Hamonics on Accuracy at 50 Hz
According to the flowchart in
Figure 10, the combined temperature, vibration and harmonics on the accuracy at 50 Hz are performed at vertical vibration (
Z-axis). The influence of harmonics on the indications of the TUT was determined by calculating the ratio error and phase displacement with the 50 Hz primary and secondary voltages, even if one harmonic existed in the circuit. Several series of measurements were performed with the temperature adjusted at +21 °C, +55 °C and −25 °C. For one temperature, the first measurement was performed without vibrations or harmonics. This measurement is the reference for further comparisons. Then, the shaker was set to generate vertical vibrations at 0.5g (m/s
2) with a 20 Hz frequency. With these settings, several measurements were performed by generating 30 kV, 50 Hz, and one harmonic from 150 Hz up to 4000 Hz with an amplitude of 5% of the fundamental. A new set of measurements was performed similarly while the shaker vibrated at 100 Hz. For each measurement point, the ratio error and the phase displacement were determined. The results are presented in
Table 5 and
Table 6 in terms of variations with respect to the reference measurements. These tables indicate a non-significant influence of harmonics with and without vibrations for the three temperatures. The maximum variation is less than 30 ppm for the ratio error and less than 30 µrad for the phase shift. These variations do not go beyond the accuracy class of the transformer, and they are probably due to the uncertainty of measurement, which is in the same range. The TUT operation is not affected by the presence of harmonics and vibrations. The performance is slightly different with and without vibration or with and without harmonics. The 3D charts in
Figure 17 and
Figure 18 summarize the difference between the resulting amplitude and phase with and without vibrations.
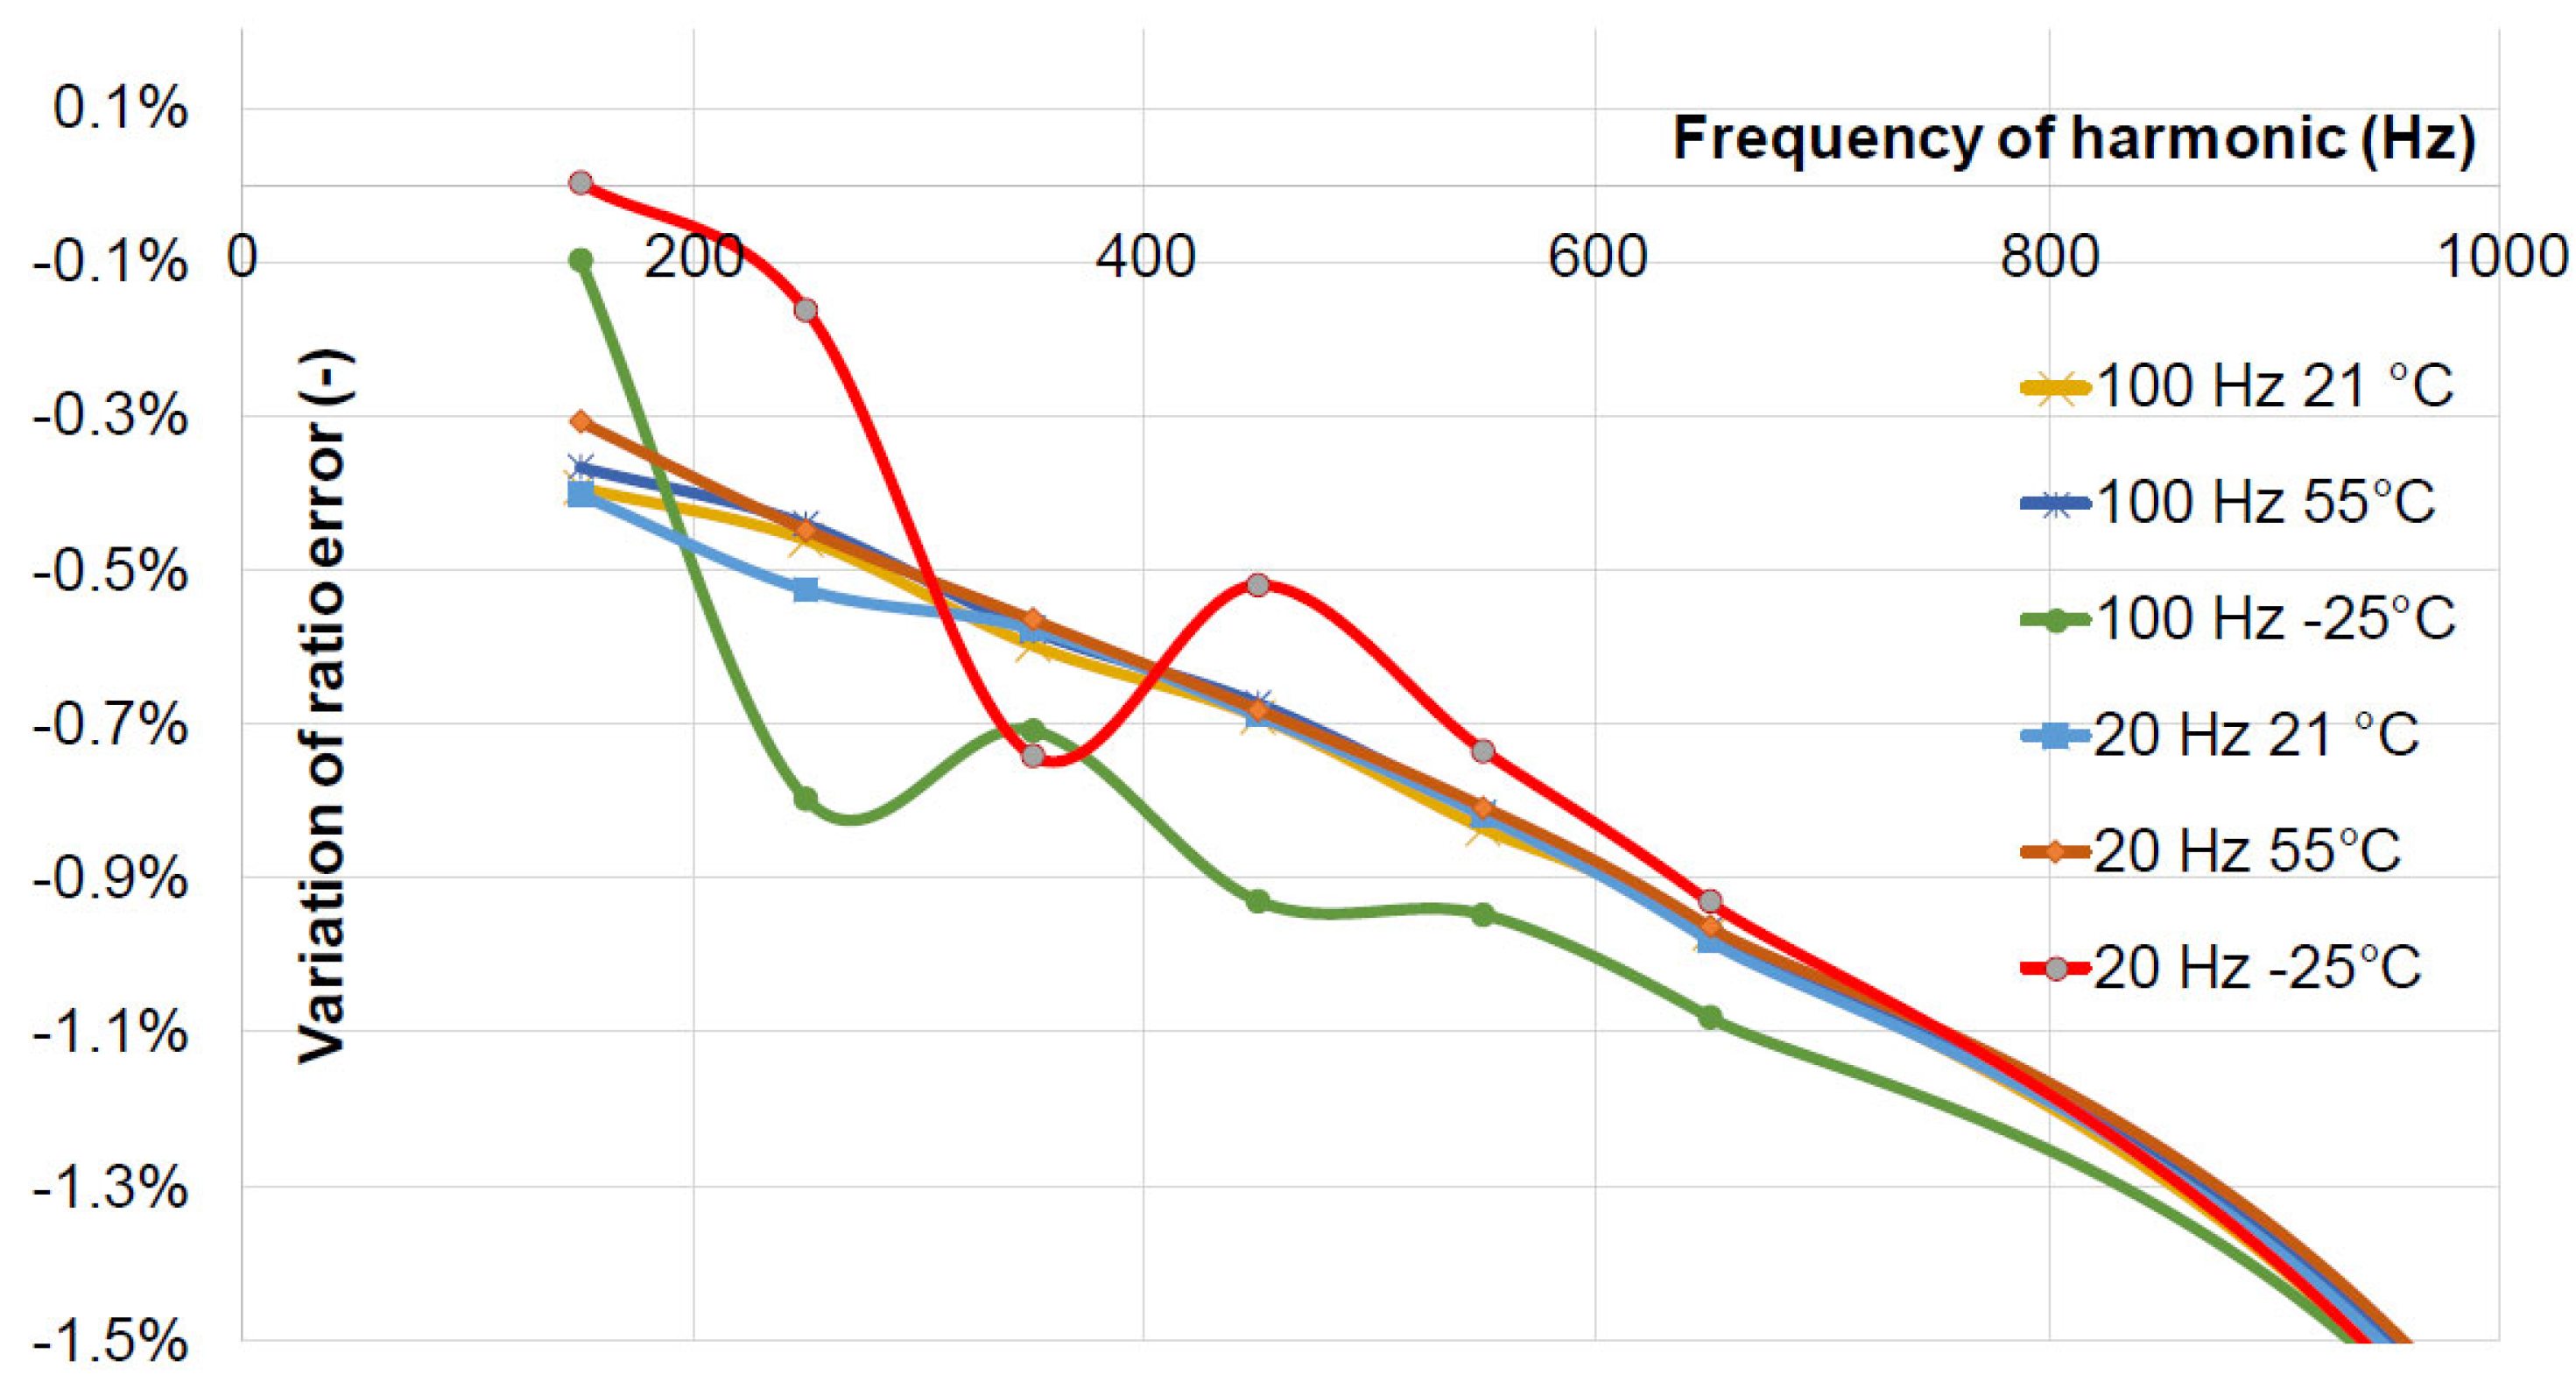
4.5. Frequency Response of the TUT under Temperature and Vibration
The measurements with harmonics were exploited from another point of view: to evaluate the performance of inductive voltage transformers in PQ measurements in the presence of multiple influence factors (temperature and vibrations). In this sense, the sampled secondary voltages of the reference system of the TUT were analyzed by applying the Fourier transform. Both the RMS values of the 50 Hz component of the injected harmonic were determined. For each acquisition, the ratio error is computed two times according to Equation (1): the fundamental-based ratio is calculated with the 50 Hz component, and the harmonic-based ratio is calculated with the amplitude of the generated/measured harmonic.
The results present the deviation of the harmonic-based ratio with respect to the fundamental-based ratio. The measurements were performed at the same temperatures as previous tests. The shaker vibrations had 20 Hz and 100 Hz applied vertically or longitudinally with respect to the TUT. The amplitude of the fundamental was 30 kV, and the amplitudes of the generated harmonics were 1.5 kV up to 4 kHz. As already observed for inductive voltage transformers [
12,
25], the deviation of the ratio becomes larger with the increase in the frequency of the injected harmonic, no matter the environmental temperature or the frequency of vibrations (
Figure 19). It can be noticed that deviations less than 1% appear for harmonics with frequencies less than 650 Hz. For frequencies up to 4 kHz, an important ratio error deviation of −18% was observed.
The influence of vibrations on the frequency response of the TUT was not clearly visible at ambient and high temperatures, as shown by the results in
Figure 19. The differences between the results obtained at 21 °C and those obtained at 55 °C in terms of ratio errors are within 0.05%, no matter the vibration frequencies. On the contrary, higher variations, a maximum of 0.35%, are obtained between the results at −25 °C and those at 21 °C. Indeed, the green and red curves in
Figure 19 show non-linear behaviour when the TUT operates at −25 °C and for low-order harmonics, H3–H13. These observations confirm the first result: the highest influence on the performance of inductive voltage transformers comes from the negative temperature.
5. Conclusions
A platform was developed to test voltage instrument transformers when multiple influence factors (temperature, vibrations and harmonics) are applied during the operation of the transformer. Two systems based on voltage transformers piloted by electronic amplifiers and able to generate harmonics up to 9 kHz were realized and used in the laboratory as well as on the test platform. The amplitude levels achieved by these systems are outstanding. The architecture of the generators will be essential for testing laboratories to offer new testing conditions to better assess instrument transformers.
The results indicate that temperature is the parameter with the highest influence on the studied inductive voltage transformer’s performance. At low temperatures, the ratio error, the phase displacement, the voltage deviation, and the frequency response of the transformer are strongly affected.
The mechanical external vibrations combined with temperature, as an influence factor, have much less influence; the change in ratio error and phase displacement at 50 Hz depends on the axis of vibration but does not have a strong influence. Changes in the order of tens of ppm for ratio error and tens of µrad phase displacement were observed. The frequency response of the transformer has not been affected by the presence of vibrations either. Variations of the same order were observed also with the presence of harmonics up to 4 kHz.
However, using the studied inductive voltage transformer to measure disturbances present on the supply voltages can be performed up to 650 Hz with increased error (deviation up to 1.1% from the 50 Hz precision). Indeed, several causes explain the increased errors associated with the increased frequency of harmonics. Mainly the saturation of the core material, the skill effect caused by high-order harmonic current, the AC resistance loss in the transformers and the stray impedances.
The study allowed for the creation of new facilities for instrument transformer testing with multiple external influence factors (temperature, vibration and harmonics).


