1. Introduction
Nowadays, the use of three-phase induction motors is widespread. Induction motors are reliable electrical machines as they require little maintenance; this is because they do not contain commutators. They are relatively inexpensive and can be purchased with capacities ranging from dwarf power to industrial high power. They do not require any power electronics except when the need arises for speed control or soft starting. Induction motors are speed-controlled by frequency converters [
1].
Each of these frequency converters usually has a three-phase inverter at the output. The inverter sets the motors to an adjustable frequency, thus varying the speed. Of course, the voltage must be varied in the process, and various algorithms adjust the frequency and voltage simultaneously. The inputs in the frequency drives are rectifiers, which can be either diodes or thyristors. A controlled thyristor rectifier is used to vary the voltage of the DC bus. If only a diode rectifier is used at the input, then pulse-width modulation is used to vary the voltage at the output of the inverter [
2].
In many industrial applications, continuous power is essential for the workflow. This is achieved by using uninterruptible power supplies, each of which uses an inverter to supply power to the load from the battery when the power from the main line goes absent. In some cases, the motors are equipped with uninterrupted variable-frequency drives. It is worth using these systems where continuous operation is required—for example, when a circulating pump is used in a heating system, or a pump is used to lubricate a turbine in an industrial environment. For such purposes, the installation of a three-phase induction motor is recommended due to its low maintenance requirements. A three-phase frequency converter is required to drive it. If an uninterruptible design is required, batteries must be installed on the DC bus (the input of the inverter) in the frequency converter. This, of course, requires a battery charger and monitoring, protection circuits, etc.
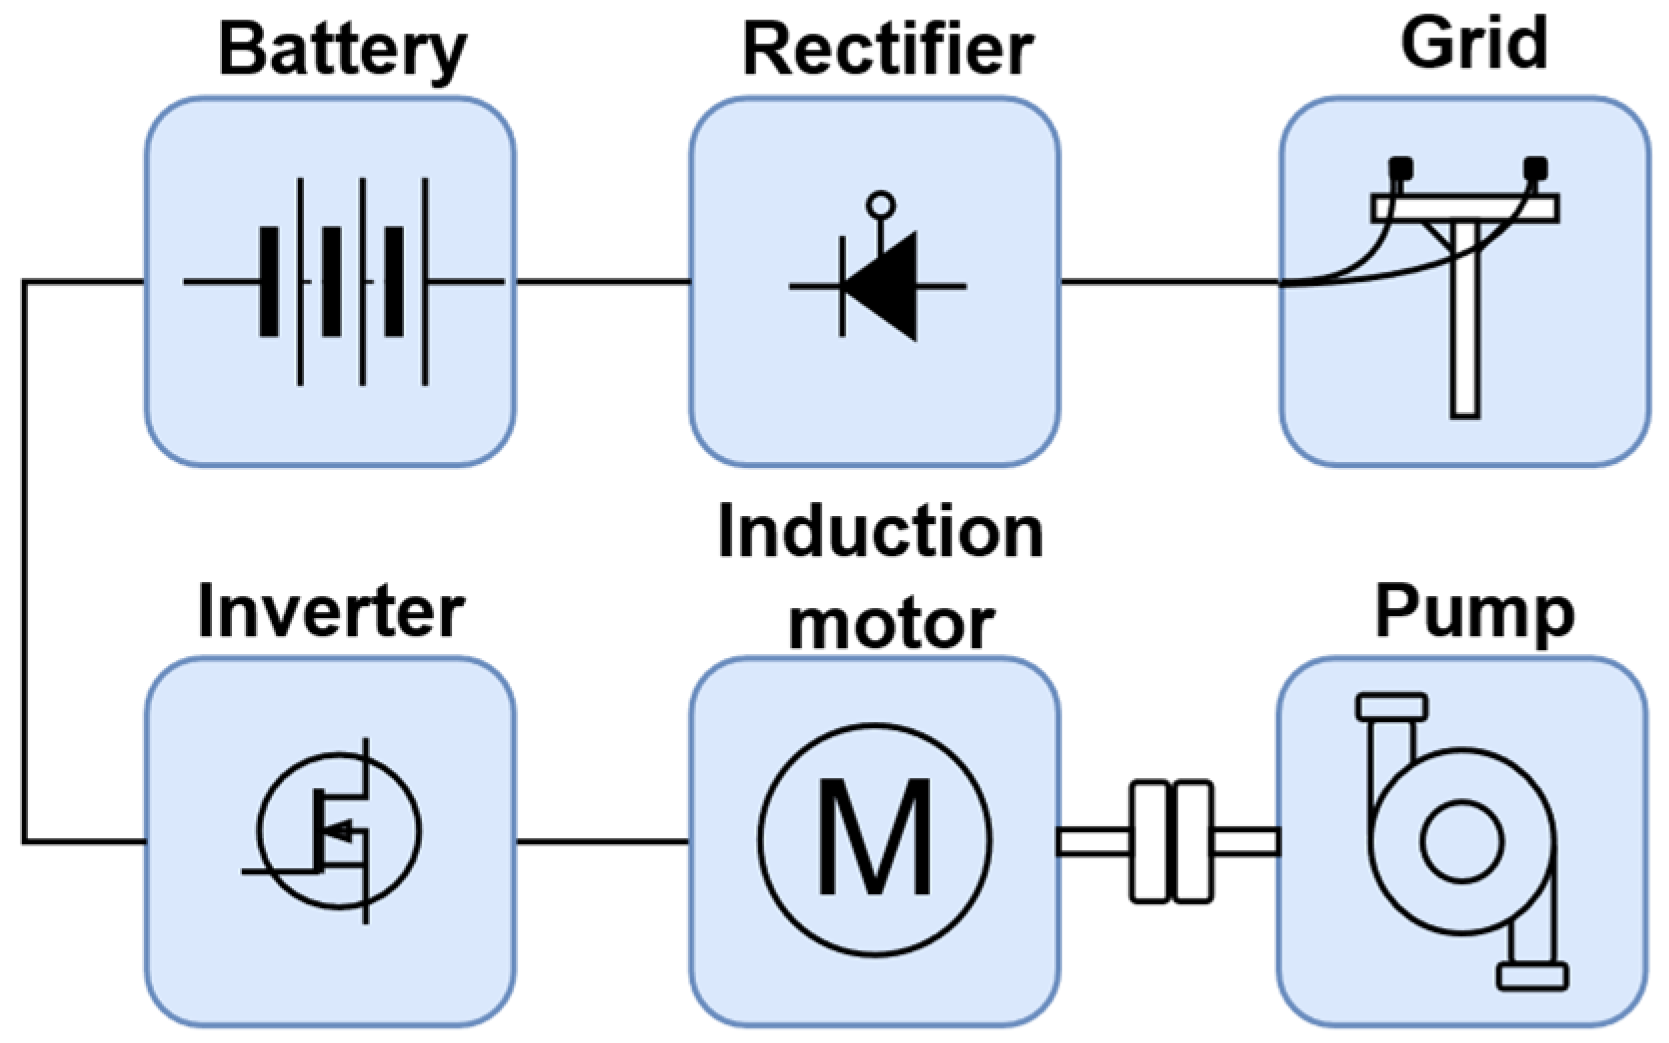
Figure 1 shows a typical uninterruptible induction motor drive [
2]. The main line charges the batteries with a rectifier and simultaneously supplies the inverter with DC voltage. The inverter drives the induction motor, which is loaded by a machine (e.g., a pump). In the event of a power failure, the rectifier no longer supplies the DC bus, but the batteries still power the motor [
2,
3].
It is worth considering integrating the solar system into the uninterrupted induction motor drive. This is because the batteries can be charged using solar panels. In the event of a prolonged power failure, the solar panels can provide additional operating time for the load. If one phase (230 V 50 Hz voltage) is also required without interruption, it is worth considering installing more panels in the solar power system, in which case an off-grid inverter can simply be connected to the batteries. If the rectifier is switched off, there is also an operating mode in which the batteries and the motor are powered only by solar panels.
In both industrial and domestic applications, typical single-phase off-grid solar inverters (
Figure 2) are widely used. In most cases, a low voltage (12 V, 24 V, 36 V...) is required at the input of the inverter and the voltage is increased to 230 V at the output using a transformer. The inverter must be connected to a battery that is supplied by the solar panels via an MPPT (Maximum Power Point Tracking) controller. An exception is in the use of off-grid inverters, where the input of an inverter is directly connected to a solar panel. The MPPT controller is a DC/DC converter that changes the voltage at its output depending on the maximum operating point of the solar panel. A changing voltage at the input of the inverter and a changing load at the output would cause a high voltage ripple or oscillation at the output due to the controller [
4,
5,
6].
To generate a sinusoidal output voltage, the inverters use the SPWM (Sine Pulse Width Modulation) technique. In this technique, a sine wave and a triangle wave are compared to each other. The resultant pulse generated is the required PWM signal that drives the MOSFETs. The triangle wave frequency affects the switching frequency (e.g., f
sw = 22 kHz) and the sine wave frequency determines the first-order frequency (e.g., f
1 = 50 Hz) in the output. The higher the switching frequency is, the more the filter can attenuate it. This also means that the dynamic power loss on the MOSFETs also increases. The low-pass filter is used to filter the switching frequency at the output. A capacitor is connected to the output of the transformer. Due to the inductive nature of the transformer, together with the capacitor, it forms an LC low-pass filter. The attenuation of low-pass filters is not infinite. Therefore, the output voltage will not be purely sinusoidal [
4,
5,
6,
7,
8,
9].
This paper and project are extended versions of our previous research, which was also published in MDPI’s Energies (19 January 2022, p.18). Previously, we tested an uninterruptible induction motor drive. However, we have now combined the existing uninterruptible induction motor drive (UMD) with an uninterruptible power supply (UPS) and examined their operation in different operating conditions while also investigating the quality parameters. We are aware that the two systems (UMD and UPS) exist separately, but the benefits of combining them have not yet been examined. We see the potential of the combined systems to provide benefits that could lead to future industrial application of the system, which are presented in this study.
2. Off-Grid Inverters in Combination with Uninterruptible Motor Drive
2.1. Voltage Harmonic Limits in EN 50160 Standard
THD (Total Harmonic Distortion) characterizes non-pure sinusoidal quantities. THD is defined as the ratio of the equivalent root mean square (RMS) voltage of all harmonic frequencies to the RMS voltage of the fundamental frequency. According to the EN 50160 standard, the voltage THD must be less than 8% (mean value for 10 min below 1 kV). A table in the standard gives more detailed information on the relative voltage limit that the given order number of harmonics can reach in percentage format. The standard only discusses relative deviations up to the 25th-order harmonic (
Figure 3). In some countries these values are set individually. In Norway (THD
max = 3%), for example, stricter values apply [
10].
The transformer in the inverter produces harmonics, and due to the voltage conversion, this process cannot be omitted in most cases. There is more distortion at the AC-voltage zero crossing than at the other phase angles. This is due to the voltage drop in the opening direction of the switching semiconductors. In the case of IGBTs, this is between 1–3 V. For MOSFETs, this is highly dependent on the current.
The standard also requires that the voltage flicker under 1 kV should not be greater than 5% continuously and not be greater than 10% infrequently. This means that the value of the flicker can be at 230 V
RMS ± 11.5 V
ACRMS continuously. In this case, the DC bus voltage ripple can be a maximum of ±16.26 V [
10].
2.2. The Advantages and Conditions for Combining the Two Systems
If both an uninterruptible induction motor drive and an uninterruptible single-phase power supply (UPS) are needed at the same place, it is worth combining the two systems. Such systems are not widespread, although combining systems can provide many advantages. A typical off-grid inverter cannot be integrated directly into an uninterruptible induction motor drive. A one-phase inverter that can operate without a battery and a solar panel supplying at least 340 V
DC and using SPWM technology must be designed. The term ‘off-grid inverter’, which will be used in the rest of the manuscript, is defined as an inverter that does not feed back into the grid like grid-tied inverters but feeds a load.
Figure 4 shows an off-grid inverter combined with an uninterruptible motor drive. The solar panel uses an MPPT controller to charge the batteries in a typical way. A DC/DC converter increases the battery voltage (12 V, 24 V, 36 V...) to the desired value (min. 340 V
DC for 230 V
AC). The output of the rectifier and the LLC converter can be considered a universal DC bus (blue wire in the figure). Various inverters, as well as additional DC/DC converters to increase the total power, can be connected to it. If the batteries run out because there is not enough irradiation or the load current is greater than the charging current, the rectifier can fully supply the one-phase loads and the motor as well. In the event of a power outage, the loads will be supplied through the DC/DC converter from the battery and solar panel if enough irradiance is available. When the mains are turned off, no large switching transients occur in the DC bus, as buffer capacitors are installed, and they smooth out the voltage breakdowns. Furthermore, the controller of the LLC converter intervenes immediately in this case.
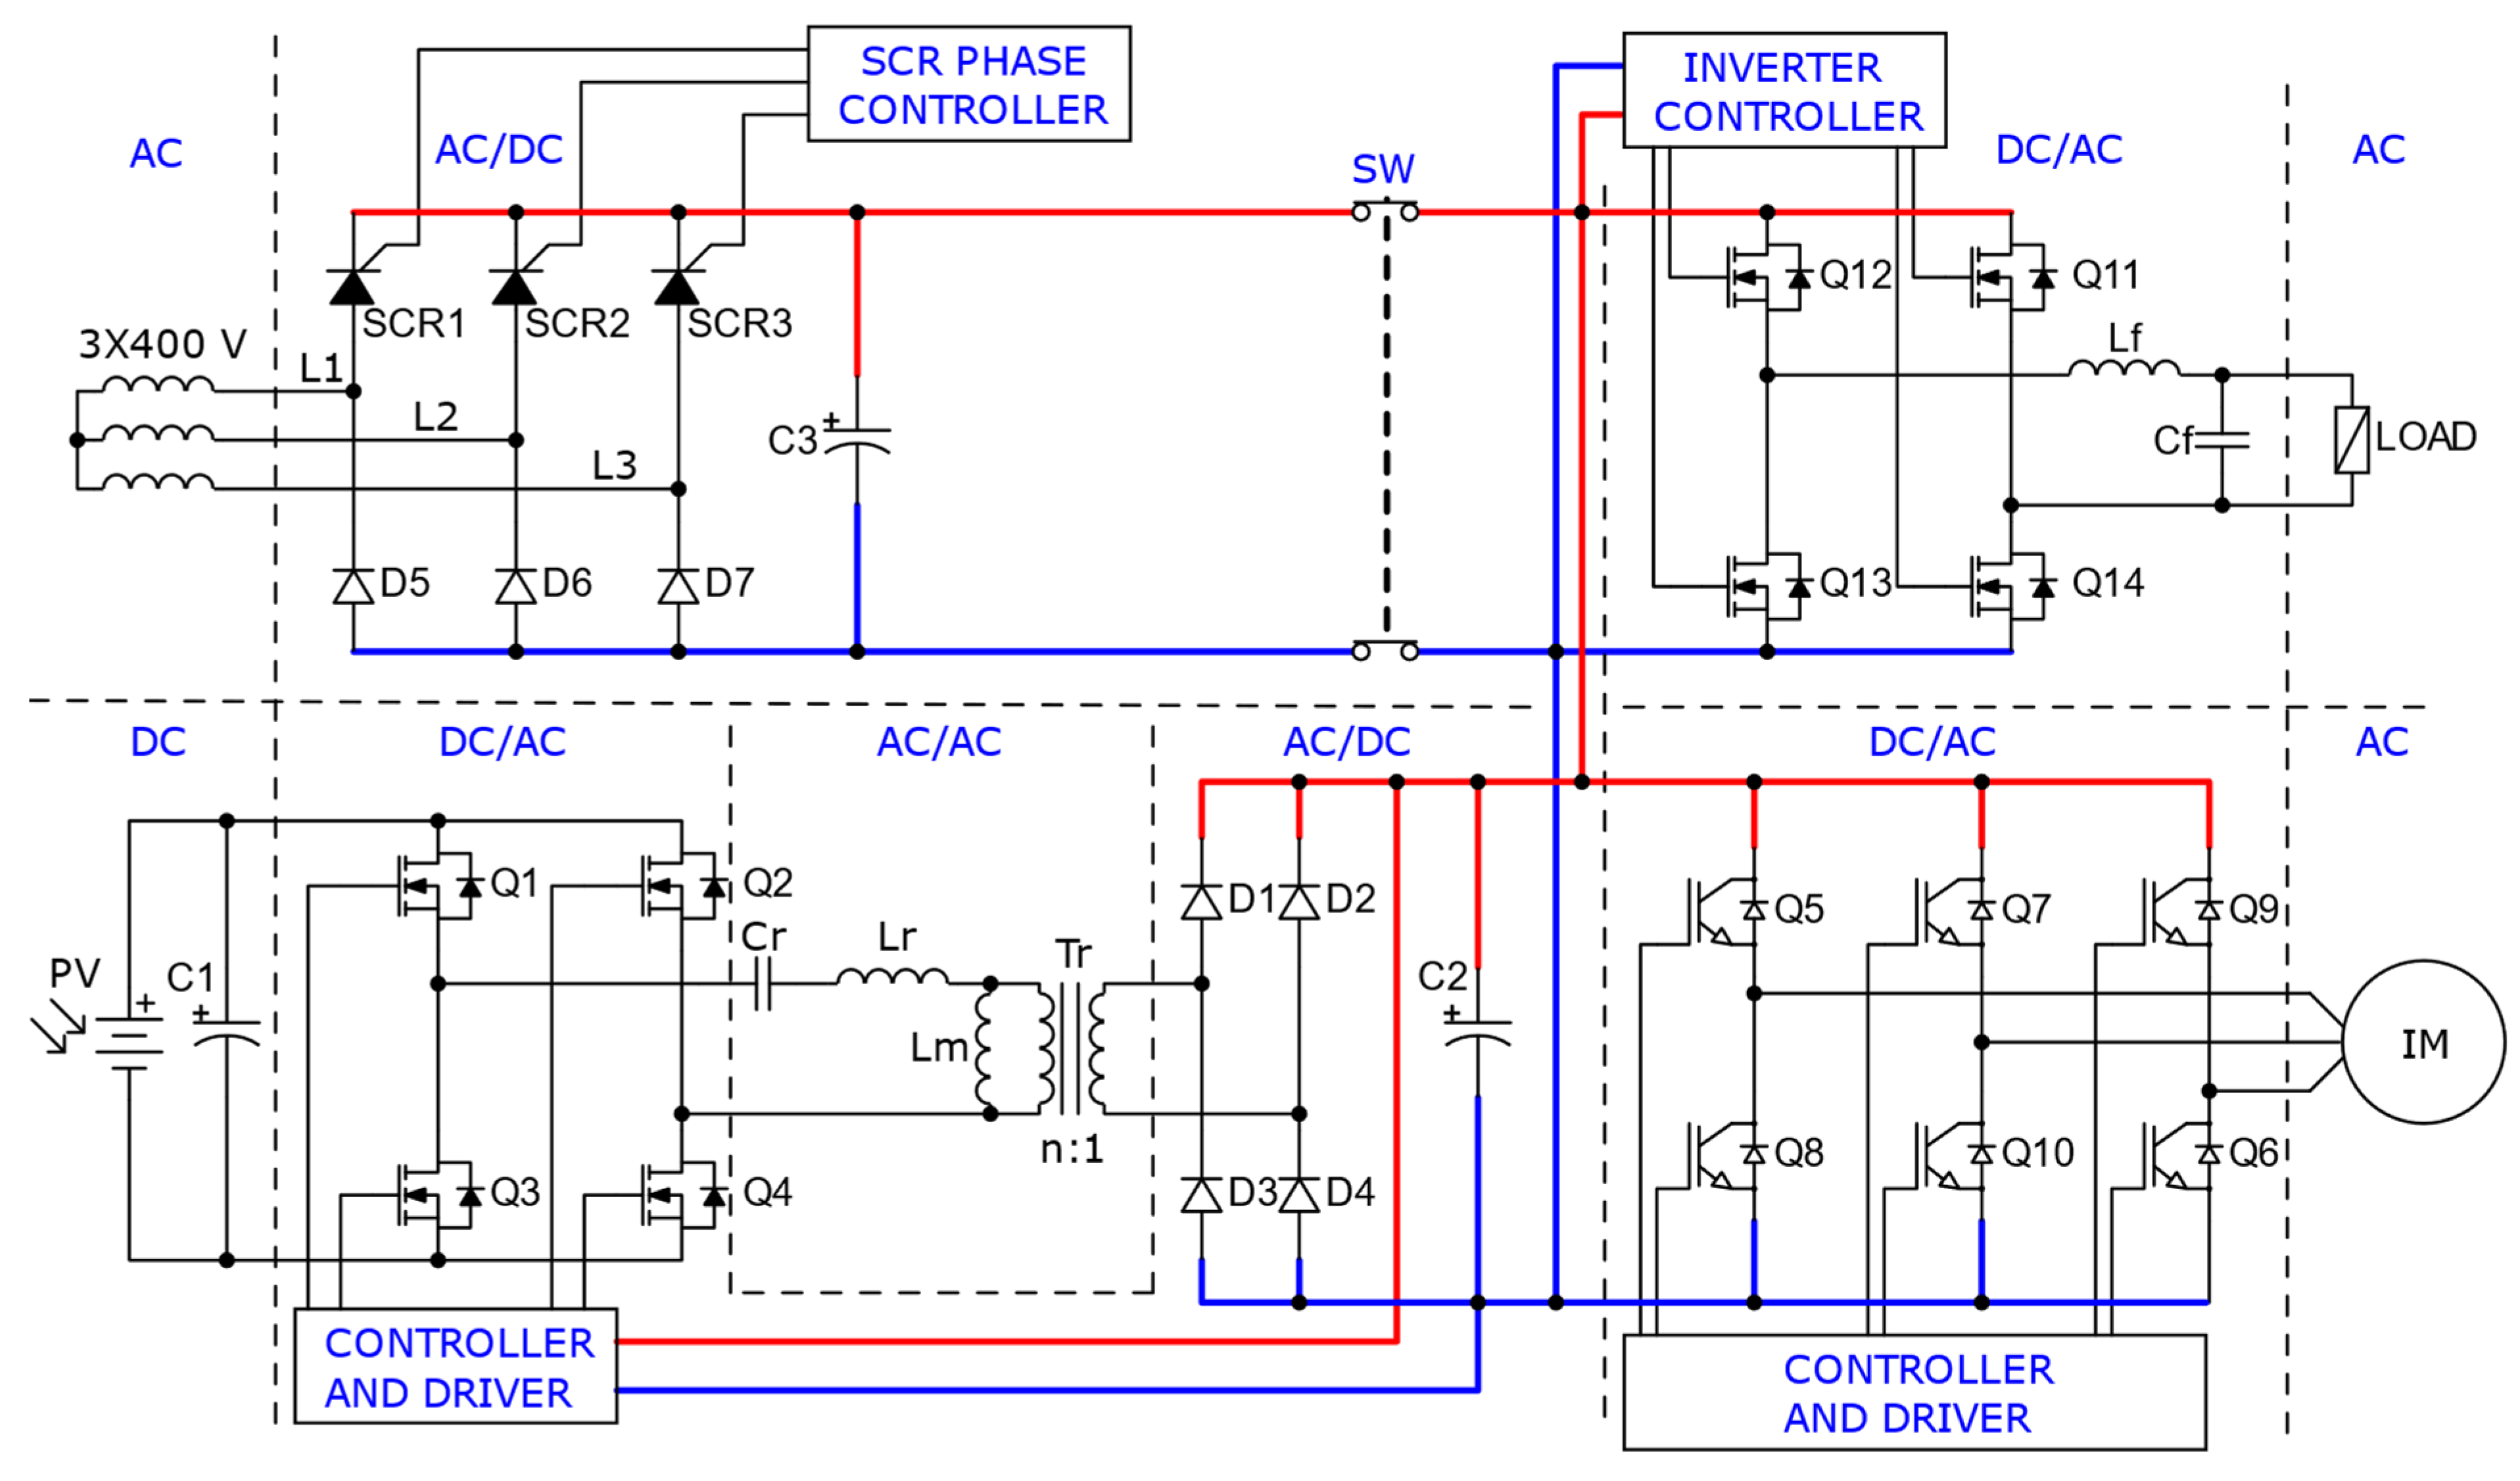
Figure 5 (below) shows a schematic diagram of a solar off-grid inverter combined with a solar uninterruptible motor drive that can operate without a battery. In this case, if there is not enough irradiation, the inverter cannot provide uninterruptible operation, but it is much cheaper than battery-powered inverters. If a battery is included in this schematic, an MPPT controller is also required. The role of the MPPT controller cannot be performed by the LLC converter because if it were, the output voltage would change. The purpose of the LLC converter is to keep the universal DC bus at a fixed 340 V.
Figure 5 shows a half-controlled three-phase rectifier situated at the top left corner. Using a three-phase rectifier (comprising diodes and thyristors) is recommended for achieving a smoother DC voltage. In this case, since the full-bridge rectifier cannot operate in inverter mode, a semi-controlled version is sufficient. Inverter operation would only be possible if the polarity of the DC bus voltage could be reversed, but such reversal is not permitted. The DC bus (indicated by red and blue wires) can be considered universal, allowing for connection to different rectifiers, DC/DC converters, and multiple inverters. When the SW switch is closed, the grounding of the DC bus is no longer isolated from the grid. However, this is not problematic because the LLC converter’s transformer effectively isolates the grid’s ground from the solar panel and the battery, enabling the grid to supply the DC bus through the rectifier. The three-phase inverter generates variable-frequency voltage for the motor based on the DC bus voltage, thus facilitating motor speed control. The LLC converter (situated at the bottom left corner) also contributes to the DC bus by means of a single-phase inverter, resonant tank, transformer, rectifier, and smoothing capacitor. The universal bus is connected to the single-phase inverter, which utilizes SPWM (Sinusoidal Pulse Width Modulation) technology to generate sinusoidal voltage. The generated voltage is further smoothed by the LC low-pass filter, providing power to the output load (impedance). Additionally, the three-phase inverter that drives the induction motor is connected to the DC bus. This three-phase inverter can be controlled in a simple manner or using technologies such as SPWM, SVPWM (Space Vector Pulse Width Modulation), or field-oriented control.
If the rectifier and the LLC converter are feeding the DC bus at the same time, the DC voltage waveform should be examined. The LLC converter operates at a frequency that is orders of magnitude higher than the mains frequency, and so, to simplify the analysis, its output voltage is assumed to be perfectly smooth. Furthermore, the semiconductors are assumed to be lossless to simplify the examination. In addition, it should be noted that the mains voltage is symmetrical and the thyristors (SCRs) are fired symmetrical. These results are shown in a schematic circuit in
Figure 6.
The analysis of the semi-controlled rectifier should be supplemented by considering the DC voltage and resistance inserted. Current flows at the output of the rectifier, when the instantaneous value of the mains voltage is greater than the value of the DC voltage (V
0DC), are applied because this point of time is when the semiconductors can switch on. The V
0DC voltage is the output voltage of the LLC converter. For analysis, it must also be tied, and the output voltage is not rippled. Current is interrupted at the rectifier output when the mains voltage is equal to the DC voltage. Based on these statements, the waveform can be plotted (see
Figure 7).
The figure shows the three-phase voltage system (L1–L2, L2–L3, L3–L1 line voltages) and the DC voltage connected (
V0DC), as well as the SCR-firing pulses. Furthermore, angles are displayed, such as the commutation angle—which is unique for each rectifier (in this case π/3)—and the firing (α) and turn-off angles (
αoff). The thyristors must be fired three times within a period. If the firing angle is smaller, the average DC voltage and the voltage spikes will be higher. Based on these, the average values of the DC voltage and the turn-off angle are calculated using the following Equations (1)–(4). Since the voltage waveform is repeated three times per period, it is sufficient to integrate once and take three times the result. The integration can be divided into two parts. The first is where the voltage is generated by the rectifier and the second is where the voltage is constant. Equation (1) is only true if α ≥ 60°.
These calculations can be applied if the DC bus does not include energy storage. If there are capacitors on the DC bus to smooth the voltage, the average voltage rises slightly as a function of the load and the capacitance. By default, the average value of the DC voltage does not need to be changed, but it can be noticed that by adjusting the firing angle, the ratio of the current of the LLC converter and the rectifier can be adjusted. This phenomenon occurs because there is a PI (Proportional, Integral) controller in the LLC converter, and it has the minimal controlling error. With good tuning, the steady-state voltage error is commonly Verr = 5%. For example, the setpoint voltage is set 5% higher (357 V) than the desired voltage (V0DC = 340 V). If the voltage increases by means of the rectifier, the discrete PI controller in the LLC converter reduces the output voltage. If the firing angle is reduced until the voltage reaches 357 V, the LLC converter is switched off, because the error voltage at the controller input will be zero. A higher I gain value in the controller reduces the steady-state error but causes dynamic problems.
Based on Equation (3) and the previous statements, the average value of the voltage (V
AVG) is given in
Figure 8. The figure shows an example of two
V0DC voltages. It also shows the three operating states, where only the LLC converter, only the rectifier, and both are operating.
3. LLC Converter in the Universal DC Bus
The LLC converter is a highly efficient and compact resonant switching power supply widely utilized in various applications [
11,
12,
13]. It incorporates a high-frequency transformer and external inductors, which may vary depending on the specific type being used. Additionally, LLC converters can function as both boost and buck converters. While increasing the switching frequency allows for a smaller transformer size, it also results in higher switching heat loss in the semiconductors, leading to increased cooling requirements and the need for larger heat sinks [
11,
12,
13].
Resonant converters offer significant reductions in switching losses. In the case of resonant converters, the semiconductors are switched either when the voltage drop across the switching element is zero (ZVS: Zero Voltage Switching) or when the current flow is zero (ZCS: Zero Current Switching). These switching modes facilitate soft switching on the semiconductor, effectively minimizing dynamic power losses. The LLC converters employed typically operate in the ZVS mode, which is achieved only in the inductive region. It is important to avoid the ZCS switching mode, as it leads to current leading voltage, causing reverse current flow in the MOSFET before it turns off. Consequently, upon switching off, a large current would flow through the body diode, resulting in hard commutation when a MOSFET in the bridge was turned on. This scenario leads to substantial recovery losses, noise, and high current spikes, potentially causing device failure [
11,
12,
13].
For the task at hand, it is recommended to utilize the LLC full-bridge converter depicted in
Figure 9 [
12,
14]. One notable advantage of the LLC converter is its ability to adjust the switching frequency within a narrow interval to accommodate a wide range of varying loads. This feature allows for effective control even at very low loads or even without a load. Furthermore, the LLC converter offers the added benefit of low electromagnetic interference (EMI) noise due to its soft turn-off characteristics. However, it is important to note that resonant converters may not always constitute the ideal choice. They are best suited for medium-power applications, typically those up to a few tens of kilowatts. Beyond that power range, the elements of the LLC tank would become excessively large and heavy.
A constant DC voltage is supplied to the input of the LLC converter, which is then connected to a single-phase inverter (DC/AC) comprising four MOSFETs (Q1, Q2, Q3, Q4) that generate an alternating voltage with a 50% duty cycle. The output of the inverter is connected to the LLC tank, which converts the square wave voltage into sinusoidal voltage (AC/AC). The LLC tank circuit, along with the transformer, adjusts the voltage to the desired value (AC/AC). The AC voltage is then fed into a full-bridge rectifier, which converts it into a DC voltage with high ripple (AC/DC). The ripple of the DC voltage is smoothed by capacitor C
0. The load (R
0) is connected to the constant DC voltage [
12,
14].
The resonant circuit requires two magnetic components: the series resonant inductance (L
r) and the shunt-like magnetizing inductance (L
m). Additionally, the series resonant capacitance (C
r) is necessary. The implementation of L
r and L
m can be achieved using an integrated transformer [
11].
Figure 10 substitutes
Figure 9 and represents the actual parameters of the transformer, including the leakage primary and secondary inductances and the magnetizing inductance. It simplifies
Figure 9 and treats the transformer as an ideal component at the bottom of the figure. The presence of leakage inductances (L
s1, L
s2) significantly affects the operation of LLC converters. Although measuring leakage inductances can be challenging in practice, it becomes unnecessary after the network simplification. The parameter L
p can be determined by measuring the inductance on the primary winding of the transformer while the secondary side remains open. Similarly, the parameter L
r is measured for a short-circuited secondary coil [
11,
12].
The equations for the calculations have been taken from the application notes of major electronics manufacturers [
12,
13]. The characteristics and design of the LLC converter can be found in our previous papers [
14,
15].
To connect the LLC converter to the DC bus, the following criteria are required: one must use a controller that maintains a stable output voltage with a small steady-state error and oscillations. Furthermore, in the case of DC bus voltage disturbances (sudden load, power outage, etc.), the controller compensates for large voltage fluctuations dynamically. Therefore, the PFM frequency (fs) needs to be dynamically adjusted as a function of the output voltage. The fundamental harmonic of the output ripple voltage is twice the current operating frequency of the LLC converter. For this reason, it produces a much smoother voltage than the rectifier.
4. Simulations of Transients and Disturbances in Off-Grid Inverters with Uninterruptible Motor Drives
The stability of the DC bus voltage is a key issue in uninterruptible motor drives, as oscillations in the DC voltage are reflected in the output voltages of the inverters. These DC bus oscillations cause flickers at the output and increase the harmonic content to a greater extent. Large oscillations of the DC bus voltage are also not allowed because the voltage at the output of the inverter goes beyond the standard range. The main purpose of the simulation is to examine the DC bus voltage under different disturbances and transients. Examples of such disturbances include a machine suddenly loading the motor shaft, switching on a load connected to the single-phase inverter, changing the firing angle of the rectifier, and power outage. In the simulation, the uninterruptible solar induction motor drive with a single-phase inverter is a system where the LLC converter is powered only by a battery (see
Figure 9). The LLC converter can be operated purely from a solar panel (see
Figure 5) or from a solar panel and battery at the same time, but in the latter case, an MPPT controller will be required. Solar panels and MPPT controllers are not included in the simulations as they do not affect the results. This is because the DC voltage at the input of the LLC converter is constant due to the batteries, and no harmful transients are generated. The simulation was done in MATLAB (Simulink). The layout was the same as in
Figure 5, but the LLC converter was powered by a battery instead of a solar panel.
Figure 11 describes the results of the simulation.
Initially, the simulation started with the DC bus voltage smoothing capacitor charged to 330 V, which greatly shortened the simulation time. The firing angle started at 142.5 degrees, and so, initially, the LLC converter fed the loads. At first, the induction motor was only loaded with minimal friction and ventilation torque, and so its power was minimal.
After the motor reached a constant speed, a dynamic load occurred on its shaft, and so, its power consumption also increased. This can be seen in the figure at the first point. Power consumption did not occur immediately because the speed did not decrease immediately due to the moment of inertia. The sudden increase in torque did not cause any changes on the DC bus because the LLC converter controller compensated for it properly.
The second disturbance occurred at the input of the LLC converter, where the input voltage dropped to 34 V. This change resulted in a minimal DC bus voltage drop.
After the motor speed stabilized, the firing angle of the rectifier decreased (point 3), and so, the proportion of green energy became smaller. The ratio of currents measured at the output of the LLC converter and the output of the rectifier is called green energy; 100% green energy means that only the LLC converter feeds the DC bus. The energy is green when the solar panel is applied at the LLC converter input. A sudden change in the firing angle is not advisable because the controller of the LLC converter cannot immediately compensate, and so, the DC voltage deviates slightly from the set point. The changed voltage at the input of the LLC converter also resulted in the same results as in point 4.
The load on the motor dropped suddenly in point 5, similar to point 1, but it did not greatly disturb the magnitude of the DC bus voltage. The biggest transient was caused by large changes in the firing angle, as in points 6 and 7. Point 7 simulated a power outage. It can be seen from the motor speed that it had not changed.
Based on the simulation results, it can be concluded that the biggest disturbance was caused by the power outage, since a breakdown (of approx. 4.8 V) occurred in the DC bus voltage. This size of voltage drop was not causing any problems, as the AC voltage was within the standard value.
5. Implemented System Elements for Experimental Verifications
The paper further demonstrates, by using measurements, that the combination of the LLC converter and rectifier does not cause harmful transients or disturbances in the DC bus voltage and the supply to loads with different operating states. The study also measured how the loads affect the DC bus voltage and what magnitude of transients they cause. The VACRMS, its flicker, and THD at the output of the single-phase inverter are the key parameters. At the output of the three-phase inverter, the fluctuation of the speed of the motor was also measured when a power outage occurred and the loads changed dynamically. Additionally, the changing of the DC bus voltage and the output parameters of the single-phase inverter, and the motor’s parameters, have been shown. Firstly, the article below describes the system components used for the measurements and the experimental setup.
5.1. LLC Converter
The implemented LLC converter is shown in
Figure 12. The single-phase inverter MOSFETs (1), power supply (2), microcontroller (3), transformer with external inductors (4), full-bridge rectifier (5), LLC tank capacitors (6), voltage measurement circuits (7), and MOSFET’s gate driver with fault detection (8) can be found on the printed circuit board [
15].
The input parameters of the LLC converter and the parameters obtained from the calculations are shown in
Table 1. The finished converter is based on the results obtained. The converter was built for research purposes and has a rated output power of 400 W at 88.2% efficiency. The converter input voltage range is designed for three 12 V lead-acid batteries connected in series. Moreover, the input of the converter can connect directly to a solar panel without a battery or MPPT controller. A much more powerful converter can be built, but this one is sufficient for measurement purposes. The converter can also produce up to 350 V
DC at rated power and can be overloaded for short periods due to its large heat sink. The microcontroller’s built-in 12-bit analog-to-digital converter is not sufficient for the tasks required, and so an external 16-bit ADS1115 ADC is used.
5.2. SPWM One-Phase Inverter
The SPWM inverter, also made for research purposes, is shown in
Figure 13. The inverter is composed of four NTHL020N090SC1 SiC MOSFETs (1) for lower power dissipation. The MOSFETs are controlled by an intelligent driver circuit (2). The SPWM signal is generated by a DSC (Digital Signal Controller) (3). The program code developed for the DSC was written in the MATLAB development environment. The DSC sets the output voltage of the inverter as a function of the inverter input voltage. The DC voltage is measured by using an LV25-P voltage transducer (4). In addition, a trimmer potentiometer (5) is used to adjust the output voltage (V
ACRMS). The output voltage of the inverter is smoothed by an LC low-pass filter (6). The saturation current of the inductor (6 A
peak) limits the output power of the inverter, which is 950 VA. Overload protection has been built in. Using a current transducer (7) (CKRS 6-NP), the DSC turns off the MOSFETs as soon as the output exceeds the rated current. The inverter input is designed for a DC voltage range of 330–420 V. The inverter receives the auxiliary power for the control circuit from the lead acid batteries. The auxiliary voltage is galvanically isolated from the DC bus voltage.
5.3. Variable Voltage Frequency Drive (Rectifier and Three-Phase Inverter)
The rectifier and the three-phase inverter are built as a single unit (see
Figure 14), and so, together, they form a variable voltage–frequency drive. The rectifier is of thyristor semi-controlled design and th firing angle can be adjusted by a potentiometer. The input of the rectifier is connected to 3 × 400 V and the output is to the three-phase inverter that drives the motor. The inverter uses a V/f control algorithm, also with SPWM. The potentiometers are used to set the first-order frequency of the motor (f
1), the ramp slope of f
1, the switching frequency (f
sw) of the SPWM, and the value of the initial voltage for the minimum frequency f
1. The inverter consists of three 1200 V, 100 A IGBT modules.
5.4. Data Acquisition System and Loads
The measurement data acquisition system and loads with the controller are shown in
Figure 15.
The inverter drives a three-phase induction motor with a mechanical power of 270 W. The induction motor is loaded by a servo motor (1). The torque and speed of the servo motor are adjustable with the controller (2). The torque and speed are measured by the controller (Lucas Nülle SE2662-3S instrument); it has two analog voltage outputs (1 V/1 Nm, 1 V/1000 RPM). The output of the single-phase inverter has a heat gun as load (3), which can be controlled by an autotransformer so that the load can be adjusted dynamically (4). The measurement data acquisition system measures voltages, currents, and the quantities derived from them. The measurement is based on a National Instruments PXI computer with a PXI-6052E with 16 analog inputs and a 16-bit vertical resolution measurement card (5). This allows the measurement to be processed quickly and several parameters to be measured simultaneously and evaluated later. The voltages were measured with differential test probes (Testec TT-SI-9001) and the current with a high-frequency current clamp (Fluke i30s). The measurement results could be exported from the LabView software as images and Excel data so that the measurement results could be easily evaluated. Different single and continuous measurements were taken, and the measurement results are shown in the next chapter.
6. Experimental Measurements
Firstly, the measurements focus on the SPWM single-phase inverter only. The voltage THD measured at the output of the inverter must be within the standard value. Therefore, the first measurement tests the output voltage at the rated load of the inverter.
Figure 16 shows the output voltage in time and the corresponding FFT (see
Figure 17). The sampling frequency was 50 kHz, and so all harmonics up to 25 kHz were measured. At the time of measurement, the LLC converter and the rectifier fed the inverter simultaneously. The THD was 1.926% at 219.25 V
AC. The first order voltage was 310 V, of which 0.5% (this is the most stringent value due to the standard) was 15.5 V. It can be seen that none of the harmonics exceeded this voltage. The measurement results were not affected by whether the induction motor was running or not. It is worth mentioning that the autotransformer connected to the inverter produced many harmonics. The unloaded voltage of the inverter had a THD of 0.71%. It is also worth mentioning the load current (
Figure 18). The current of the heat gun was 2.93 A, giving a THD of 2.57%.
Reducing the firing angle of the rectifier results in an increase in the DC bus voltage (see Equation (1)). The filter capacitor smooths the voltage at the output of the rectifier. If we consider
Figure 7, we conclude that the DC voltage ripple increases when the firing angle decreases even though there is a capacitor. The increased voltage ripple increases the THD. The measurements confirm this statement.
Figure 19 illustrates the THD of the output voltage as a function of the average voltage of the DC bus. The load was not changed during the measurement with the autotransformer. The output voltage was 221.3 V and the heat gun’s current was 3.01 A at the measurement.
Changing the DC bus voltage affects the AC output voltage. To avoid this, the inverter measures the DC voltage and dynamically adjusts the modulation index in the SPWM. The modulation index varies according to a predefined curve as a function of the DC voltage, thus compensating for non-linearity voltage changes. The following measurement illustrates (see
Figure 20) how the RMS value of the AC voltage varies as a function of the average value of the DC bus voltage when the load is constant during the measurement. The diagram shows two measurements; the voltage was set to 220 and 230 V using the trimmer potentiometer. The measurement results show that there are negligibly few flickers in the output voltage when the DC voltage is changed if V
DC exceed the minimum voltage.
From the simulation results, it can be seen that the largest fluctuations in the DC bus voltage were caused by the power outage. Fluctuation was generated when the rectifier is turned on, and the LLC converter is only a small part of the load supply. During a power outage, the DC bus voltage starts to drop because the rectifier no longer increases above the LLC converter’s setpoint voltage. If power outage occurs, the DC voltage will decrease until the LLC converter takes over the powering of the DC bus completely. The LLC converter’s controller contains an integrator and is tuned to be dynamic; thus, a small amount of over-controlling also occurs. The power outage is detected by the PI controller in the LLC converter.
Figure 21 shows the power outage and the load turn-off measurement. In the upper left corner, the DC bus voltage is shown. Below, the speed of the induction motor can be seen; this motor was loaded with a constant 1 Nm torque. On the right is the single-phase load RMS current and above it is the input current of the LLC converter (battery current).
At the first point (1), the mains voltage is dropped, thus reducing the DC voltage. Meanwhile, the LLC converter dynamically turns on and feeds the DC bus, creating a 19 A current peak. At this point, the motor speed has not changed, and the single-phase load continues to operate smoothly. At the second point (2), the single-phase load is switched off, and so the DC voltage has increased minimally, and the motor continues to run at a fixed speed. Finally (3), the load on the motor is reduced to zero, and so it continues to run at idle, increasing its speed and slightly increasing the DC bus voltage. If the power outage is ended, the inverse of the processes shown in the figure occurs. This means that the voltage rises back to 346 V and the current of the LLC converter drops. It can be observed that between the rated load and idle of the LLC converter, the DC bus voltage fluctuates by 4.1 V. This steady-state error value can be reduced by increasing the dynamic range of the controller (I gain), but voltage overshoots are increased. Overall, the LLC converter dynamically turns on when the power is interrupted. Furthermore, the DC voltage fluctuations created by load variations do not cause harmful transients in the voltages and currents of the loads. The LLC converter keeps the DC bus voltage steady state thanks to the 16-bit ADC.
As shown in
Figure 20, the output voltage of the single-phase inverter did not change when the input voltage was varied. However, the voltage across the LC filter and MOSFETs at the output of the single-phase inverter drops as a function of current. Therefore, as the load current is increased, the output AC voltage decreases minimally. The measurement shown in
Figure 22 describes the changes in the DC bus and inverter output voltage as the load current is varied. At the time of the measurement, the autotransformer was adjusted, and so, the current of the heat gun changed. It can be seen that the output voltage varies in proportion to the current. Furthermore, the DC bus voltage also varies proportionally with the magnitude of the load. The decrease in the DC bus voltage is due to the steady-state error of the PI controller. The voltage fluctuations are within the standard limits both at the rated load and at no load of the inverter.
It was shown in
Figure 8 that three operating states can be created as a function of the rectifier firing angle. The first operating state is when only the rectifier feeds the DC bus. As the firing angle increases, and therefore the DC voltage decreases, the LLC converter feeds the DC bus at an increasing rate (operating state 2). As the firing angle increases further, only the LLC converter feeds the DC bus (operating state 3). The hypothesis and the simulation results are proven by the following measurement (
Figure 23). At the beginning of the measurement, only the rectifier feeds the DC bus, and then gradually, the LLC converter takes over the supply. Finally, only the LLC converter feeds the DC bus. At the time of measurement, the V
0DC was set to 340V. When the LLC converter takes over the full load, minimal transients occur in the single-phase load power. The LLC converter starts switching on at 1.5 s, at which point the DC bus voltage is 348 V. It can also be observed that when the rectifier is operating, the DC voltage ripple is higher (due to the voltage being thicker in the figure). The DC bus voltage is shown at the bottom of the figure for rectifier operation (0–0.08 s) and LLC converter operation (4.6–4.64 s) only. The DC bus voltage fed from the LLC converter has a voltage ripple of about 40% compared to that fed from the rectifier. In the bottom-right corner of the figure, it can be observed that a voltage ripple appears at a frequency of 100 Hz (twice 50 Hz). This is due to the operation of the single-phase inverter. When the rectifier is operating, there are minimal asymmetrical voltage peaks in the DC bus voltage. These exist due to the asymmetrical firing of the thyristor, but they do not cause any disturbance.
7. Conclusions and Future Work
Overall, the combination of the uninterruptible motor drive and the single-phase inverter was a success. The measurement results demonstrate that both the motor and the single-phase loads are supplied in compliance with the standard at power outage. The results obtained from the simulations reflected that the main disturbance is caused by the power outage. This can be confirmed by the measurement results. It can also be seen that a common battery can power the UMD and UPS. The operation of the single-phase inverter and the load it feeds has minimal effect on the DC bus voltage and hence on the motor torque. Solar panels can be integrated into the uninterruptible system for battery charging because the LLC converter produces a stable output voltage when the input oscillates minimally. With the solar panels, the battery can be charged by an MPPT controller, and the minimum battery voltage fluctuations generated by the MPPT controller are negligible; therefore, no measured results have been presented in this manuscript. The batteries can, of course, also be charged using a mains charger, and not just by solar panels.
The most critical elements in the system are the control loops. Their tuning determines the static and dynamic errors in the DC bus voltage. In this study, the control loop of the LLC converter used the PI algorithm. The steady-state and dynamic error of the DC bus can be reduced by using more complex algorithms and circuit elements. However, this raises economic issues as the errors are within the allowed limits. Future research will focus on the possibility of adding a feedforward control to the control loop of the LLC converter. This requires the integration of a current transducer into the output of the circuit and the manipulation of the PI controller’s actual values as a function of the current. Previous research has been done on fuzzy-logic controllers that controlled the P, I gain, and the PFM frequency of LLC converters. It did not lead to positive results, and so, a dynamically tuned PI controller algorithm was run on the microcontroller in this study. In the future, by implementing different algorithms, minimum control errors can be achieved to ensure maximum voltage supply quality. We consider the control of the single-phase inverter not only based on the DC bus voltage but also considering the distortion of the output current and voltage waveforms. In this way, the THD can be further reduced, and the magnitude of the output voltage will not depend on the current load.
The best operating condition of the system occurs when only the LLC converter is operating, as the DC voltage is smoother than when the rectifier is operating. For this reason, it is worth considering installing systems in the future where the rectifier is switched off when there is sufficient irradiation. In this case, the solar panels will supply both the batteries and the loads. At night, only the LLC converter supplies electricity to loads from the batteries only. Such systems can be achieved at low and medium power levels as the LLC converter and all other DC/DC converters are limited by thermal dissipation.
The most inefficient power electronic converter in the system is the LLC converter, which produces 88.4% [
15]. The rectifier and inverter produce minimal heat and the LLC converter produces slightly more at full load, while the input voltage is minimal (25 V). In this research, we did not aim for maximum efficiency because we built a cost-effective test facility for experimental purposes. Nevertheless, it can be said that even the test equipment works with good efficiency and stability, proving that the combination of the two systems (UMD and UPS) works correctly.


