Real-Time Carbon Emissions Monitoring of High-Energy-Consumption Enterprises in Guangxi Based on Electricity Big Data
Abstract
1. Introduction
1.1. The Challenge and Importance of Improving CO2 Monitoring Resolution
1.2. Literature Review on CO2 Monitoring Methods
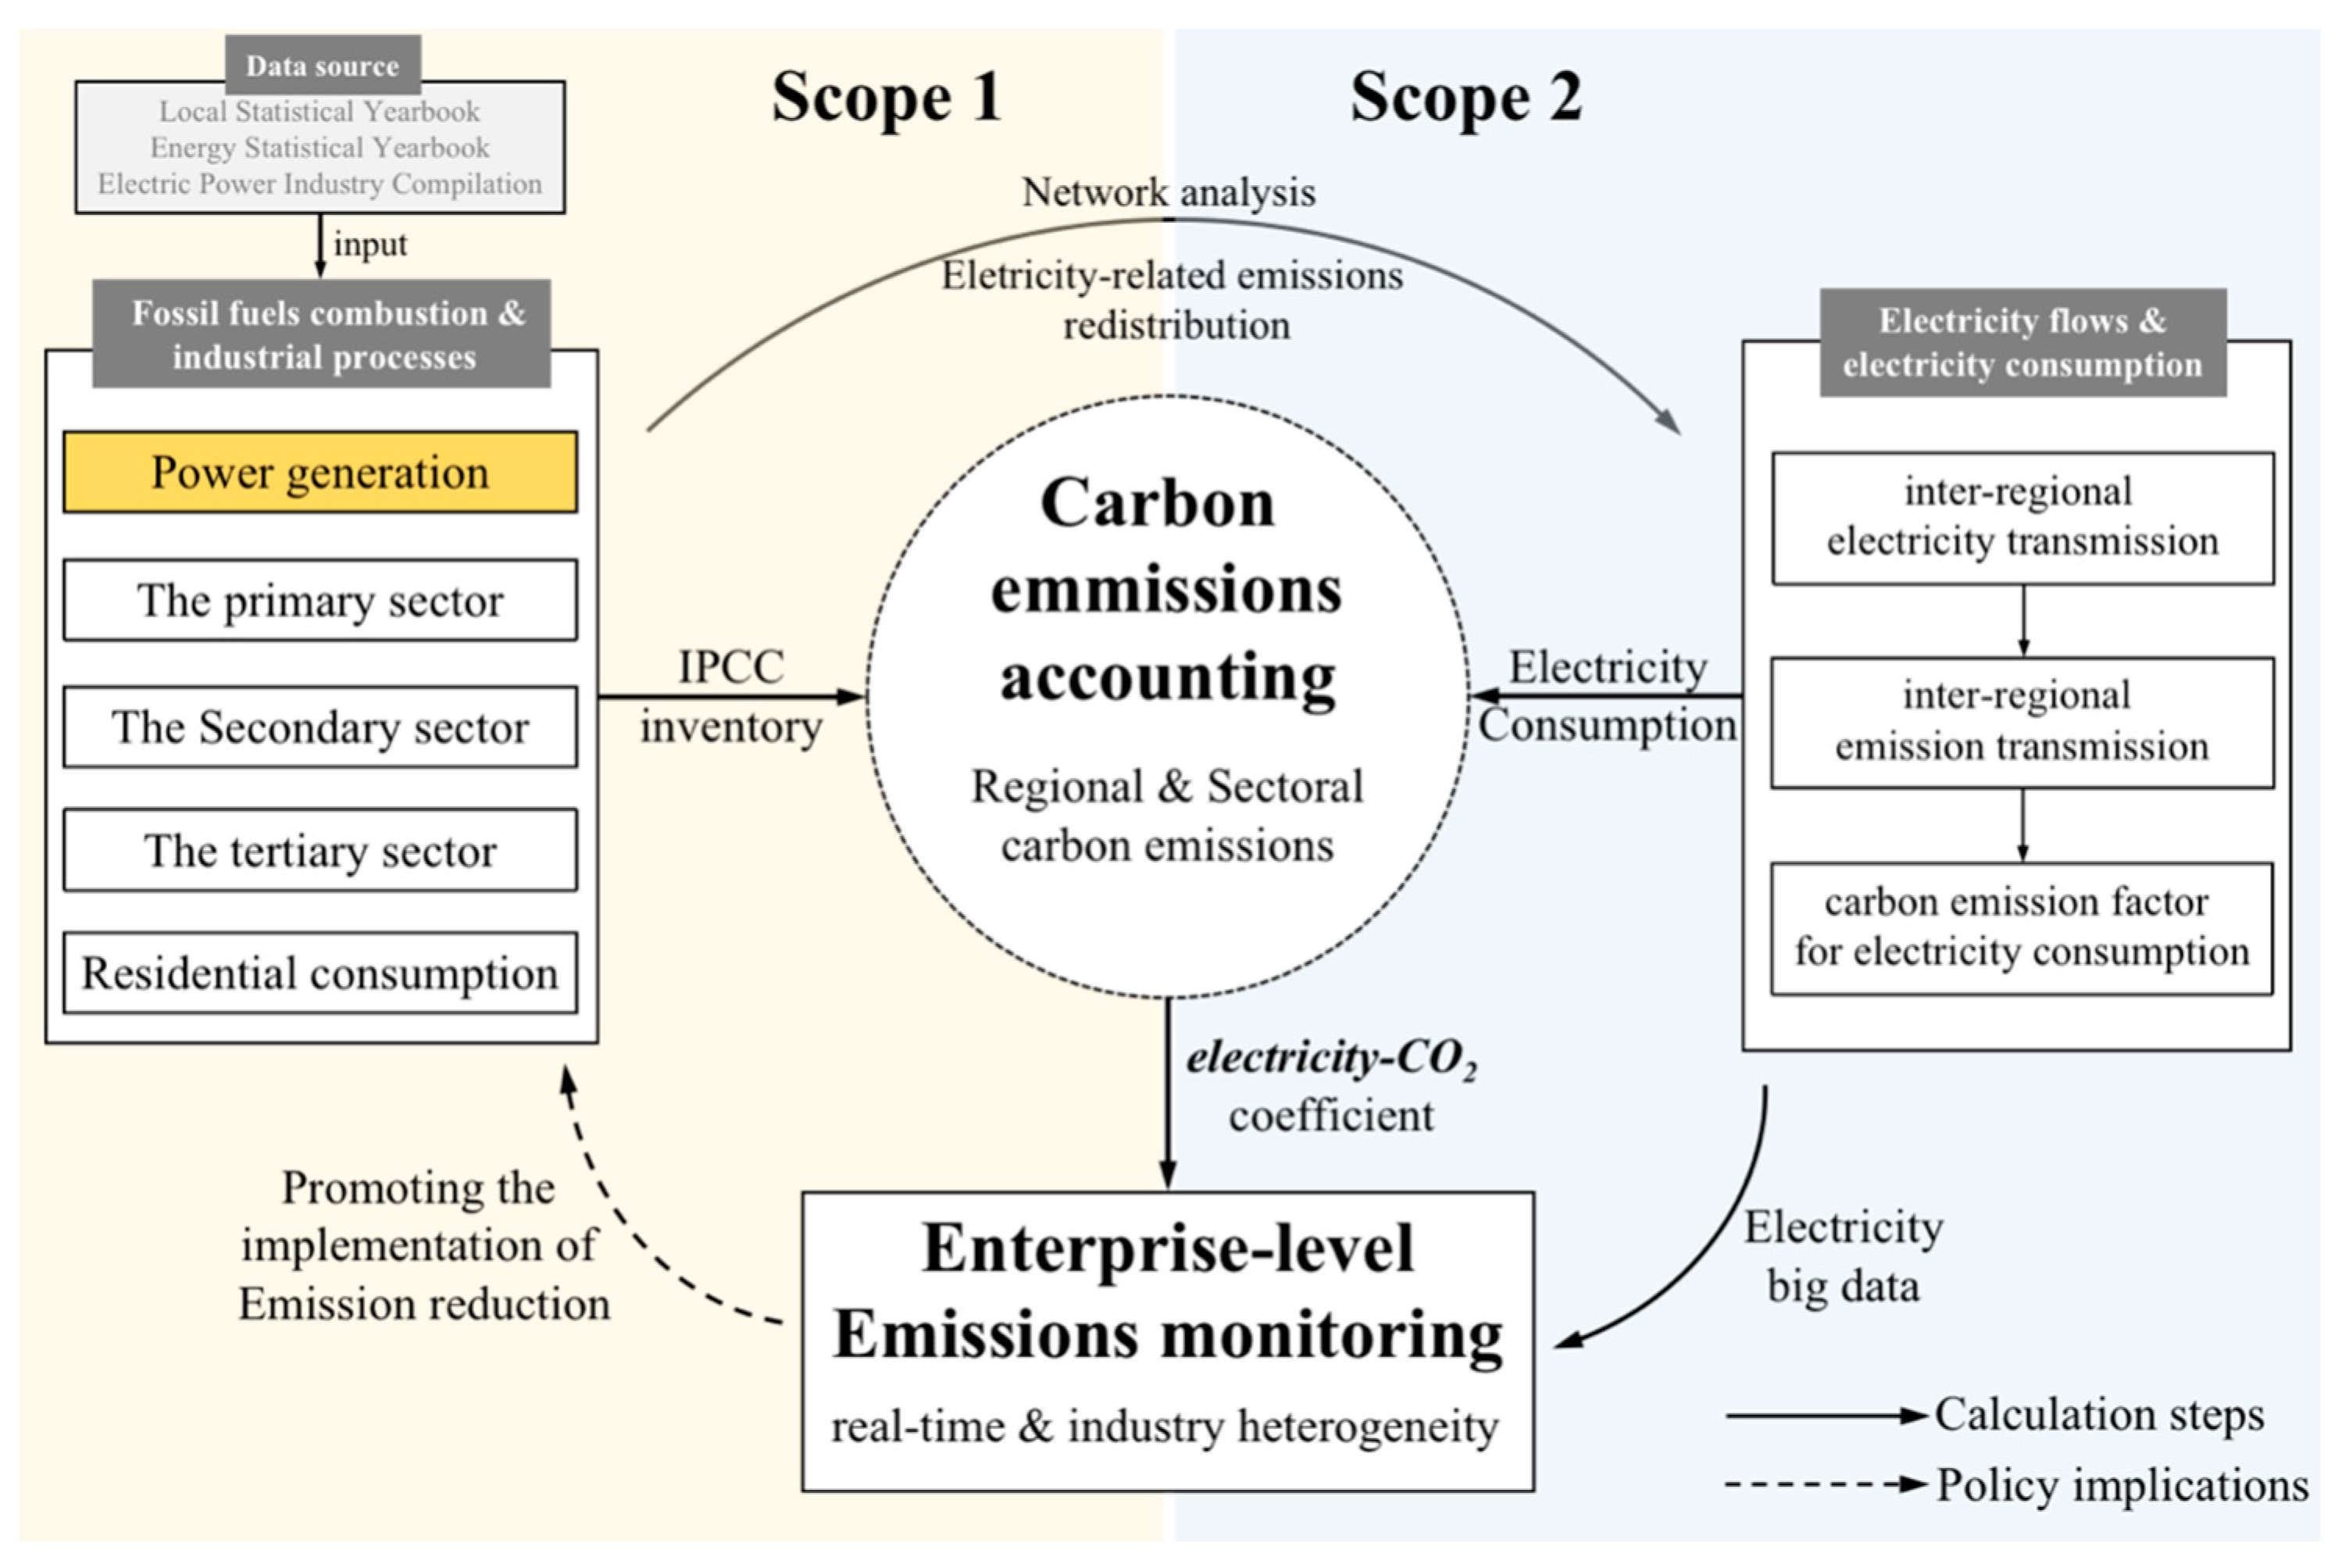
- Expanding the existing carbon accounting methods to real-time carbon emissions monitoring and extending the accuracy of emissions monitoring to the enterprise level. Existing methods such as network analysis and input–output method realize carbon emission accounting under the shared responsibility principle at the regional/industry level. Following similar ideas, by introducing carbon emission factors for electricity consumption reflecting regional heterogeneity, this study will expand from the emission accounting system considering regional purchasing electricity to the real-time carbon emissions monitoring at the industry/enterprise level, reflecting the shared responsibility principle for carbon emissions.
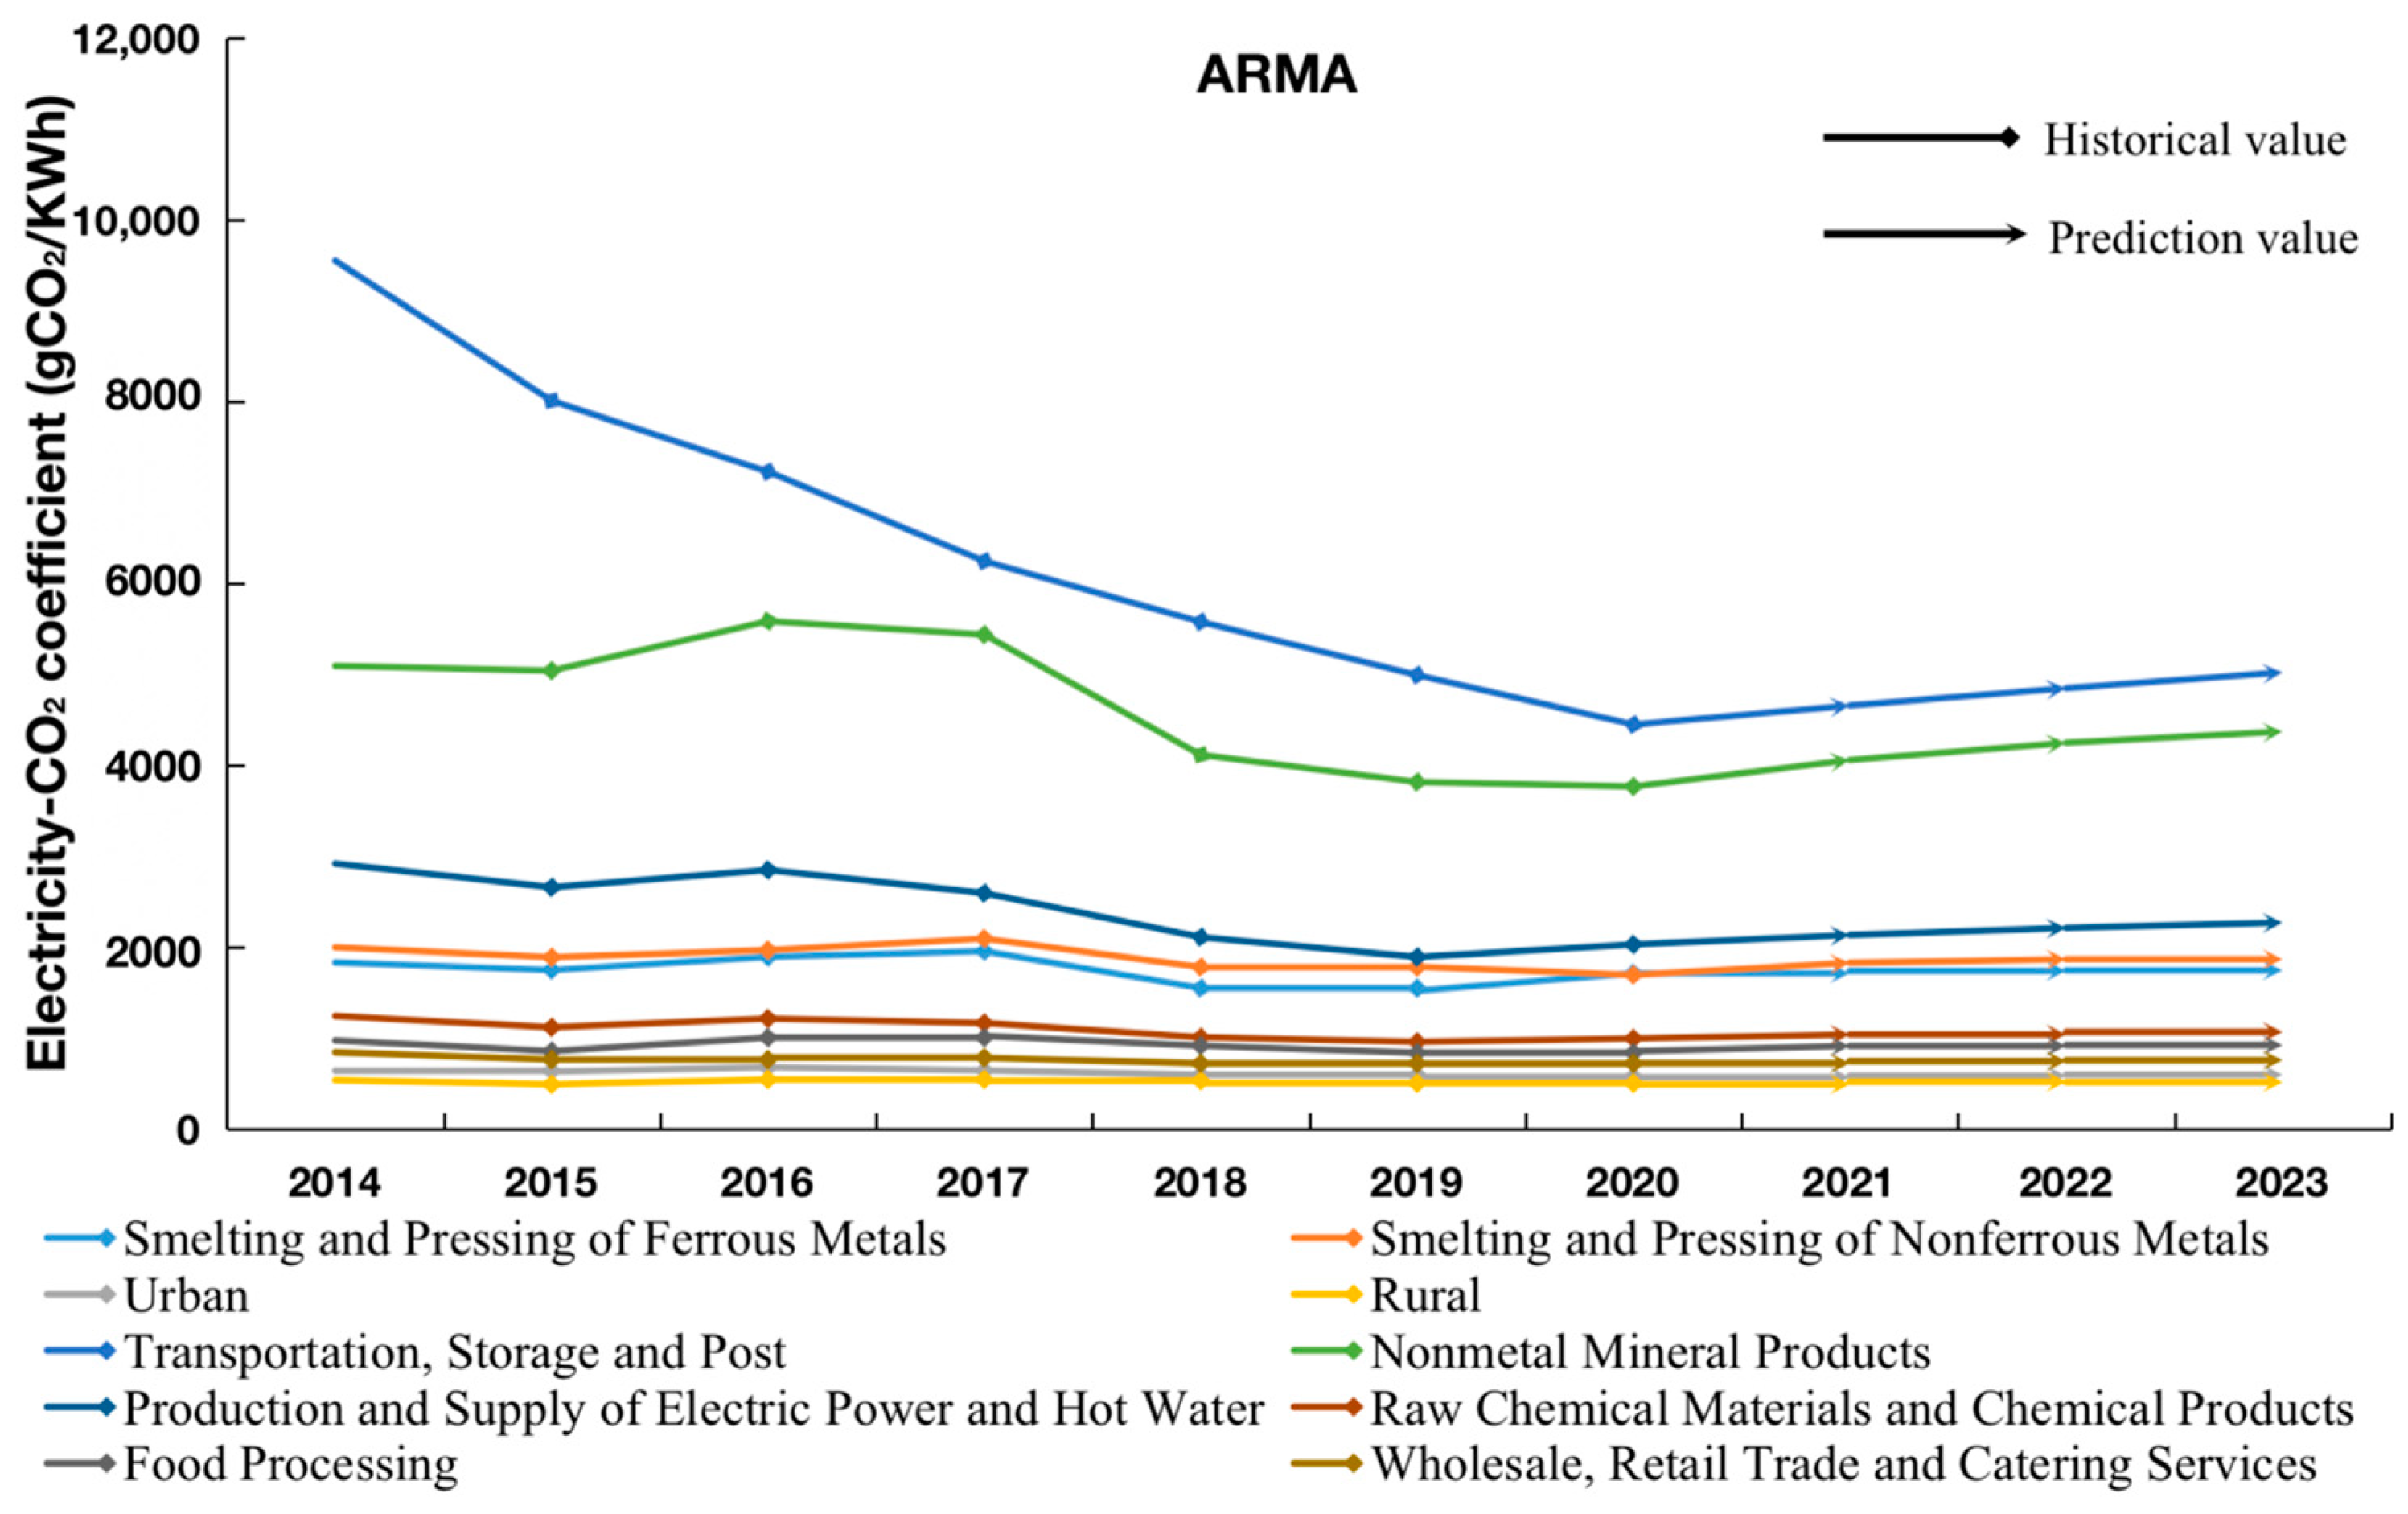
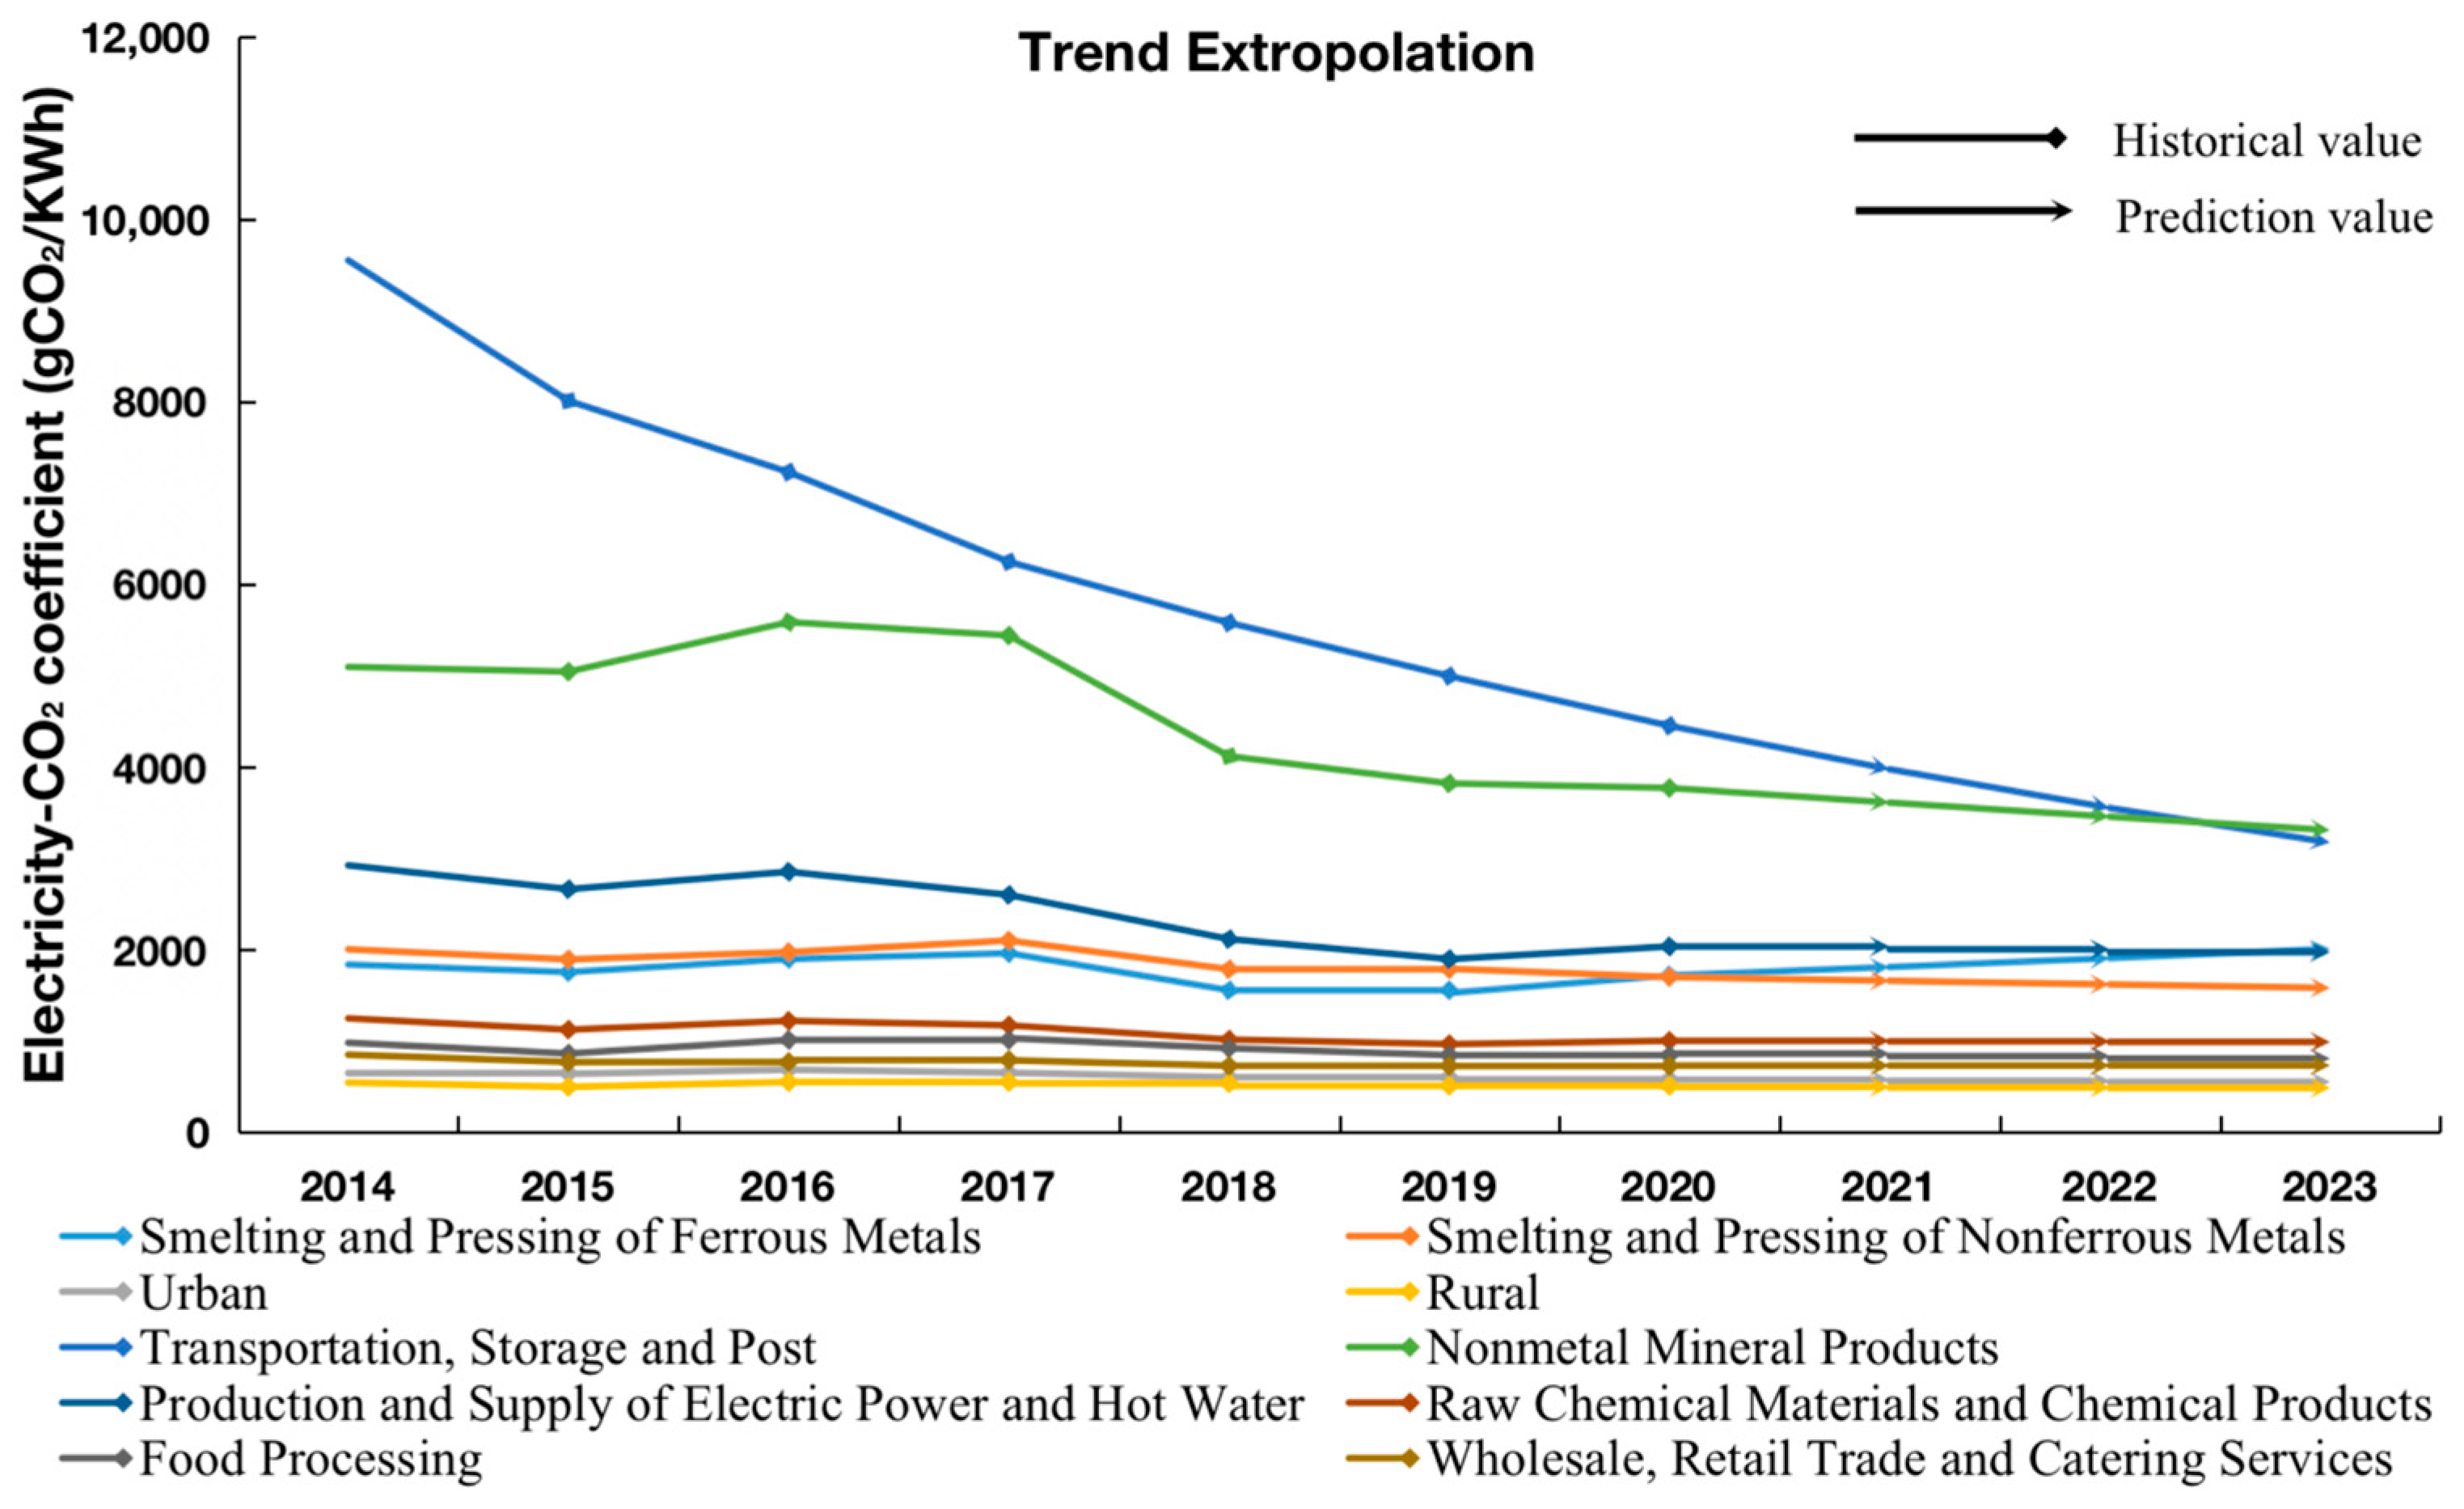
- Based on the correlation mechanism between electricity consumption and carbon emission historical data of different industries, the electricity–CO2 coefficient is measured. Specifically, we use the time-series method to establish the prediction method of the short-term electricity–CO2 coefficient of different industries, combine the high-frequency electricity big data, and finally form an objective, fine, and real-time monitoring method of enterprise carbon emissions.
- Achieving the multiple goals of carbon emissions monitoring in terms of promotion and application of low-cost, high-operability, low-time granularity, high industry coverage and precise positioning of carbon emissions to enterprises. Traditional point-source carbon emissions monitoring methods mainly include chemical detection, spectral analysis, and satellite carbon monitoring, which are not only costly but also impossible to promote on a large scale. This study fully exploits the existing power data resources of power grid enterprises and builds a carbon emissions monitoring method for enterprises with the distinctive features of objective, fine, and real-time electricity data, which downscales the traditional carbon emission data from the annual to hourly level.
2. Methods for Enterprise CO2 Emissions Monitoring Using Electricity Big Data
2.1. The Electricity–CO2 Coefficient Covering Direct and Indirect Emissions
2.2. Methods for Measuring Direct Carbon Emissions
2.3. Methods for Measuring Indirect Carbon Emissions
3. Results and Discussion
3.1. Total Carbon Emissions of Different Industries in Guangxi
3.2. Electricity–CO2 Coefficient by Sector in Guangxi
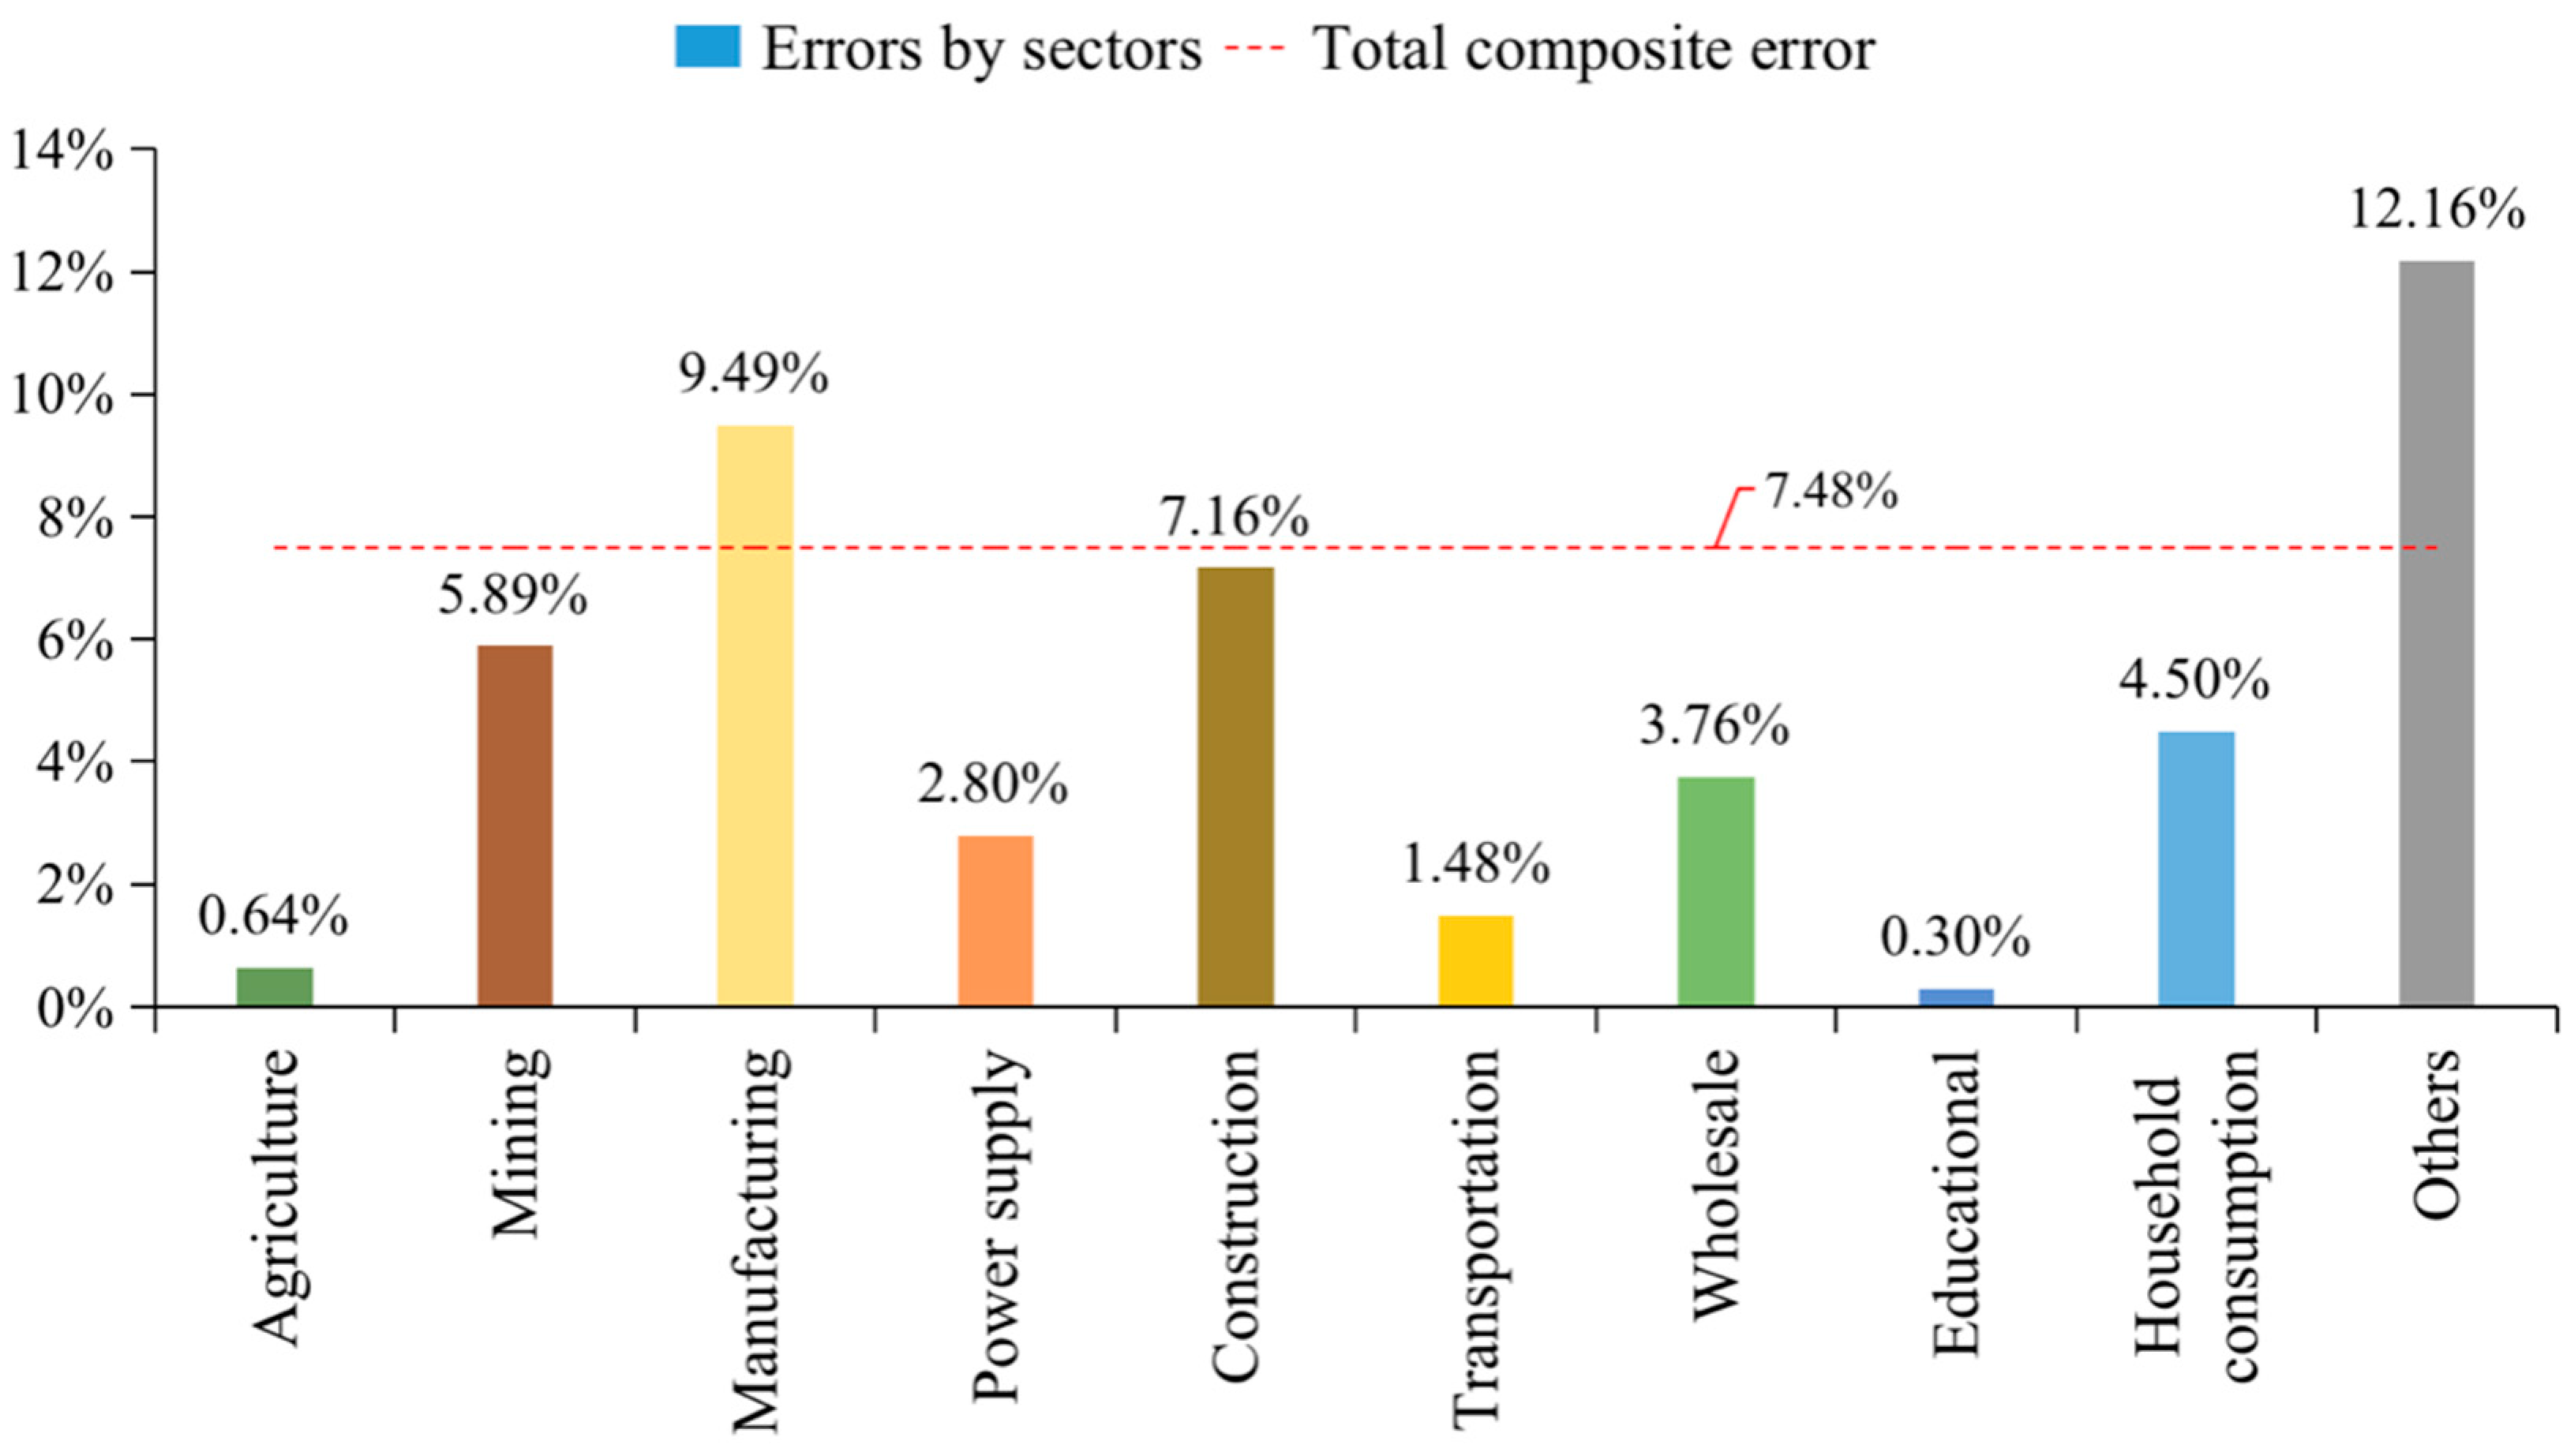
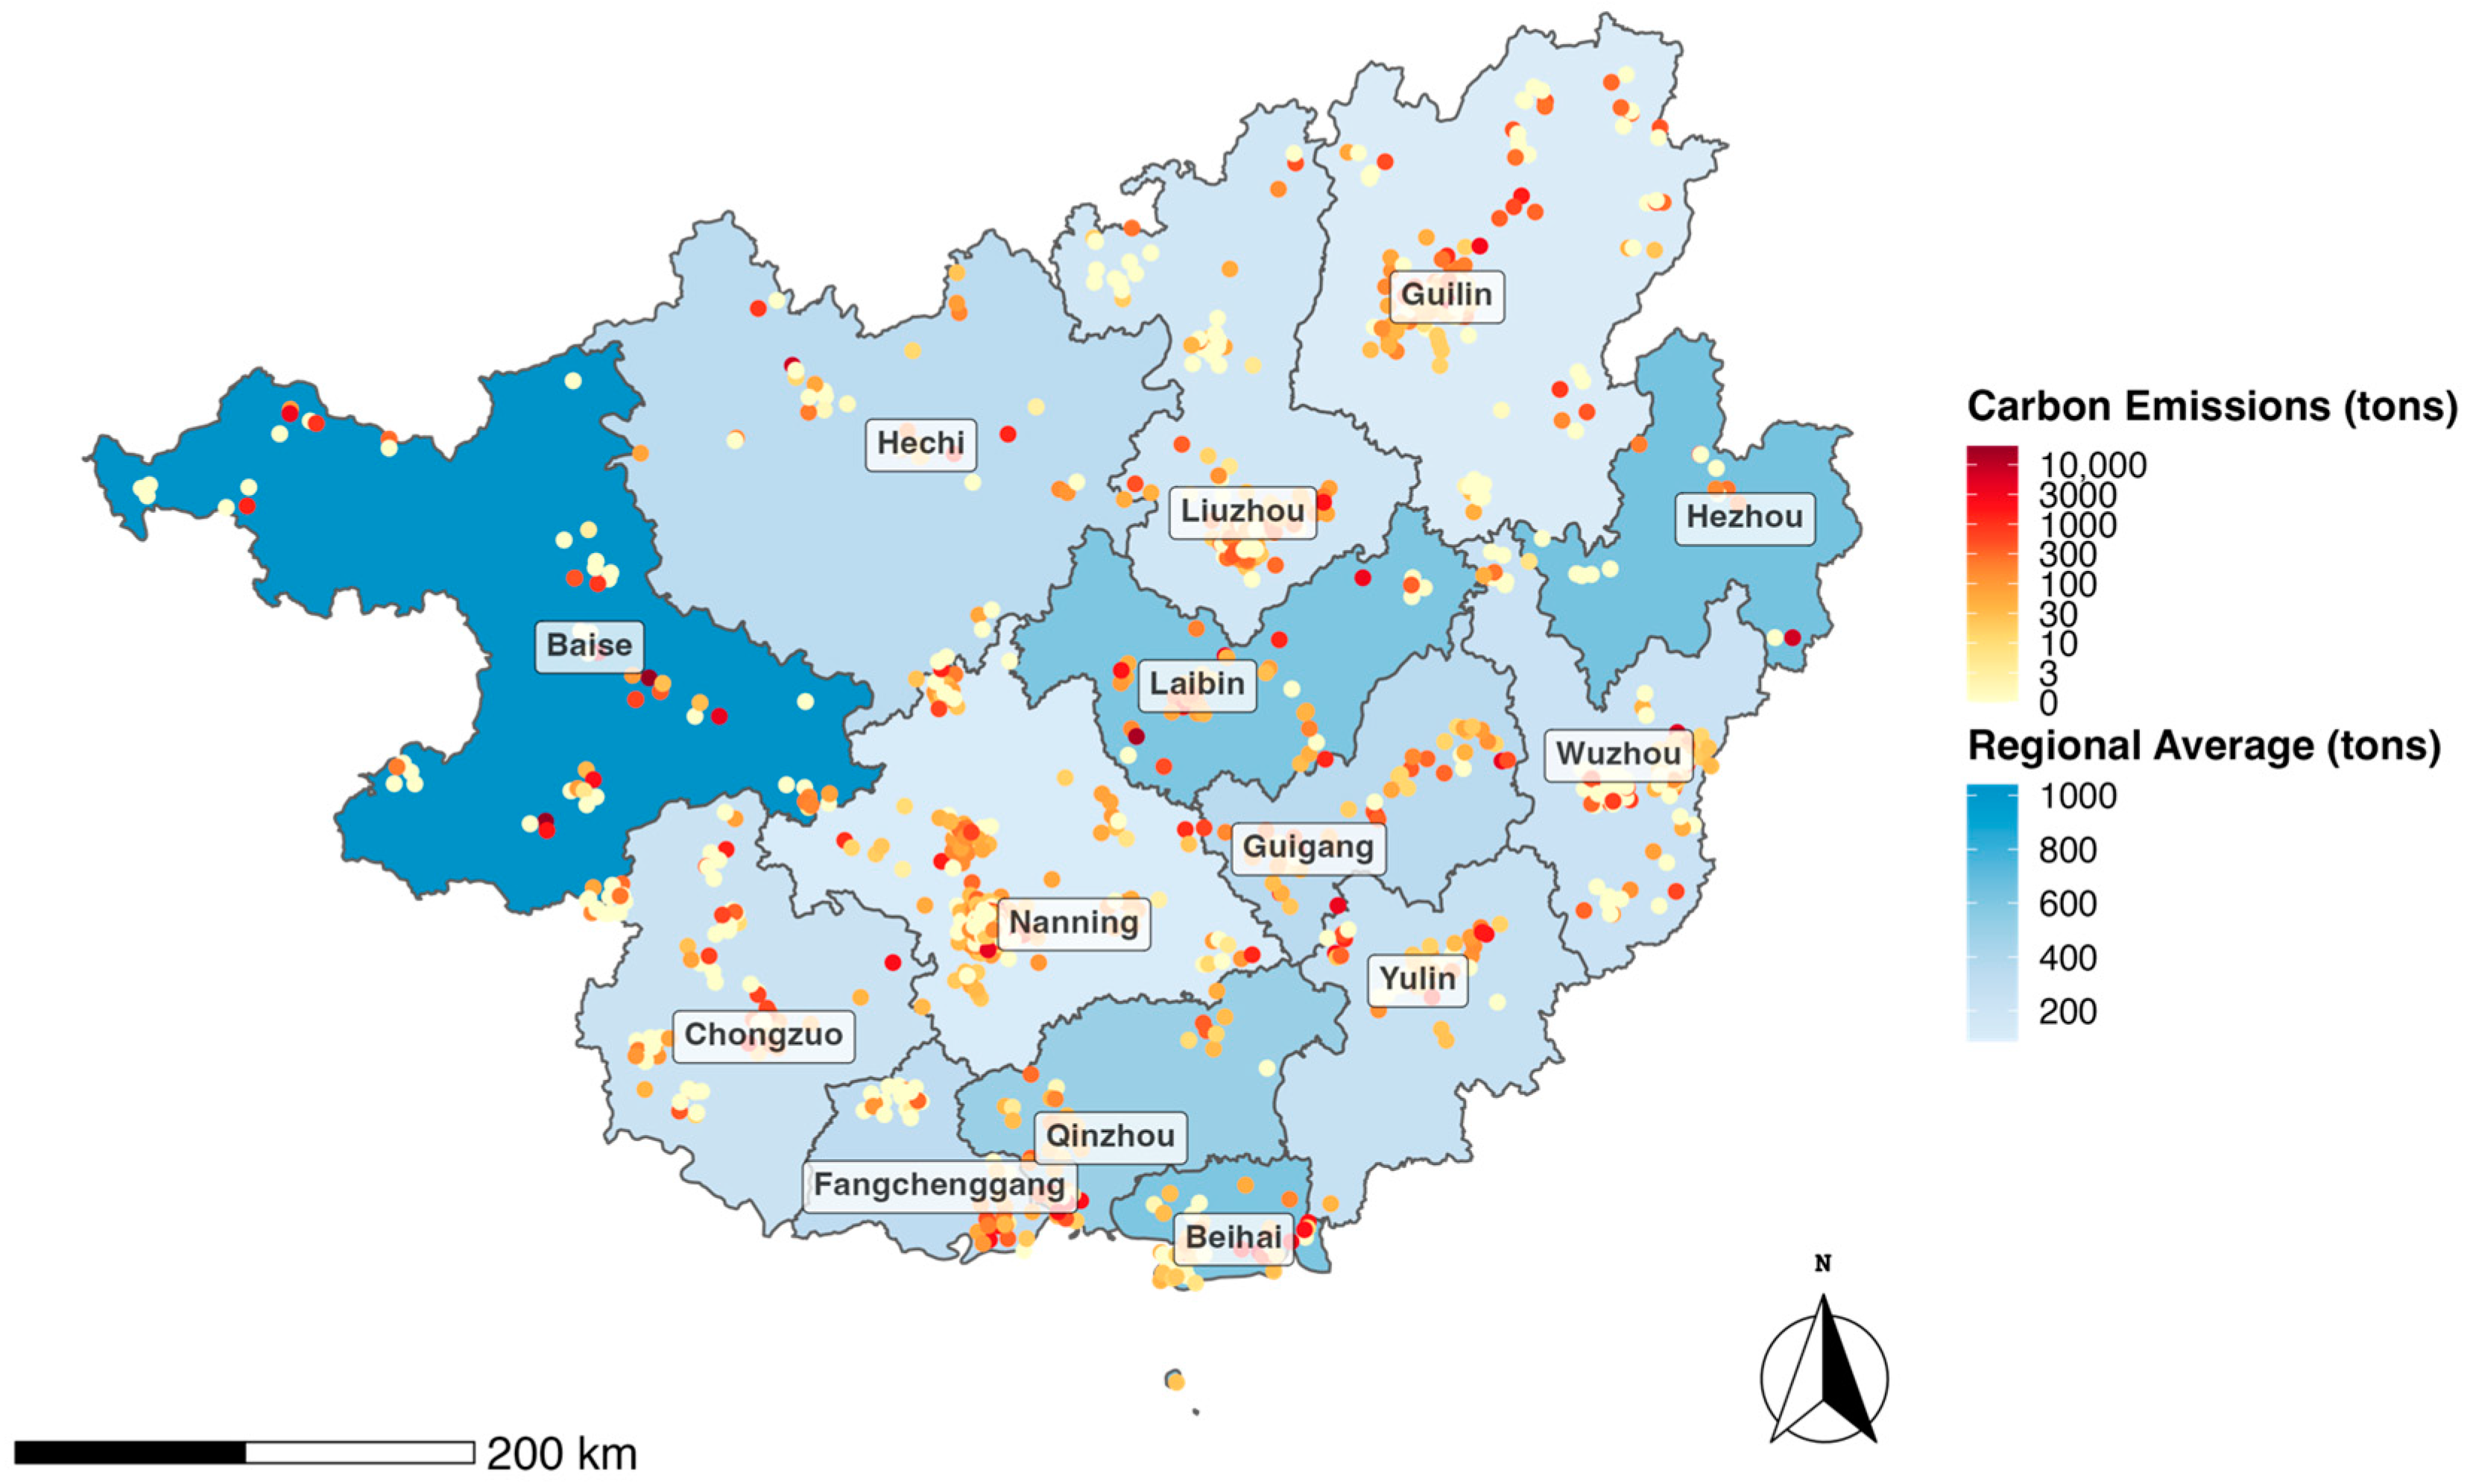
3.3. Carbon Emissions Monitoring of Guangxi Enterprises Based on Electricity Big Data
4. Conclusions and Implications
4.1. Conclusions
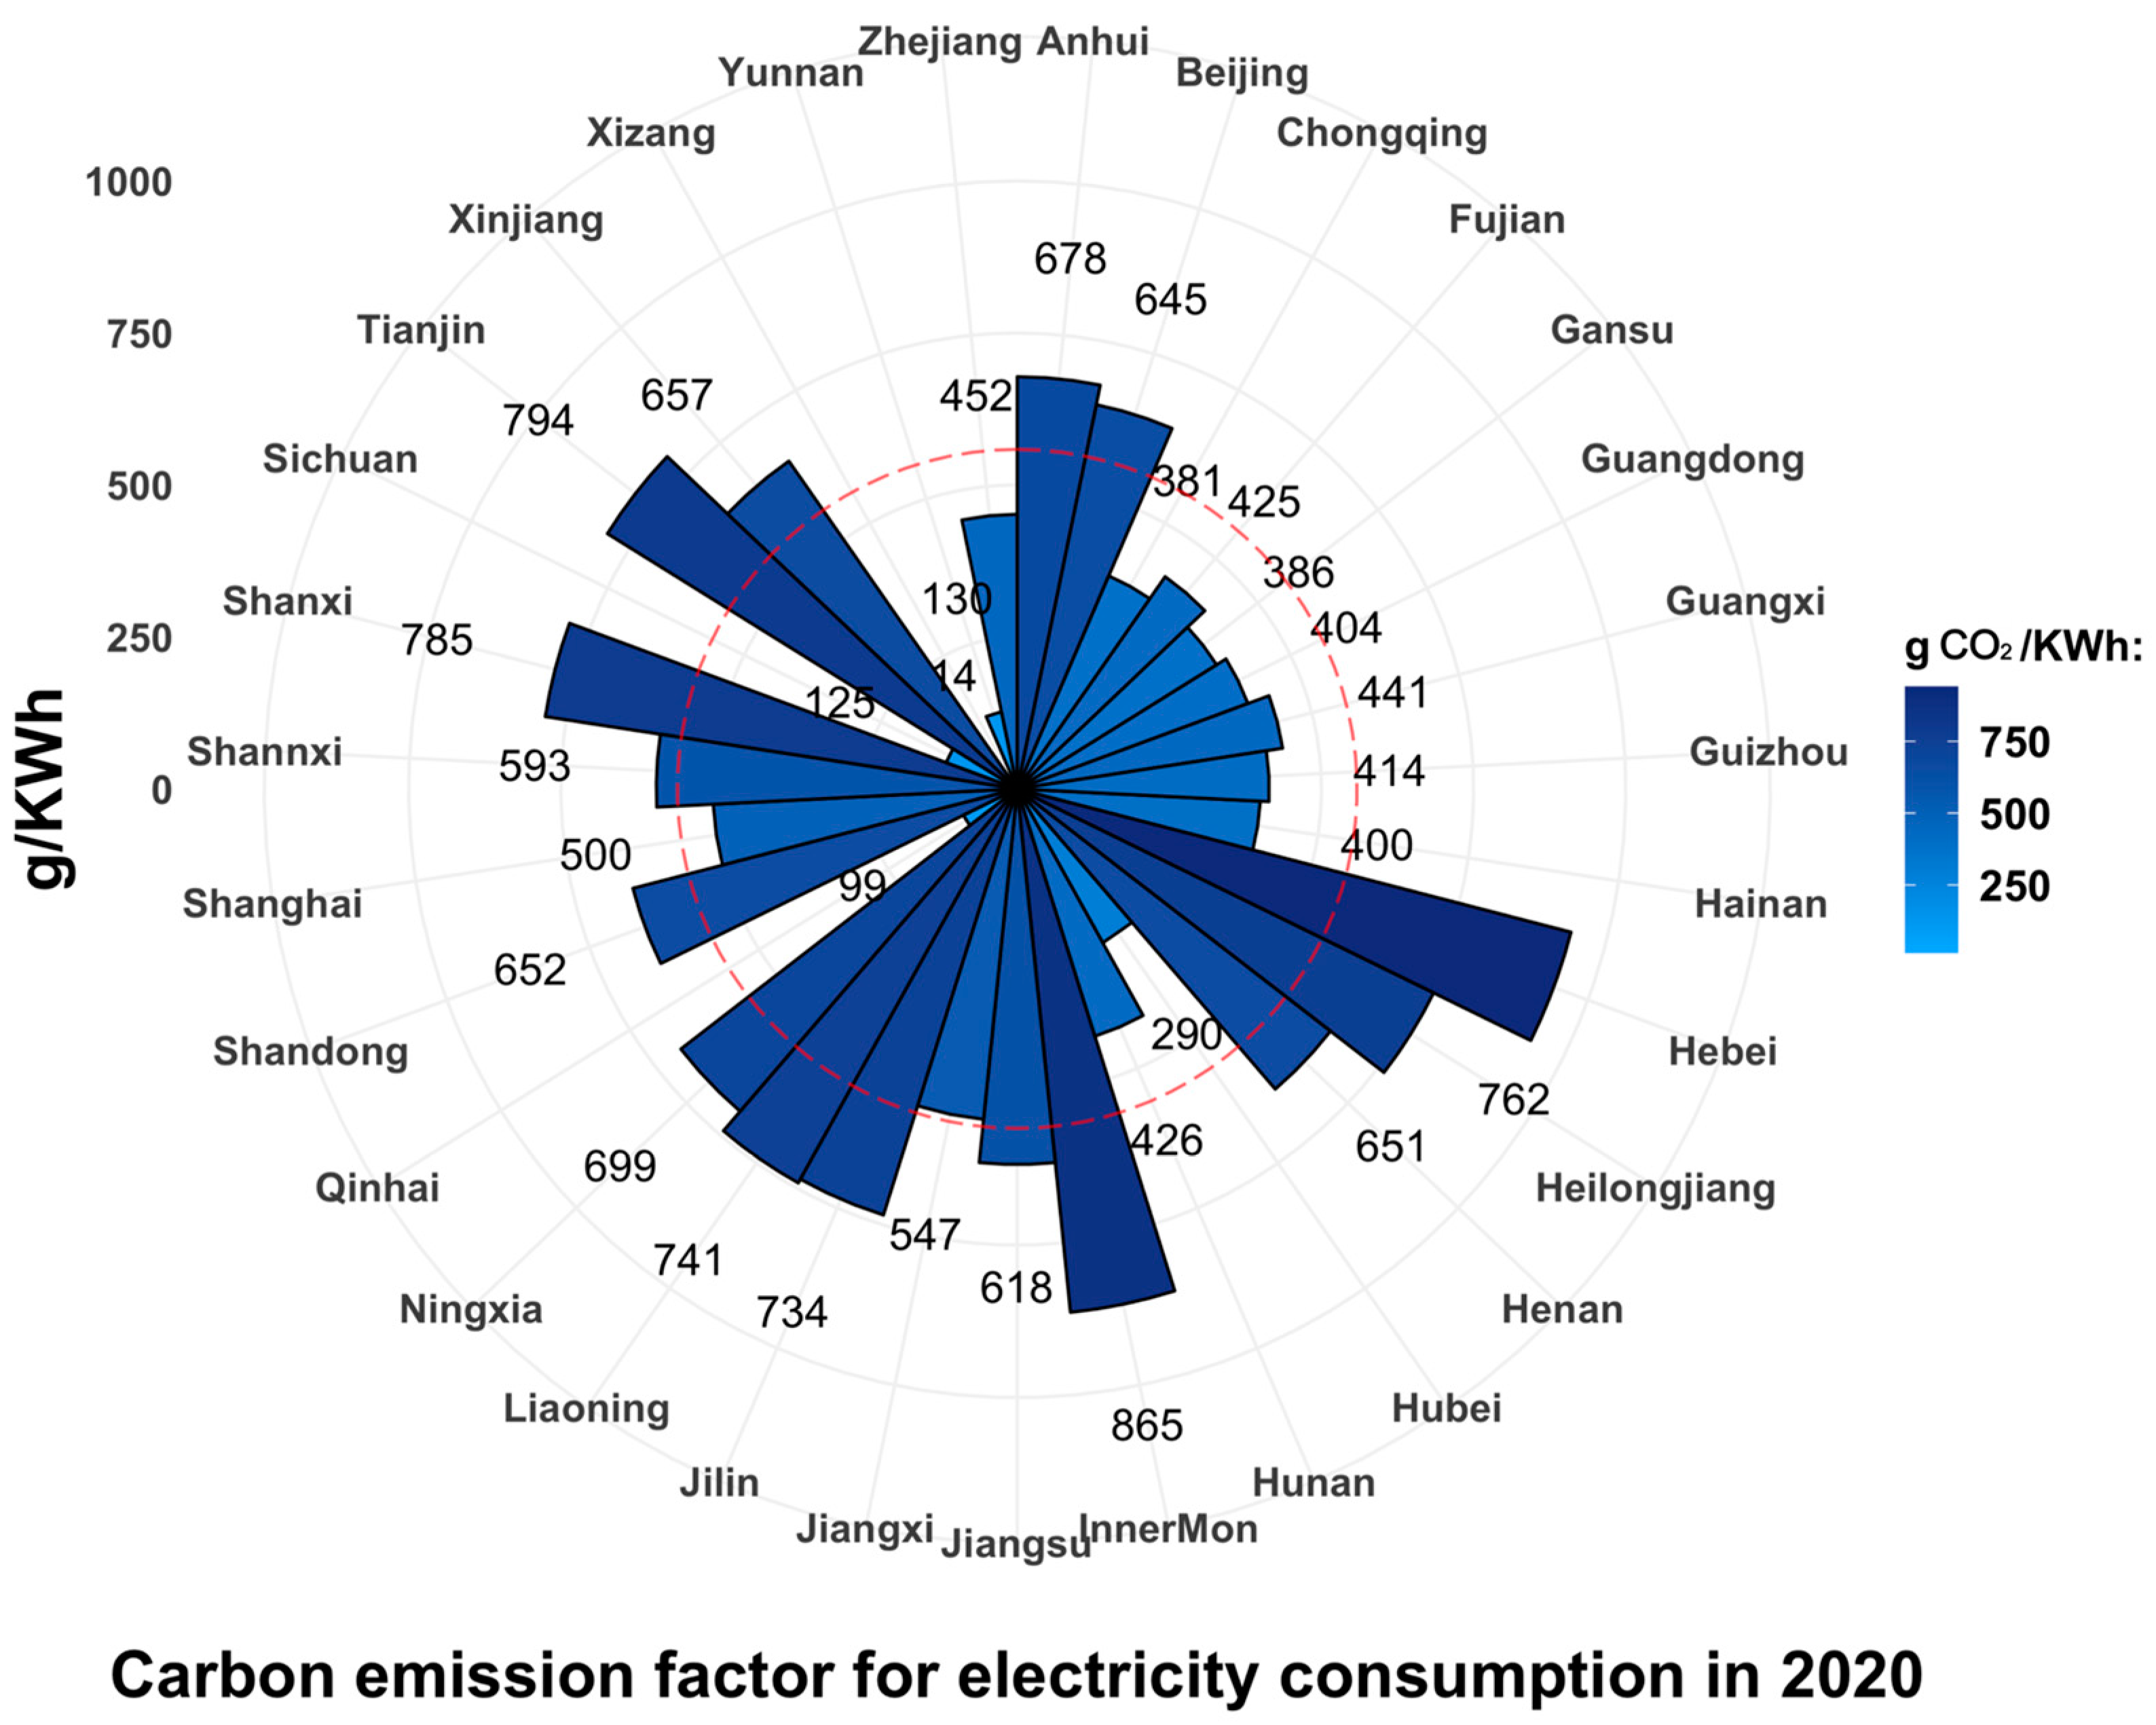
- The current Guangxi society-wide carbon emissions are still in the rising stage of the carbon peak path, and the proportion of indirect carbon emissions from electricity consumption and the carbon emission factor of electricity consumption are both showing an increasing trend. In 2020, the direct carbon emissions of the whole industry in Guangxi are 183.89 Mt, and the direct carbon emissions from local electricity production is 86.39 Mt. From 2014 to 2020, the proportion of indirect carbon emissions in total carbon emissions in Guangxi increases from 22.17% to 31.96%. In 2020, each unit of electricity consumed in the region causes indirect CO2 emissions of 441 g, but it is still lower than the national average value of 524.11 g CO2/KWh.
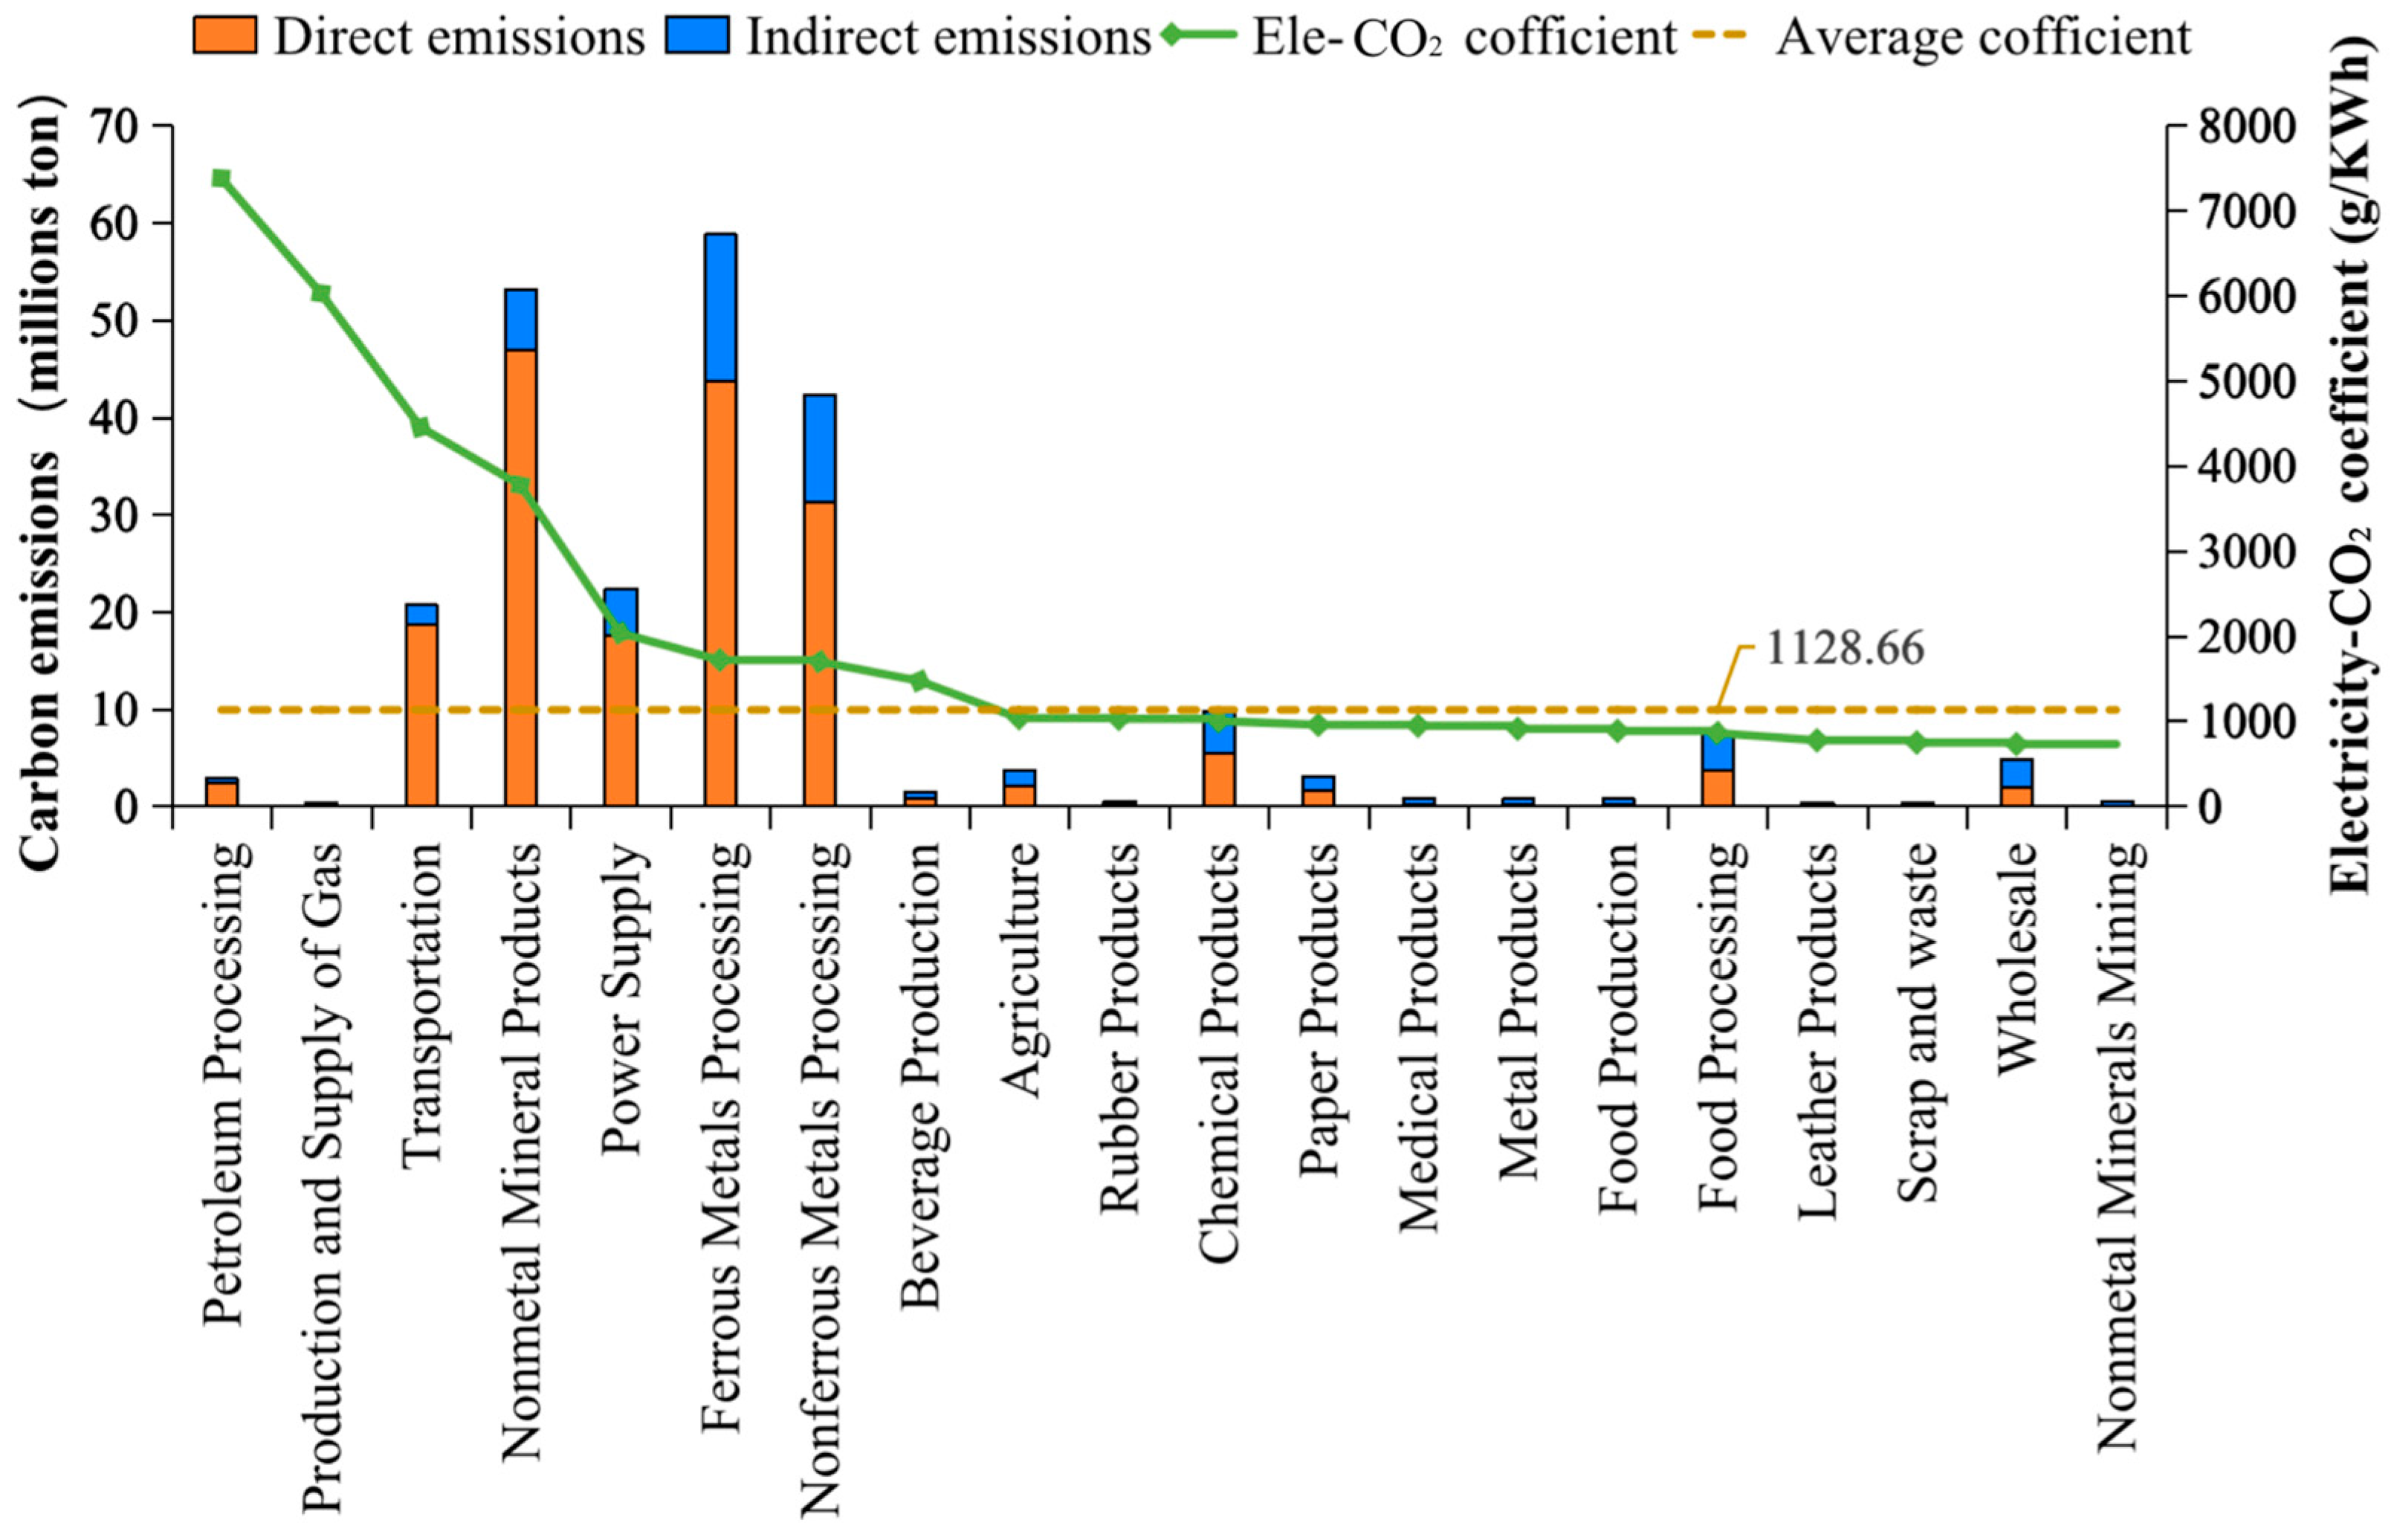
- Carbon emissions from the industrial sector occupy a dominant position, and the proportion of carbon emissions from the primary industry is slowly decreasing. Among them, the nonmetal mineral products sector, smelting and processing of ferrous metals sector, and smelting and processing of nonferrous metals sector are the largest sources of carbon emissions in Guangxi, and their actual CO2 emissions and emission share are large. In addition, the total direct carbon emissions of the three sectors in 2020 are 154.33 Mt, accounting for 57.10%. Carbon emissions from the electricity production sector under the shared responsibility principle are 22.41 Mt, accounting for 8.29%. The transportation sector is another major source of emissions, with 20.75 Mt of CO2 emissions in 2020, accounting for 7.68%. In addition, total carbon emissions from the primary sector have shown a fluctuating downward trend since 2014, standing at 3.75 Mt in 2020, a decrease of 8.67% compared to 2014.
- There are significant differences in the electricity–CO2 coefficients of different sectors. In the process of carbon emissions monitoring and accounting, attention should be paid to the differences in emissions between different industries, and customized carbon emissions monitoring and accounting should be carried out. Through real-time monitoring of the carbon emissions of enterprises in Guangxi, we find that the daily carbon emissions of enterprises in the primary, light, and tertiary industries are generally lower than the monitoring average of 275.02 tons per day, while enterprises in the nonmetal mineral products, metal smelting, and chemical products are characterized by both high energy consumption and high emissions, with the highest carbon emissions reaching 20,398.95 tons per day. In 2020, under the shared responsibility principle, the average value of the electricity–CO2 coefficient for all sectors in Guangxi is 1129 gCO2/KWh; the maximum value is for petroleum processing and coking with an average electricity–CO2 coefficient of 7376 gCO2/KWh; the minimum value is for petroleum and natural gas extraction, production and supply of tap water, and cultural, educational, and sports articles with an average electricity–CO2 coefficient of 446 gCO2/KWh.
4.2. Implications
- The government should seize the key industries when conducting dual carbon planning and objectively develop a dual carbon pathway by industry based on historical emission data. Taking Guangxi as an example, carbon emissions from the nonmetal mineral products, smelting and processing of ferrous metal, smelting and processing of nonferrous metal, power production, and transportation sectors often account for more than 70% of total social emissions under the shared responsibility principle (Scope 2) and have continued to grow in recent years. Policy makers should consider the pressure to achieve the dual carbon goals for each sector and further optimize the sectoral emission reduction constraints.
- Use real-time carbon emissions monitoring at the enterprise level to promote carbon emission policy optimization, enterprise independent emission reduction innovation, and carbon market construction. First, enterprise carbon emissions monitoring based on electricity big data enables point-source tracing of high-frequency carbon emission streams, which supports the government in grasping the emission details in real time and carrying out timely emission accountability or support for relevant subjects. Second, the promotion of enterprise-level carbon emissions monitoring helps to promote enterprises to independently optimize their energy consumption in production processes, spontaneously promote their transformation from high energy consumption and pollution to low energy consumption and clean production, and acquire the economic benefits of energy saving and emission reduction innovation. Finally, enterprise emission data can be used as the basis for phased emission reduction compliance in a complete carbon market in the future, providing data support and endorsement for the market’s operation and helping institutional and regulatory bodies to better carry out operations such as trading and auditing, thus further improving the effectiveness of the market and promoting the construction of a fully informed market.
Supplementary Materials
Author Contributions
Funding
Data Availability Statement
Conflicts of Interest
Appendix A. The Calculation of Electricity–CO2 Coefficients
| Electricity Consumption (104 KWh) | Direct Emissions (Mt) | Indirect Emissions (Mt) | Total Emissions (Mt) | Ele-CO2 Coefficient (g/KWh) | |
|---|---|---|---|---|---|
| Agriculture, Forestry, Animal Products, and Fishing | 363,939 | 215 | 161 | 375 | 1032 |
| Coal Mining and Dressing | 74,393 | 9 | 33 | 42 | 561 |
| Petroleum and Natural Gas Extraction | 2343 | 0 | 1 | 1 | 441 |
| Ferrous Metals Mining and Dressing | 155,473 | 25 | 69 | 93 | 601 |
| Nonferrous Metals Mining and Dressing | 174,121 | 14 | 77 | 90 | 519 |
| Nonmetal Minerals Mining and Dressing | 33,699 | 9 | 15 | 24 | 713 |
| Other Minerals Mining and Dressing | 64 | 0 | 0 | 0 | 481 |
| Logging and Transport of Wood and Bamboo | 0 | 0 | 0 | 0 | 0 |
| Food Processing | 886,047 | 368 | 391 | 759 | 857 |
| Food Production | 51,521 | 23 | 23 | 45 | 882 |
| Beverage Production | 79,002 | 81 | 35 | 116 | 1469 |
| Tobacco Processing | 12,040 | 3 | 5 | 8 | 674 |
| Textile Industry | 92,174 | 17 | 41 | 58 | 625 |
| Garments and Other Fiber Products | 8046 | 0 | 4 | 4 | 464 |
| Leather, Furs, Down, and Related Products | 11,393 | 4 | 5 | 9 | 771 |
| Timber Processing, Bamboo, Cane, Palm Fiber, and Straw Products | 272,619 | 14 | 120 | 135 | 493 |
| Furniture Manufacturing | 4047 | 0 | 2 | 2 | 517 |
| Papermaking and Paper Products | 332,183 | 170 | 147 | 317 | 953 |
| Printing and Record Medium Reproduction | 12,418 | 0 | 5 | 6 | 471 |
| Cultural, Educational, and Sports Articles | 2910 | 0 | 1 | 1 | 450 |
| Petroleum Processing and Coking | 34,320 | 238 | 15 | 253 | 7376 |
| Raw Chemical Materials and Chemical Products | 979,651 | 544 | 432 | 977 | 997 |
| Medical and Pharmaceutical Products | 55,724 | 28 | 25 | 53 | 943 |
| Chemical Fiber | 660 | 0 | 0 | 0 | 643 |
| Rubber Products | 26,070 | 15 | 12 | 27 | 1024 |
| Plastic Products | 73,551 | 8 | 32 | 40 | 547 |
| Nonmetal Mineral Products | 1,410,437 | 4692 | 622 | 5314 | 3768 |
| Smelting and Pressing of Ferrous Metals | 3,432,098 | 4369 | 1515 | 5884 | 1714 |
| Smelting and Pressing of Nonferrous Metals | 2,497,504 | 3133 | 1102 | 4235 | 1696 |
| Metal Products | 50,029 | 23 | 22 | 45 | 907 |
| Ordinary Machinery | 98,708 | 18 | 44 | 62 | 624 |
| Equipment for Special Purposes | 63,043 | 7 | 28 | 35 | 552 |
| Transportation Equipment | 188,998 | 45 | 83 | 129 | 680 |
| Electric Equipment and Machinery | 94,394 | 3 | 42 | 45 | 478 |
| Electronic and Telecommunications Equipment | 18,944 | 1 | 8 | 9 | 468 |
| Instruments, Meters, and Cultural and Office Machinery | 4534 | 0 | 2 | 2 | 455 |
| Other Manufacturing Industry | 11,990 | 1 | 5 | 7 | 552 |
| Scrap and waste | 3220 | 1 | 1 | 2 | 746 |
| Production and Supply of Electric Power and Hot Water | 1,103,267 | 1754 | 487 | 2241 | 2031 |
| Production and Supply of Gas | 1612 | 9 | 1 | 10 | 6024 |
| Production and Supply of Tap Water | 81,180 | 0 | 36 | 36 | 446 |
| Construction | 273,405 | 70 | 121 | 190 | 696 |
| Transportation, Storage, and Post | 466,254 | 1869 | 206 | 2075 | 4449 |
| Wholesale, Retail Trade, and Catering Services | 670,247 | 191 | 296 | 487 | 726 |
| Others | 1,439,624 | 36 | 635 | 671 | 466 |
| Urban | 2,237,446 | 292 | 987 | 1279 | 572 |
| Rural | 1,692,757 | 88 | 747 | 835 | 493 |
References
- IEA. An Energy Sector Roadmap to Carbon Neutrality in China. 2021. Available online: https://www.iea.org/reports/an-energy-sector-roadmap-to-carbon-neutrality-in-china (accessed on 23 August 2022).
- Guan, Y.; Shan, Y.; Huang, Q.; Chen, H.; Wang, D.; Hubacek, K. Assessment to China’s recent emission pattern shifts. Earth’s Future 2021, 9, e2021EF002241. [Google Scholar] [CrossRef]
- Shan, Y.; Huang, Q.; Guan, D.; Hubacek, K. China CO2 emission accounts 2016–2017. Sci. Data 2020, 7, 54. [Google Scholar] [CrossRef]
- Liu, Z.; Guan, D.; Wei, W. Carbon emission accounting in China. Sci. Cina Earth Sci. 2018, 48, 878–887. (In Chinese) [Google Scholar]
- Qian, H.; Xu, S.; Cao, J.; Ren, F.; Wu, L. Air pollution reduction and climate co-benefits in China’s industries. Nat. Sustain. 2021, 4, 417–425. [Google Scholar] [CrossRef]
- Pan, J. Construction, challenges and marcket expansion of emissions trading system. Chin. J. Popul. Resour. Environ. 2016, 26, 1–5. (In Chinese) [Google Scholar]
- Zhang, Q.; Zhang, D.; Zhang, X. Application of Online Monitoring to China’s Carbon Emission Trading System: Key Issues and Policy Recommendations. Sci. Cina Earth Sci. 2021, 6, 136–146. (In Chinese) [Google Scholar]
- Wei, Y.; Liu, L.; Fan, Y.; Wu, G. China Energy Report (2008): Carbon Emissions Study; Science Press: Beijing, China, 2008. [Google Scholar]
- Brohé, A. The Handbook of Carbon Accounting; Routledge: Oxfordshire, UK, 2017. [Google Scholar]
- Wiedmann, T.; Chen, G.; Owen, A.; Lenzen, M.; Doust, M.; Barrett, J.; Steele, K. Three-scope carbon emission inventories of global cities. J. Ind. Ecol. 2021, 25, 735–750. [Google Scholar] [CrossRef]
- Eggleston, H.; Buendia, L.; Miwa, K.; Ngara, T.; Tanabe, K. 2006 IPCC Guidelines for National Greenhouse Gas Inventories. 2006. Available online: https://www.osti.gov/etdeweb/biblio/20880391 (accessed on 10 January 2023).
- Oda, T.; Maksyutov, S.; Andres, R.J. The Open-source Data Inventory for Anthropogenic CO2, version 2016 (ODIAC2016): A global monthly fossil fuel CO2 gridded emissions data product for tracer transport simulations and surface flux inversions. Earth Syst. Sci. Data 2018, 10, 87–107. [Google Scholar] [CrossRef]
- Liu, J.; Tong, D.; Zheng, Y.; Cheng, J.; Qin, X.; Shi, Q.; Yan, L.; Lei, Y.; Zhang, Q. Carbon and air pollutant emissions from China’s cement industry 1990–2015: Trends, evolution of technologies, and drivers. Atmos. Chem. Phys. 2021, 21, 1627–1647. [Google Scholar] [CrossRef]
- Worrell, E.; Price, L.; Martin, N.; Hendriks, C.; Meida, L.O. Carbon dioxide emissions from the global cement industry. Annu. Rev. Energy Environ. 2001, 26, 303–329. [Google Scholar] [CrossRef]
- Minx, J.C.; Lamb, W.F.; Andrew, R.M.; Canadell, J.G.; Crippa, M.; Döbbeling, N.; Forster, P.M.; Guizzardi, D.; Olivier, J.; Peters, G.P. A comprehensive and synthetic dataset for global, regional, and national greenhouse gas emissions by sector 1970–2018 with an extension to 2019. Earth Syst. Sci. Data 2021, 13, 5213–5252. [Google Scholar] [CrossRef]
- Chen, H.; Wang, R.; Liu, X.; Du, Y.; Yang, Y. Monitoring the enterprise carbon emissions using electricity big data: A case study of Beijing. J. Clean. Prod. 2023, 396, 136427. [Google Scholar] [CrossRef]
- Li, Z.; Sun, L.; Geng, Y.; Dong, H.; Ren, J.; Liu, Z.; Tian, X.; Yabar, H.; Higano, Y. Examining industrial structure changes and corresponding carbon emission reduction effect by combining input-output analysis and social network analysis: A comparison study of China and Japan. J. Clean. Prod. 2017, 162, 61–70. [Google Scholar] [CrossRef]
- Sun, L.; Qin, L.; Taghizadeh-Hesary, F.; Zhang, J.; Mohsin, M.; Chaudhry, I.S. Analyzing carbon emission transfer network structure among provinces in China: New evidence from social network analysis. Environ. Sci. Pollut. Res. 2020, 27, 23281–23300. [Google Scholar] [CrossRef]
- Abdi, R.; Taki, M.; Akbarpour, M. An Analysis of Energy input-output and Emissions of Greenhouse Gases from Agricultural Productions. Int. J. Nat. Eng. Sci. 2012, 3, 6. [Google Scholar]
- Poblete-Cazenave, M.; Pachauri, S. A model of energy poverty and access: Estimating household electricity demand and appliance ownership. Energy Econ. 2021, 98, 105266. [Google Scholar] [CrossRef]
- Qu, S.; Liang, S.; Xu, M. CO2 emissions embodied in interprovincial electricity transmissions in China. Environ. Sci. Technol. 2017, 51, 10893–10902. [Google Scholar] [CrossRef]
- Huo, D.; Liu, K.; Liu, J.; Huang, Y.; Sun, T.; Sun, Y.; Si, C.; Liu, J.; Huang, X.; Qiu, J. Near-real-time daily estimates of fossil fuel CO2 emissions from major high-emission cities in China. Sci. Data 2022, 9, 684. [Google Scholar] [CrossRef]
- Andres, R.J.; Gregg, J.S.; Losey, L.; Marland, G.; Boden, T.A. Monthly, global emissions of carbon dioxide from fossil fuel consumption. Tellus B Chem. Phys. Meteorol. 2011, 63, 309–327. [Google Scholar] [CrossRef]
- Huo, D.; Huang, X.; Dou, X.; Ciais, P.; Li, Y.; Deng, Z.; Wang, Y.; Cui, D.; Benkhelifa, F.; Sun, T. Carbon Monitor Cities near-real-time daily estimates of CO2 emissions from 1500 cities worldwide. Sci. Data 2022, 9, 533. [Google Scholar] [CrossRef]
- Liu, Z.; Deng, Z.; Davis, S.J.; Giron, C.; Ciais, P. Monitoring global carbon emissions in 2021. Nat. Rev. Earth Environ. 2022, 3, 217–219. [Google Scholar] [CrossRef]
- Liu, Z.; Ciais, P.; Deng, Z.; Davis, S.J.; Zheng, B.; Wang, Y.; Cui, D.; Zhu, B.; Dou, X.; Ke, P. Carbon Monitor, a near-real-time daily dataset of global CO2 emission from fossil fuel and cement production. Sci. Data 2020, 7, 392. [Google Scholar] [CrossRef]
- Li, M.; Liu, H.; Geng, G.; Hong, C.; Liu, F.; Song, Y.; Tong, D.; Zheng, B.; Cui, H.; Man, H. Anthropogenic emission inventories in China: A review. Natl. Sci. Rev. 2017, 4, 834–866. [Google Scholar] [CrossRef]
- Chang, X.; Chen, B.Y.; Li, Q.; Cui, X.; Tang, L.; Liu, C. Estimating real-time traffic carbon dioxide emissions based on intelligent transportation system technologies. IEEE Trans. Intell. Transp. Syst. 2012, 14, 469–479. [Google Scholar] [CrossRef]
- Quadros, F.D.; Snellen, M.; Sun, J.; Dedoussi, I.C. Global civil aviation emissions estimates for 2017–2020 using ADS-B data. J. Aircr. 2022, 59, 1394–1405. [Google Scholar] [CrossRef]
- Liu, Y.; Gao, C.; Lu, Y. The impact of urbanization on GHG emissions in China: The role of population density. J. Clean. Prod. 2017, 157, 299–309. [Google Scholar] [CrossRef]
- Svirejeva-Hopkins, A.; Schellnhuber, H.-J. Urban expansion and its contribution to the regional carbon emissions: Using the model based on the population density distribution. Ecol. Model. 2008, 216, 208–216. [Google Scholar] [CrossRef]
- Raupach, M.; Rayner, P.; Paget, M. Regional variations in spatial structure of nightlights, population density and fossil-fuel CO2 emissions. Energy Policy 2010, 38, 4756–4764. [Google Scholar] [CrossRef]
- Dogan, E.; Aslan, A. Exploring the relationship among CO2 emissions, real GDP, energy consumption and tourism in the EU and candidate countries: Evidence from panel models robust to heterogeneity and cross-sectional dependence. Renew. Sustain. Energy Rev. 2017, 77, 239–245. [Google Scholar] [CrossRef]
- Bag, S.; Pal, K. Sulfonated poly (ether ether ketone) based carbon dioxide gas sensor: Impact of sulfonation degree on sensing behavior at different humid condition. Sens. Actuators B Chem. 2020, 303, 127115. [Google Scholar] [CrossRef]
- Fan, L.; Wigneron, J.-P.; Ciais, P.; Chave, J.; Brandt, M.; Fensholt, R.; Saatchi, S.S.; Bastos, A.; Al-Yaari, A.; Hufkens, K. Satellite-observed pantropical carbon dynamics. Nat. Plants 2019, 5, 944–951. [Google Scholar] [CrossRef]
- Goetz, S.J.; Baccini, A.; Laporte, N.T.; Johns, T.; Walker, W.; Kellndorfer, J.; Houghton, R.A.; Sun, M. Mapping and monitoring carbon stocks with satellite observations: A comparison of methods. Carbon Balance Manag. 2009, 4, 2. [Google Scholar] [CrossRef] [PubMed]
- Huisingh, D.; Zhang, Z.; Moore, J.C.; Qiao, Q.; Li, Q. Recent advances in carbon emissions reduction: Policies, technologies, monitoring, assessment and modeling. J. Clean. Prod. 2015, 103, 1–12. [Google Scholar] [CrossRef]
- Wennersten, R.; Sun, Q.; Li, H. The future potential for Carbon Capture and Storage in climate change mitigation—An overview from perspectives of technology, economy and risk. J. Clean. Prod. 2015, 103, 724–736. [Google Scholar] [CrossRef]
- Bullock, E.L.; Woodcock, C.E.; Olofsson, P. Monitoring tropical forest degradation using spectral unmixing and Landsat time series analysis. Remote Sens. Environ. 2020, 238, 110968. [Google Scholar] [CrossRef]
- Neethirajan, S.; Freund, M.; Jayas, D.; Shafai, C.; Thomson, D.; White, N. Development of carbon dioxide (CO2) sensor for grain quality monitoring. Biosyst. Eng. 2010, 106, 395–404. [Google Scholar] [CrossRef]
- Liu, Z.; Guan, D.; Wei, W.; Davis, S.J.; Ciais, P.; Bai, J.; Peng, S.; Zhang, Q.; Hubacek, K.; Marland, G. Reduced carbon emission estimates from fossil fuel combustion and cement production in China. Nature 2015, 524, 335–338. [Google Scholar] [CrossRef] [PubMed]
- Wei, W.; Zhang, P.; Li, J. The framework of regional electricity-related carbon emissions accounting and its application. China Popul. Resour. Environ. 2020, 30, 9. [Google Scholar]


Disclaimer/Publisher’s Note: The statements, opinions and data contained in all publications are solely those of the individual author(s) and contributor(s) and not of MDPI and/or the editor(s). MDPI and/or the editor(s) disclaim responsibility for any injury to people or property resulting from any ideas, methods, instructions or products referred to in the content. |
© 2023 by the authors. Licensee MDPI, Basel, Switzerland. This article is an open access article distributed under the terms and conditions of the Creative Commons Attribution (CC BY) license (https://creativecommons.org/licenses/by/4.0/).
Share and Cite
Zhou, C.; Lin, X.; Wang, R.; Song, B. Real-Time Carbon Emissions Monitoring of High-Energy-Consumption Enterprises in Guangxi Based on Electricity Big Data. Energies 2023, 16, 5124. https://doi.org/10.3390/en16135124
Zhou C, Lin X, Wang R, Song B. Real-Time Carbon Emissions Monitoring of High-Energy-Consumption Enterprises in Guangxi Based on Electricity Big Data. Energies. 2023; 16(13):5124. https://doi.org/10.3390/en16135124
Chicago/Turabian StyleZhou, Chunli, Xiqiao Lin, Renhao Wang, and Bowei Song. 2023. "Real-Time Carbon Emissions Monitoring of High-Energy-Consumption Enterprises in Guangxi Based on Electricity Big Data" Energies 16, no. 13: 5124. https://doi.org/10.3390/en16135124
APA StyleZhou, C., Lin, X., Wang, R., & Song, B. (2023). Real-Time Carbon Emissions Monitoring of High-Energy-Consumption Enterprises in Guangxi Based on Electricity Big Data. Energies, 16(13), 5124. https://doi.org/10.3390/en16135124


