Article

Wind Turbine Fire Prevention System Using Fuzzy Rules and WEKA Data Mining Cluster Analysis

1
DXlabz Co., Ltd., Suwon 16679, Republic of Korea
2
GaonPlatform Inc., Daejeon 34113, Republic of Korea
3
R&D Institute Tae Hee Evolution Co., Ltd., Seoul 15845, Republic of Korea
4
Department of Information and Communication Engineering, Sangji University, Wonju 26339, Republic of Korea
*
Author to whom correspondence should be addressed.
Energies 2023, 16(13), 5176; https://doi.org/10.3390/en16135176
Submission received: 14 May 2023 / Revised: 13 June 2023 / Accepted: 23 June 2023 / Published: 5 July 2023
(This article belongs to the Section A3: Wind, Wave and Tidal Energy)

Abstract

:
With the rapid expansion of the supply of renewable energy in accordance with the global energy transition policy, the wind power generation industry is attracting attention. Subsequently, various wind turbine control technologies have been widely developed and applied. However, there is a lack of research on optimal pitch control, which detects wind direction and changes the rotation angle of the blade in real time. In areas where the wind speed is not strong, such as South Korea, it is necessary to maintain the optimal angle in real time so that the rotating surface of the blade can face the wind direction. In this study, optimal pitch control was performed through real-time analysis of wind speed, direction, and temperature, which is the core of wind turbine maintenance, using fuzzy rules using FIS (Fuzzy Interface System) and WEKA data mining cluster analysis techniques. In order to prevent fires caused by the over-current of wind turbines, over-current control methods such as VCB (Vacuum Circuit Breaker) utilization, prototype utilization such as a modular MCB (Main Circuit Breaker) incorporating VI (Vacuum Interrupter), and vacuum degree change analysis methods using a PD (Partial Discharge) signal were proposed. The optimal control technique for wind turbine parts and facilities was put forth after judging and predicting the annual average wind distribution suitable for wind power generation using HRWPRM (Korea’s High-Resolution Wind Power Resource Maps). Finally, the various wind turbine control methods carried out in this study were confirmed through computer simulation, such as remote diagnosis and early warning issuance, prediction of power generation increase and decrease situation, and automatic analysis of wind turbine efficiency.

1. Introduction

Wind power generation has the advantage of being able to generate power 24 h a day as long as there is wind, and does not emit pollutants, as may occur with other forms of power generation, such as carbon dioxide emitted from burning fossil fuels. Offshore wind power generation can be expected to have a facility utilization rate of 30~40%, which is about 10% better than onshore wind power generation [1,2]. The disadvantages of wind power generation include the high installation and maintenance costs compared to solar power generation, when panels are installed on flat land, and the difficulty of initial suppression in the event of a fire, as turbines are often installed on a mountain ridge or on the coast [3,4]. In 2012, there were 12 cases of domestic wind turbine shutdowns due to failure anc accident; in 2014, there were 4 cases; and in 2016, there were 60 cases. In 2017, a fire broke out at an offshore wind turbine on Jeju Island. Most of these failures and accidents were caused by foreign-made turbines. Out of the 60 cases in 2016, 55 cases were due to damaged components, 4 cases were due to nacelle fire as a result of overheating from friction between parts, and 1 case was due to the overturning of a wind turbine due to structural tower damage. In instances outside of South Korea, a fire broke out in two rotors of a wind turbine near Osnabrueck, Germany, in 2007, while an average of one fire per 2000 wind turbines occurs in the United States every year. There can also be damage to wind turbine blades. Four of the twenty wind turbine blades in Incheon’s southwest sea offshore wind farm broke while operating; this has been identified as a problem for onshore wind power generators. According to the results of a survey conducted by the Korea Institute of Science and Technology Information on overseas wind turbine accident prevention, blade damage was the cause of the highest number of accidents, with a total of 370 cases from early 2000 to May 2017 [5].
In this study, an optimal pitch control was performed through real-time analysis of wind speed, direction, and temperature, which is the core of wind turbine maintenance, using fuzzy rules, FIS (Fuzzy Interface System), and WEKA data mining cluster analysis techniques. In order to prevent fires caused by the over-current of wind turbines, over-current control methods such as VCB (Vacuum Circuit Breaker) utilization, prototype utilization such as a modular MCB (Main Circuit Breaker) incorporating VI (Vacuum Interrupter), and vacuum degree change analysis method using PD (Partial Discharge) signal were proposed. Additionally, the optimal control technique for wind turbine parts and facilities was put forth after judging and predicting the annual average wind distribution suitable for wind power generation using the HRWPRM (High-Resolution Wind Power Resource Maps). Finally, the optimal pitch control effect was verified through computer simulation.

2. Optimal Pitch Control Technology for Wind Power Generators

In order to optimize performance and extend the lifetime of the wind power generator, the key to its maintenance is optimal pitch control. This enables real-time analysis of hazardous situations based on data generated from various sensors and components of wind turbines [6,7]. Accordingly, the pitch control was performed by analyzing the wind speed/direction/temperature in real time using fuzzy rules, FIS, and WEKA data mining cluster analysis, and the effect was verified through computer simulation [8,9,10,11]. To this end, a hybrid intelligent algorithm was used to display the prediction interval with verified accuracy and reliability in a real-time graph using ELM (Extreme Learning Machines) and SAEELM (Self-Adaptive Evolutionary Extreme Learning Machines) [4]. The visualization technique of the real-time graph proposed a method of modeling data using the big data platform of the SCADA (Supervisory Control and Data Acquisition) system, which occurs every second in a wind power generator, and then visualizes it in real time [12,13]. A system was designed using open source Hadoop and D3 to perform simulations that can efficiently compare a series of tasks such as querying/downloading/EXCEL conversion/graph conversion/analysis of SCADA system data. To this end, a big data system was built based on the data regulations of IEC 61400-25-2. The accumulated data were transferred to the SCADA system, and simulations were performed based on the results of analysis in the big data system. This was visualized using the open source library D3.js [9,10].
-
In consideration of the cost and time of system construction, the operational test on the virtual machine was executed for the purpose of experimental research, and the results of the execution were derived so that they could be transferred to the actual machine to help with continuous research analysis.
-
Some data of the SCADA system stipulated in IEC 61400-25-2 were limited, analyzed, and processed with a visualization technique of big data through factor analysis that increases the user’s convenience through related research papers and practical cases.
Figure 1 shows the process of assigning Hadoop 01 as the host name to VMWare, setting the IP to 172.17.91.105, and setting virtual environment 1 as the master node. The path to the Hadoop 2.6 configuration file is stored in a subdirectory (etc/Hadoop) of the Hadoop home directory.
The functions of various files (such as Hadoop configuration files) for big data visualization are shown in Table 1.
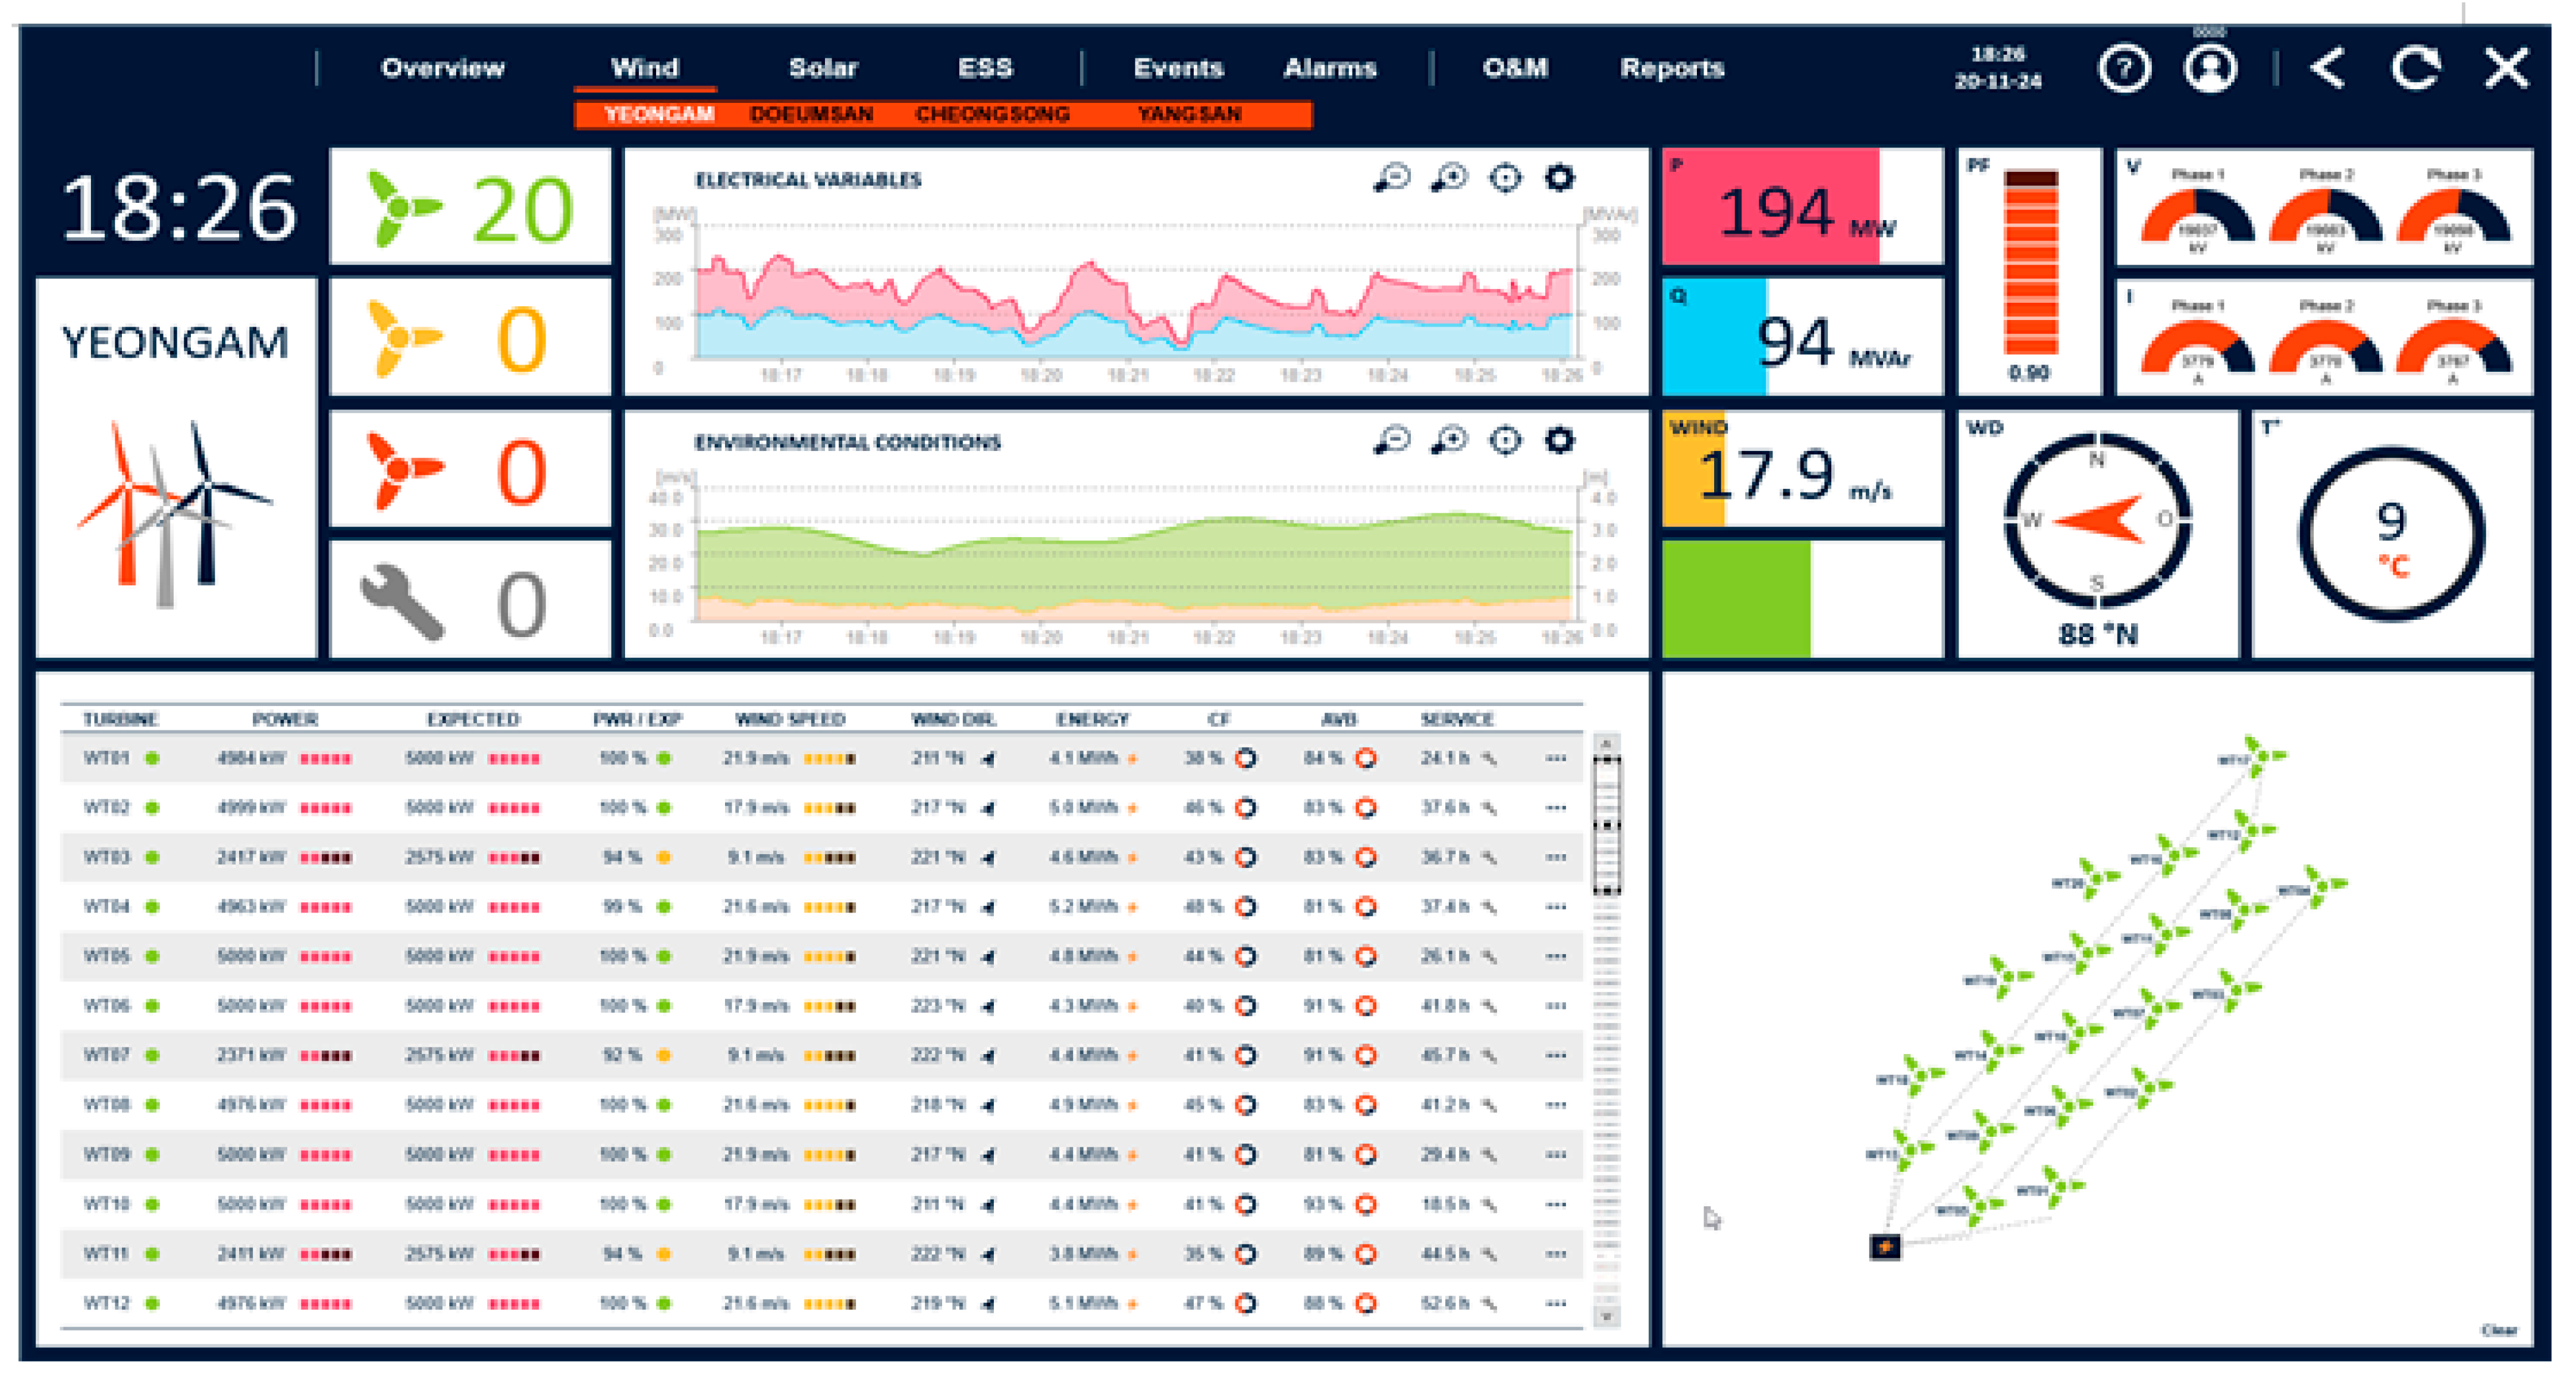
After processing the user’s request in the form of JSON on the web application server, the visualization result using the D3 and NVD3 libraries is shown in Figure 2, based on the information responding to the user’s request. The visualization results illustrate that the problem of the cooling device maintaining a constant temperature occurred because of a phenomenon caused by a short circuit in the cooling device due to the power cut.
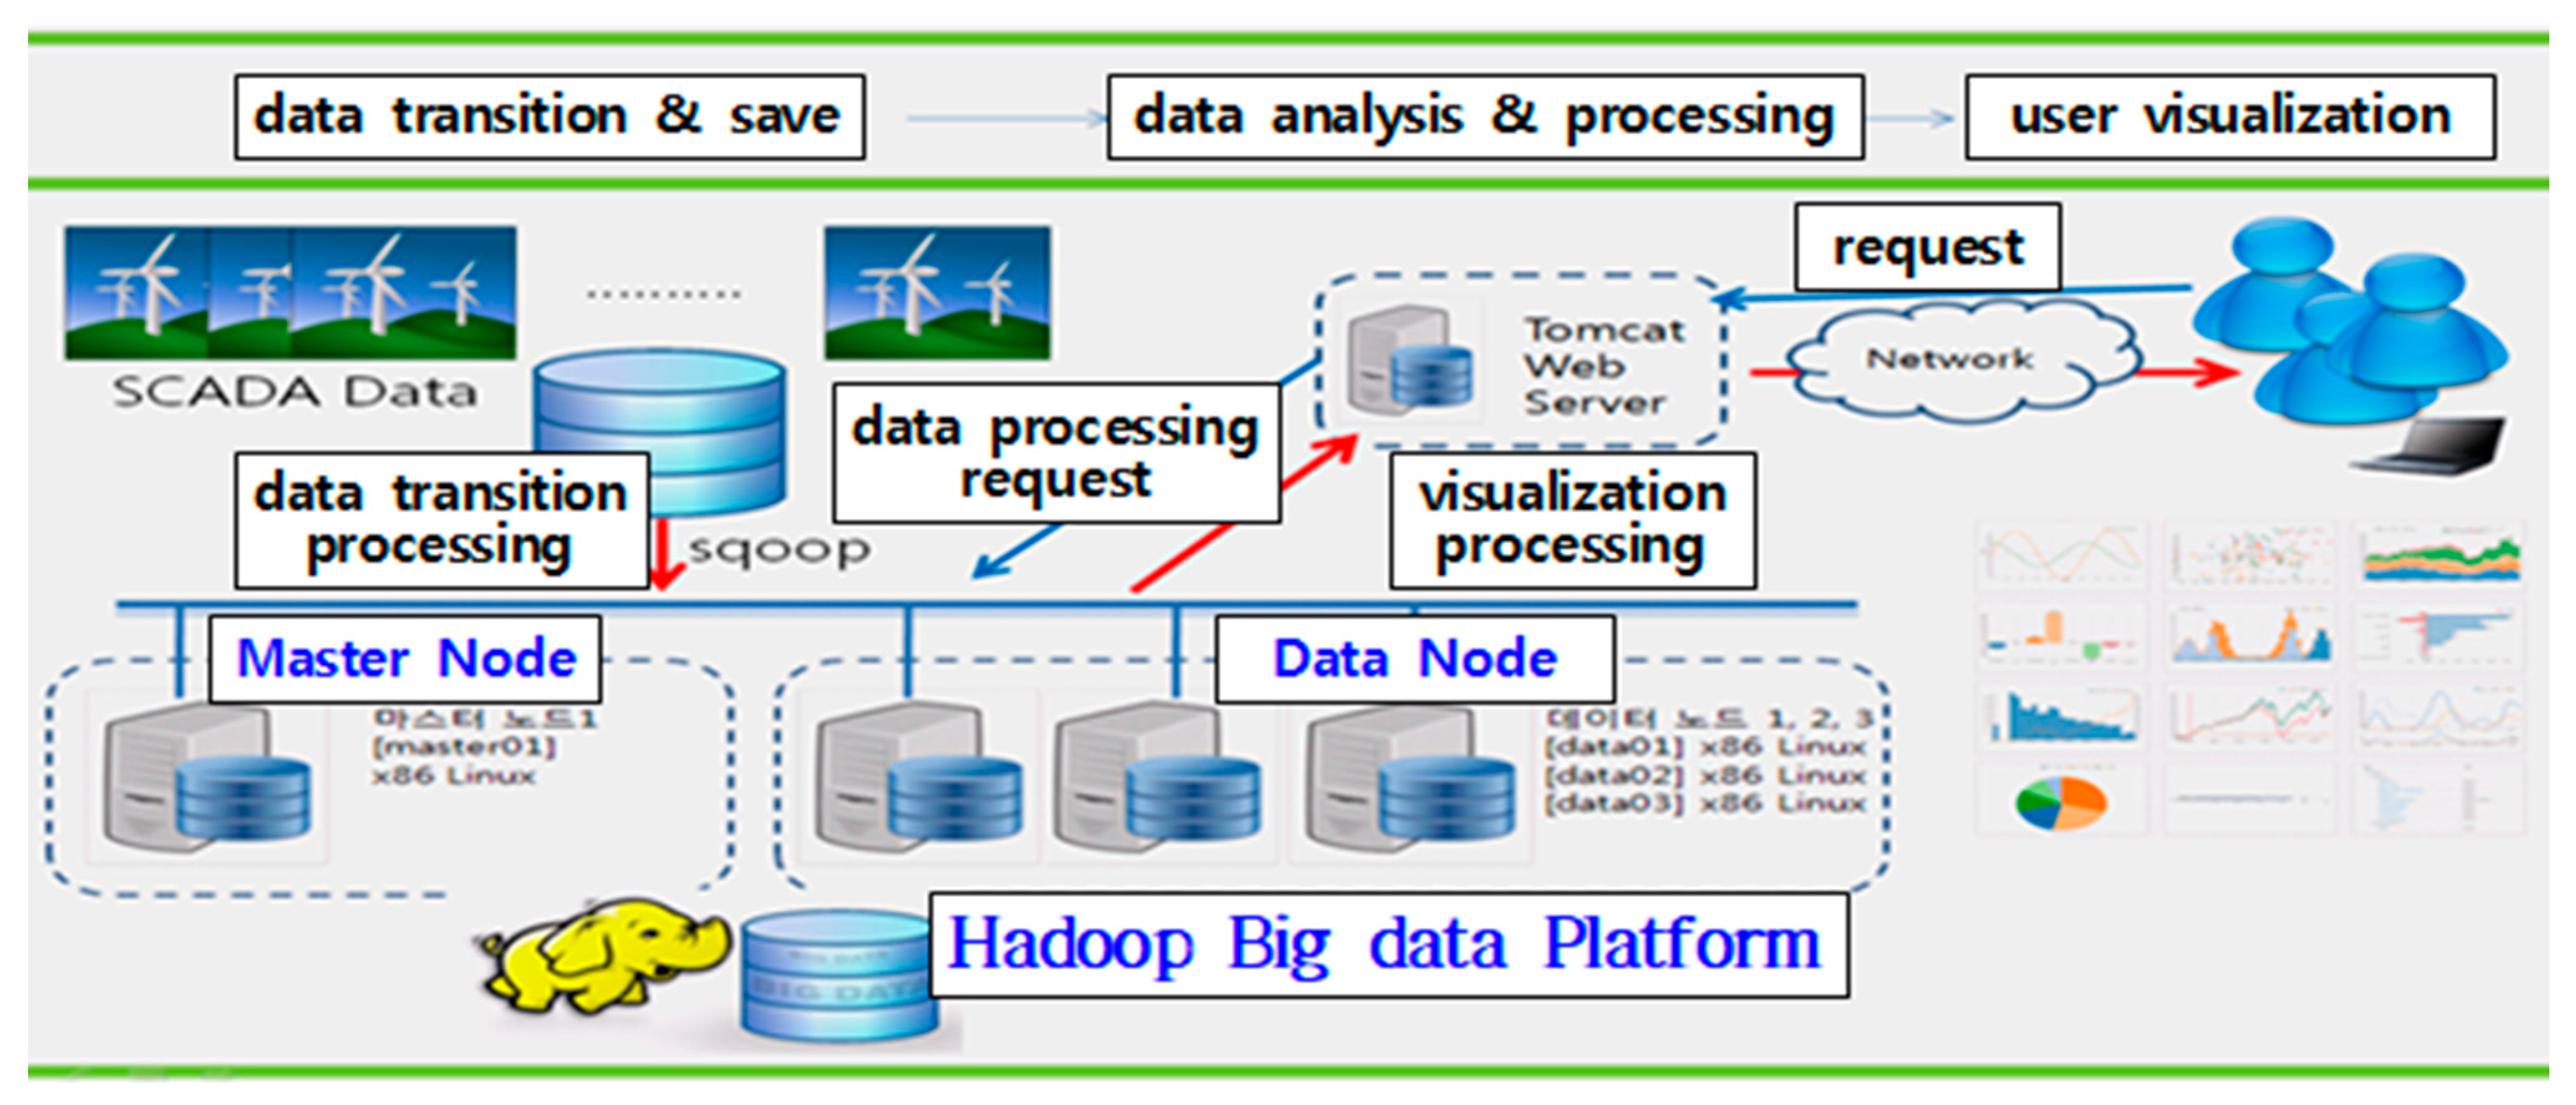
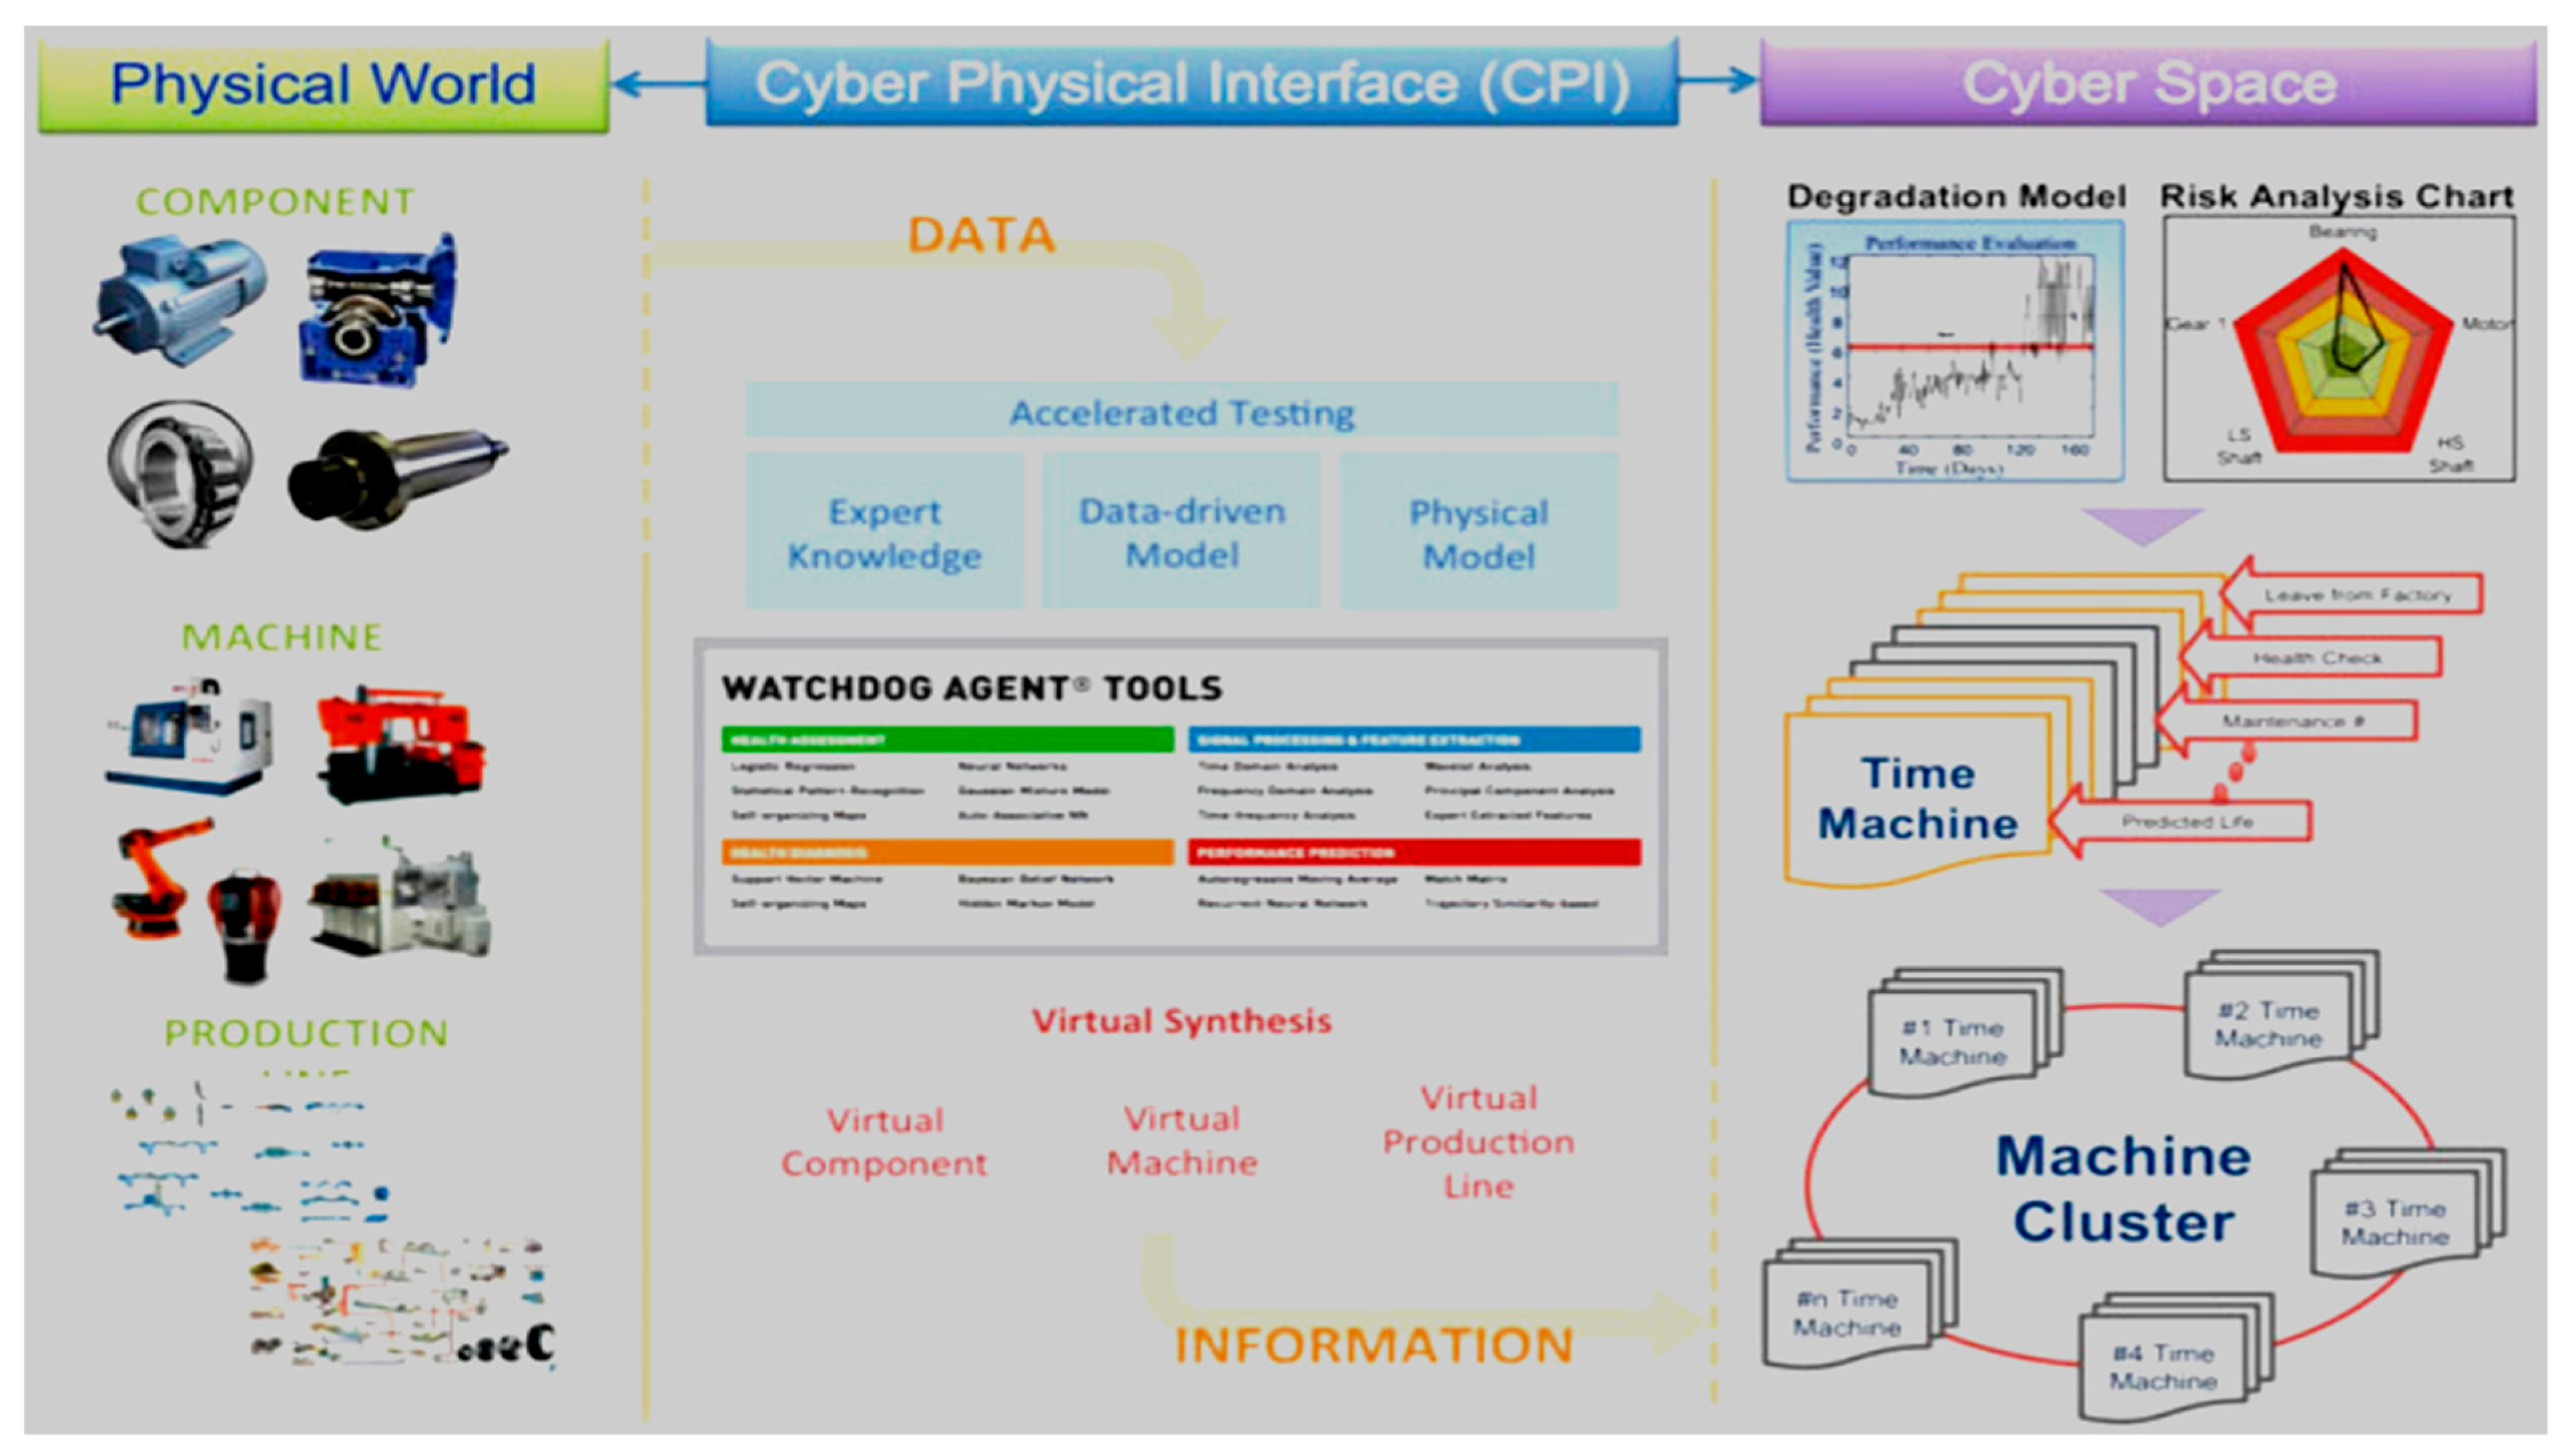
The structure of the visualization system using the Hadoop big data platform is shown in Figure 3. It consists of a web system that visualizes the results of collecting, storing, transferring, analyzing, and visualizing data in a SCADA system. The optimal pitch control is performed using the data accumulated in the SCADA system.
In order to operate wind power generation facilities safely and to produce high-quality electricity stably, many control devices are required, and it is also important to keep the rotation speed of the blade constant. In response to the frequently changing wind direction and speed, the rotation speed must be controlled constantly, and the blade must be safely stopped so as not to be damaged by typhoons [8]. Through the development of technology that quickly analyzes various sensors and mechanical data, it is possible to improve the performance of wind power generators by analyzing the experienced data of various patterns for various situations and to improve power generation efficiency by extending the generators’ lifespan.

3. Wind Power Generator Over-Current Blocking Control Technology

The causes of wind turbine accidents and failures include gearbox failure, transformer and generator damage caused by lightning strikes, power grid connection instability, yaw gear breakage, and converter failure. Since turbines operate unmanned 24 h a day, strong winds can cause over-current in the internal machinery of the nacelle, causing the machinery to overheat and cause a fire due to over-speeding of the blade [12,13,14]. Most of the wind turbine parts installed in the domestic wind farms are foreign-made, so it is difficult to procure parts in a timely manner, making regular maintenance difficult. Therefore, the damage to expensive blades due to lightning strikes could stop wind power generation for extended periods of time, resulting in severe economic losses. In recent years, lightning rods have been installed in wind turbines, and receptors on the surface of blades have been improved to increase the current capacity, thereby reducing damage by absorbing lightning strikes. Notably, if there is an over-current in the wind power transformer and gearbox, the probability of wind generator fire is very high. In order to solve this problem, an algorithm was proposed to prevent fire caused by over-current of wind power generation in the event of a lightning strike using a vacuum circuit breaker, and a fire blocking system was implemented [15]. Inside the wind turbine, power lines or communication lines are installed to control and monitor its operation. Communication lines are mostly composed of optical cables, but metal cables are also used. When lightning strikes a wind turbine, the ground potential rises, causing an overvoltage to the device which the installed externally conductor is connected to. When this happens, the insulation is destroyed, and over-current flows through it, causing damage to the device. In particular, if damage to the distribution system or communication system spreads, it is necessary to prevent lightning damage by installing SPD (Surge Protection Device) in wind power generation facilities. In this study, the following methods were proposed for optimal wind turbine over-current control [9,10,11,16].
Utilization of VCB (Vacuum Circuit Breaker)
-
VCB has excellent dielectric recovery properties between electrodes after current cut-off and has very good over-current blocking performance in the event of a sudden high voltage, which can ultimately prevent fires.
-
Excellent dielectric strength of less than 10−3 torr and rapid diffusion of a small capacity arc into the vacuum to protect the equipment and prevent fires caused by the wind turbine over-current in the event of a lightning strike.
-
Due to the small arc capacity, the contact consumption due to current blocking is low, and the long opening and closing life is suitable for multi-frequency circuit breakers; especially since it is completely enclosed, there is no arc/heat/gas emission when shutting down, so it is easy to repair and inspect.
-
Because it cuts off the current in the vacuum, it has the characteristics of low noise, and it is often used to prevent electrical fire accidents as a solid circuit breaker due to the small contact clearance.
Utilizing prototypes such as a modular MCB (Main Circuit Breaker) incorporating VI (Vacuum Interrupter)
-
Fire can be prevented through convergence hybrid circuit breaker monitoring diagnosis, such as a monitoring diagnosis system that prevents accident risk using a modular MCB, a circuit breaker operation coil monitoring system, and a module box temperature/humidity monitoring diagnosis.
-
The modular MCB system, which was applied to EMU-260 for the first time in 2018, has not yet been domestically produced, so the localization of the product is underway through the railway vehicle parts development project (hosted by the Korea Railroad Corporation Research Institute, 2021.04~2025.12).
-
It is possible to prevent fires by performing the same real-time status monitoring function of the modular MCB by applying the previously developed circuit breaker monitoring and diagnosis system.
Utilization of vacuum degree change analysis method using a PD (Partial Discharge) signal
-
By detecting the PD signal and analyzing the vacuum degree change, it is possible to prevent a fire through modular TBM (Time Based Maintenance)/CBM (Condition Based Maintenance)-based preventive maintenance.
-
By analyzing the operation characteristics of the operation coil and the temperature/humidity change, a multi-signal sensor module and a diagnostic module can be implemented to prevent fires through machine learning in the diagnostic module to improve the performance of the monitoring diagnosis function.
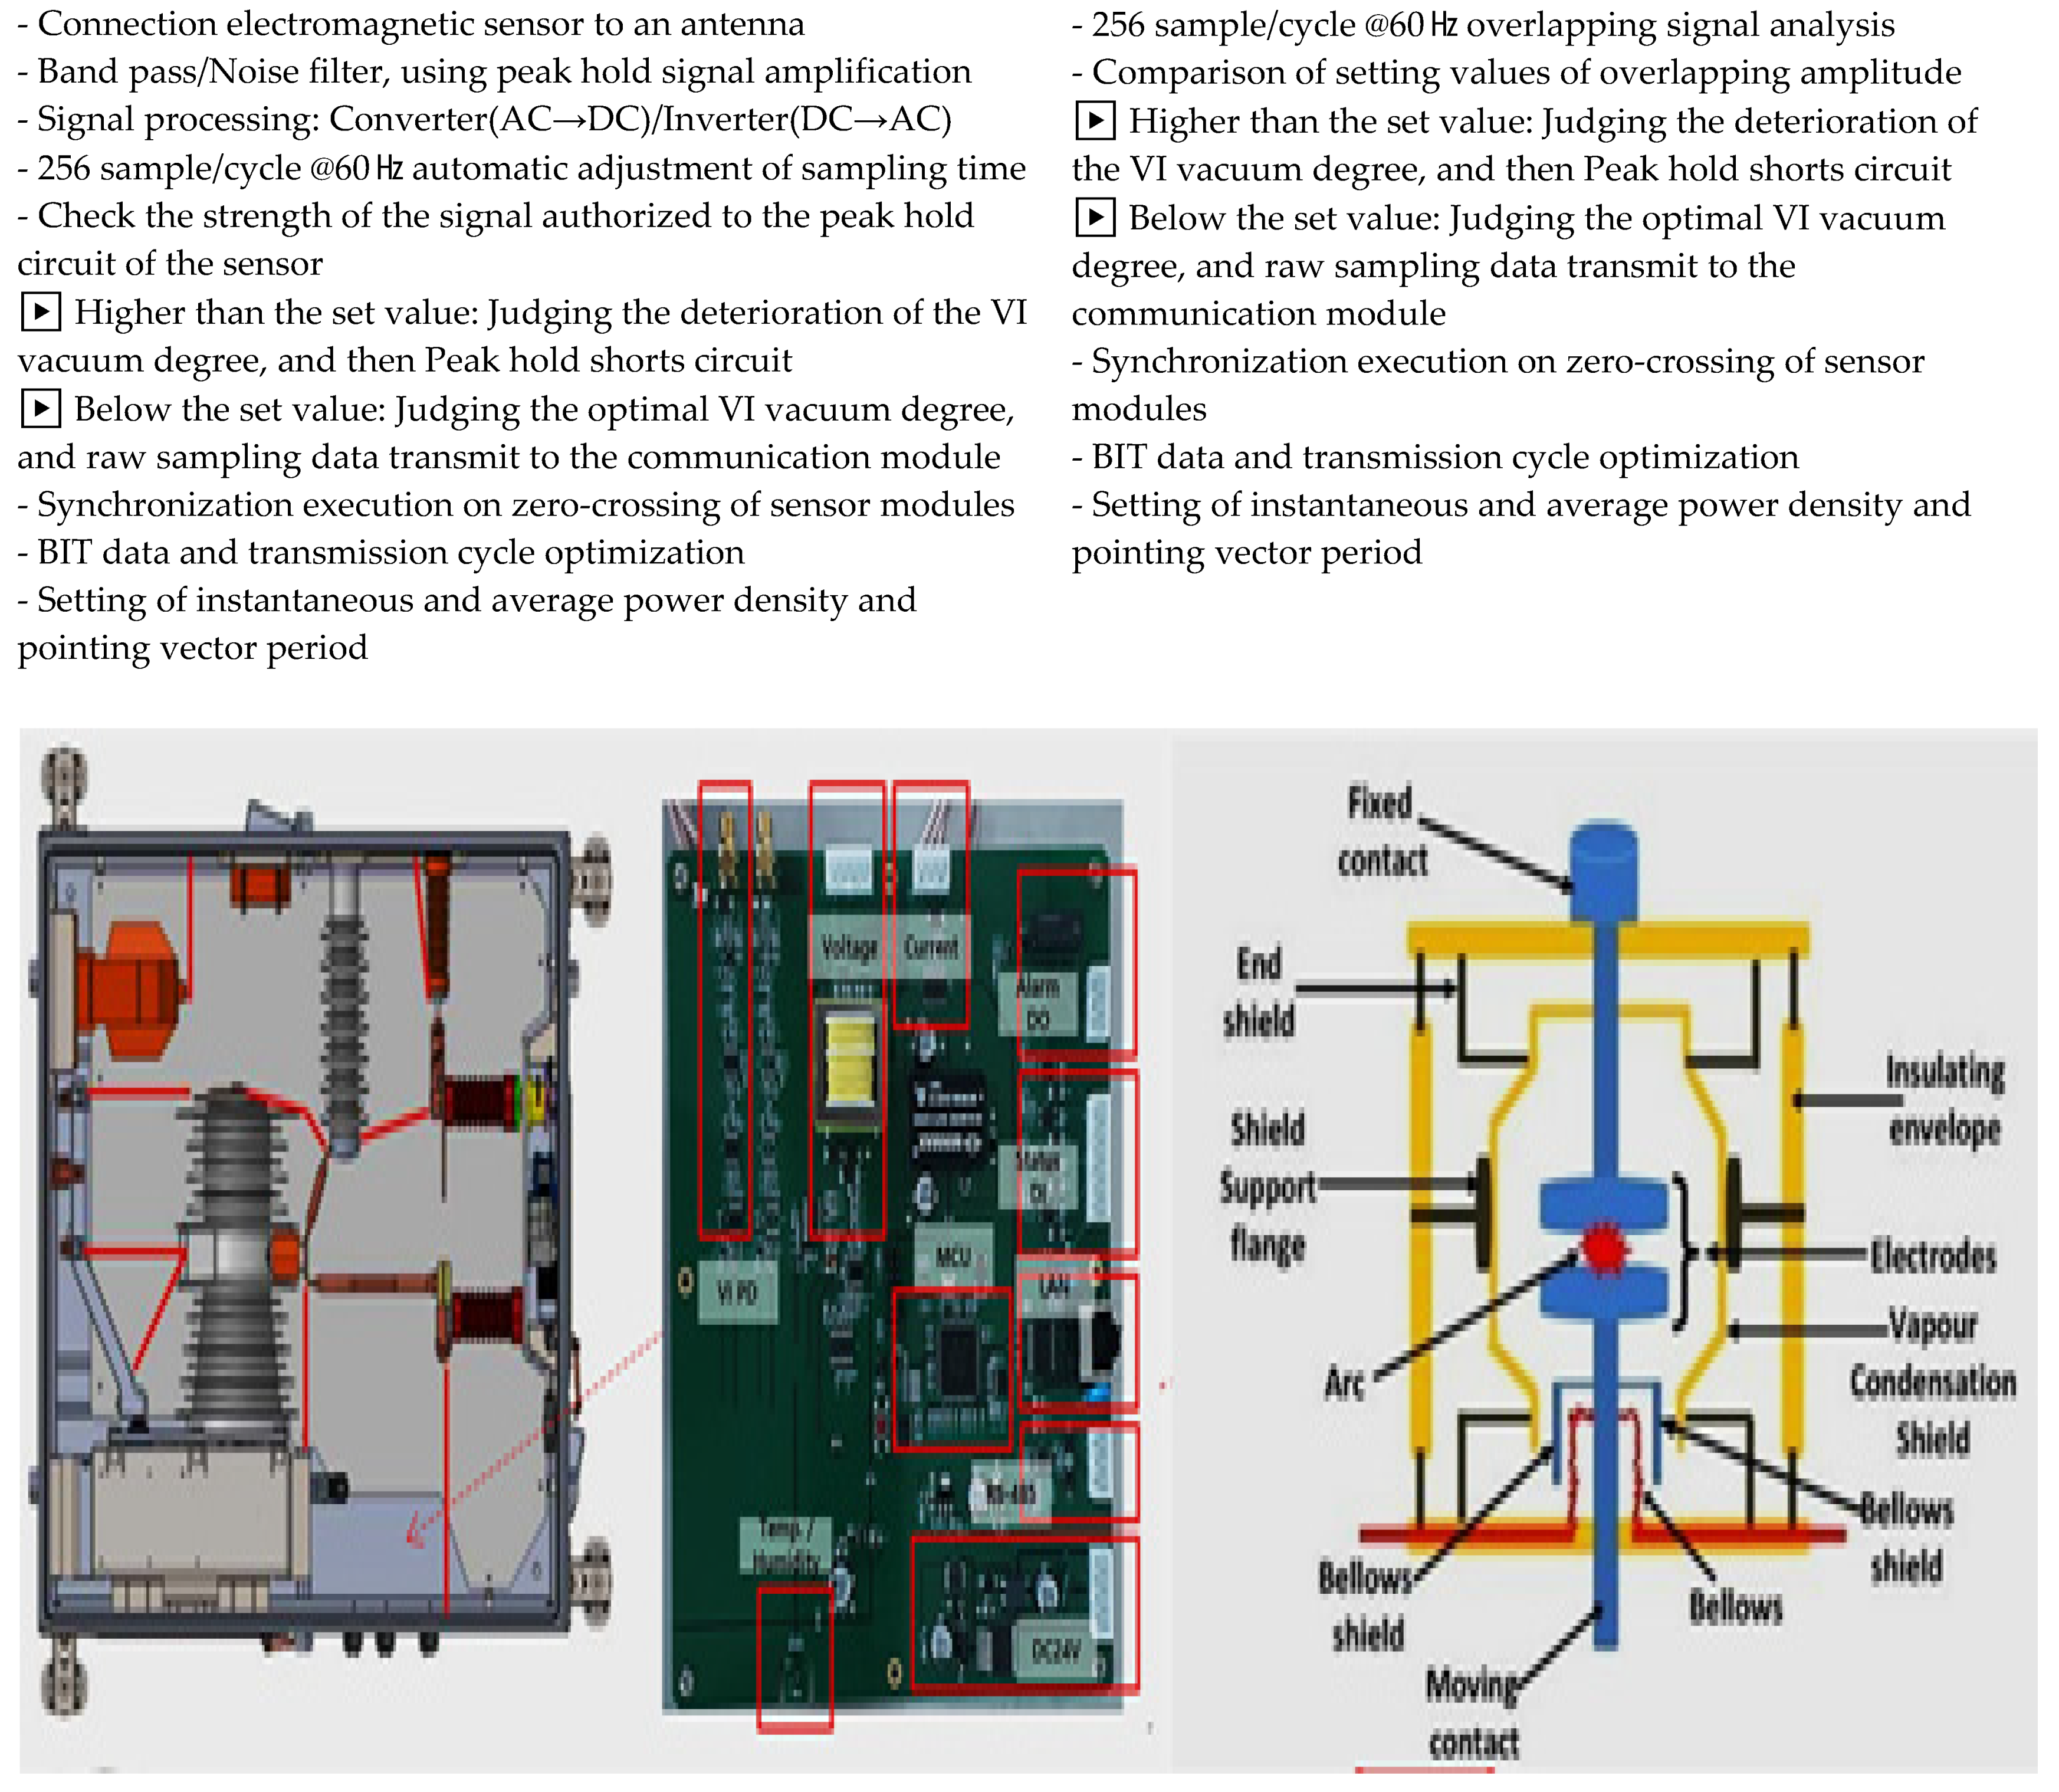
The verification contents and diagnostic results of the sensor module using the VCB/MCB/PD signal are shown in Figure 4. The sensor module is installed in the module box and has multiple sensor data acquisition functions of PD sensing-based vacuum degree monitoring, MCB state and coil current sensing-based circuit breaker operation characteristic monitoring, module box environment temperature and humidity monitoring, and Ethernet-based mass sensor data high-speed linkage. The PD signal for vacuum degree monitoring diagnosis, which is a large amount of high-speed sensing data among multiple sensor data, was sampled with 256 data per cycle (6 Hz, 16.7 ms).
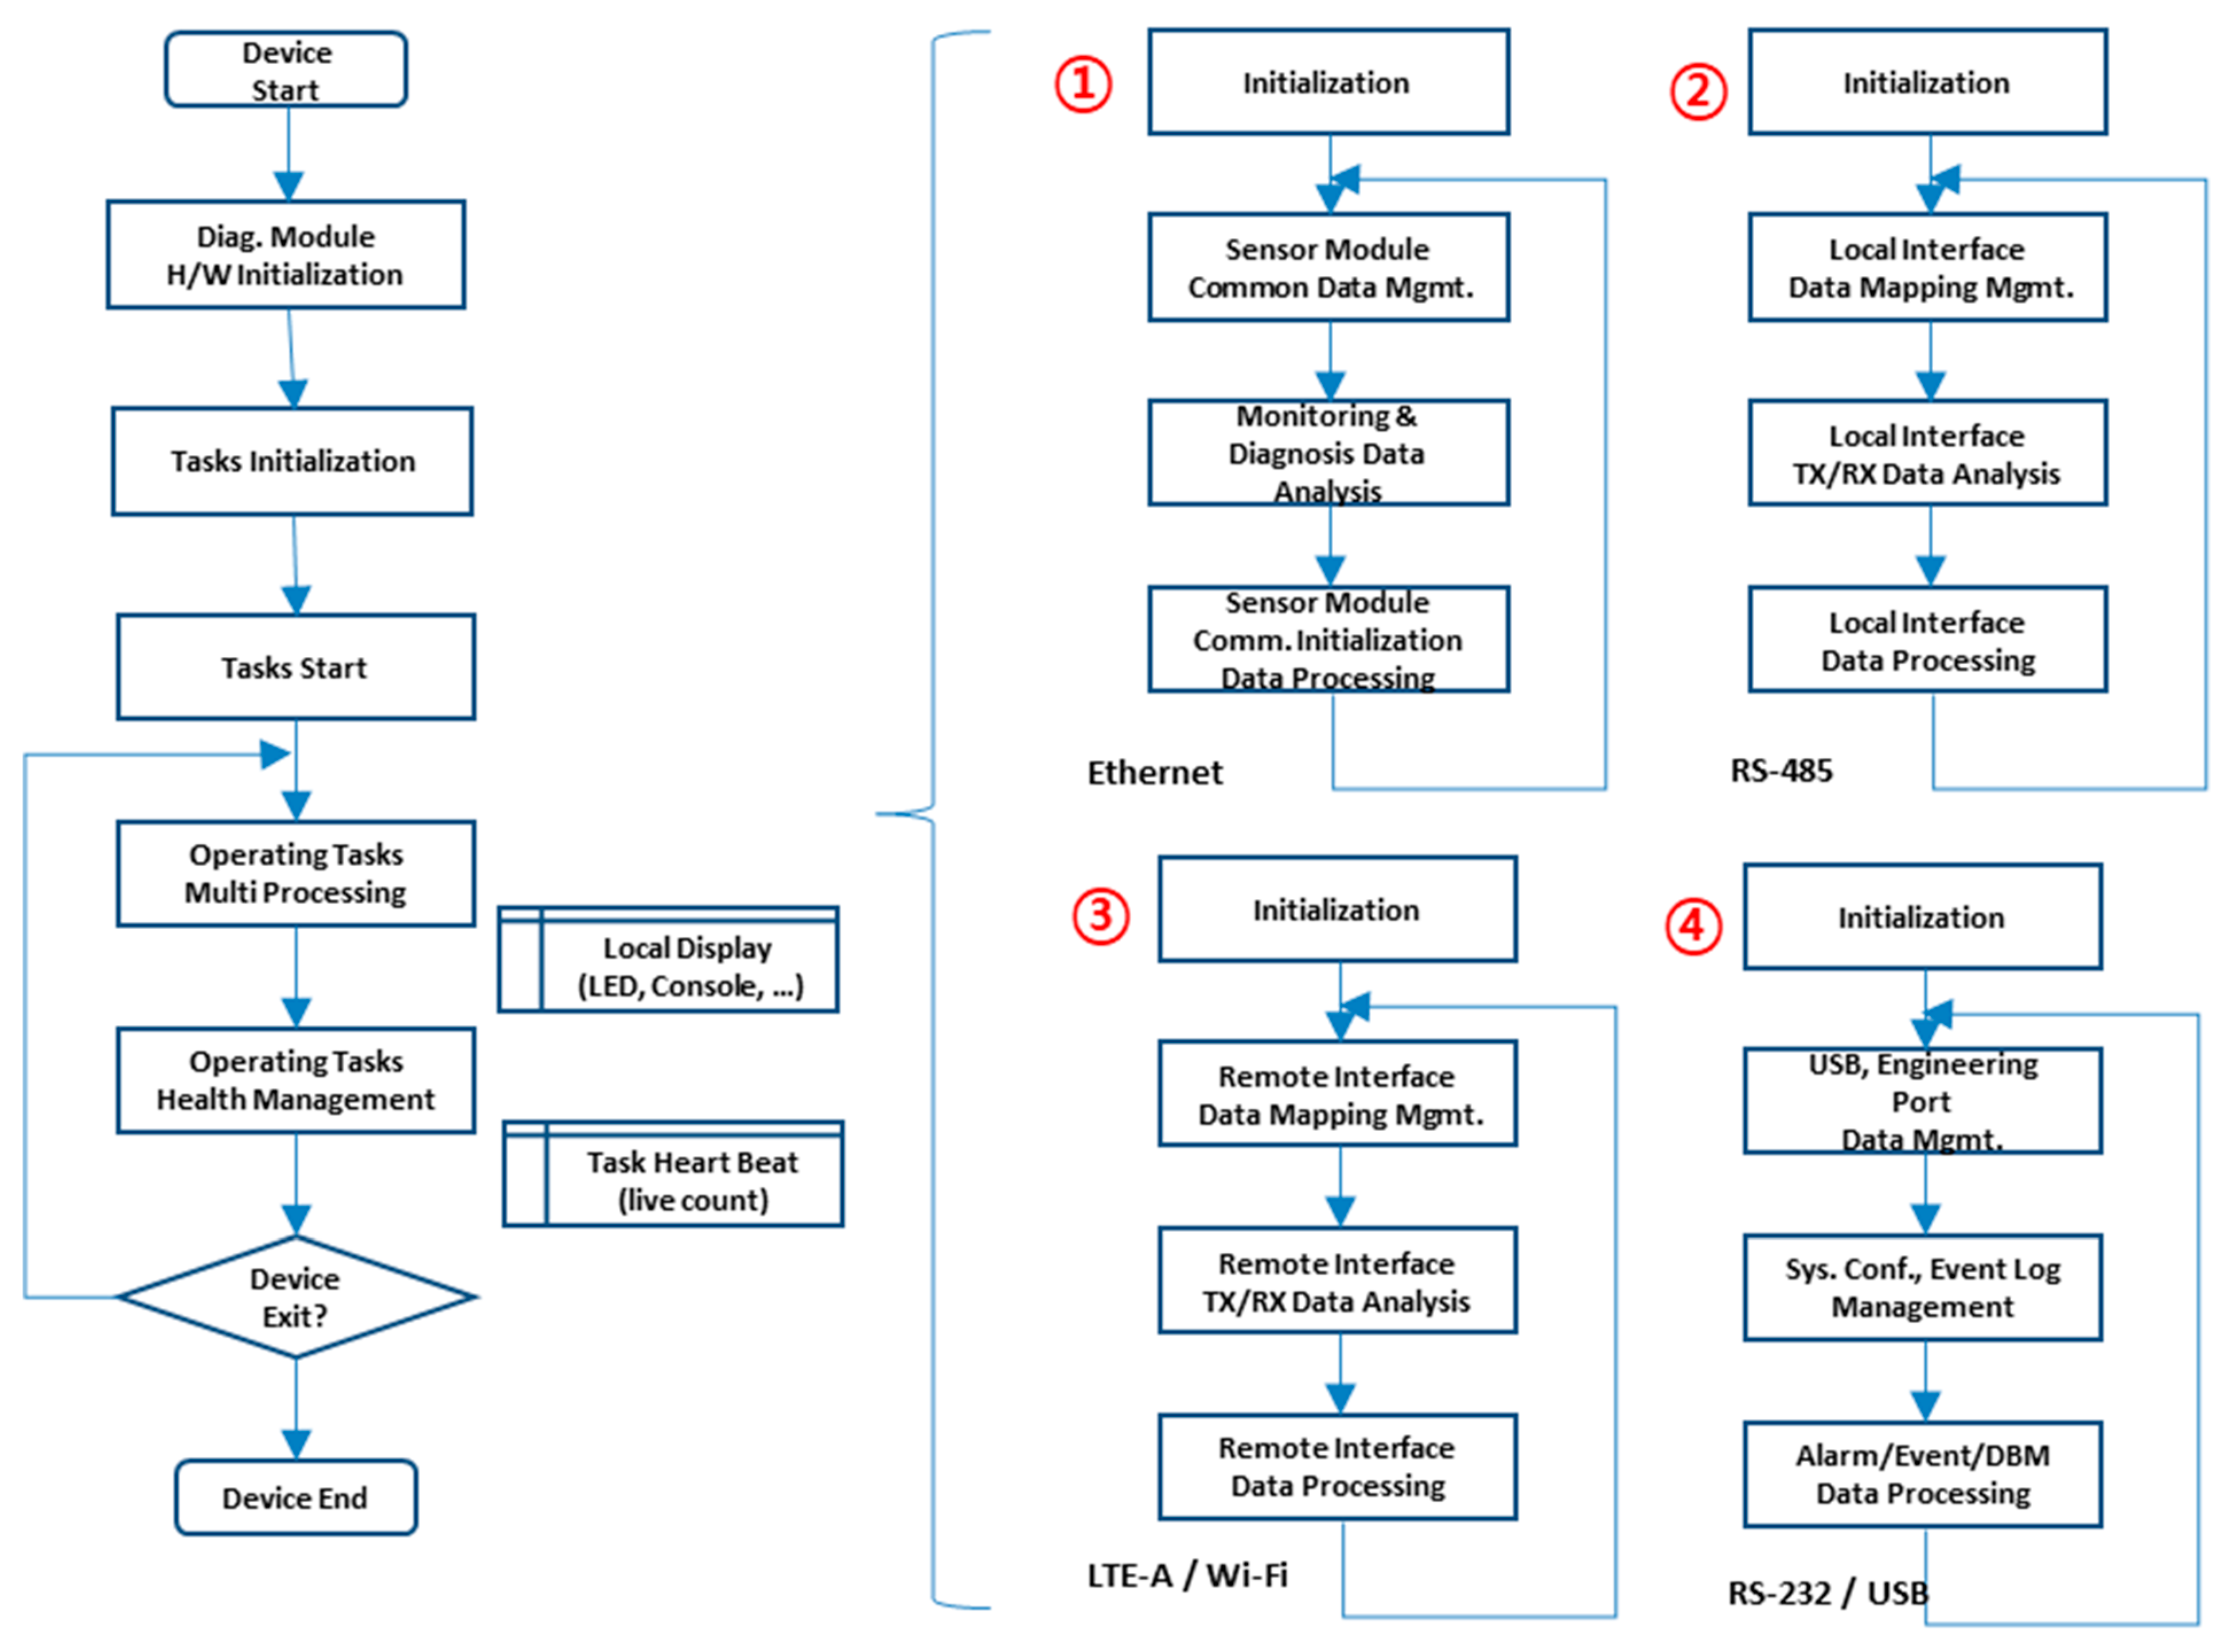
The monitoring and diagnostic process of the sensor module is shown in Figure 5. It consists of not only sampling data processing but also a monitoring and diagnosis process linked to a sensor module and various external linkage processes.

4. Computer Simulation

4.1. Simulation Using Wind Power Generation Big Data

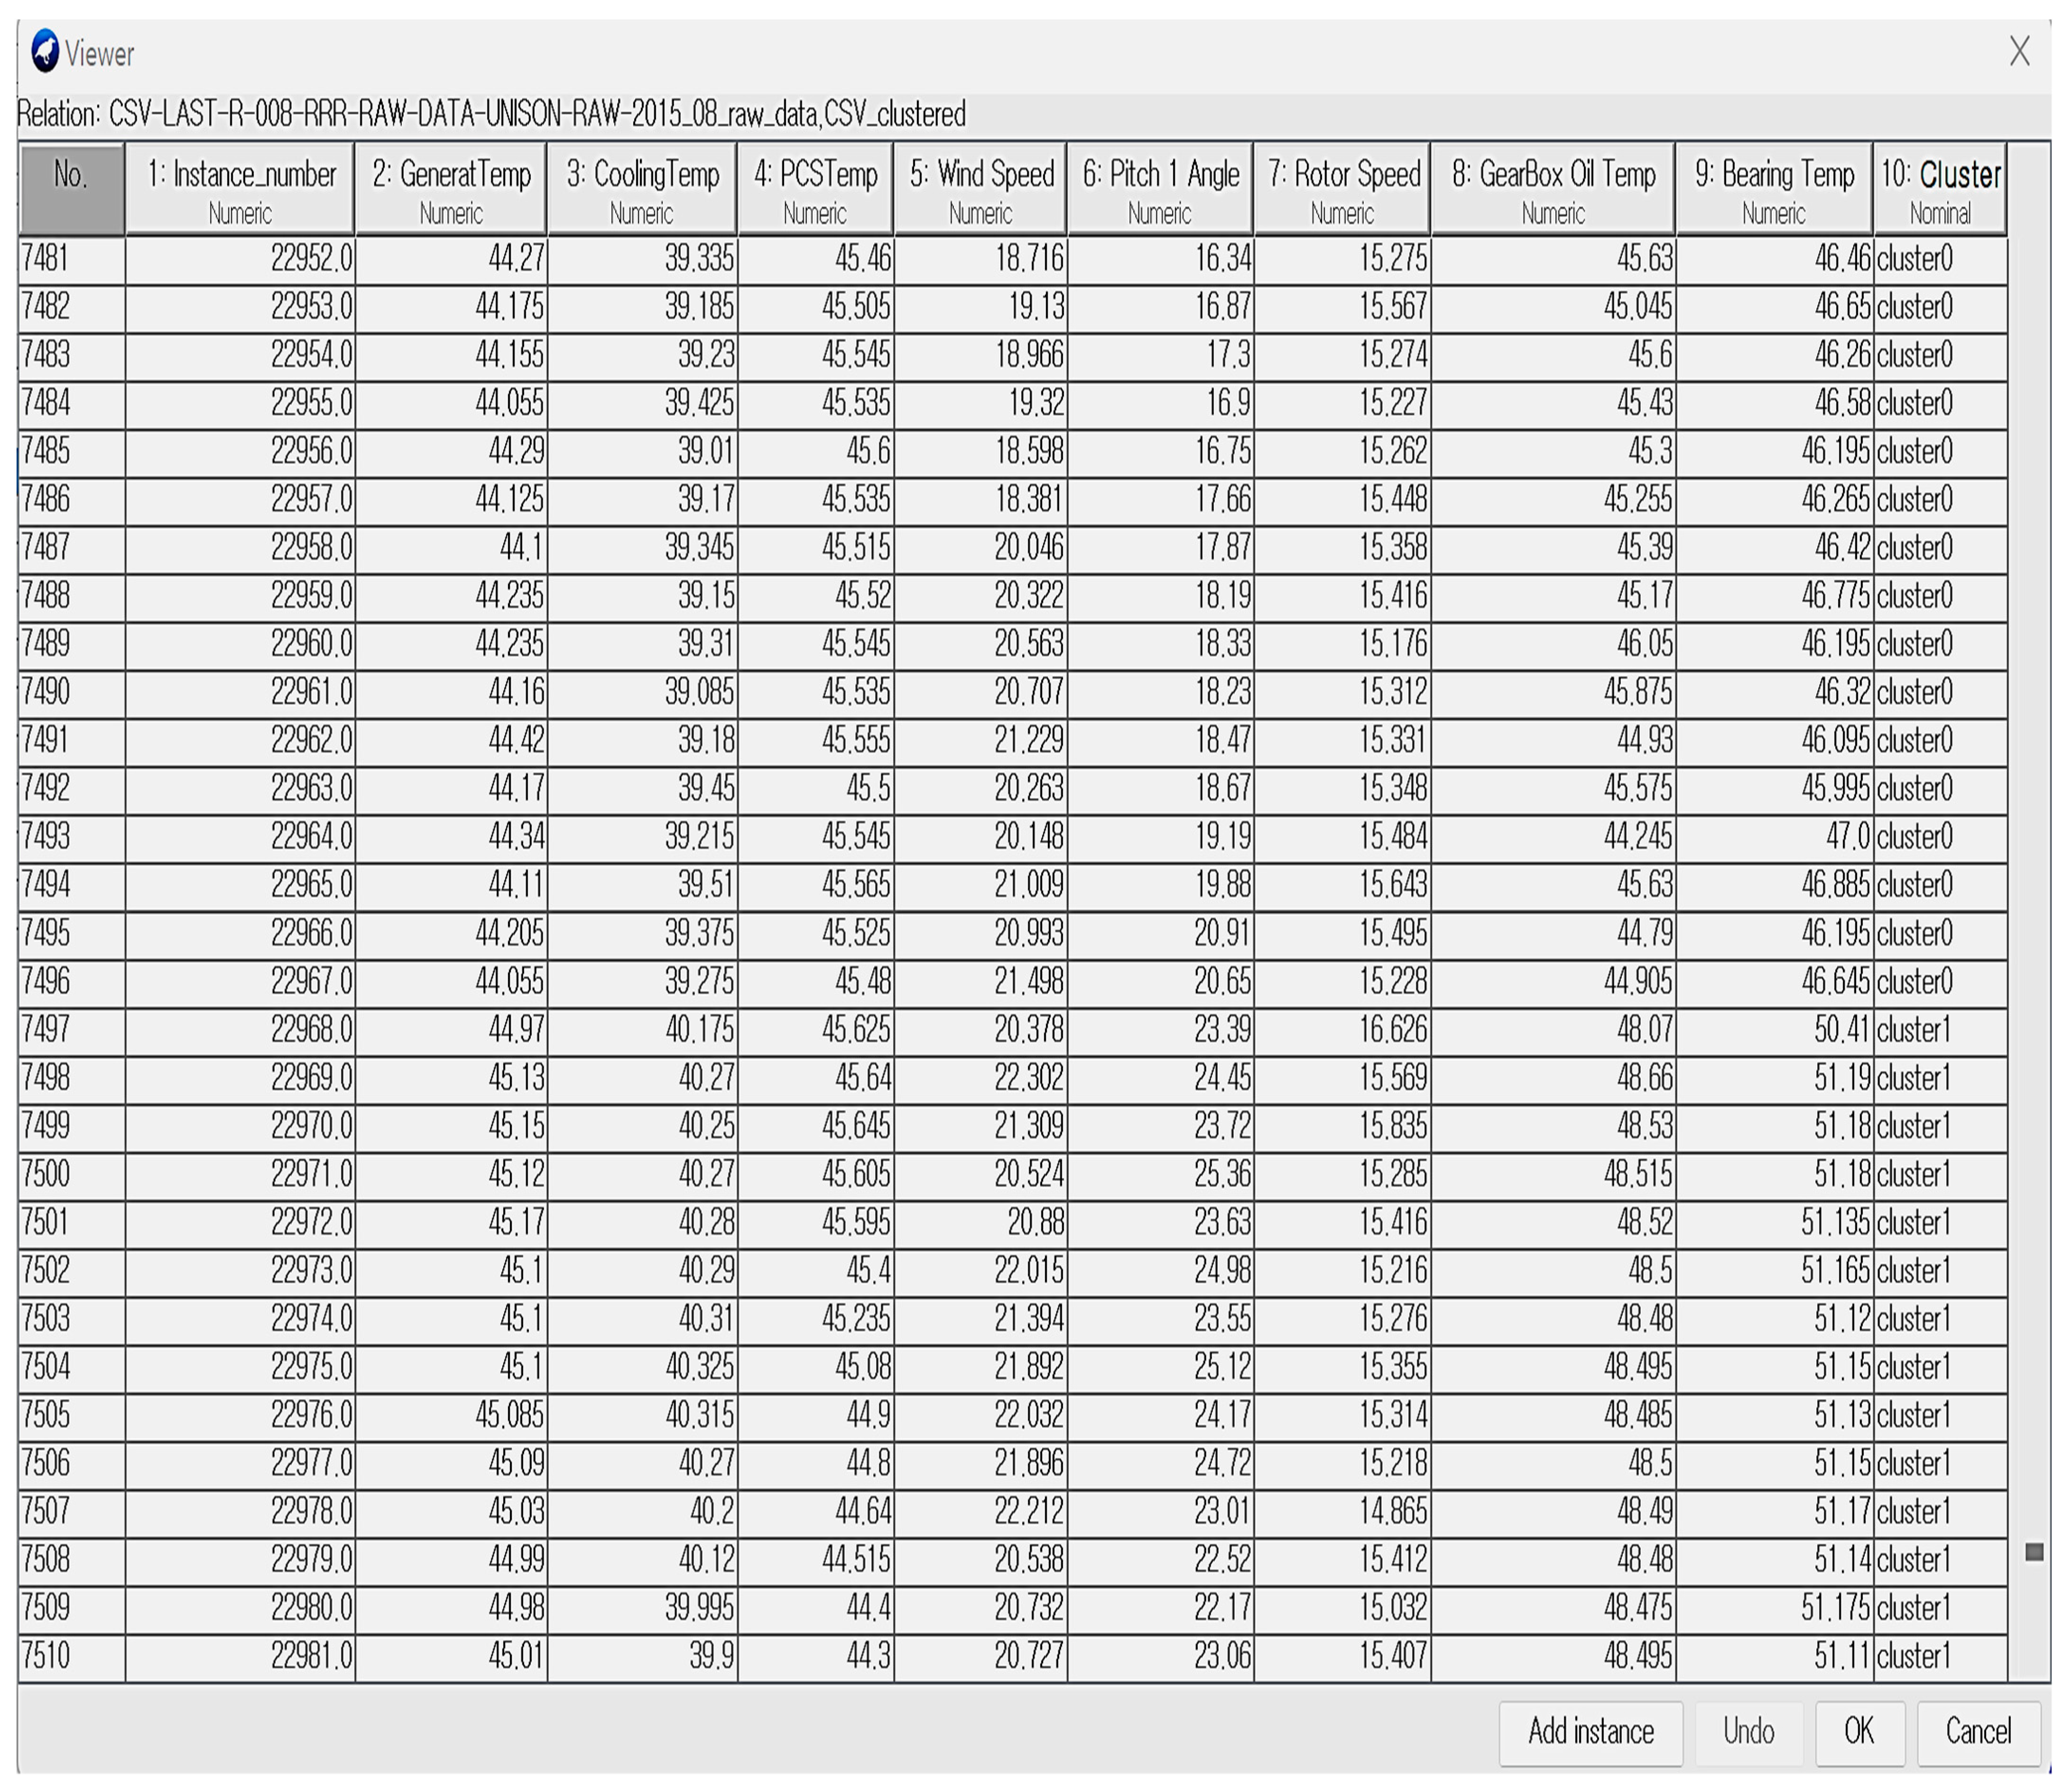
In order for the wind turbine to show maximum efficiency, the rotating surface of the blade and the wind must be at right angle. To this end, a pitch control technology is required that can control the angle of the wing depending on the strength and direction of the wind. In recent years, a method of adjusting the angle of the blade according to the strength of the wind has been commercialized. In addition, in order to maximize the efficiency of wind power generation, it is necessary to have a control technology that takes into account the speed of the wind and the direction of the wind. Accordingly, a computer simulation was performed that could optimally control the angle of the blade according to the speed and direction of the wind. To this end, UNISON Co., Ltd. used 23,000 wind power big data as of 2015. (See Figure 6).
Based on the results of wind power generation big data analysis, nine types of wind power generator fire hazard analysis parameters were derived, as shown in Table 2.
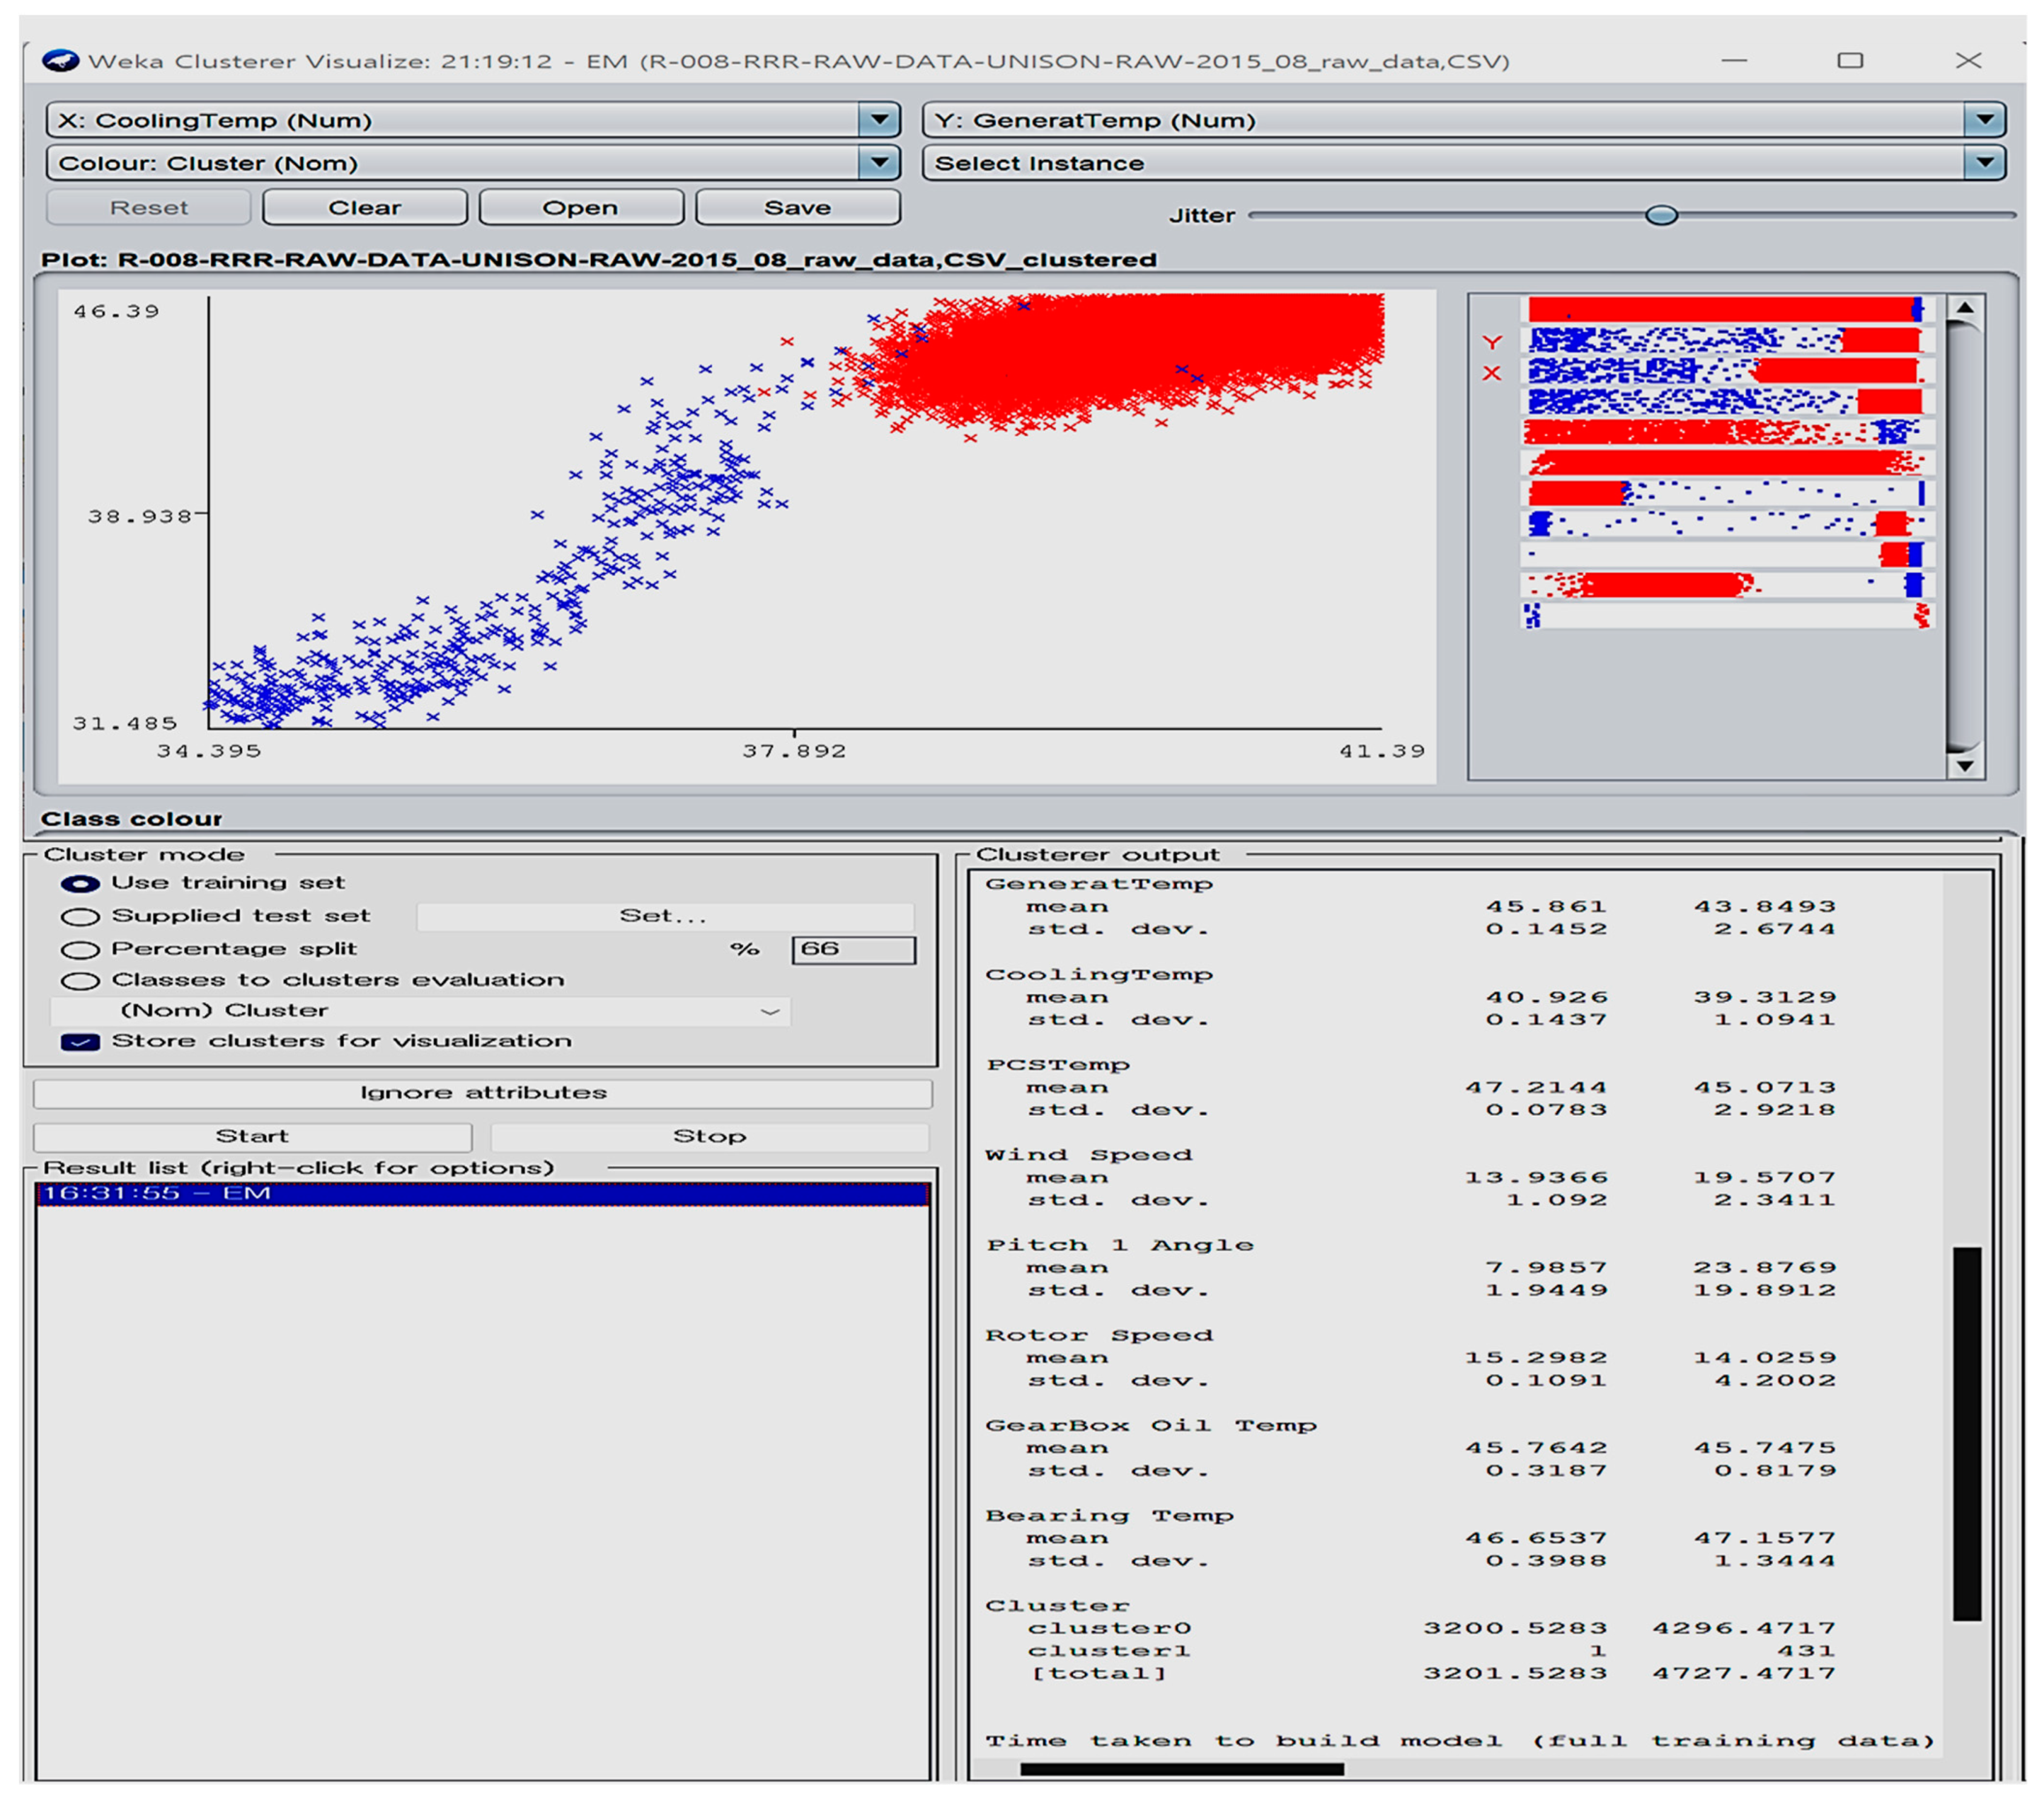
Based on the fire hazard analysis parameters, the cluster analysis results of the wind turbine accident risk analysis data are shown in Figure 7. When the fan temperature was below 37 °C and the generator temperature was below 43 °C, it was classified as a normal group, and when the respective temperature was higher than the number, it was classified as a risk group.
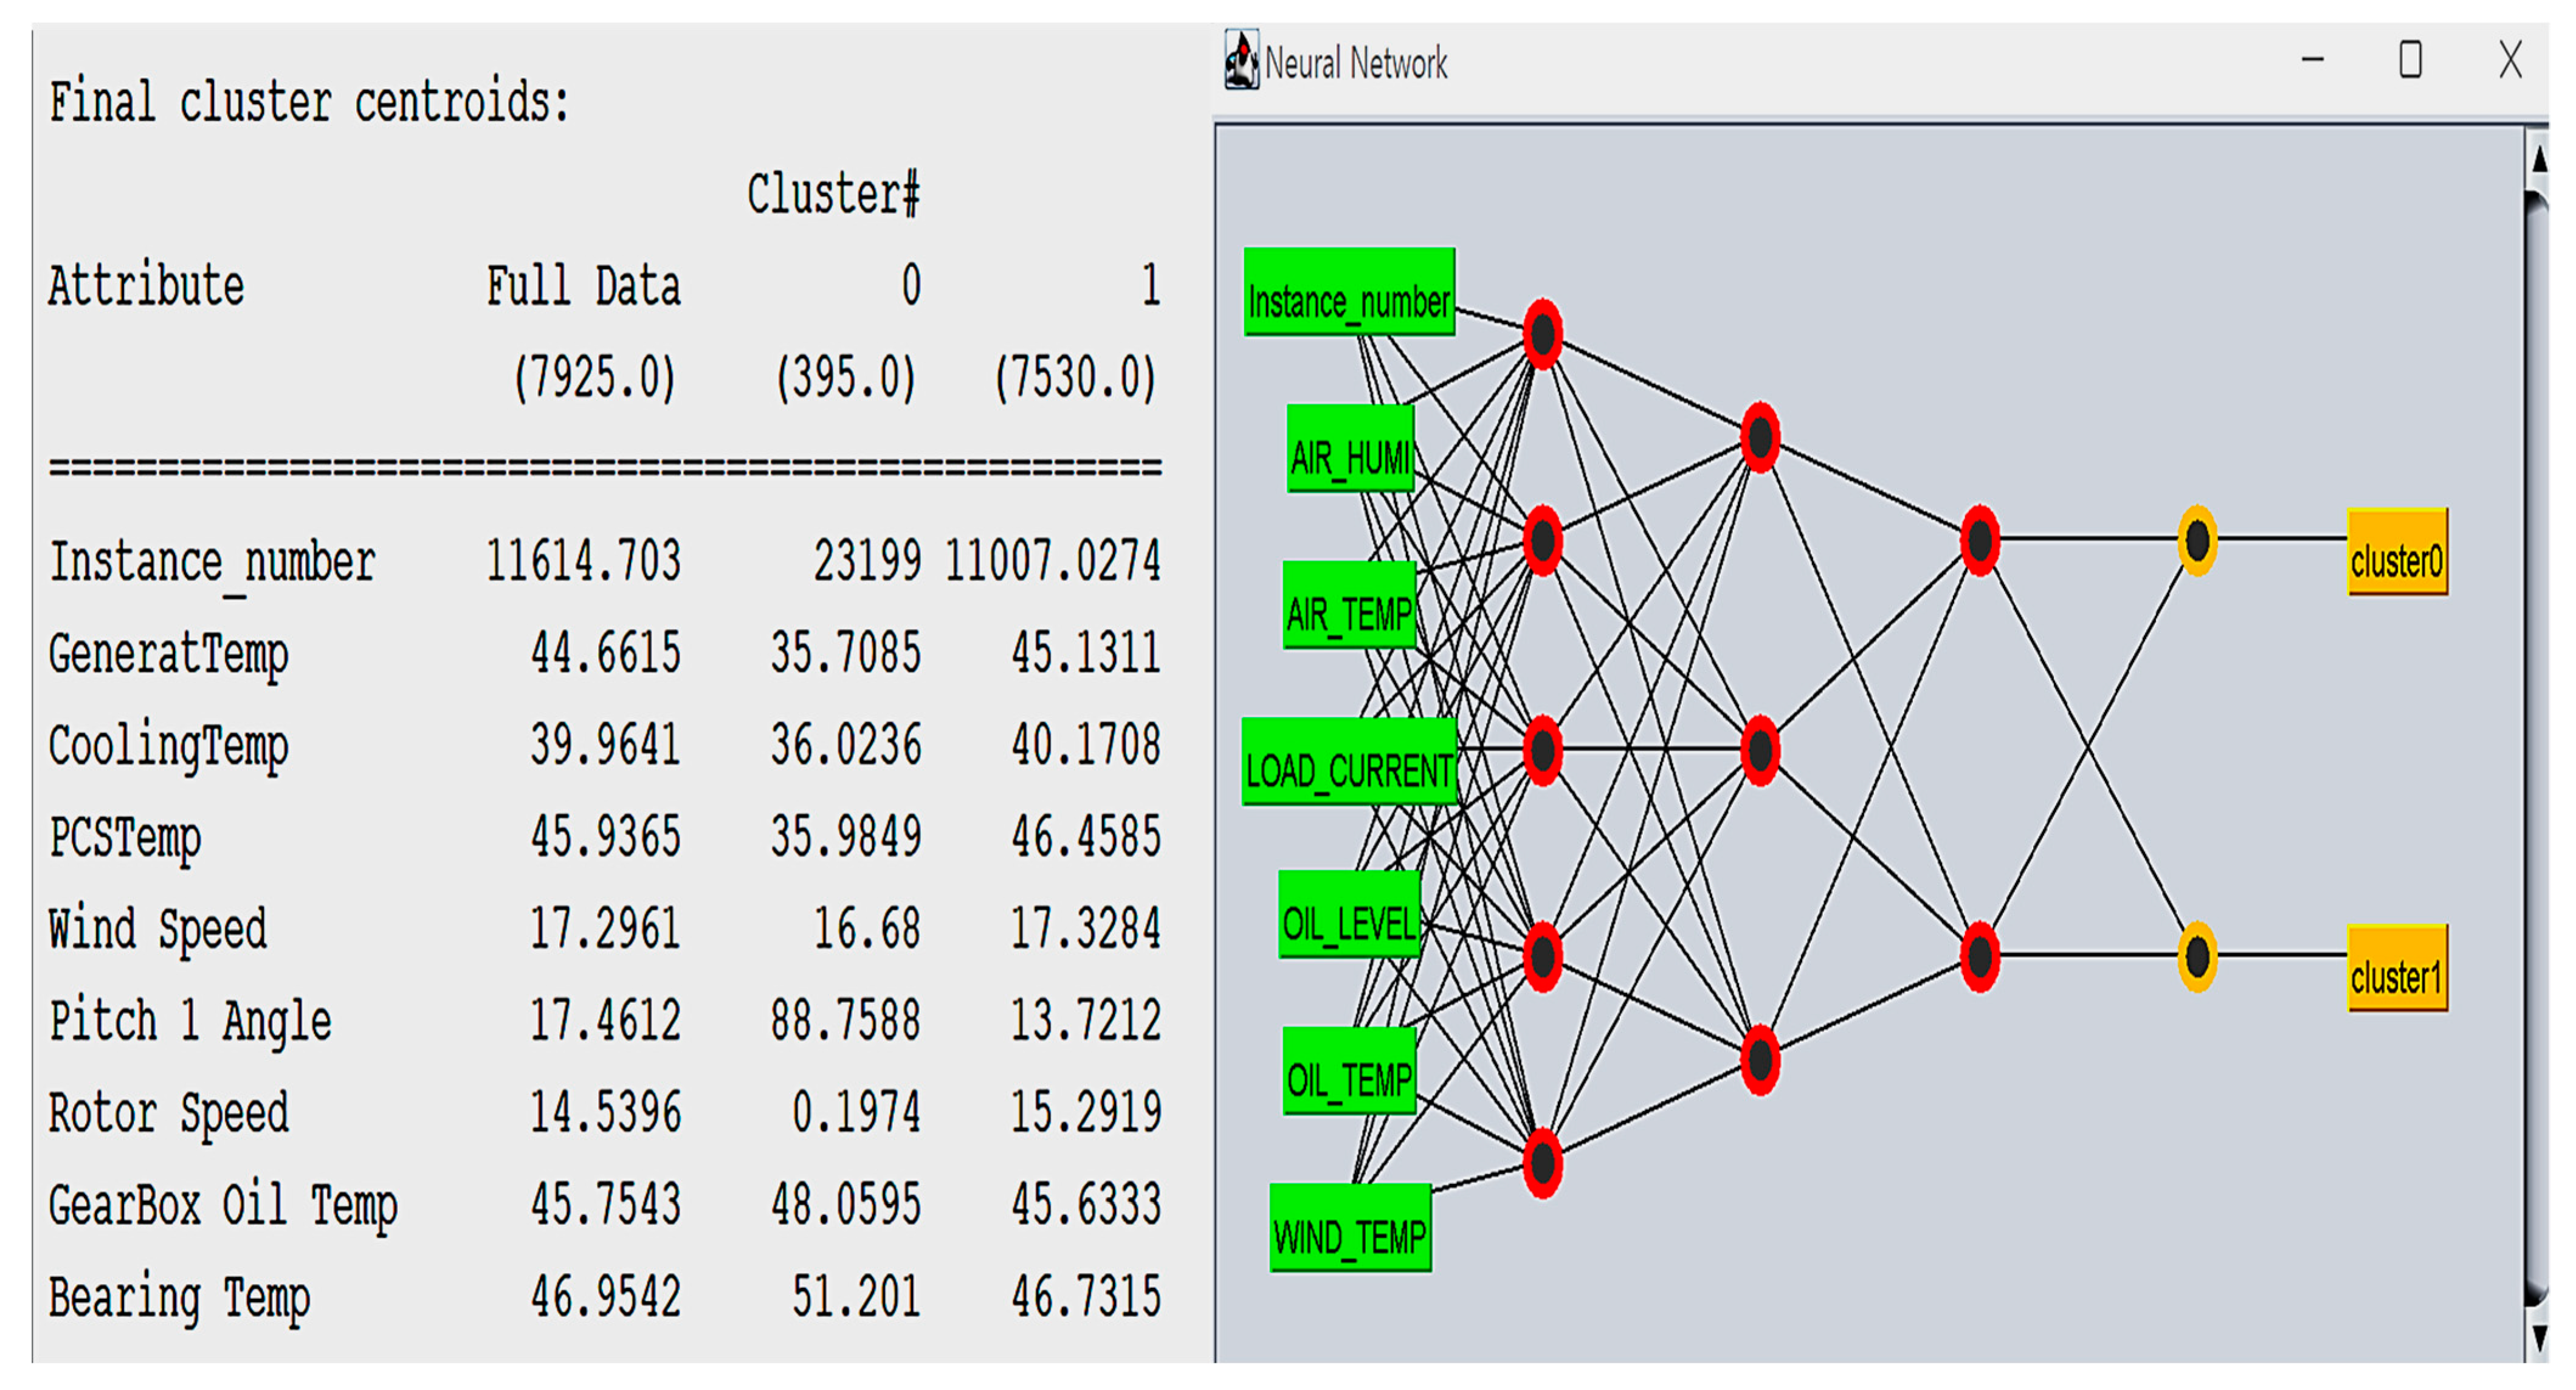
The results of the analysis of wind turbine accident risk factors based on the cluster analysis results are shown in Figure 8. As a result of the simulation, the average temperature of the generator was classified as 35.7085 °C in the normal group and 45.1311 °C in the risk group, and the PCS temperature was classified as 35.9849 °C in the normal group and 46.4585 °C in the risk group.
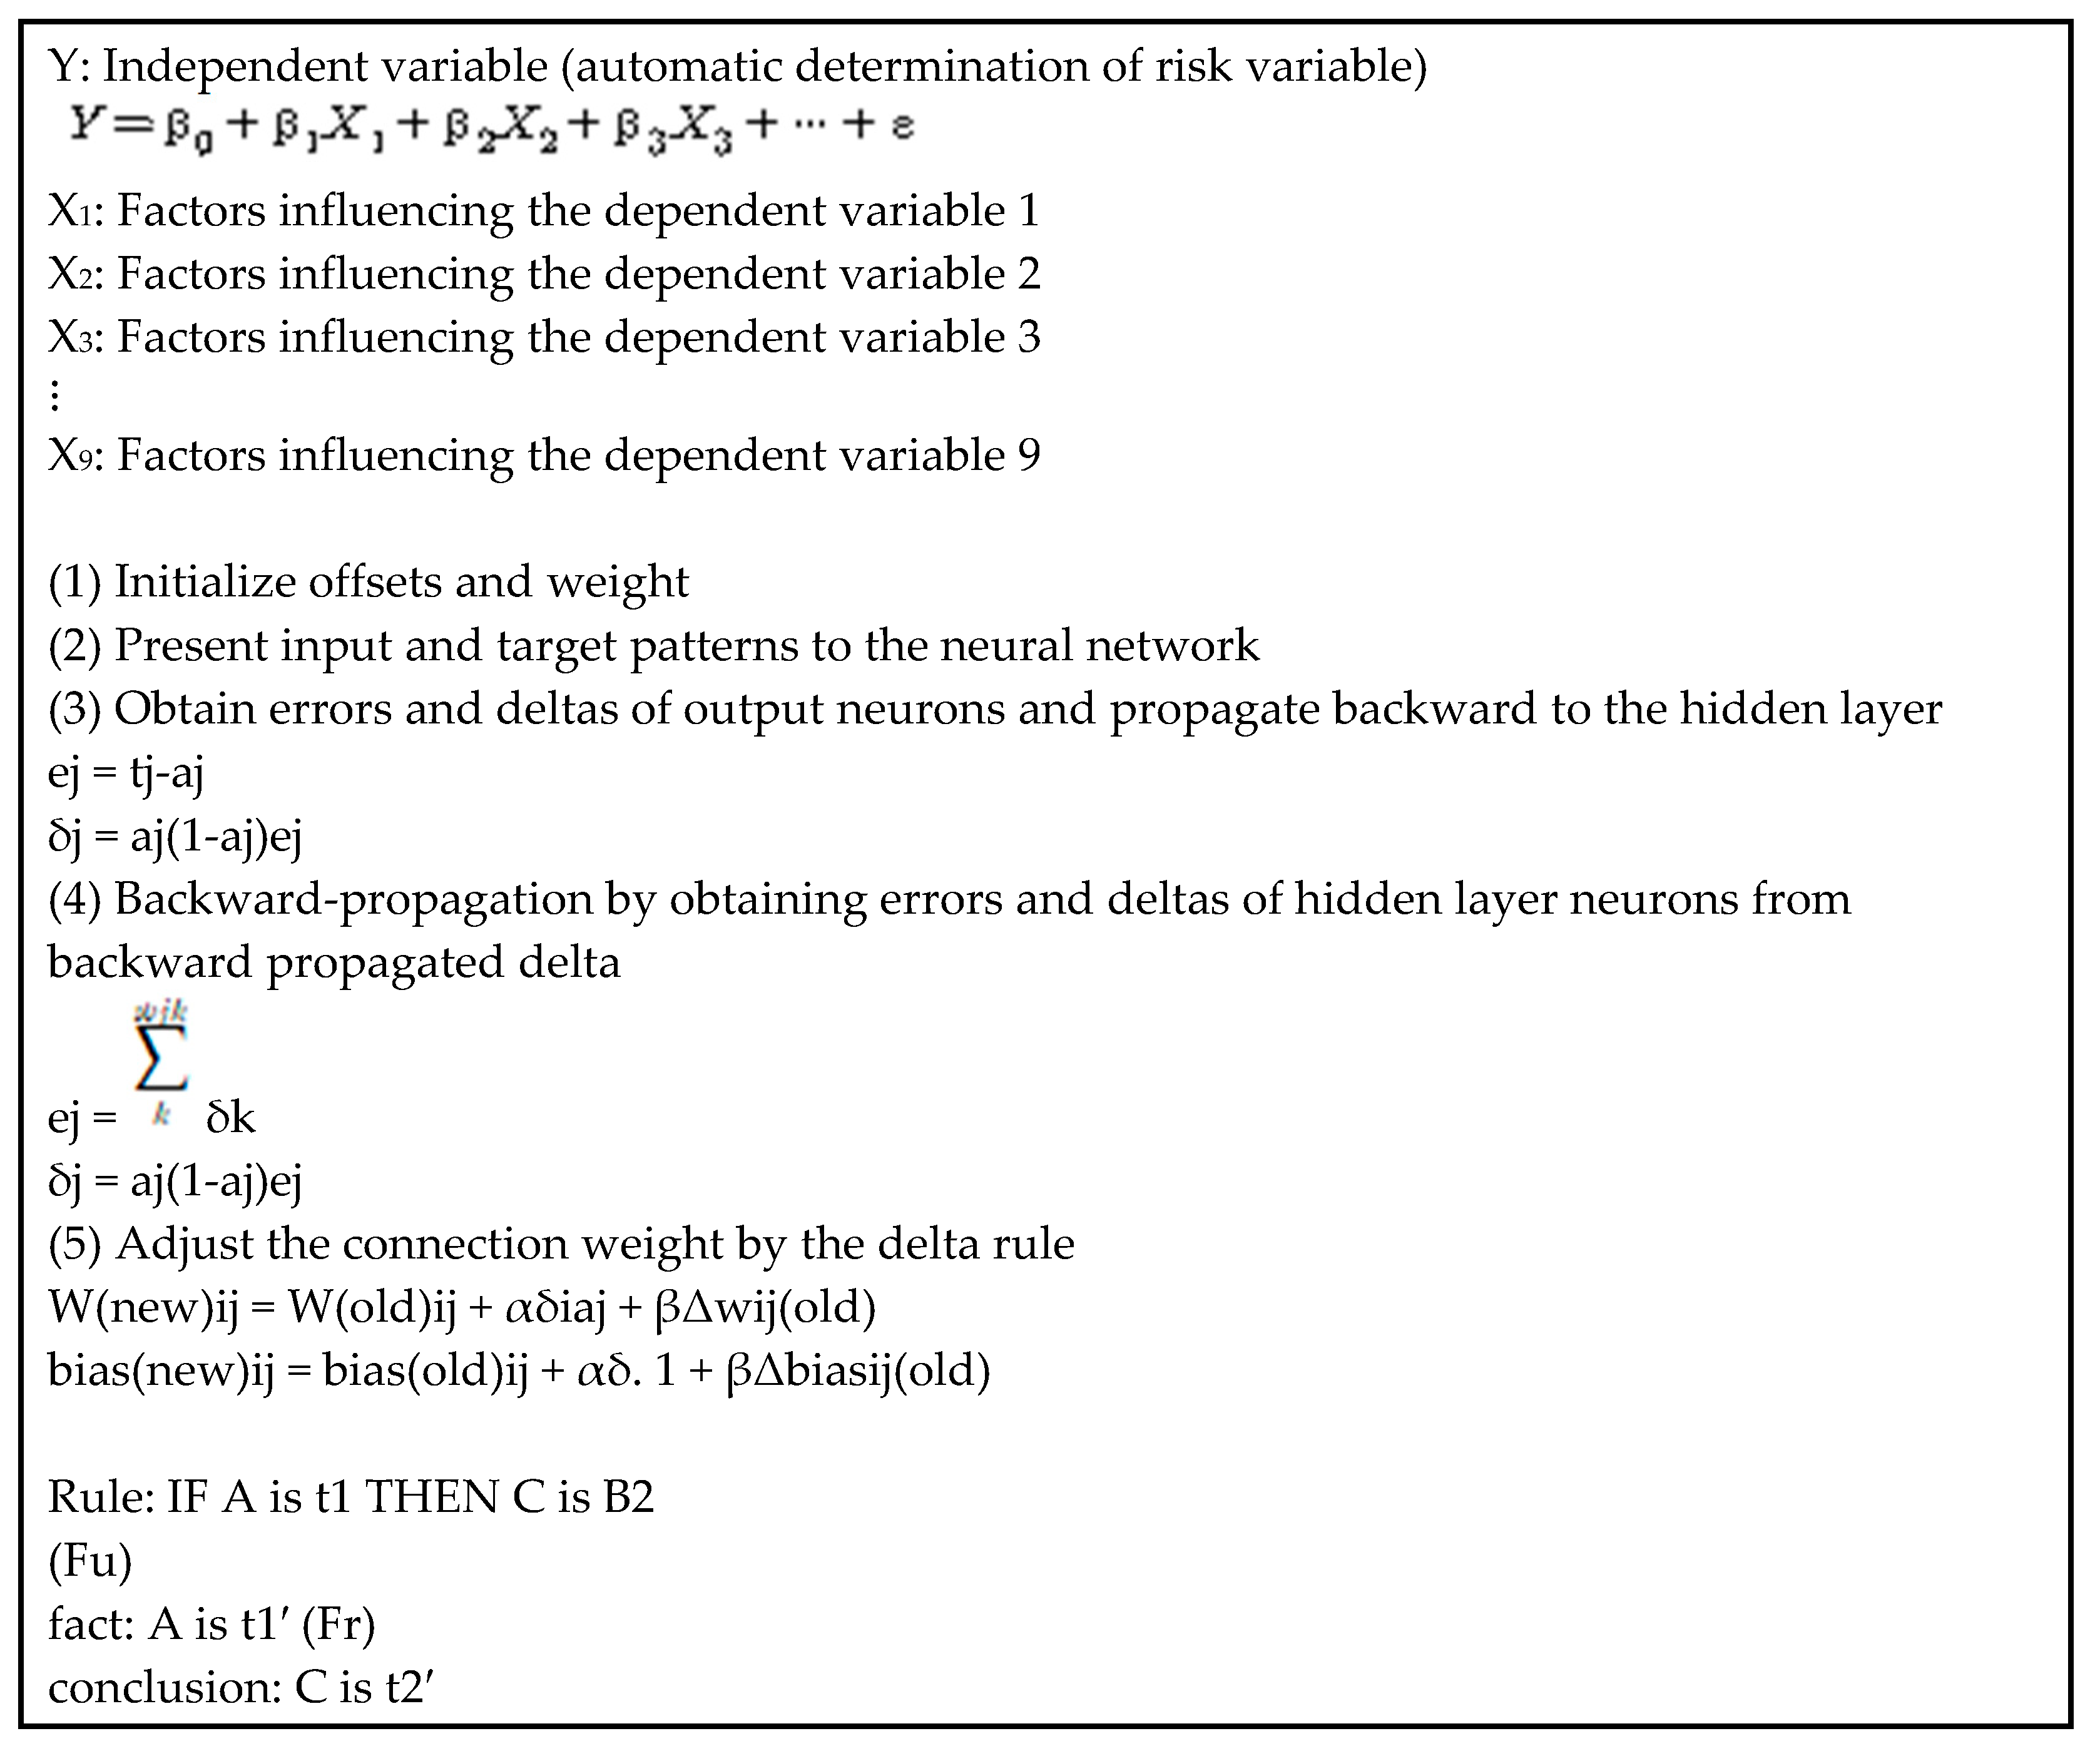
For the analysis of wind turbine accident risk factors, a neural network-based wind turbine risk judgment algorithm as shown in Figure 9 was used, which can analyze the optimal blade length and angle according to frequently changing weather conditions by applying the fuzzy rule [10,11,17,18].
Wind turbines can experience catastrophic failures, such as blade breakage, in the event of sudden weather changes or gusty winds. Therefore, in order to maximize electric energy, optimal pitch control considering the speed of the wind, optimal yaw control considering the direction of the wind, and Stall control technology that can protect the wind generator from excessive output due to strong winds or gusts are required. Pitch control has the disadvantage of being complicated and expensive to install, but it allows the blade angle to be adjusted according to the wind speed to produce optimal electric energy. Yaw control rotates the nacelle in the direction of the wind in accordance with the direction of the wind, allowing optimal electrical energy to be produced. In this study, a simulation was performed to improve the maximum efficiency of wind power generation by minimizing the wind angle/pitch control error/wind direction/yaw control error of the wind power generator using the fuzzy control theory shown in Table 3.
The pitch controlled quantization step value and the yaw control quantization step value, which can maximize the electricity output of the wind generator according to the wind strength, are shown in Table 4 and Table 5, respectively.
The fuzzy rules used in this study are as follows:
(RULE 1)IF WDS IS PB
AND DRV IS NS
THEN OPT IS PB
(RULE 2)IF WDS IS PB
AND DRV IS NM
THEN OPT IS PM
(RULE 3)IF WDS IS PS
AND DRV IS NS
THEN OPT IS PS
WDS: wind angle pitch control error
DRV: wind direction yaw control error
OPRG: optimal wind power efficiency
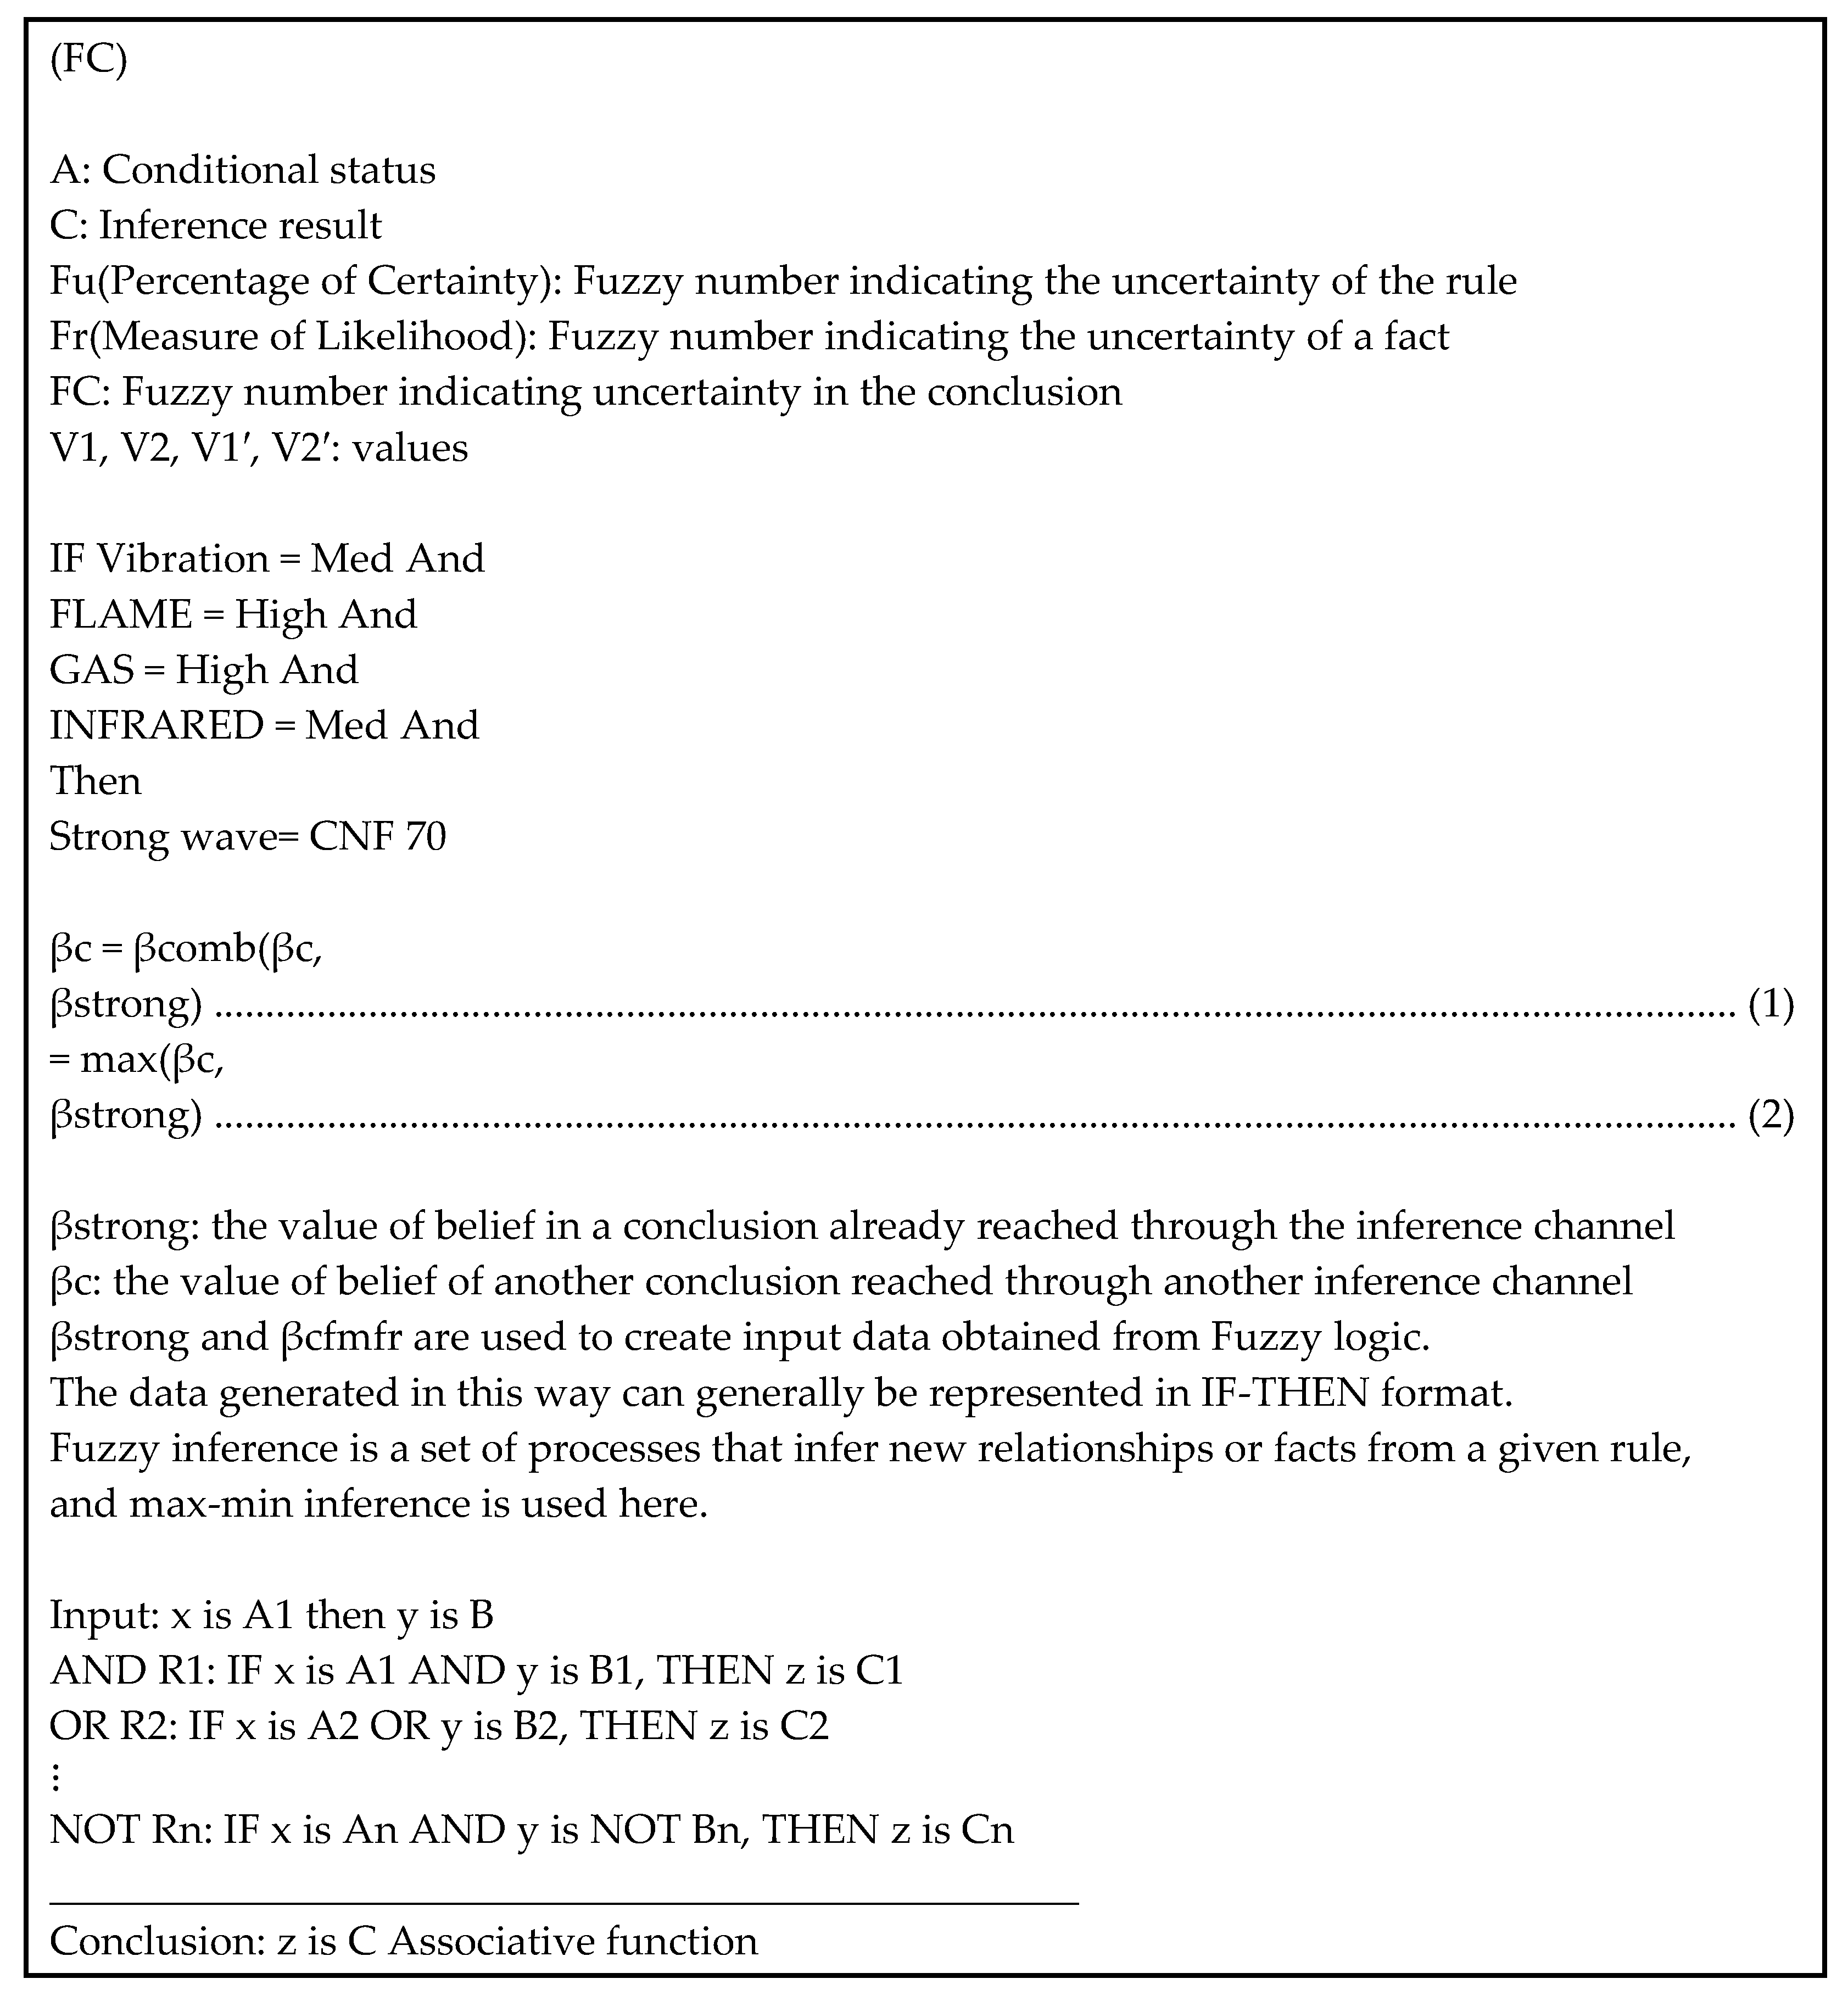
The results of comparative analysis of the empirical data of wind turbine fire prevention applying the fuzzy rule based on pitch control and yaw control are shown in Table 6. This is the result of a comparative analysis using an algorithm that analyzes fire prevention demonstration big data and the result of a comparative analysis of the fire hazard inference AI method based on the abnormal vibration frequency method and the fire accident risk inference method of the existing method that does not use the abnormal vibration frequency method.
As a result of the simulation, it was confirmed that the AI method using the abnormal vibration frequency method has a higher probability of predicting the risk of fire accidents by more than 25% than the existing methods. The standard for determining the fire hazard of a wind power generator is the number of HIGH levels, which indicates the grade of generator temperature, cooling fan temperature, bearing temperature, gearbox temperature, oil level, danger value, abnormal vibration frequency, etc.: (i) 3 or more, the risk of fire accidents is high; (ii) 2~3 is normal; and (iii) 1~2 is slightly dangerous. Such an algorithm has a problem that the reliability of predicting the risk of fire accidents is not very high—about 60%. In order to solve these problems, a hypothesis was established to judge the occurrence of fire through a vibration sensor in consideration of the probability of fire occurrence of 75~85% or more when the bearings inside the wind turbine nacelle were worn, and a simulation was performed to determine the occurrence of fire early.
The wind turbine starts at a wind speed of 4 m/s and is set to automatically stop when it exceeds 25 m/s. When the wind speed is 5~24 m/s, the conventional wind power generator performs optimal control according to the if-else rule to increase power generation efficiency, so the optimal control efficiency decreases depending on the altitude, blade length, and wind direction change. There is a big difference in the efficiency of wind turbines installed at altitudes of 300 m or less, 300~600 m, and 600~1000 m. In addition, even under the condition that the wind speed is maintained at 10~20 m/s, there is a big difference in the optimal control efficiency value of the wind turbine when the blade length is different. The efficiency of wind turbines installed in places where the blade length is less than 50 m, 50~100 m, and more than 150 m also varies greatly. This is because the longer the blade length, the higher the optimal control value of the wind turbine. According to the wind direction conditions that change from time to time, the conventional wind turbine performs optimal control with the if-else rule to increase power generation efficiency, so there is a problem that the optimal control value of the wind generator is not significantly improved. The results of the comparative analysis of the optimal control of wind power generation based on fuzzy theory are shown in Table 7. This is the result of comparative analysis of the data efficiency of the optimal pitch control output based on the existing method without using the pitch control based on the fuzzy optimal control simulation and the inference method using the fuzzy control. In other words, as a result of the simulation using fuzzy inference, it was proved that the power production value of the fuzzy inference method was more than 30% higher than the optimal control method of the non-fuzzy method when considering altitude/blade length/wind direction.

4.2. Simulation Using Wind Weather Resource Maps

KHRWPRM (Korea’s High-Resolution Wind Power Resource Maps: A grid system map calculated using a numerical model, projecting information about Korea’s wind resources onto geospace) can determine the average annual wind distribution suitable for wind power generation. In this study, the average annual wind power distribution suitable for wind power generation was predicted using the average calculation data (resolution: 1 km) of the National Institute of Meteorological Sciences for the past 12 years (1998~2010) and KHRWPRM, which can calculate wind information at unobservable points. As a result, average wind speed/average daily maximum wind speed/main wind direction/main wind direction ratio at altitude of 80 m was predicted to be 3–25 m/s, 3–7 m/s, 7–13 m/s, and 13–25 m/s, respectively. However, there is a disadvantage in weather such as heavy rain, heavy snow, and typhoons, when wind speed, wind power, and wind density data change in real time, resulting in discrepancies between the expected and the actual observation data. In order to maximize power production, optimal control of wind angle and wind direction is required even when the wind strength and wind direction fluctuate due to sudden weather changes, or when the rotation speed of the blade changes according to the wind strength. To this end, KHRWPRM displaying the annual average wind speed, maximum instantaneous wind speed, and main wind direction value was used to grasp the basic information required for selecting a location for a wind farm. This was done by applying fuzzy control theory to perform computer simulations that could improve the maximum efficiency of wind turbines.
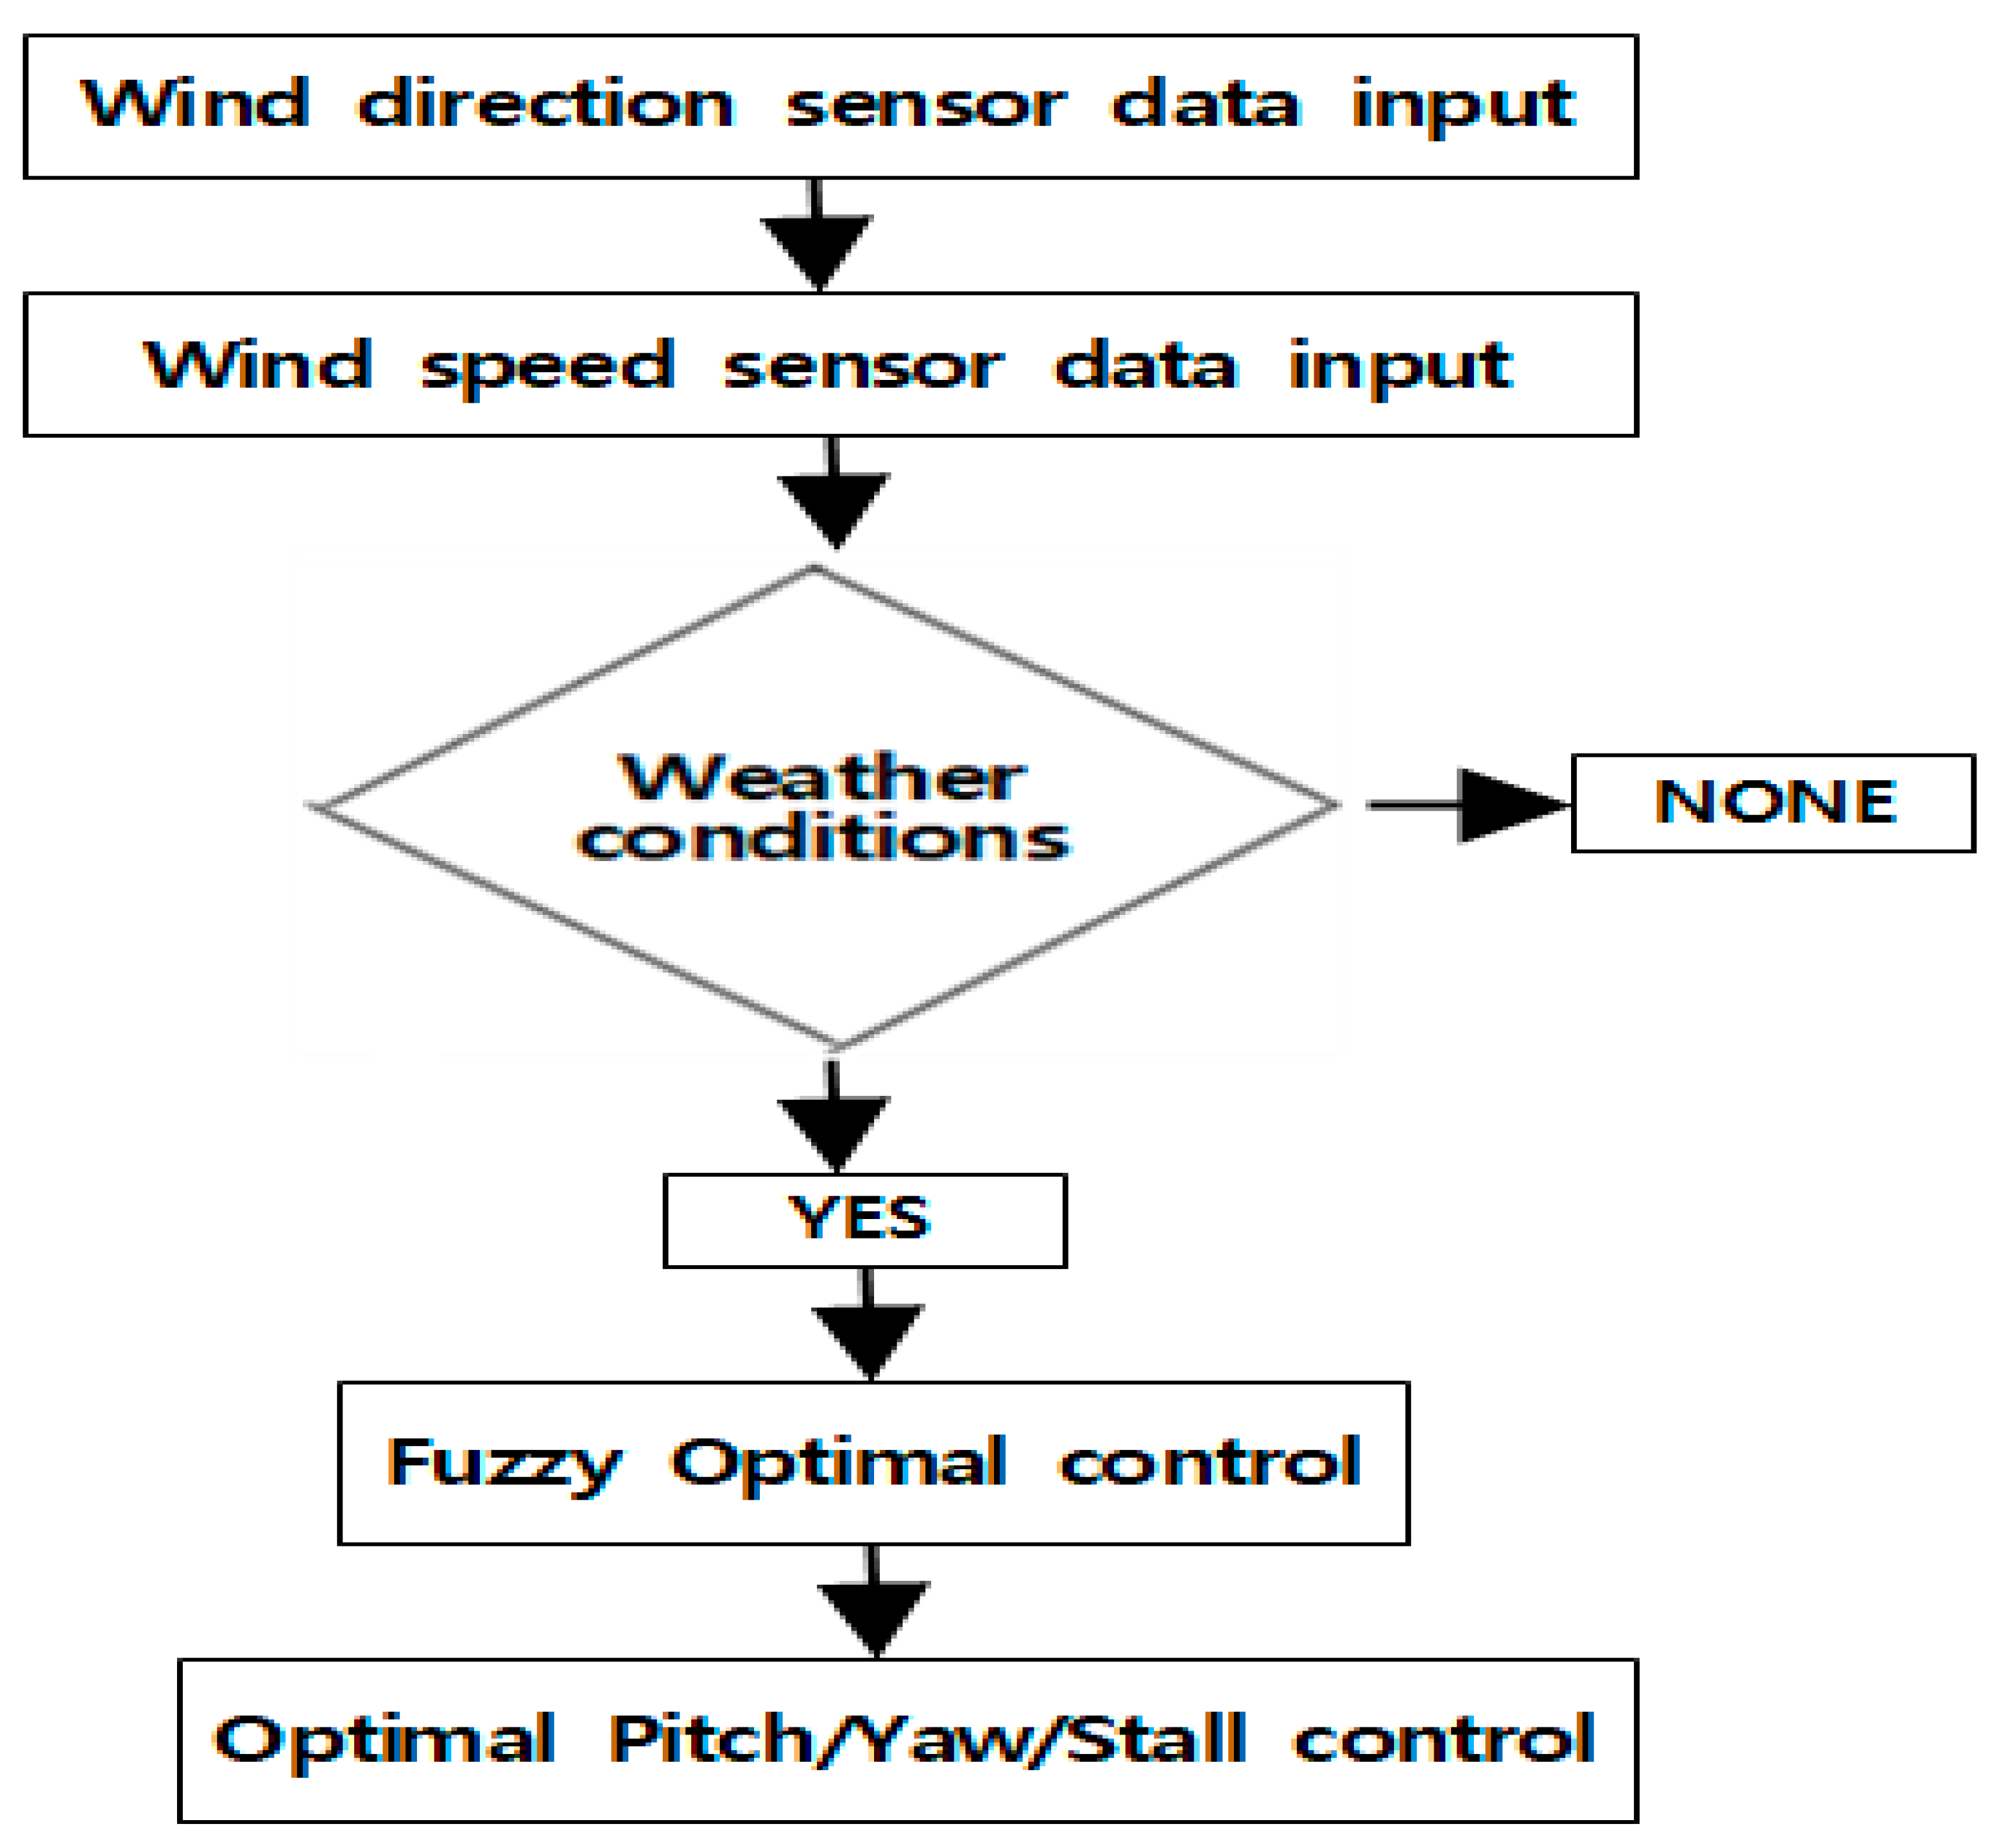
The optimal pitch control/yaw control/stall control process based on KHRWPRM is shown in Figure 10.
In order to obtain optimal wind power generation efficiency, the following control technology is required to adjust the magnitude of lift on the blade by properly controlling the angle of the blade according to the wind strength.
-
Less than 4 m/s: blade motor idling
-
4~8 m/s: Low-speed operation
-
8~13 m/s: Normal operation
-
13~25 m/s: Rated control operation
-
26~30 m/s or more (in case of typhoon or strong wind): Stall control that can protect the rotor by forcibly stopping the rotor
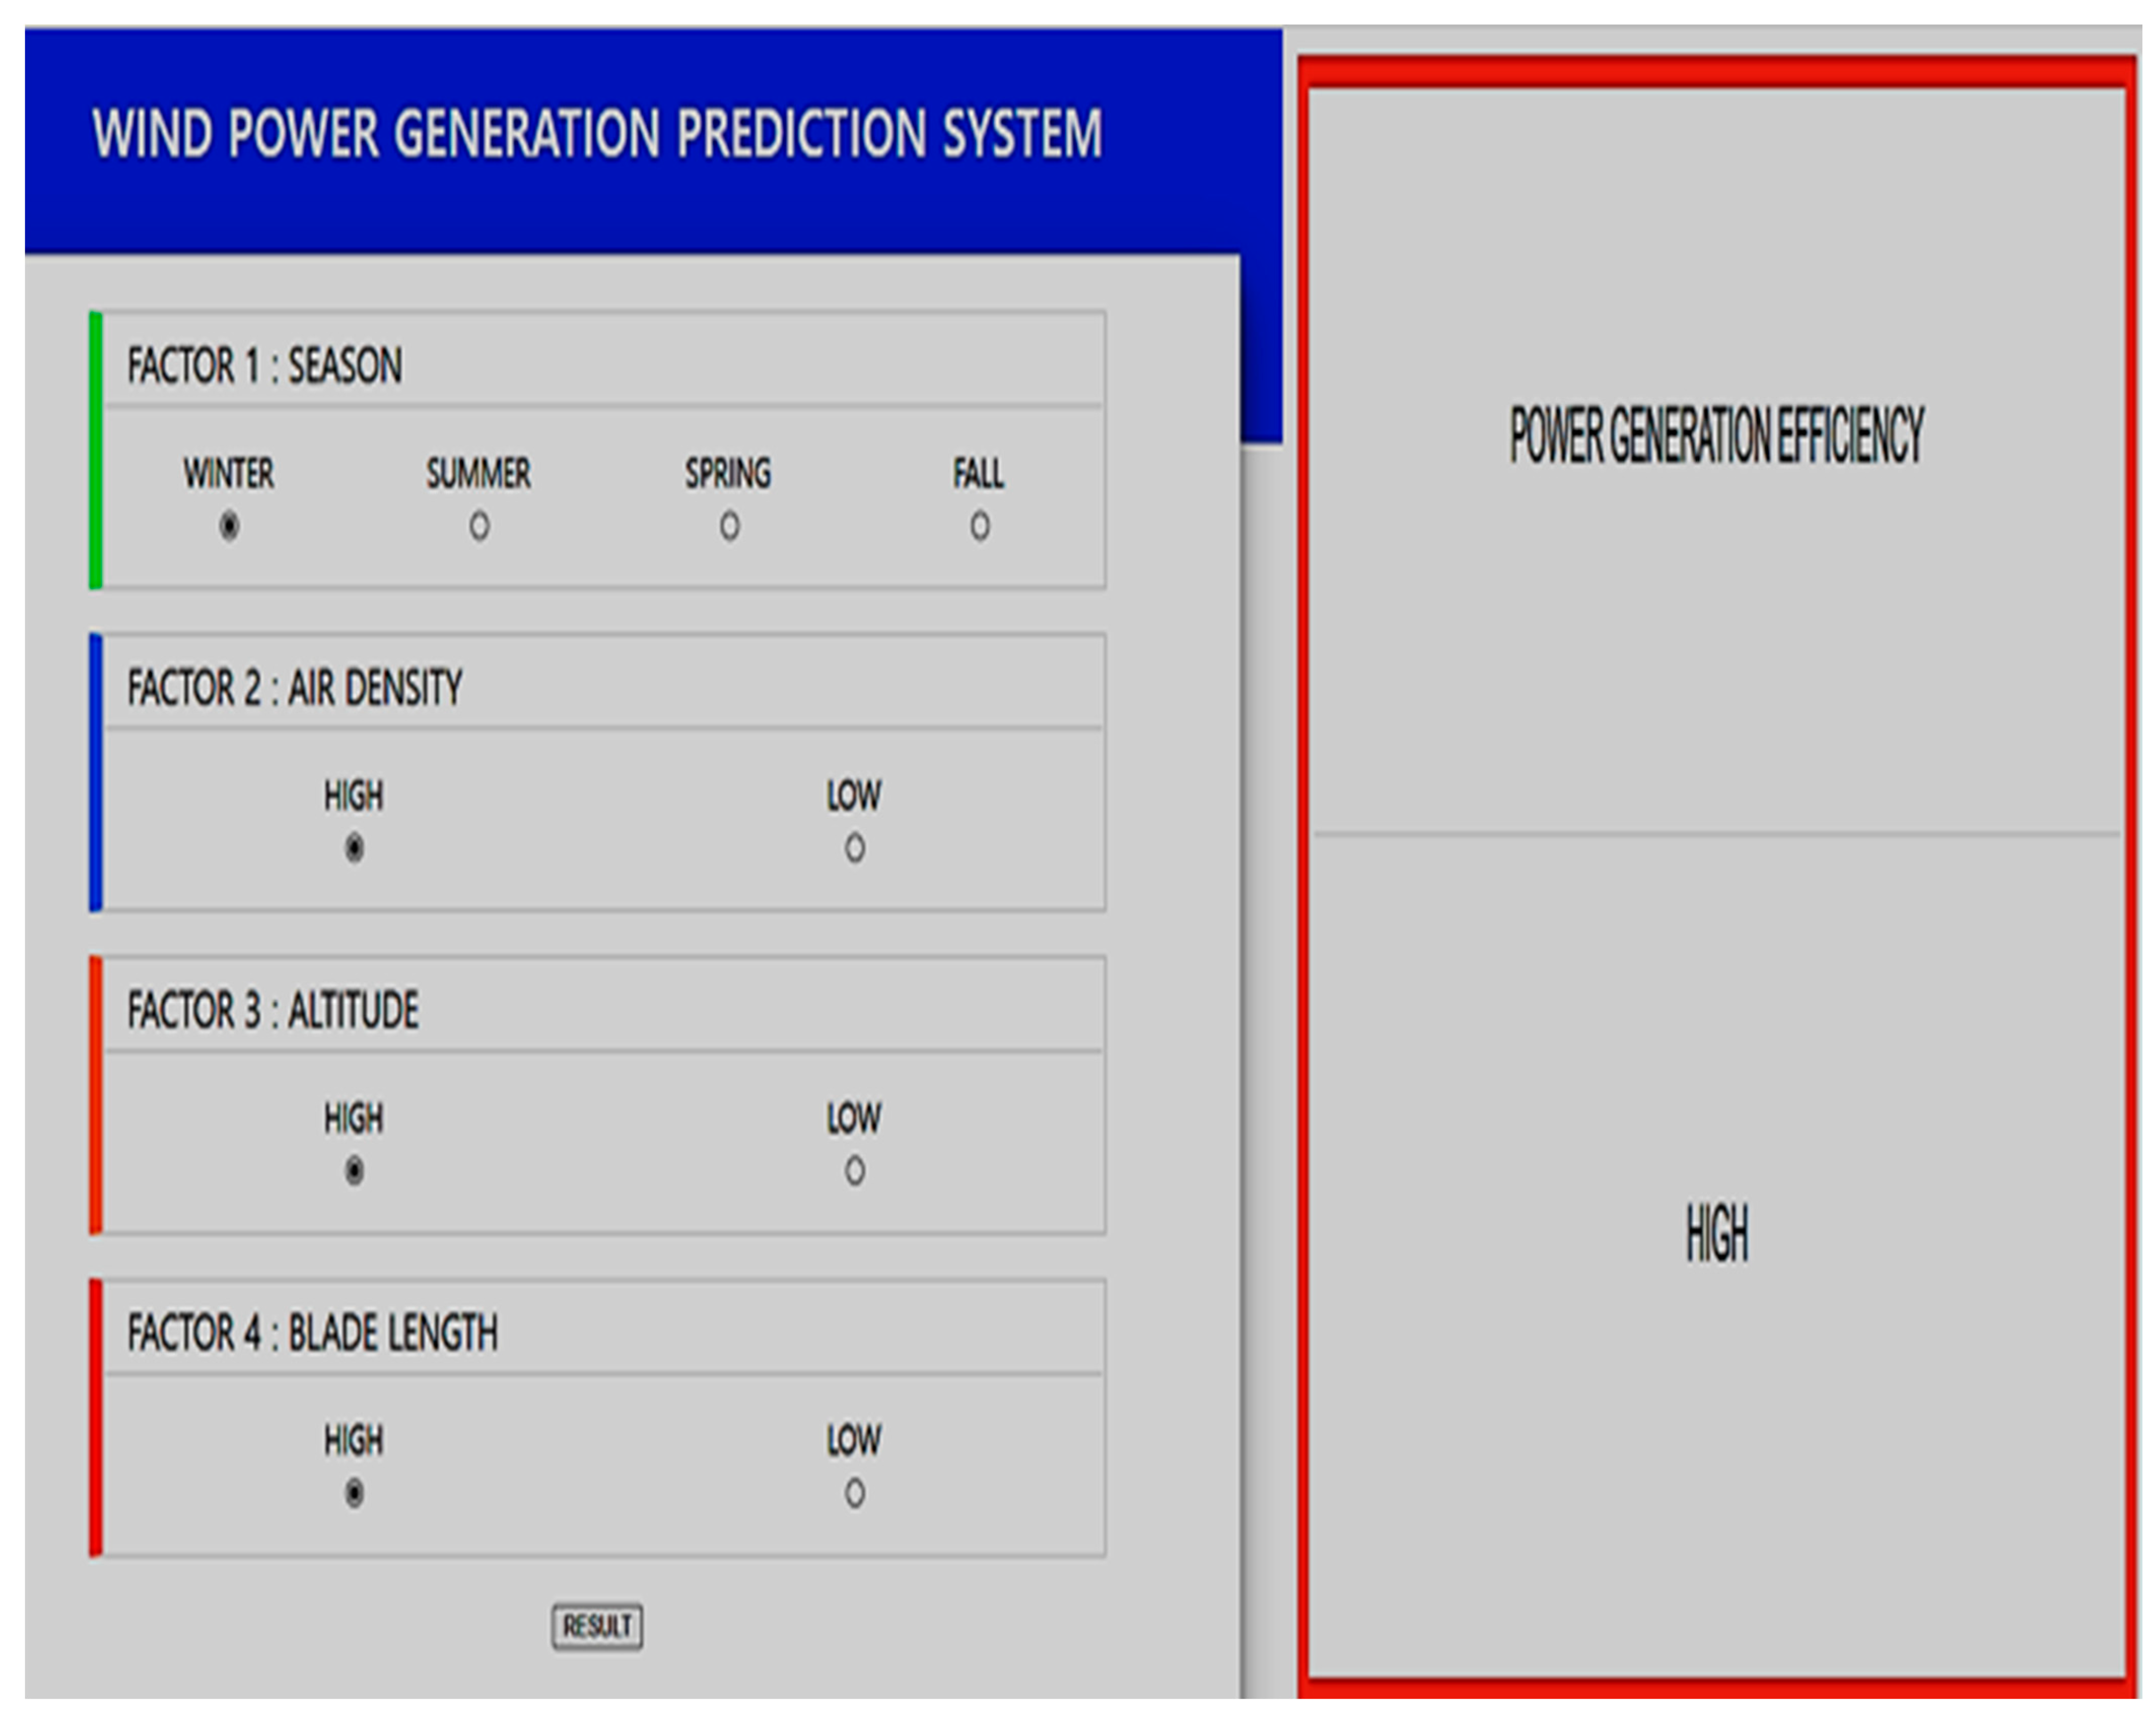
In addition, due to strong winds, the wind pressure acts greatly on the blades, and it is necessary to control the stall in order to prevent severe vibration and distortion or over-rotation of the rotor axis. This is widely adopted in small and medium-sized wind power generation facilities in consideration of economic feasibility, but there are disadvantages such as low braking efficiency and complex aerodynamic design of the blades. Wind turbines can produce power depending on the weather, air density, altitude, blade length, etc. In this study, computer simulations were performed to predict power production by inputting these four variables. The simulation results of the maximum wind power generation prediction based on KHRWPRM are shown in Figure 11. By collecting four input conditions in real time through IOT sensors, it will be possible to generate a smart wind resource map for advanced electricity production prediction.
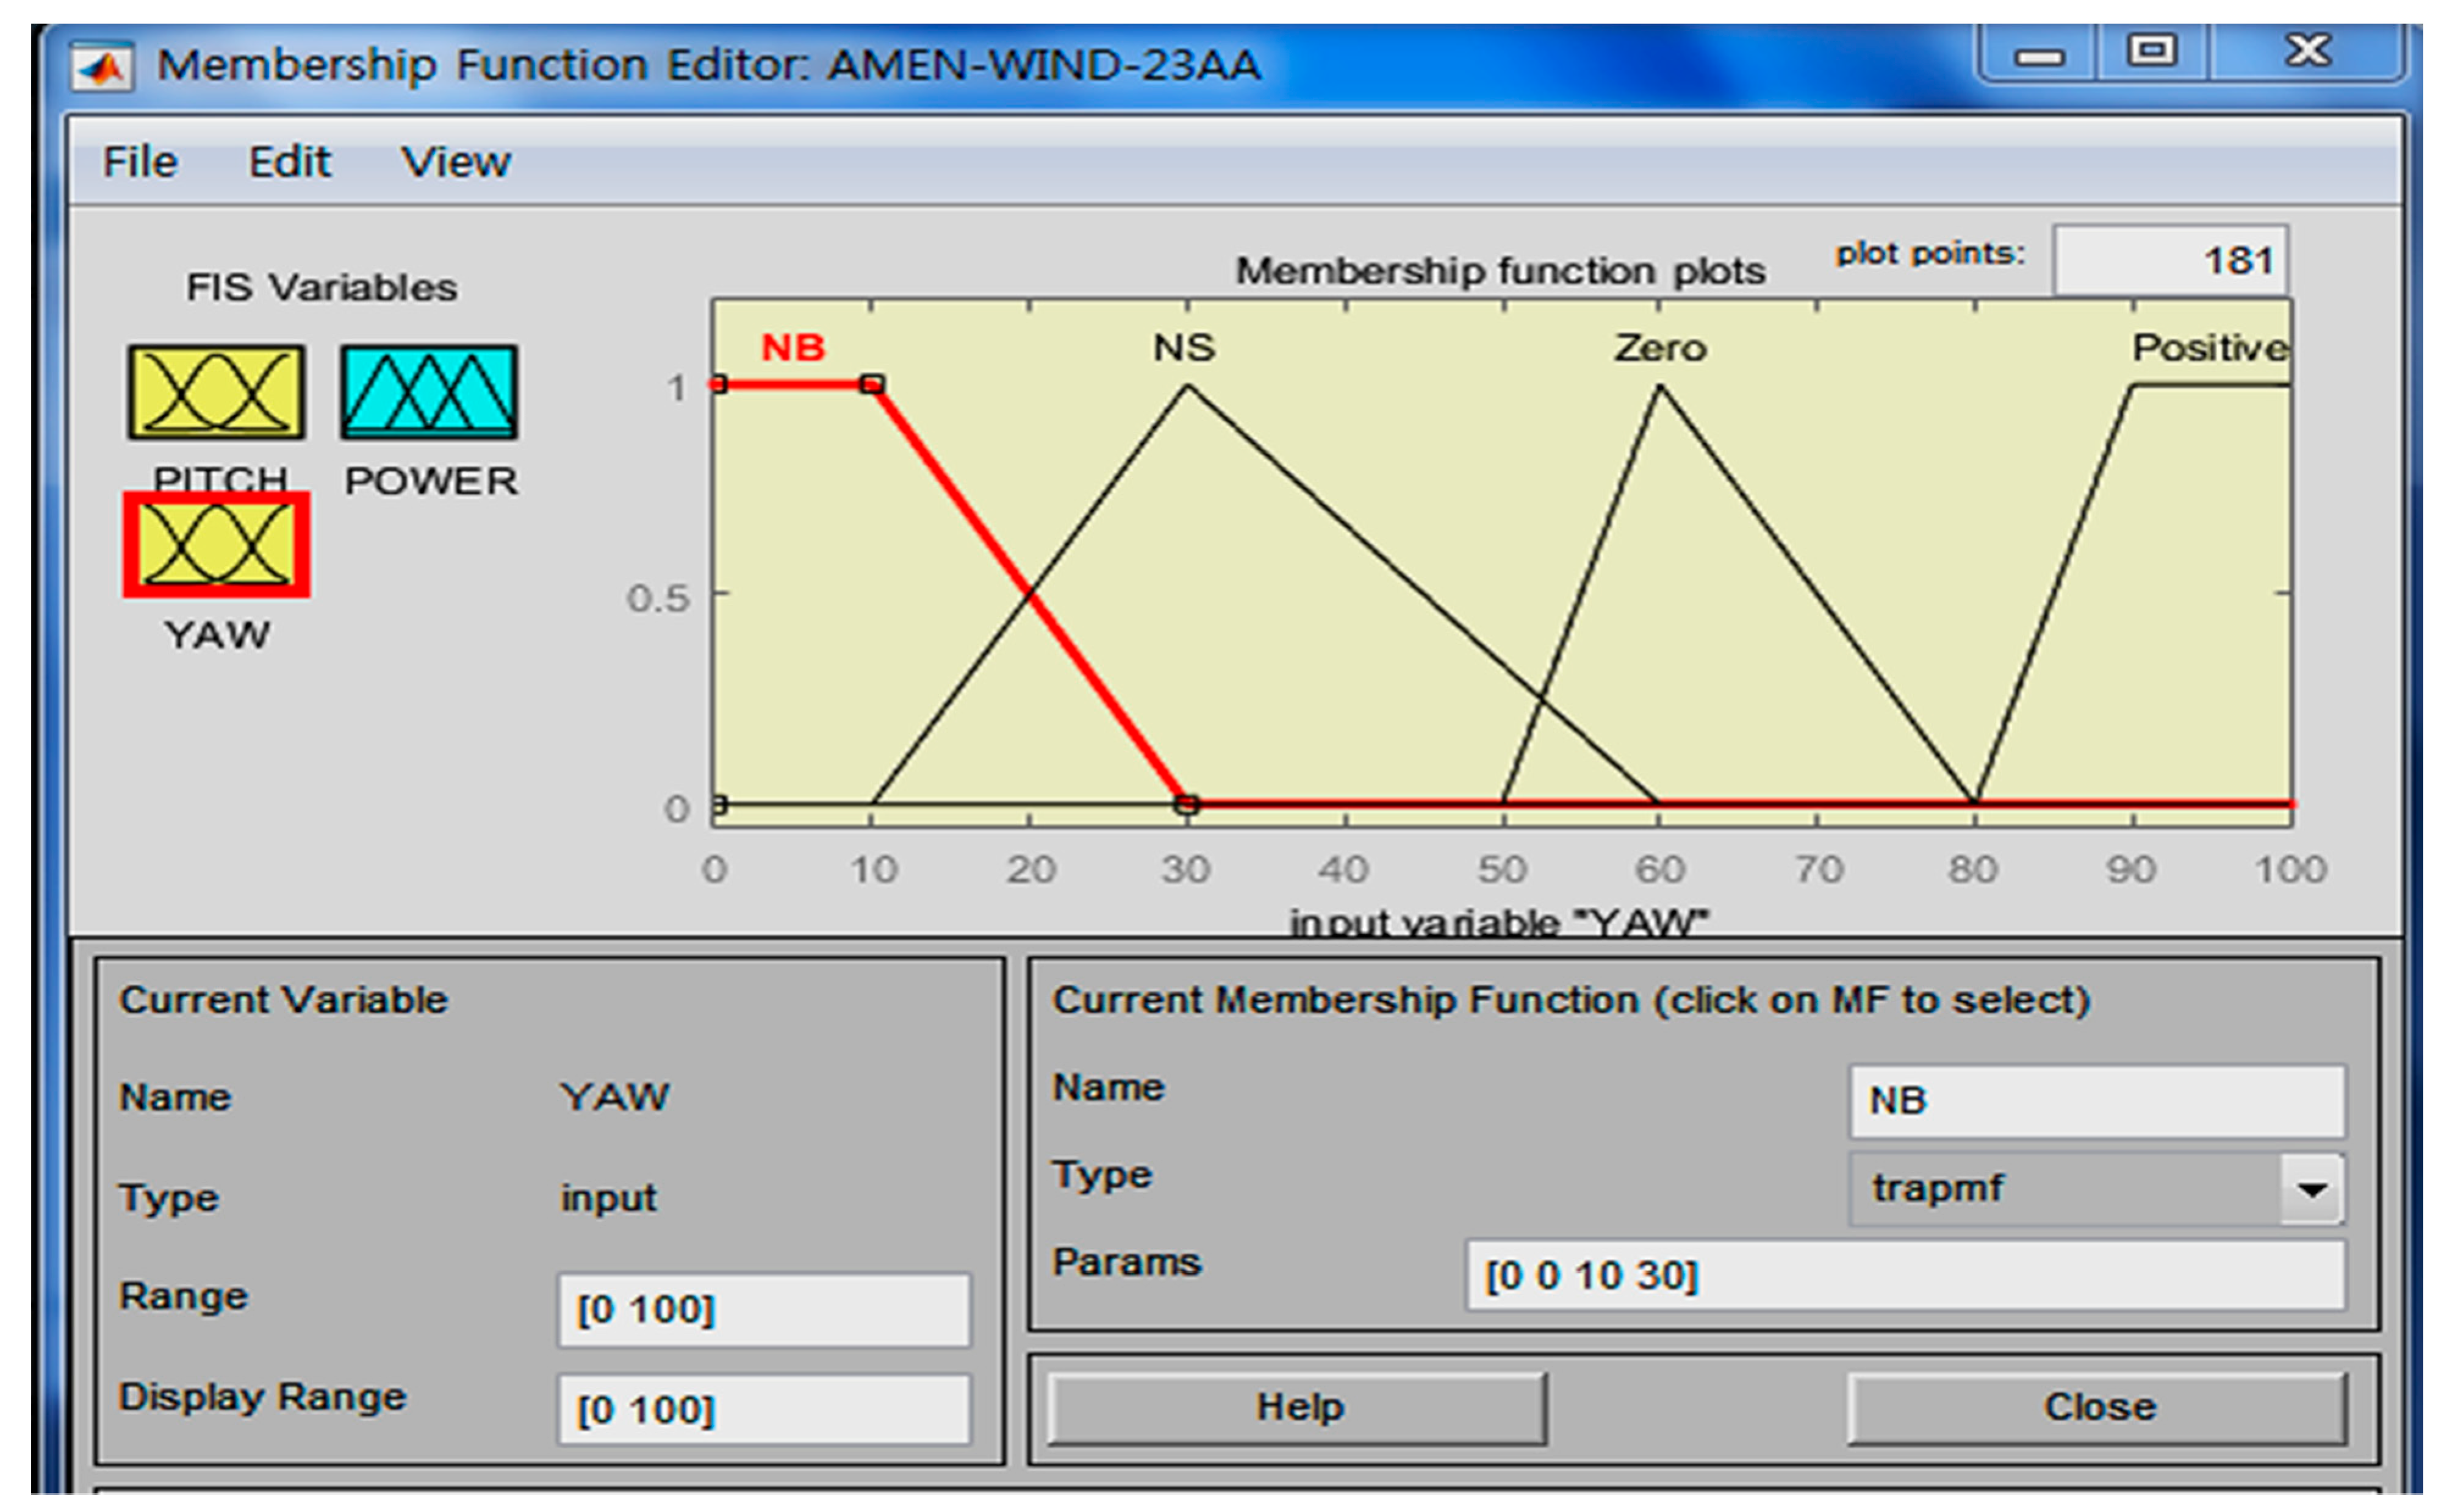
In order to maximize the electricity output of the wind turbine, it is necessary to direct the nacelle and blade into the direction of the wind through optimal yaw control. In addition, it is necessary to classify the wind speed into three stages (LOW/MEDIUM/HIGH) through optimal pitch control to adjust the pitch angle and lift of the blade. In this study, yaw control and pitch control simulations were performed using fuzzy theory to implement optimal control using KHRWPRM efficiently [19]. The results of a computer simulation using MATLAB Fuzzy inference system tool for maximizing the energy of a wind turbine are shown in Figure 12. This is to predict the maximum energy production efficiency by inputting the fuzzy membership function for the wind speed and direction as the pitch and yaw fuzzy membership function configuration values based on the quantization step values shown in Table 5 and Table 6.
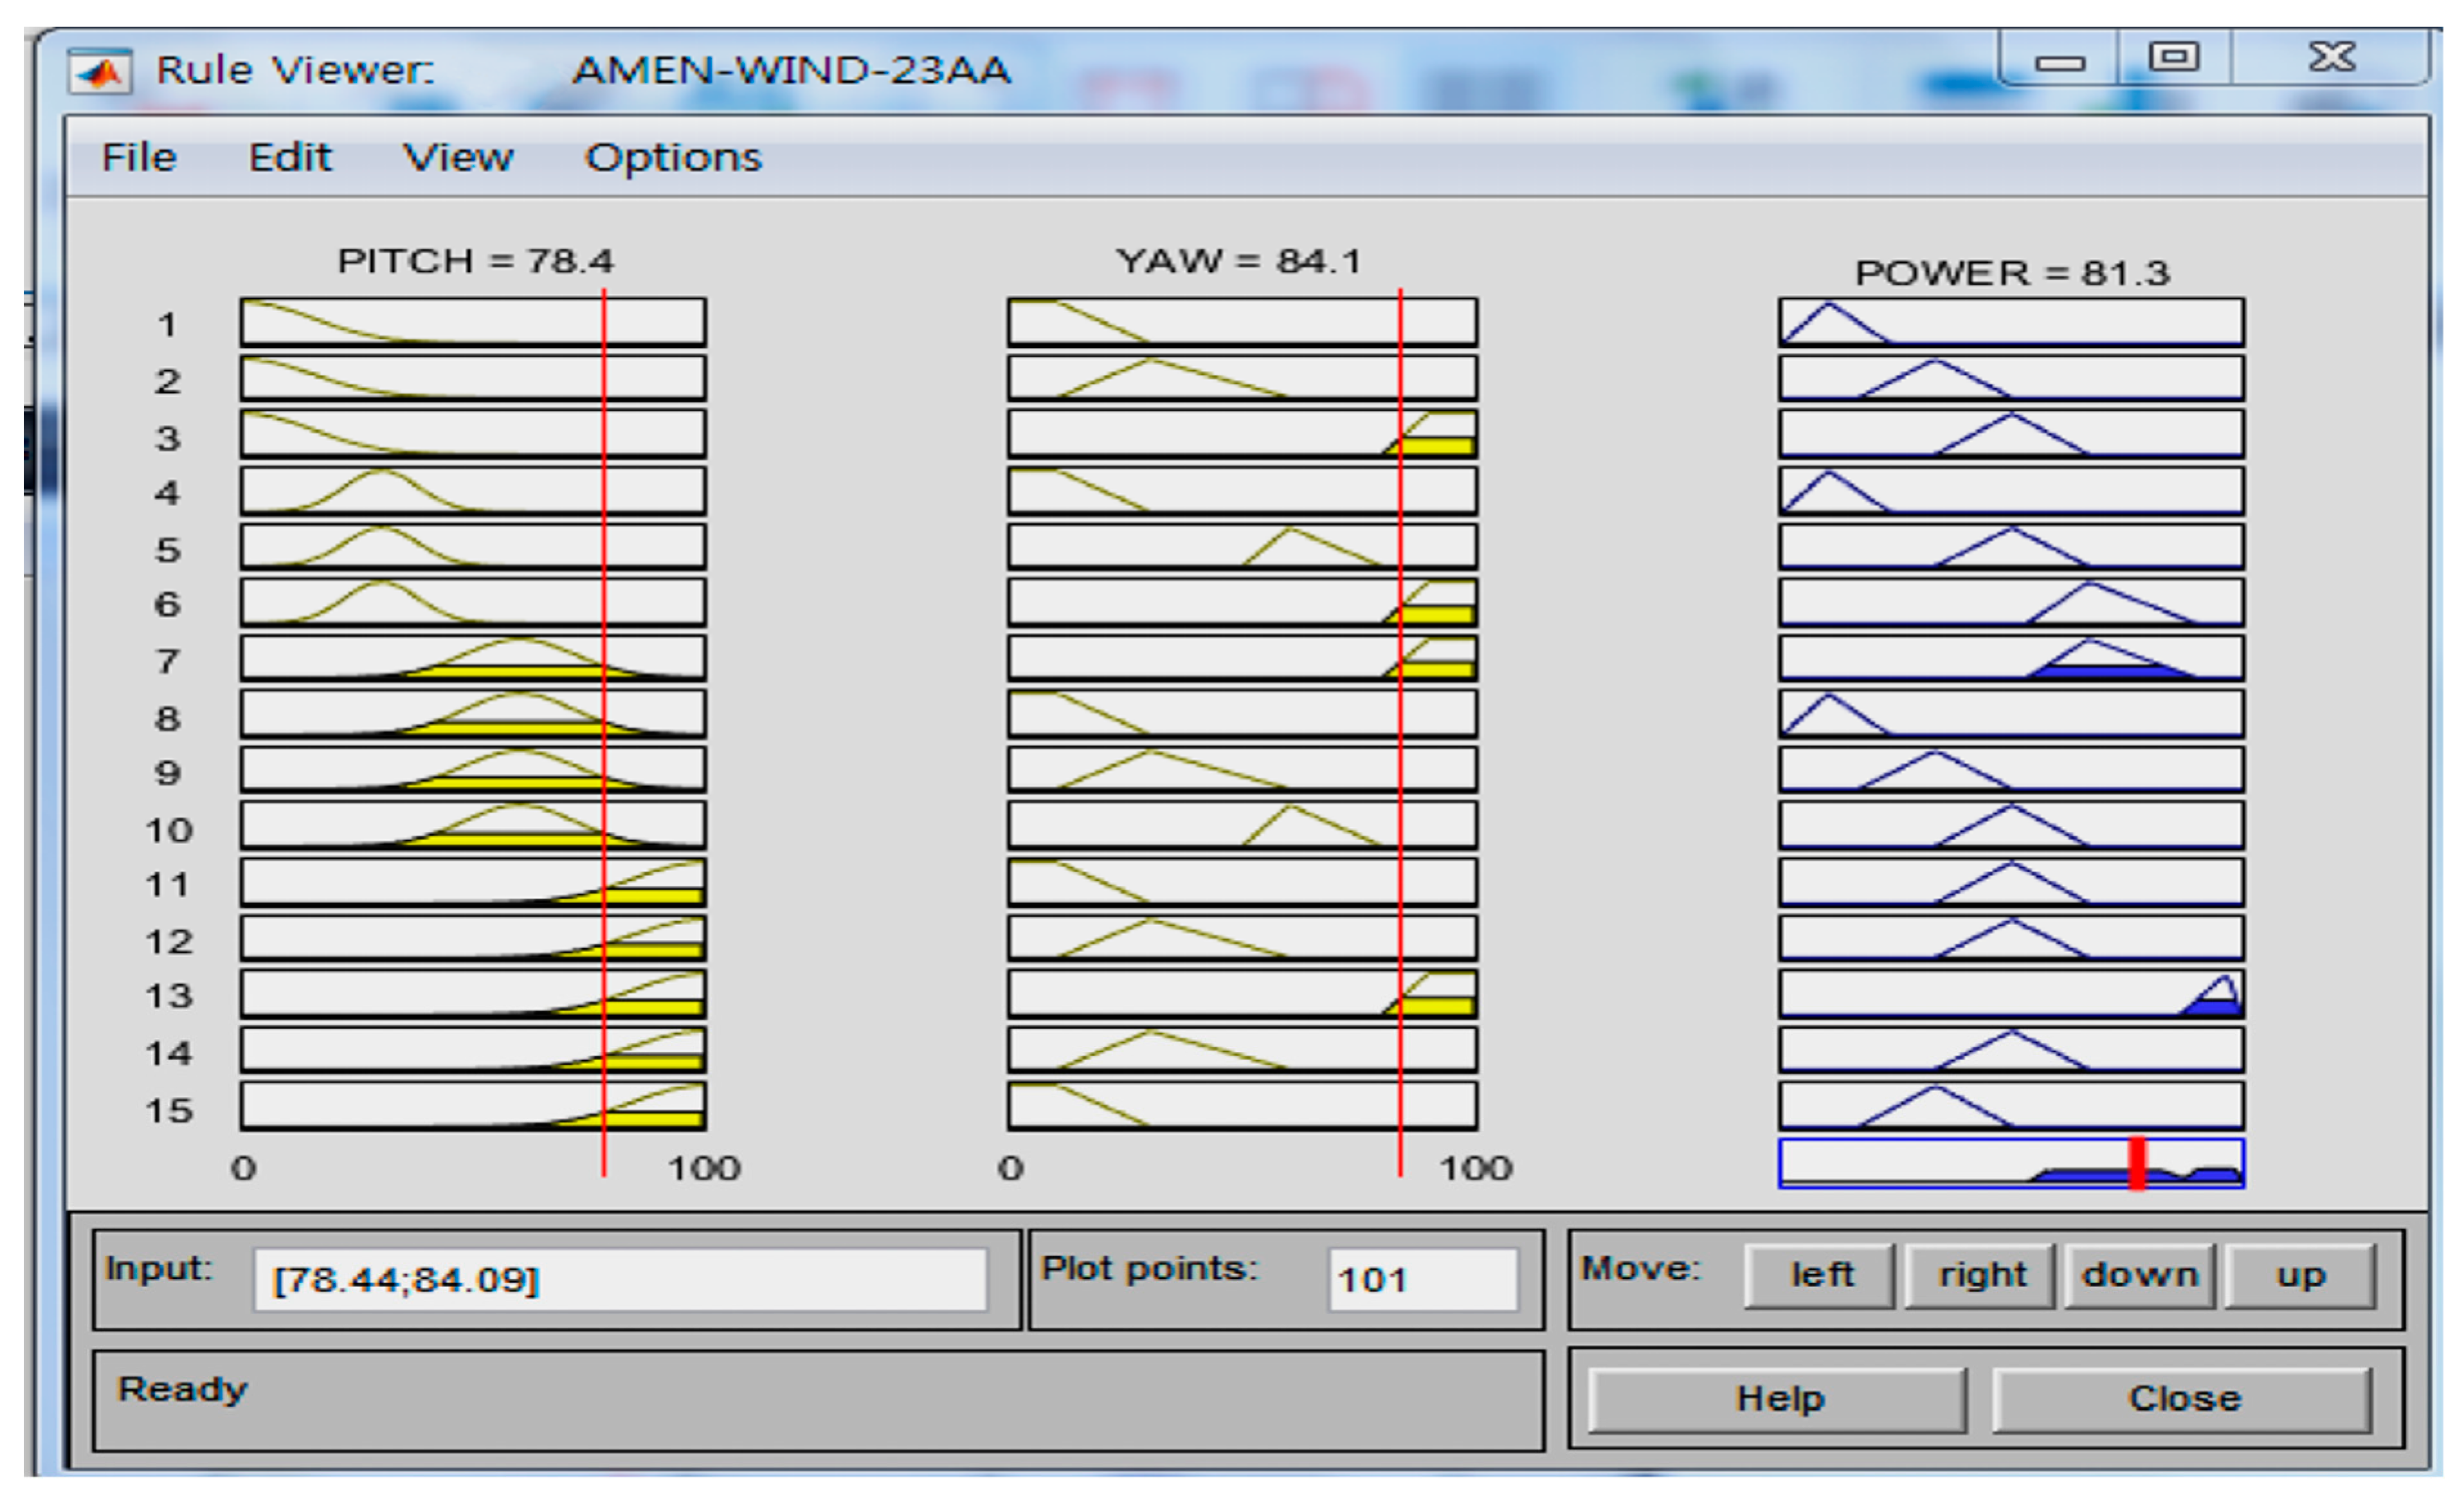
Based on the quantization step values shown in Table 5 and Table 6, fuzzy rules based on fuzzy membership functions for efficient pitch and yaw control are shown in Figure 13.
Figure 14 shows the fuzzy control result, which automatically calculates the fuzzy membership function optimal control value (Z-axis) by entering two variables (pitch fuzzy membership function according to the wind speed: X-axis; yaw fuzzy membership function according to the wind direction: Y-axis).
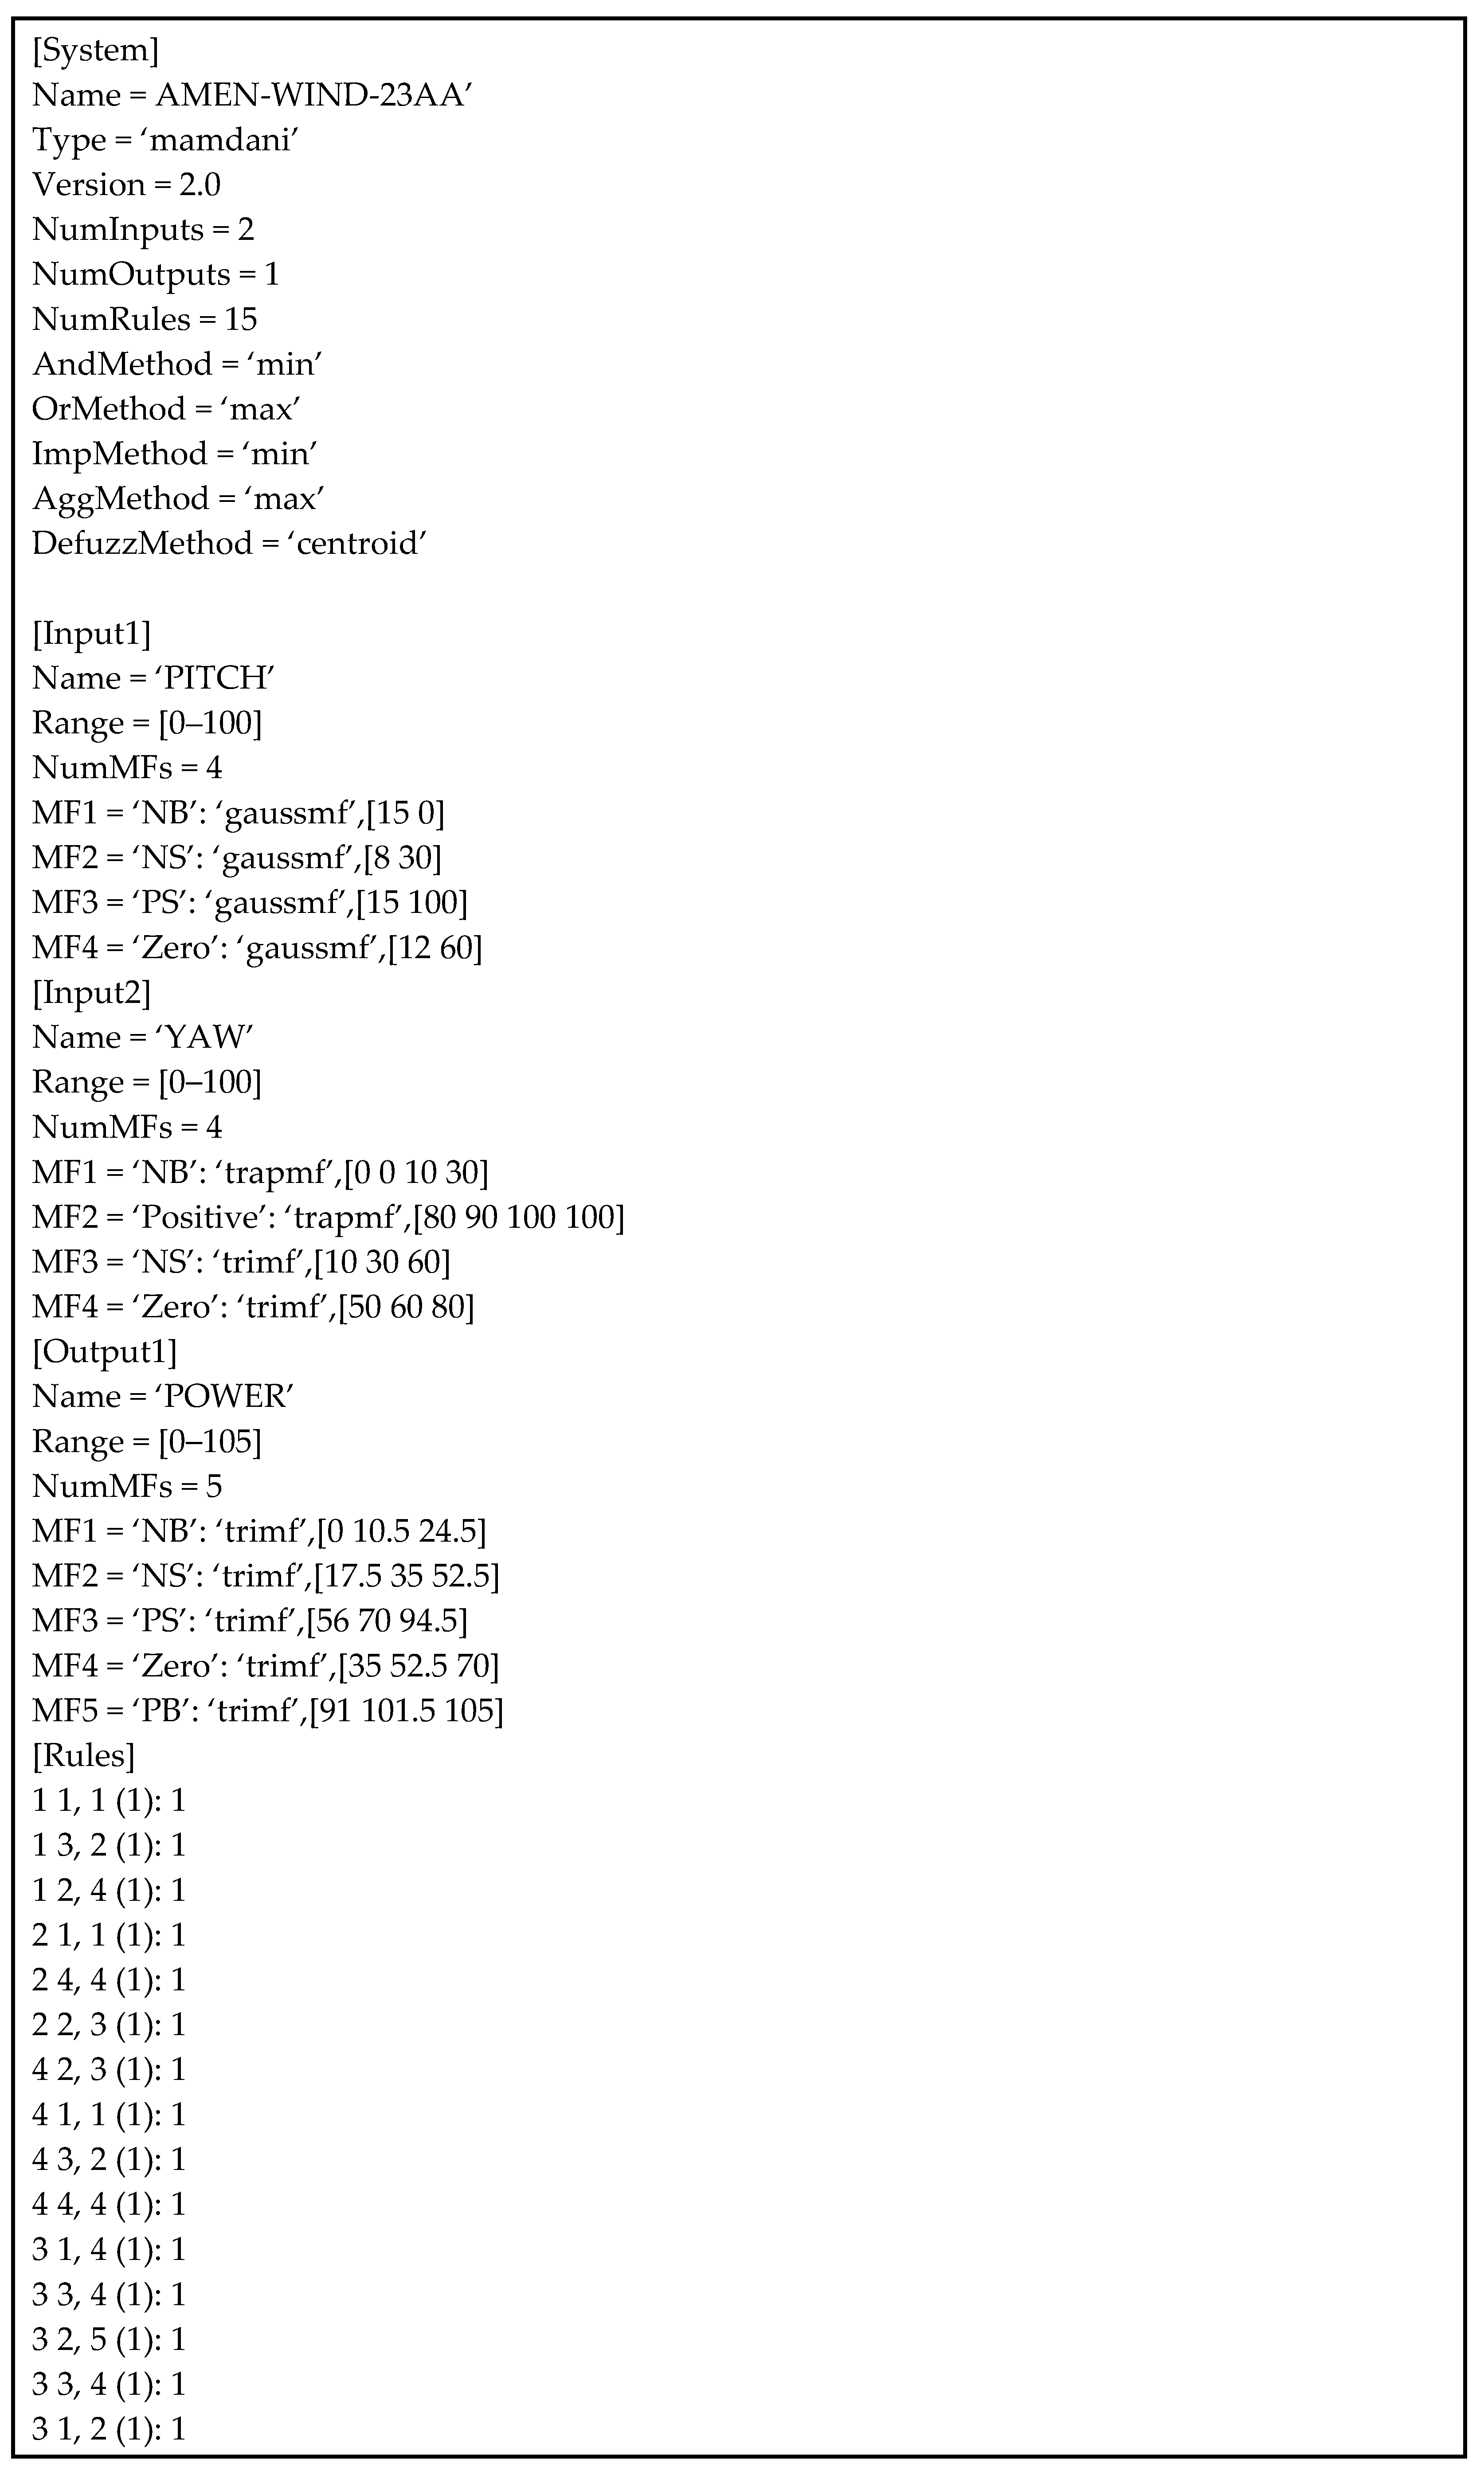
The MATLAB-based fuzzy rule source code used in this study is shown in Figure 15.

5. Conclusions

Wind energy can produce electricity at a lower price than coal-fired and nuclear power plants and is attracting attention as a major energy source for eco-friendly and sustainable energies that do not emit pollutants. The world’s largest producer of wind energy is the United States, followed by Germany, China, India, and Spain. Wind power has a very large impact on the surrounding living environment due to vibration or noise caused by turbine rotation. In addition, due to the frequent occurrence of broken blades and fires, a lot of research has been conducted on AI-based fire prediction systems to prevent wind turbine hazards [17,20,21]. With such sustained efforts, the control technology according to the wind speed of the wind power generator is very active, but there is a lack of research related to optimal pitch/yaw/stall control, which controls the rotation angle of the blade in real time according to the wind direction. In areas where the wind speed is not strong, such as South Korea, it is necessary to have a control technology that can detect the wind direction and maintain the rotation surface of the wind generator blade at the optimal angle with the wind direction in real time. This can help prevent fires and maximize energy production for wind turbines.
In this study, optimal pitch control, which is the key to wind turbine maintenance, was performed. In addition, an over-current control method was proposed to prevent fires in wind power generators caused by over-current. In addition, the wind weather resource map of Korea was used to predict the average annual wind distribution suitable for wind power generation. Finally, the optimal pitch control technology and over-current control method proposed through computer simulation were confirmed to be effective in maximizing power generation efficiency by effectively responding to fire risk factors. Through various wind turbine control methods carried out in this study, it was confirmed that remote diagnosis and early warning can be issued, and power generation prediction and wind generator efficiency automatic analysis is possible.

Supplementary Materials

The following supporting information can be downloaded at: https://www.mdpi.com/article/10.3390/en16135176/s1, Video S1.

Author Contributions

The five authors, J.-H.K., S.-H.P., S.-J.P., B.-J.Y. and Y.-S.H., contributed equally to this work. The following authors made a special contribution to “Supervison and project administration”, J.-H.K. and S.-H.P.; data curation, S.-H.P. and B.-J.Y.; formal analysis, J.-H.K. and S.-J.P.; software and validation, Y.-S.H. All authors have read and agreed to the published version of the manuscript.

Funding

This paper is financed by the KETEP (Korea Institute of Energy Technology Evaluation and Planning) and the MOTIE (Ministry of Trade, Industry & Energy).

Data Availability Statement

The authors confirm that the data supporting the findings of this study are available within the article and Supplementary Materials.

Acknowledgments

This work would not have been possible without the financial support of the KETEP (Korea Institute of Energy Technology Evaluation and Planning) and the MOTIE (Ministry of Trade, Industry & Energy) of the Republic of Korea (No. 20213030020400).

Conflicts of Interest

The authors declare no conflict of interest.

References

  1. Available online: https://namu.wiki/w/%ED%92%8D%EB%A0%A5%20%EB%B0%9C%EC%A0%84 (accessed on 14 May 2023).
  2. Available online: https://penguinworld9.tistory.com/707 (accessed on 14 May 2023).
  3. Jung, S.-M.; Choi, W.-J. A Study on Deep Learning-based Fault Diagnosis using Vibration Data of Wind Generator. J. Korean Inst. Inf. Technol. 2022, 20, 129–136. [Google Scholar]
  4. Mahmoud, T.; Dong, Z.Y.; Ma, J. An advanced approach for optimal wind power generation prediction intervals by using self-adaptive evolutionary extreme learning machine. Renew. Energy 2018, 126, 254–269. [Google Scholar] [CrossRef]
  5. Offshore wind turbines ‘emergency’ in safety, from blade breakage to fire. J. Electr. May 2021.
  6. Santoni, C.; Khosronejad, A.; Seiler, P.; Sotiropoulos, F. Toward control co-design of utility-scale wind turbines: Collective vs. individual blade pitch control. Energy Rep. Res. Pap. 2023, 9, 793–806. [Google Scholar] [CrossRef]
  7. Poureh, A.; Chamani, M.; Bahri, A. Nonlinear analysis of gain scheduled controllers for the NREL 5-MW turbine blade pitch control system. Int. J. Electr. Power Energy Syst. 2022, 145, 108578. [Google Scholar] [CrossRef]
  8. Eyecioglu, O.; Hangun, B.; Kayisli, K.; Yesilbudak, M. Performance Comparison of Different Machine Learning Algorithms on the Prediction of Wind Turbine Power Generation. In Proceedings of the 2019 IEEE 8th International Conference on Renewable Energy Research and Applications (ICRERA), Brasov, Romania, 3–6 November 2019. [Google Scholar]
  9. Park, S.-J.; Hong, Y.-S.; Kang, J.-J.; Yang, J.-S. A Study on Wind Power Efficiency Analysis. J. Inst. Internet Broadcast. Commun. (IIBC) 2017, 17, 219–224. [Google Scholar] [CrossRef] [Green Version]
  10. Kim, J.-H.; Cho, S.-H.; Park, S.-H.; Ki, J.-Y.; Hong, Y.-S.; Park, S.-J.; Yoon, B.-J. Wind Power Generation Fire Prediction Factor Analysis. In Proceedings of the 10th ICAEIC-2023, Advanced Engineering and ICT-Convergence Proceedings (AEICP), Bangkok, Thailand, 7–10 February 2023; pp. 189–195. [Google Scholar]
  11. Kim, J.-H.; Cho, S.-H.; Park, S.-H.; Ki, J.-Y.; Hong, Y.-S.; Park, S.-J.; Yoon, B.-J. Optimal Control of Wind Power Generation using Fuzzy Rules. In Proceedings of the 10th ICAEIC-2023, Advanced Engineering and ICT-Convergence Proceedings (AEICP), Bangkok, Thailand, 7–10 February 2023; pp. 23–29. [Google Scholar]
  12. Liu, M.; Qiu, P.; Wei, K. Research on Wind Speed Prediction of Wind Power System Based on GRU Deep Learning. In Proceedings of the 2019 IEEE 3rd Conference on Energy Internet and Energy System Integration (EI2), Changsha, China, 8–10 November 2019; pp. 1699–1703. [Google Scholar]
  13. Merlini, D.; Rossini, M. Text categorization with WEKA: A survey. Mach. Learn. Appl. 2021, 4, 15. [Google Scholar] [CrossRef]
  14. Chen, G.; Shan, J.; Li, D.Y.; Wang, C.; Li, C.; Zhou, Z.; Hao, J.J. Research on Wind Power Prediction Method Based on Convolutional Neural Network and Genetic Algorithm. In Proceedings of the 2019 IEEE Innovative Smart Grid Technologies—Asia(ISGT Asia), Chengdu, China, 21–24 May 2019; pp. 3573–3578. [Google Scholar]
  15. Yun, B.J.; Kim, J.I.; Yoon, J.Y.; Kang, J.J.; Hong, Y.S. Development of Multi-Sensor Convergence Monitoring and Diagnosis Device based on Edge AI for the Modular Main Circuit Breaker of Korean High-Speed Rolling Stock. Int. J. Adv. Cult. Technol. 2022, 10, 569–575. [Google Scholar]
  16. Railway Vehicle Parts Development Project_Project Task Manual. Korea Railroad. Available online: https://www.kaia.re.kr/portal/landmark/readTskView.do?tskId=156120&yearCnt=3&cate1=&cate2=&cate3=&year=&bizName=&psnNm=&orgNm=&tskName=&sort=&pageIndex=1&menuNo=200060 (accessed on 27 April 2021).
  17. Lin, H.; Liu, X.; Wang, X.; Liu, Y. A Fuzzy inference and big data analysis algorithm for the prediction of forest fire based on rechargeable wireless sensor networks. Sustain. Comput. Inform. Syst. 2018, 18, 101–111. [Google Scholar] [CrossRef]
  18. Development of Integrated Management Technology for Facility Supply Chain between Wind Farms, R&D Plan_Energy R&D (Source/Innovation/Demonstration Type); No. 20213030020400; MOTIE (Ministry of Trade, Industry & Energy) of the Republic of Korea: Sejong-si, Republic of Korea, 2021.
  19. Batool, I.; Khan, T.A. Software fault prediction using data mining, machine learning and deep learning techniques: A systematic literature review. Comput. Electr. Eng. 2022, 100, 107886. [Google Scholar] [CrossRef]
  20. Deng, Y.; Jia, H.; Li, P.; Tong, X.; Qiu, X.; Li, F. A Deep Learning Methodology Based on Bidirectional Gated Recurrent Unit for Wind Power Prediction. In Proceedings of the 2019 14th IEEE Conference on Industrial Electronics and Applications (ICIEA), Xi’an, China, 19–21 June 2019; pp. 591–595. [Google Scholar]
  21. Tursunboev, J.; Kang, Y.S.; Huh, S.B.; Lim, D.W.; Kang, J.M.; Jung, H. Hierarchical Federated Learning for Edge-Aided Unmanned Aerial Vehicle Networks. Appl. Sci. 2022, 12, 670. [Google Scholar] [CrossRef]
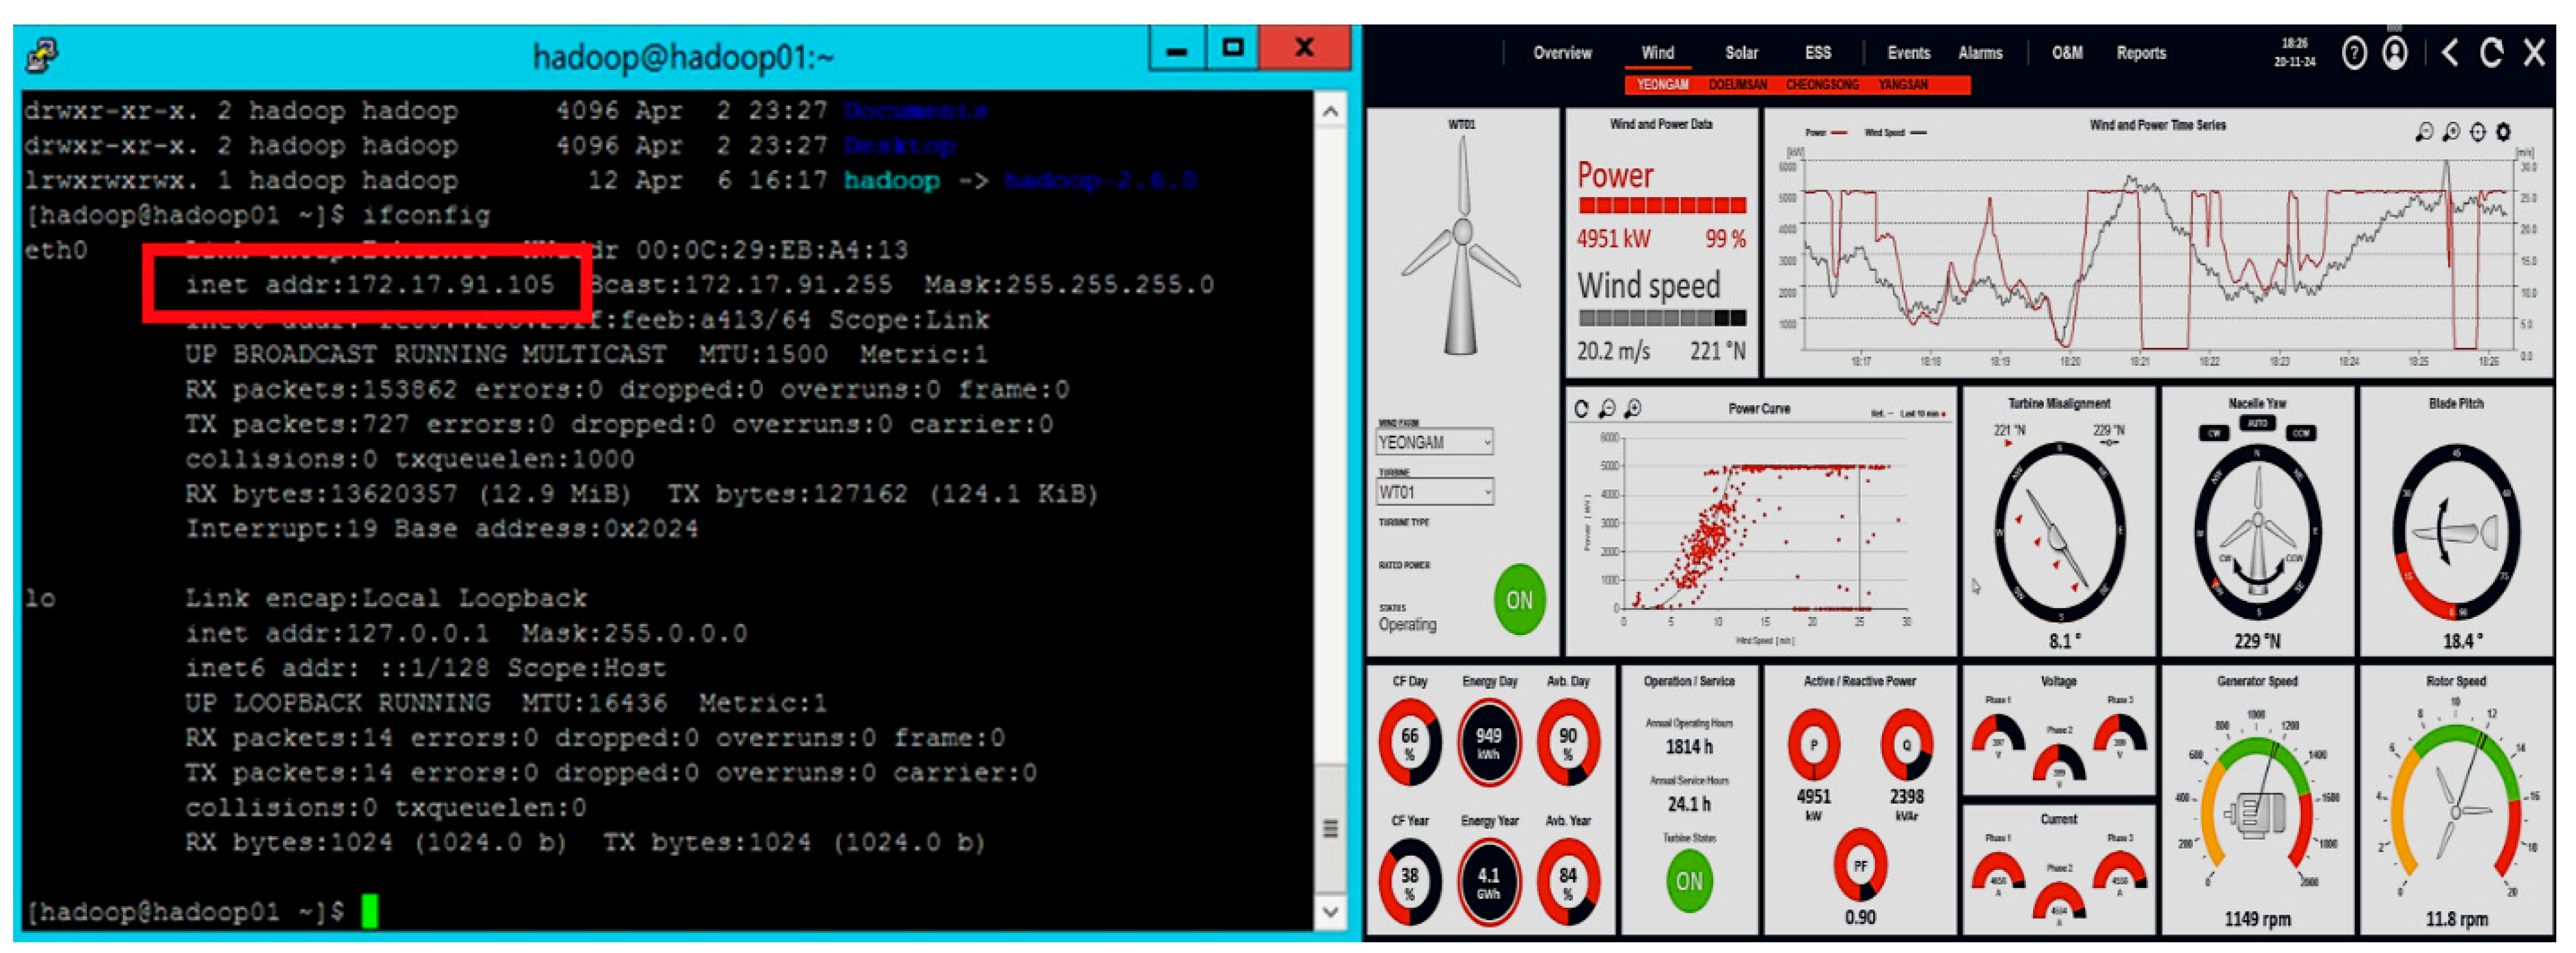
Figure 1. IP Setting Process of Master Node (The host name to VMWare is described in red frame).
Energies 16 05176 g001
Figure 2. Visualization Result using D3 and NVD3 Libraries.
Energies 16 05176 g002
Figure 3. Structure of Visualization System using Hadoop Big data Platform.
Energies 16 05176 g003aEnergies 16 05176 g003b
Figure 4. Verification Contents and Diagnostic Results of Sensor Modules using VCB/MCB/PD Signals.
Energies 16 05176 g004
Figure 5. Surveillance and Diagnostic Process of Sensor Modules (① censor module process based on Ethernet communication, ② data analytical process through RS485 communication, ③ analytical process of data transmitting and receiving based on LTE-A and WiFi, ④ event log management of system configuration throughout RS-232 and USB communication.
Energies 16 05176 g005
Figure 6. Wind Power Generation Big Data (2015) Source: UNISON (http://www.unison.co.kr, accessed on 13 May 2023).
Energies 16 05176 g006
Figure 7. Cluster Analysis Results for Wind Turbine Accident Risk Analysis Data.
Energies 16 05176 g007
Figure 8. Wind Turbine Accident Risk Factor Analysis Results.
Energies 16 05176 g008
Figure 9. Neural Network based Wind Turbine Risk Determination Algorithm.
Energies 16 05176 g009aEnergies 16 05176 g009b
Figure 10. KHRWPRM-based Optimal Pitch/Yaw/Stall Control Process.
Energies 16 05176 g010
Figure 11. KHRWPRM-based Simulation Results for Predicting Maximum Wind Power Generation.
Energies 16 05176 g011
Figure 12. Computer Simulation Results using MATLAB FUZZY INFERENCE SYSTEM TOOL.
Energies 16 05176 g012
Figure 13. Fuzzy Rules-based Fuzzy Membership Functions (15 items).
Energies 16 05176 g013
Figure 14. Wind Turbine Optimal Fuzzy Control Results.
Energies 16 05176 g014
Figure 15. MATLAB-based Fuzzy Rules Source Code.
Energies 16 05176 g015
Table 1. Functions of the Hadoop Configuration File.
File NameFunctions
Hadoop-env.shSet the necessary environment variables in the cell script file running Hadoop.
mastersConfigure the server to run the secondary name node.
slavesConfigure the server to run the data node.
core-site.xmlSpecifies the environment information to be used in common with HDFS and Map Reduce.
hdfs-site.xmlSpecifies the environment information to be used in HDFS.
mapred-site.xmlSet the environment information to be used in Map Reduce.
yarn-site.xmlSet the environment information of Resource Manager and Node Manager.
Table 2. Wind Turbine Fire Hazard Analysis Parameters_9 items.
Variable 1Generator temperature: Low/Middle/High
Variable 2Cooling fan temperature: Low/Middle/High
Variable 3PCS temperature: Low/Middle/High
Variable 4Wind speed: Low/Middle/High
Variable 5Pitch angle: Low/Middle/High
Variable 6Rotor speed: Low/Middle/High
Variable 7Gear box temperature: Low/Middle/High
Variable 8Bearing temperature: Low/Middle/High
Variable 9Risk of fire accidents: Yes/No
Table 3. Fuzzy Rules and Fuzzy Control Parameters.
Fuzzy RulesFuzzy Control Parameters
(RULE 1) IF WDS IS PB
AND DRV IS NS
THEN OPT IS PB
(RULE 2) IF WDS IS PB
AND DRV IS NM
THEN OPT IS PM
(RULE 3) IF WDS IS PS
AND DRV IS NS
THEN OPT IS PS
WDS: Pitching control error in wind angle
DRV: Yawing control error in wind direction
OPRG: Optimal wind power efficiency
Error = R-Y
Ce = Pe2-We1
Y: Pitching control value
R: Reference input
Ce: Variation of errors
(reference input-Pitching control value)
PE2: Pitching error
We1: Yawing error
Table 4. Wind Turbine Pitch Control Quantization Step Values.
Quantization StepsWind StrengthPitching Control for Quantized
Values Scope of the Set
Fuzzy Membership Function
(Actual Pitching Input Value)
1Less than 4 m/sStalling controlNone
24.16.9 m/s25 ≤ x < 301–15
37.0–10.0 m/s20 ≤ x < 2516–30
410.1–12.9 m/s15 ≤ x < 2031–40
513.0–15.9 m/s10 ≤ x < 1541–50
616.0–18.9 m/s5 < x ≤ 1051–60
719.0–21.0 m/s0 ≤ x < −561–70
821.1–22.9 m/s−5 ≤ x < −1071–85
923.0–25.9 m/s−10 ≤ x < −1585–100
1026 m/s MoreStalling controlNone
Table 5. Wind Turbine Yaw Control Quantization Step Values.
Quantization
Steps
Wind StrengthYawing Control for Quantized
Values Scope of the Set
Fuzzy Membership Function
(Actual Yawing Input Value)
1+6150 ≤ x < 1801–10
2+5120 ≤ x < 15011–20
3+490 ≤ x < 12021–30
4+360 ≤ x < 9031–35
5+230 ≤ x < 6036–40
6+10 < x ≤ 3041–50
700None
8−1180 ≤ x < 21051–60
9−2210 ≤ x < 24061–70
10−3240 ≤ x < 27071–75
11−4270 ≤ x < 30076–80
12−5300 ≤ x < 33081–90
13−6330 < x ≤ 36091–100
Table 6. Wind Turbine Fire Prevention Empirical Data Comparative Analysis Results.
Fire Occurrence Condition Demonstration Input DataRisk of Fire Accidents
Enerator
Temp.
Cooling Fan
Temp.
Bearing
Temp.
Gear-Box
Temp.
Oil Level
Risk Level
Abnormal Vibration
Frequency
Traditional MethodsAI-Based Approach
HighHighHighHighHighHighHighHigh
MediumHighHighHighLowLowHighLow
LowLowLowHighMediumHighLowMedium
HighLowHighHighLowLowMediumLow
LowLowLowLowMediumHighLowMedium
MediumMediumMediumMediumHighHighMediumHigh
MediumHighMediumMediumMediumHighMediumHigh
LowHighLowLowLowLowMediumLow
HighHighMediumHighMediumMediumHighMedium
MediumHighLowMediumLowLowMediumLow
Table 7. Fuzzy Theory-based Wind Power Generation Optimal Control Comparative Analysis Results.
Input DataOutput Data Efficiency
Wind SpeedHeightBlade LengthWind Direction ChangeNone FuzzyFuzzy Inference
SmallSmallSmallSmallBadBad
SmallSmallSmallBigBadMedium
SmallSmallBigBigMediumBig
SmallMediumSmallSmallBadBad
BigBigBigBigMediumGood
BigSmallMediumBigMediumGood
SmallMediumBigBigMediumGood
SmallSmallSmallSmallSmallSmall
MediumSmallMediumSmallMediumMedium
SmallSmallBigBigMediumGood
MediumSmallSmallSmallSmallMedium
MediumBigBigBigMediumMedium
Disclaimer/Publisher’s Note: The statements, opinions and data contained in all publications are solely those of the individual author(s) and contributor(s) and not of MDPI and/or the editor(s). MDPI and/or the editor(s) disclaim responsibility for any injury to people or property resulting from any ideas, methods, instructions or products referred to in the content.