1. Introduction
From the early 90s, environmentalists began to be concerned about climate change from the various human outcomes. The global energy crisis tremendously affected the lives of people, and generated interest in the field of transport to focus on electric powertrains [
1,
2]. Vehicles which run on fossil fuels became the top contributors to greenhouse gases (GHG). Gases such as carbon dioxide (CO
2), hydrocarbons (HC), nitrogen oxides (NO), carbon monoxide (CO), water, etc. are emitted from fossil-fueled vehicles. The transportation sector consumes almost 27% of the world’s total energy and contributes nearly 33% of GHG emissions. The concept of an Electric Vehicle (EV) provides a way to reduce the world’s GHG. Additionally, it significantly reduces the cost of operation and manufacturing compared to fossil-fueled vehicles as mentioned by Tie and Tan, 2013 [
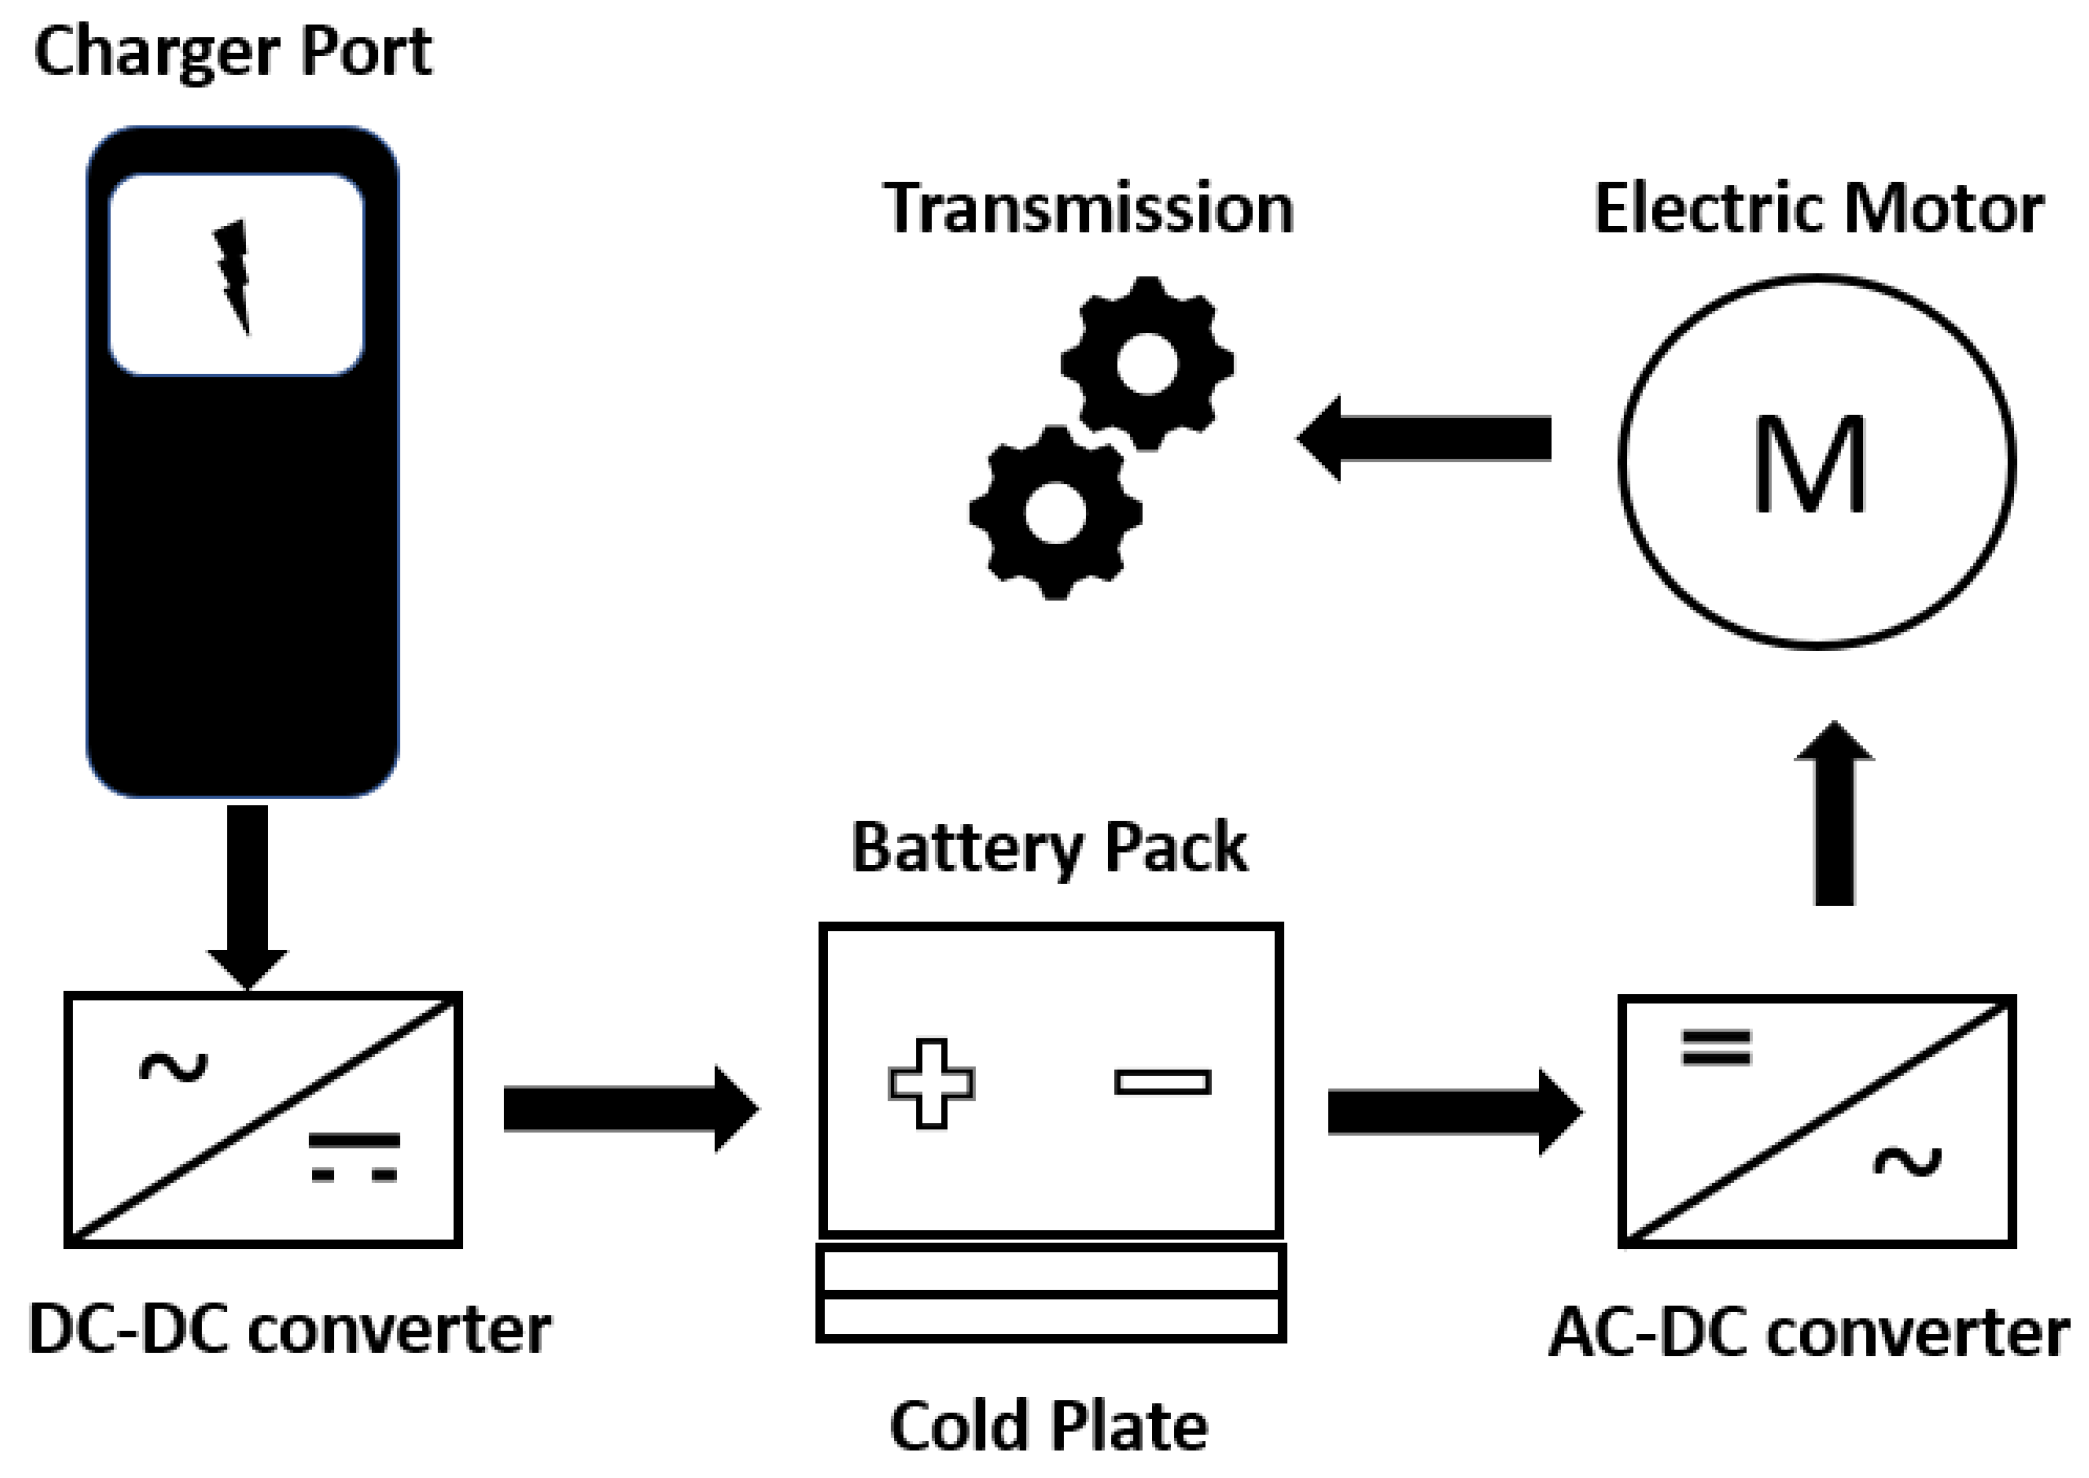
3]. From an engineering perspective, temperature management is the most challenging task in designing EVs. Temperature optimization that involves a battery, electric motor, HVAC, and inverter can be facilitated by what is called a battery thermal management system (BTMS), as shown in
Figure 1.
Thermal analysis of cold plate design for battery cooling is crucial for several reasons. Li-ion batteries used in EVs generate heat during operation, and excessive heat can degrade their performance, reduce their lifespan, and even pose safety risks. A well-designed cooling system ensures that the batteries operate within the optimal temperature range, enhancing their efficiency and longevity. Such an analysis enables us to optimize the design parameters to achieve efficient heat dissipation and maintain uniform temperature distribution across the battery cells. Effective cooling systems help prevent thermal runaway events and mitigate the risk of battery overheating. Accurate thermal analysis ensures that the cold plate design can handle the expected heat load and provides a safe operating environment for the batteries.
However, conducting thermal analysis for cold plate designs can present various challenges. Battery packs consist of numerous individual cells that generate heat unevenly. The presence of cell-to-cell variations, geometric complexities, and packaging constraints make thermal analysis challenging. Accurately modeling the thermal behavior of such systems requires sophisticated computational techniques and careful consideration of various factors, such as thermal interfaces and localized heat generation. Analyzing the transient behavior of the cold plate design under different operating conditions is crucial to ensure effective cooling throughout the battery’s entire life cycle.
Since the advent of EVs, different types of batteries have been used, such as lead–acid, nickel–cadmium, nickel–metal hydride, lithium-ion, and solid-state batteries. Among them, the lithium-ion battery has a higher energy density, which can save space and allow a compact battery design. However, it is highly sensitive to high temperatures (Yacoub Al Shdaifat et al., 2022) [
4]. During charging and discharging, the electrochemical process produces electricity, and heat increases the temperature. Hence, BTMS is required to maintain a uniform temperature. The main function of the BTMS is safety, constant performance, and lifespan of the battery. The normal operating condition of BTMS is between 20 °C and 40 °C. If the temperature falls below 10 °C, the battery will slow down the vehicle’s performance and if exceeds 80 °C, it leads to thermal runaway (Amalesh and Narasimhan, 2020) [
5]. Heat generation occurs in two ways: during electrochemical operation and Joule heating. The heat transfer inside the battery can be divided into three parts (Fathabadi, 2014) [
6].
- (i)
The generation of heat from the cell’s internal resistance;
- (ii)
Occurrence of change in entropy during cell discharge in the cell components;
- (iii)
Heat transfer takes place by convection to the ambient condition.
Several cooling methods have been implemented in battery packs, including air cooling, liquid cooling, direct refrigerant coolant, phase change method (PCM), thermo-electric modules, and heat pipe modules (Chen et al., 2022) [
7]. Generally, the air cooling method is associated with natural and forced air convection. Due to the low thermal conductivity of the air, this method requires a large amount of quantity to maintain the uniform temperature of the battery pack. However, this drawback can be mitigated by employing water, which has higher thermal conductivity (Huo et al., 2015) [
8]. Sometimes liquids involve water, refrigerant, or ethylene glycol. Considering the economy and feasibility, cold plates are more efficient and maintain a safer temperature within the limit. Cold plates generally comprise a thermally conductive material to dissipate the heat produced by the battery pack. The design of the cold plate is typically compact and can fit in the EVs. The overall size and weight reduce the operating and manufacturing cost. The advantage over other methods is that it is less prone to failure, which is affected by vibration and dust. For efficient heat transfer, the cold plate is directly in contact with a battery pack.
This paper aimed to develop a cold plate where the coolant flows in a zig-zag manner to envelop the maximum area of contact with the cold plate. The cold was developed in several channel patterns, allowing the water to extract all the heat produced from a battery pack. This paper is organized as follows: 1. The presentation of analytical methods which involve the parameters required to simulate the design; 2. the discussion of the CFD modeling approach; 3. explanation of the algorithm and optimization of the method to analyze the cold plate; and 4. presentation of the effect of the parameters in a different channel of the cold plate.
4. Results and Discussion
The cooling performance of the cold plate was investigated in this study. The width of the channel was set to 12 mm in the preliminary analysis. Air was set as a region around the cold plate and other boundary conditions were applied as stated in
Table 2. We monitor parameters such as the max temperature of the cold plate (
Tmax), the pressure drop between inlet and outlet
(Δ
p), heat transfer between plate-coolant (solid–liquid) interface (
h), average temperature (
Tavg), and standard deviation of temperature (
Tσ). The results obtained after 1000 iterations (difference in value < 0.2%) were compared with those of Deng et al., 2018 [
14] and Jarrett and Kim, 2011 [
9] to ensure and compare the reliability of the results. The temperature uniformity of the cold plate was significant for the battery pack to control the temperature.
(a) Effect of the number of the cooling channel
To study the effect of several channels in the cold plate, six designs were developed as shown in
Figure 3. The mass flow rate of the coolant was set to 10 g/s. The temperature of the coolant and ambient condition was set to 300 K. The temperature gradient of the six designs was shown in
Figure 9. In the below temperature distribution, the coolant flows from the top right and flows out in the bottom left direction. From the temperature gradient it can be seen that the temperature is lower in the inlet region, rapidly increases, and is maximum in the outlet region. This aspect tells the coolant absorbs heat dissipation continuously when it flows through the channel. In design 1 (3-channel), the maximum temperature attain in the exit region was 330.84 K; the temperature gradually decreased in the exit region when the number of the channel increased from design 1 to design 6 and achieved a minimum temperature of 316 K in design 6 (13-channel). From
Figure 9, the maximum temperature was potent at the edges of the channel. This indicates the poor heat transfer by convection between air and the plate along the thickness.
Figure 10 shows the growth of the temperature of each design with several channels. The Li-ion battery operates better between 298 K and 318 K. The maximum temperature reached for 11- and 13-channel numbers were 316 K, which is acceptable. Additionally, the maximum temperatures were 318 K and 320 K for 9- and 7-channel numbers respectively, which is moderately acceptable in the preliminary analysis. Nearly 14.84 K reduces when the number of channels increases from 3 to 13. The reason is due to the increased heat transfer that occurs between the plate and coolant when the surface area of the coolant flowing area increases. Hence,
Figure 10a demonstrates that the temperature decreases proportionally as the number of channels increases. Further, the number of channels cannot be increased due to the dimension constraint of the plate. Channel numbers 5, 7, 11, and 13 showed similar maximum temperature, and did not vary much. To assess the reliability of the cooling performance, we validated the temperature gradient obtained in our study by comparing it with the findings from Deng et al.’s study (2018) [
14]. In our comparison, we discovered that Deng et al. reported temperatures of 325 K and 316 K for systems with 3 and 5 channel numbers, respectively. In our study, we observed temperatures of 330 K and 320 K for the corresponding channel numbers. Through this comparison, it became evident that there are slight differences in the temperature values between our study and Deng et al.’s study. While our temperatures were slightly higher, it is important to note that the overall trend of decreasing temperature with increasing channel numbers remained consistent.
A similar trend can be seen in
Figure 10b; the average temperature (T
avg) decreased with the increase in the number of channels, and hence the temperature difference must be lower as possible. The surface standard deviation of temperature tells the uniformity distribution in the cold plate. The lower value of T
σ gives better uniformity. From
Figure 10c, channel number 13 shows the better uniformity of temperature distribution of 3.02 K whereas the 3-channel number shows 6.01 K, almost the doubled value. This explains that the coolant can absorb more heat from the plate and maintain temperature uniformity with an increase in the number of channels. However, the five-channel design showed a lower T
σ than that of the three-channel design. This phenomenon showed better uniformity in design 2 than in design 3. These aspects induce the way for further optimization. The research conducted by Jarrett and Kim (2011) [
9] focused on the design optimization of a cold plate, evaluating eight different designs. According to their study, the temperature standard deviation (T
σ) ranged from 1.5 K to 4.0 K across the different designs. In our preliminary analysis, we investigated 6 designs and found that the T
σ varied between 3 K and 6 K. While there is a difference in the specific temperature ranges between our study and Jarrett and Kim’s research, both studies highlight the variability of T
σ as an important factor in cold plate design optimization. Despite the disparities in the absolute values of T
σ, the overall emphasis on optimizing the design to reduce temperature variations remains consistent in both studies. The findings from our preliminary analysis align with the notion that T
σ can be controlled and minimized through design modifications and improvements. But this trend follows the opposite for pressure drop (Δp). The pressure in the inlet region is comparatively high. When the coolant starts entering the inlet region, the interface area between the plate channel and coolant gradually increases, and the resistance for the coolant flow increases. This eventually decreases the pressure of the coolant flow and results in an increase in pressure drop (Δp). Moreover, the zig-zag pattern and U-bend in the design further resist the flow and increase pressure drop. Therefore, the pressure drop increases proportionally to the number of channels, as shown in
Figure 11. Hence more power from the pump is required to pump the coolant to circulate till it reaches the outlet region in design 6 than in design 1. The boundary conditions at the outlet region are applied as the zero pressure outlet and resistance no longer increases; hence, regardless of the number of channel increases, the coolant pressure drop reaches a balance value, as shown in
Figure 11. The pressure drop (Δp) obtained in our study was compared to the findings of a relevant existing study conducted by Deng et al. (2018) [
14]. Specifically, we compared the pressure drop for systems with 3 and 5 channel numbers. In Deng et al.’s study, the pressure drop was reported to be approximately 20,000 Pa and 40,000 Pa, respectively. In contrast, our study demonstrated pressure drops of around 3000 Pa and 6500 Pa for the corresponding channel numbers. The observed discrepancy in the pressure drop comparison can be attributed to differences in the design flow pattern and the mass flow rate of the coolant used between the two studies. Despite these variations, it is important to note that both studies exhibit a similar trend in terms of pressure drop patterns. While our study yielded lower pressure drop values compared to Deng et al.’s study, this can be explained by the differences in design and coolant characteristics. The variations in flow pattern and mass flow rate inevitably influence the pressure drop outcomes. However, the fact that the overall trend remains consistent suggests that the fundamental behavior of the system is maintained, albeit with varying magnitudes. Therefore, while there may be differences in the absolute values of the pressure drop between our study and the existing literature, the overall trend observed in both studies is in agreement. This reinforces the reliability of our findings and highlights the importance of considering the impact of design factors and coolant characteristics when interpreting and comparing pressure drop results in similar systems.
Additionally, the velocity of the coolant decreases due to the zig-zag pattern and U-bend in the flowing channel. Consideration of the pressure drop parameter allows for the selection of the optimization phase. Another parameter that shows the cooling performance of the cold plate is the Heat transfer rate (W). The heat is transferred from the contact area or the interface between the cold plate and coolant. The heat transfer decreases with the increase in the number of channels, as shown in
Figure 12. This explains the heat transfer equation which is
Q = m.c.Δ
T, where
m is the mass,
c is the specific heat and Δ
T is the temperature difference.
When the number of channels increases from design 1 to design 6, the removal of material increases, and hence the conduction of heat transfer in the cold plate (solid) reduces; therefore, it reduces the heat transfer to the coolant. However, design 2 showed a higher heat transfer value of 722 W than that of design 1, which was 713 W. There was almost a 39% increase in heat transfer rate between design 2 and design 6, which shows the enhancement of the cooling performance of the cold plate. The average heat transfer coefficient between the plate and coolant was found to be 1.245 W/m
2-K for all designs. From the above-described parameters result, the
Tσ,
Tmax, and
Tavg were better in design 5 and 6 but showed better performance gradually in designs 2, 3, and 4, in terms of Δ
p and
h. In further analysis, due to the dimension constraint and high-pressure drop, designs 5 and 6 were kept unchanged for comparative study for further analysis and channel width changes in designs 2, 3, and 4. The summary of preliminary results is shown in
Table 4. By comparing our simulation results with the existing numerical study, we established a level of confidence in the accuracy and validity of our findings. The validation process helped verify that our simulation methodology and assumptions are consistent with established literature, further reinforcing the reliability of our result. Thus, proceeding with the optimization technique.
(b) Effect of change in channel width
Designs 2, 3, and 4 were considered to change the width (wp) of the channel. The channel width was changed from 12 mm to 14 mm and 16 mm and 18 mm for design 2 and the thickness remains constant. Due to design constraints in designs 3 and 4, the channel width changed to 14 mm and 16 mm (not 18 mm). The simulation was run with the same boundary conditions and inlet mass flow rate of 10 g/s and the results were analyzed and compared with those of designs 5 and 6.
Figure 13 shows the temperature gradient after channel width changes to 14 mm (a), 16 mm (b), and 18 mm (c). It is observed that there were no changes in temperature gradient and almost similar trends were obtained from the preliminary analysis. There was a correlation between the aspect ratio of the rectangular duct and the velocity. The velocity of the coolant decreases from 0.42 m/s to 0.36 m/s, to 0.31 m/s, and to 0.278 m/s for channel widths of 14 mm,16 mm, and 18 mm respectively. This decrease in velocity directly affects the average HTC, which observed negligible changes of nearly 0.06% and 0.09% in designs (a) and (b), respectively.
Figure 14 shows the Max temperature vs. temperature gradient and pressure drop. This decrease in velocity also affects the
Tσ shown in
Figure 15, where there is a negligible increase in the
Tσ with an increase in channel width.
But when compared to the preliminary analysis with design 5 and 6 give better temperature uniformity. The significant result that occurred by changing the width channel is the pressure drop (Δp); the pressure drop was drastically reduced when the channel width increased from 12 mm. This aspect is due to the lower resistance for the coolant and provides a large surface area for the coolant to flow. Hence, the design with a 16 mm channel width seems to achieve low-pressure drop. Among them, designs 2b, 2c, and 3b achieved a better pressure drop, and there were no significant changes in the heat transfer (W) compared to the preliminary design.
Hence, in this section, we conclude that changes in channel width show compelling decreases in the pressure drop from the preliminary analysis.
Tmax,
Tσ, and
h show only negligible changes. From this analysis, designs 5 and 6 show better performance in terms of
Tmax and
Tσ at the expense of pressure drop. To reduce the
Tσ and maximum temperature and also to overcome the pressure drop between the inlet and outlet, further investigation is required. Employing this analysis results shown in
Table 5, designs 2b, 2c, and 3b show improvement compared to those in the preliminary analysis. Hence, we considered designs 2b, 2c, and 3b for the next optimization phase.
(c) Effect of inlet mass flow rate
In this section, we checked whether the inlet flow rate affects the variations in parameters. From the study of Deng et al., 2018 [
14], the inlet flow rate affects the variation in
Tmax,
Tσ, Δ
p, and
h. Hence, the inlet mass flow rate was increased to 15 g/s (laminar flow) for designs 2b, 2c, and 3b. The obtained results were compared with the previous results.
Figure 16 and
Figure 17 show that the maximum temperature was reduced to 314 K from 320 K and also
Tσ was reduced, as shown in
Table 6, which was a compelling improvement in cooling performance, but the pressure drop increased by 49% in each case. This phenomenon explains that the increase in mass flow rate has an impact on
Tmax,
Tσ, and Δ
p. Additionally, mass flow rate did not affect much in heat transfer, which had a slight increase in all designs.
Therefore, a further increase in mass flow would increase the performance of the cold plate but further increase the pressure drop by nearly 50%. Hence designs 2b, 2c, and 3b did not differ much in the cooling performance of the cold plate.
(d) Effect of change in heat flux
Until
Section 4 (c), the 2C discharge rate (7000 W/m
2) was used for the analysis. Further investigation was performed on designs 2c and 3b with a higher discharge rate of 3C, 4C, and 5C. The heat flux applied on the top surface of the upper plate was changed to 11,000 W/m
2, 15,000 W/m
2, and 19,000 W/m
2 from the respective discharge rate. The aim of this section (d) is to find the optimal condition of the cold plate under different discharge rates. We found that an increase in the heat flux increases the
Tmax,
Tσ, and
h.
Tmax increased to nearly 9K in each case, as shown in
Figure 18. The pressure drop remained constant for all cases concerning each design.
In
Table 7, it is shown that both designs showed similar
Tmax and negligible changes in both designs concerning different heat flux. Hence design 2c and 3b with a discharge rate of 2C and 3C were found to be the optimal designs for under operating condition of the battery pack and also in uniform distribution of temperature. However, designs with a discharge rate of 4C and 5C must also be optimized to ensure the cold plate operates in all discharge rates. Designs 2c and 3b showed similar results, so we chose design 2c (5-channel with 18 mm) for the next optimization method.
(e) Effect of change in inlet coolant temperature
In this section, the temperature of the inlet coolant temperature has been reduced to 293 K (20 °C) for design 2c for different heat fluxes. The variation in temperature distribution is shown in
Figure 19. There was a significant improvement in the temperature gradient, which reduced by nearly 6 K in each design, and an improvement in the heat transfer rate. There were no significant changes in the
Tσ, which showed only a 0.1 K difference compared to the previous analysis.
This section concludes with
Table 8 and
Table 9 showing that the inlet coolant temperature affects the performance of the cold plate. The coolant temperature showed a linear relation with
Tmax. The decrease of coolant by each degree resulted in a decrease of approximately every degree in
Tmax and also showed a similar relationship with an increase in
Tσ. Hence, the design with 4C is now under moderately optimum conditions in terms of
Tσ when the coolant temperature is reduced. In all cases, maximum temperature occurred at the outlet side of the cold plate. From the previous analysis (section b), we found that an increase in channel width decreases the maximum temperature and reduces the pressure drop.
(f) Effect of change in channel width at the outlet side
Further investigation was performed to reduce the temperature at the outlet side by increasing the channel width by 2 mm, as shown in
Figure 20. For the investigation, design 2c with a mass flow rate of 15 g/s and discharge rate of 2C (7000 W/m
2) was analyzed.
The simulation results show a small decrease in temperature by 1 K and a change of pressure drop from 6.355 × 10³ Pa to 6.116 × 10³ Pa. There were no changes in Tσ and h. Hence the change of channel width by 2 mm at the outlet side reduced the temperature by 1 K. Therefore, it showed no compelling changes to the result when the width of the channel at the outlet increased.
In this paper, modeling, and simulation were conducted in a zig-zag channel cold plate in a steady state condition. The objective was to enhance the cooling performance of the cold plate for bigger Li-ion batteries without extracting more power from the pump through optimization. Initially, six sets of the cold plate were designed based on a number of channels. Aluminium was used for cold plates and water as a coolant. A preliminary analysis was conducted by providing a heat flux of 7000 W/m2 (2C discharge rate) to obtain the baseline values. The simulation results were gathered based on temperature evolution, pressure drop, heat transfer between solid–fluid interface, and surface standard deviation of temperature. Preliminary results showed that a cold plate with a larger number of channels has good temperature uniformity (Tσ), i.e., the 13-channel cold plate had Tσ = 3.2 K and the 3-channel cold plate had Tσ = 6.01 K and maximum temperature Tmax for the 3-channel cold planet was 330.84 K whereas for the 13-channel cold plate was 316 K. This trend was opposite in case of pressure drop. When the number of channels increased from 3 to 13, resistance increased. Hence, the 13-channel cold plate showed a larger pressure drop (13.34 × 10³ Pa) compared to the 3-channel cold plate (3.84 × 10³ Pa). Heat transfer rate follows the same trend of Tmax and Tσ, and this is due to the removal of material leading to the decrease in the conduction of the cold plate. From this result, further optimization was carried out to maximize the heat transfer rate and minimize the Tmax, Tσ and Δp. Further optimization was carried out on 5-, 7- and 9-channel cold plates by increasing the channel width with a mass flow rate of 10 g/s. The results showed that an increase in channel width decreased the velocity of the coolant and also showed a significant improvement in pressure drop and negligible changes in Tmax, Tσ, and no changes in heat transfer rate. The third step of optimization was conducted by increasing the mass flow rate from 10 g/s to 15 g/s (laminar flow) for 5- and 7-channel cold plates. It was observed that there was a significant reduction in the temperature evolution (Tmax = 314 K) in all cases, surface standard deviation (Tσ = 2.7 K to 3.08 K), and heat transfer rate (h = 726 W to 729 W). With this optimization method, we observed that the 5- and 7-channel numbers were optimal when the battery discharge rate of 2C was applied. Further investigation was carried out to analyze those channel numbers with higher discharge rates. The result showed that all the parameters increased with an increase in heat flux. The discharge rate of 2C and 3C are provided under the operating temperature. Hence, to obtain 4C and 5C under optimal conditions, the inlet temperature of the coolant was reduced from 300 K to 293 K in the 5-channel design. The temperature gradient was reduced to nearly 6 K in all discharge rates. One observation from all simulation analyses was that the maximum temperature occurs on the outlet side of the cold plate. Therefore, an increase in channel width of 2 mm on the outlet side showed only a negligible 1 K. This did not show any compelling outcome. Overall, our findings have significant implications when bigger Li-ion batteries are used.


