Article

Numerical Analysis of Tar and Syngas Formation during the Steam Gasification of Biomass in a Fluidized Bed

by
Abolhasan Hashemisohi
1,
Lijun Wang
2,* and
Abolghasem Shahbazi
2
1
Department of Computational Data Science and Engineering, North Carolina Agricultural and Technical State University, 1601 East Market Street, Greensboro, NC 27411, USA
2
Department of Natural Resources and Environmental Design, North Carolina Agricultural and Technical State University, 1601 East Market Street, Greensboro, NC 27411, USA
*
Author to whom correspondence should be addressed.
Energies 2023, 16(14), 5283; https://doi.org/10.3390/en16145283
Submission received: 25 May 2023 / Revised: 24 June 2023 / Accepted: 30 June 2023 / Published: 10 July 2023
(This article belongs to the Section A4: Bio-Energy)

Abstract

:
A sequential modular hydrodynamic model integrated with detailed reaction kinetics (SMHM-RK) was developed and validated to predict tar and syngas components produced by the steam gasification of biomass in a fluidized bed gasifier. The simulations showed that the prediction accuracy is sensitive to both models for hydrodynamics and reaction kinetics. The simulations showed that the tar composition predicted by the SMHM-RK was more close to the measured values than those predicted by the well-mixed hydrodynamic model integrated with the same reaction kinetics (WMHM-RK). The predictions showed that the total tar decreased, but the polycyclic aromatic tar compounds increased with the increase in gasification temperature. There was an optimum steam-to-biomass ratio (SBR) for minimizing tar formation. The simulations found that the contents of total tar and heavy tar compounds decreased by increasing the SBR from 0.3 to 0.9, and then increased by further increasing the SBR. The injection of a small amount of oxygen in steam gasification cannot reduce tar formation. The injection of oxygen in steam gasification changed the reaction pathways of naphthalene to produce more naphthalene in the syngas. The de-volatilization rate affects pyrolytic volatile compositions and subsequent tar formation. Therefore, biomass devolatilization and homogeneous gas reactions should be solved simultaneously to accurately predict the syngas and tar composition.

1. Introduction

Fluidized bed gasification technology that has the ability to facilitate intensive contact between gasifying agents and solid fuels can be used to produce syngas in large quantities from biomass to replace fossil fuels for the production of various chemical and energy products [1]. However, a significant amount of tar (which is all hydrocarbons heavier than benzene) is produced during the fluidized bed gasification of biomass. The amount of tar in raw syngas is typically more than 10 g/Nm3 [2]. Physical properties and dew points are used to categorize tar into five classes, from light to heavy compounds. Class 4 tar compounds such as naphthalene and Class 5 tar compounds such as heavy polycyclic aromatics hydrocarbons (PAHs) are easily condensed and can create several issues, such as clogging filters, lowering the yield and heating value of the syngas, and contamination of catalysts, among others, in downstream processes [2].
Tar removal is one of the most important steps in the development and design of a fluidized bed biomass gasification process [3]. Both the tar concentration and composition affect the cost and complexity of the downstream cleaning of tars. In situ (primary measures) and post-gasification approaches (secondary measures) have been used to reduce the amount of tar in syngas and change its composition for different applications [3].
The optimization of the operating conditions, design of new fluidized bed configurations, and the use of catalysts or novel bed materials are the primary tar reduction approaches that can reduce the cost and type of tar cleaning required in downstream applications of syngas [3,4]. Changes in the operating conditions such as temperature, type of oxidizing agent, and oxidizing-agent-to-biomass ratio not only affect tar formation, but also affect the gasification efficiency and syngas yield. Therefore, as all these parameters are related to each other in a complex way, it is essential to develop a mathematical model that can predict the effects of different parameters on syngas composition and tar formation for optimizing the operation of a gasifier [5].
Most of the mathematical models reported in literature that have been used to simulate fluidized bed gasification had two major assumptions: biomass releasing tar as a lumped compound, and the use of a simple global reaction rate for tar oxidation or cracking [6,7]. These two assumptions cannot give enough information about the formation of various tar components and the effect of different operating conditions on the compositions of tar and syngas. Recently, detailed kinetic models for the combustion of different hydrocarbons, which were initially developed for simulations of internal combustion, have been extended to the simulation of biomass gasification in several studies [8,9,10,11]. An extensive kinetic model with 451 species and 17,848 reactions was recently developed by the CRECK Modeling Group (http://creckmodeling.chem.polimi.it/menu-kinetics/menu-kinetics-detailed-mechanisms, accessed on 24 May 2023) for various pyrolysis, gasification, and combustion reactions [11]. Computational fluid dynamics (CFD) is the most accurate simulation tool to analyze complicated physical and chemical phenomena in a fluidized bed reactor [3]. However, as these kinetic models with large numbers of species and reactions are computationally intensive, they cannot be used in sophisticated CFD models to predict the dynamic formation of various tar and syngas compounds inside a fluidized bed gasifier. Detailed reaction kinetics models have been used with simple well-mixed hydrodynamic models by considering a fluidized bed reactor as one or two continuous stirred tank reactors (CSTR) to predict the composition of syngas with large discrepancies [12]. Moreover, well-mixed hydrodynamic models have been used for the simulation of pyrolysis in the absence of oxygen, and there is insufficient information on using this approach for biomass gasification where oxygen molecules are present and can interfere with the reactions.
A sequential modular simulation approach has been developed to simulate a fluidized bed reactor [13]. In this method, a fluidized bed reactor was divided into several stages of CSTR and plug flow reactor (PFR) pairs. At each stage, the CSTR and the PFR represent the emulsion and bubble phases, respectively. Mass and heat transfer occurs between the bubble and emulsion phases at the end of each stage. In this work, a SMHM-RK was built to improve the prediction of tar and syngas components during biomass gasification in a fluidized bed by considering the effects of heat and mass transfer, and the oxygen-rich area at the bottom of the gasifier.

2. Materials and Methods

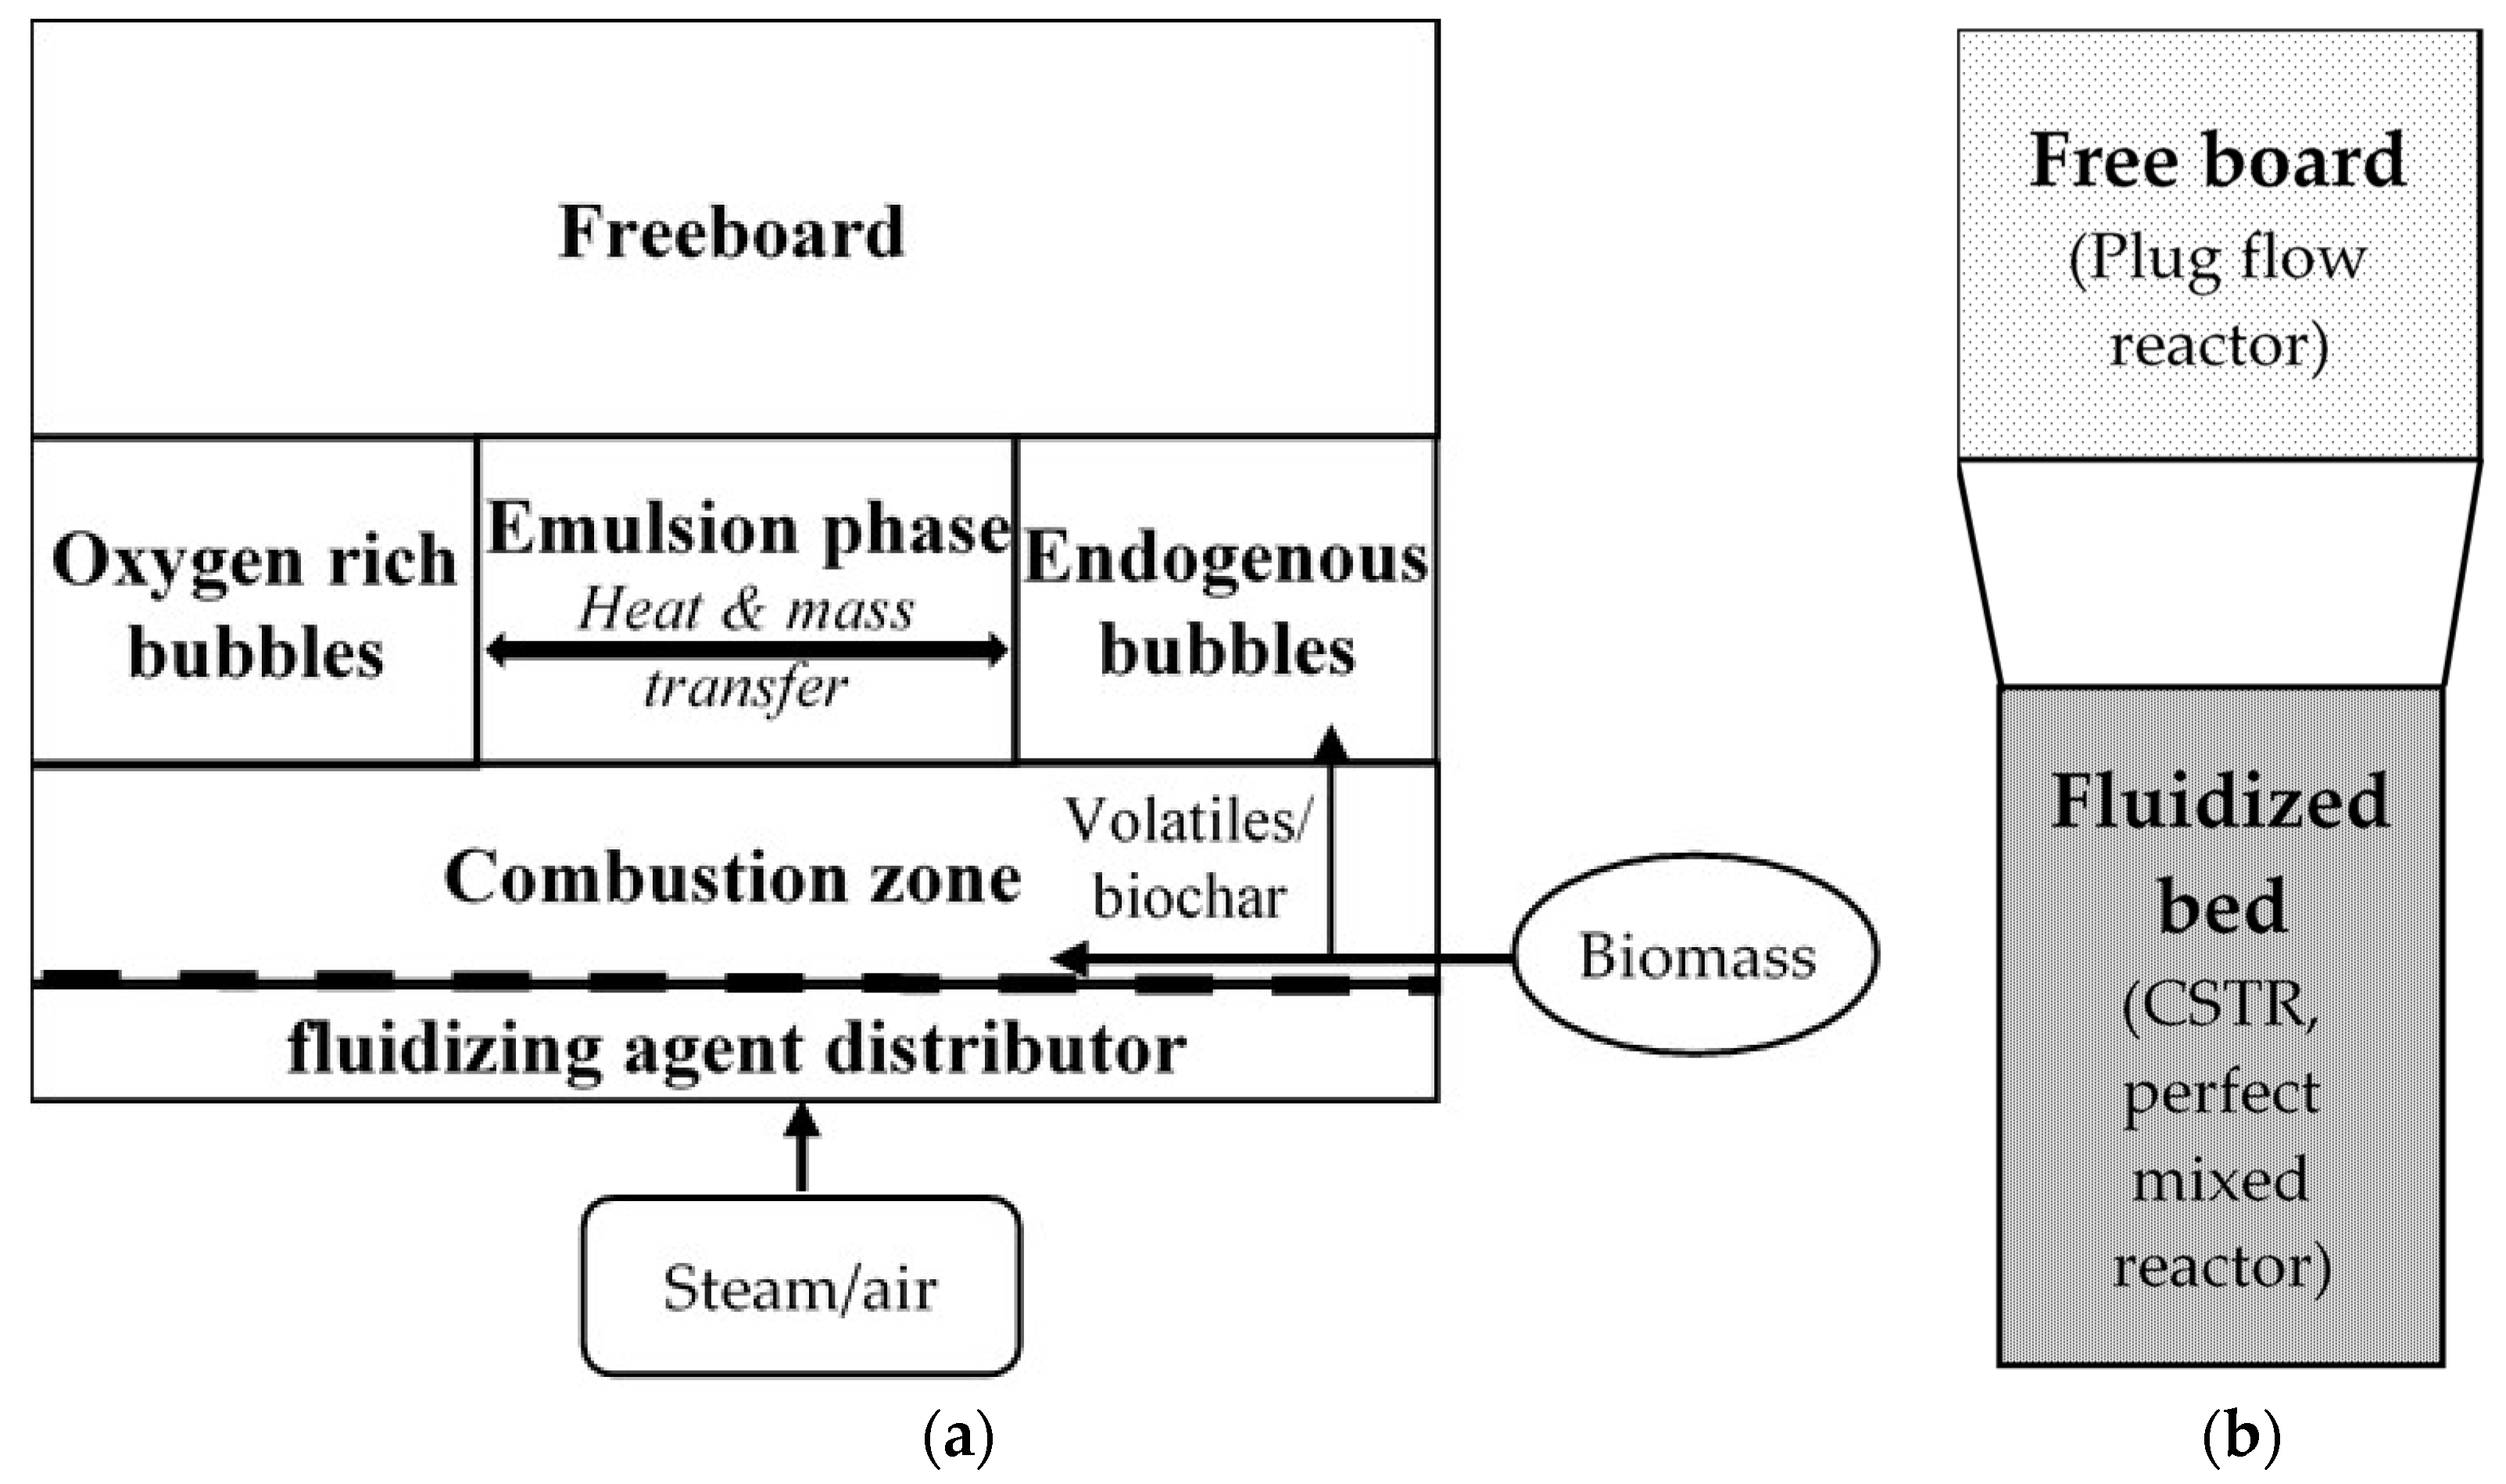
2.1. Sequential Modular Modeling of Hydrodynamics in a Fluidized Bed

Figure 1a shows the scheme of the sequential modular reactor model that we developed to simulate the hydrodynamics in a fluidized bed. The fluidizing agent of an air and steam mixture at various fractions was passed through a porous distributor plate. The biomass feeder was located just above the distributor. The fluidized bed consisted of a combustion zone at the bottom and two gasification phases at the top; there exist the emulsion phase of mixed gas and solid particles and the bubble phase of gases with a negligible amount of solid particles. The bubble phase was further divided into fuel-rich bubbles and oxygen-rich bubbles. The model includes a set of CSTR and PFR reactors for modeling the combustion zone, fuel-rich bubbles (endogenous), oxygen-rich bubbles, and the emulsion phase in a fluidized bed. The combustion zone and emulsion phase were simulated as perfectly mixed CSTRs. Fuel-rich bubbles and oxygen-rich bubbles were simulated as PFRs with heat and mass transfer with the emulsion phase. The coalescence of the endogenous bubble and oxygen-rich bubble was neglected in this work, and it was assumed that they have heat and mass transfer with the emulsion phase. The temperatures of the bed and freeboard regions were assumed to be constant. The detail of using a sequential modular approach for simulating a fluidized bed can be found in the literature [13].
The bubbling gasifier works at a superficial velocity, U0, which is about 2–3 times the minimum fluidization velocity, Umf. In this study, the superficial gas velocity was kept constant at 0.45 m/s. The bubble diameter and rise velocity were determined as follows: [13]
d b = 0.21 H f 0.8 U 0 U m f 0.42 e x p U 0 U m f 2 0.1 U 0 U m f
U b r = 0.711 g D b
where Hf is the bed height and g is the gravity.
The emulsion velocity, Ue, and bubble velocity, Ub, are determined by
U e = U 0 δ U b 1 δ
U b = U 0 U e + U b r
where δ is the bubble fraction.
The molar balance of the species A in the emulsion and bubble phases can be written as
d C A , b d z = r A , b ε b + K b e δ C A b C A e U b
d C A , e d z = r A , e ε e 1 δ K b e C A b C A e U e 1 δ
where CA,b and CA,e are the concentration of species A in the bubble and emulsion phases, z is the location in the bed height, rA,b and rA,e are the reaction rates in the bubble and emulsion phases for species A that were determined via reaction kinetics [9,10,11], a n d   K b e   is the mass transfer coefficient between the emulsion phase and bubble phase, which is calculated using the correlations presented in Table 1. The other parameters in Equations (1)–(6) are defined and given in Table 1.
The outlet of the CSTR for the combustion zone is the inlet for the one CSTR and two PFRs of gasification, which are solved simultaneously [13]. For comparison of the effect of the hydrodynamic profile on the prediction accuracy, we also conducted simulations using the traditional well-mixed hydrodynamic model integrated with reaction kinetics (WMHM-RK). In this case, the fluidized bed gasifier was considered as a CSTR, as shown in Figure 1b.

2.2. Heat Transfer in a Biomass Particle

Heat transfer to a particle during the devolatilization process includes convection between the gas phase and particles and heat of reaction, which determine the particle temperature as follows:
m p C p d T p d t = h A p T T p + H i R i V
where m p is the mass of one particle, Tp is the particle temperature, Ap is the surface area of the particle, C p is the specific heat capacity of the material, and T is the bed temperature. The first term on the right side of Equation (7) is the convection heat transfer between the particle and the bed; the overall convective heat transfer coefficient, h, is expressed as the average value of the particle–particle h s and particle–gas h f convective heat transfer coefficients, both of which are determined using the correlations from the results of Nusselt, Archimedes, Reynolds and Prandtl given in the literature [12]:
h = ( h s + h f ) 2
The second term on the right side of Equation (7) is the overall heat of reactions, which is determined using the reaction kinetic model [9,10,11]. It should be mentioned that exothermic char formation reactions are the source of heat during pyrolysis, while tar releasing reactions are endothermic. During the pyrolysis process, the gases are released, and char and trapped metaplastic species are left as the residue. Metaplastic species are defined as the whole range of oxygenated and hydrogenated groups bonded to the carbonaceous matrix. The gases trapped in this phase will be gradually released. Table 2 gives the physical and chemical composition of the biomass particles.

2.3. Biomass Devolatilization Kinetics

During the pyrolysis process, the volatiles are released, and char and trapped metaplastic species are left as the solid residue. Metaplastic species are defined as the whole range of oxygenated and hydrogenated groups bonded to the carbonaceous matrix. The gases trapped in this phase are gradually released. The biomass was assumed to contain macromolecular components of cellulose, hemicellulose, and lignin (LIG), including lignin with rich carbon (LIGC), lignin with rich hydrogen (LIGH), and lignin with rich oxygen (LIGO). The devolatilization rate of the individual components of the biomass particles generating volatiles is expressed as [13]
r   s 1 = A e x p E a R T
where A is the pre-exponential coefficient, Ea is the activation energy, R is the universal gas constant, and T is the temperature in Kelvin. The values of A and Ea for the devolatilization of the various biomass components can be found in the literature [13].
In this study, biomass particles were injected into the bed. Devolatilization reactions cause the release of the volatiles into the bed. The volatiles further experience various gasification reactions. The mass fraction of volatile material below the feed position was considered to be the portion of the volatiles that are released into the combustion area to react with incoming oxygen. Table 2 shows the physical and chemical composition of the biomass particles used in this study.
The detailed kinetics of gasification with 451 species and 17,848 reactions, as developed by the CRECK Modeling Group (http://creckmodeling.chem.polimi.it/menu-kinetics/menu-kinetics-detailed-mechanisms, accessed on 24 May 2023), are available to predict a wide range of components produced by biomass gasification [11].

2.4. Solution and Validation

Cantera (https://cantera.org/, accessed on 24 May 2023), which is an open-source software, was used to import the complex kinetics in Chemkin format [9,11]. MATLAB-ODE15s was used to solve the ordinary differential equations. The model was validated by comparing the predicted and measured compositions of target syngas and tar species.

3. Results and Discussion

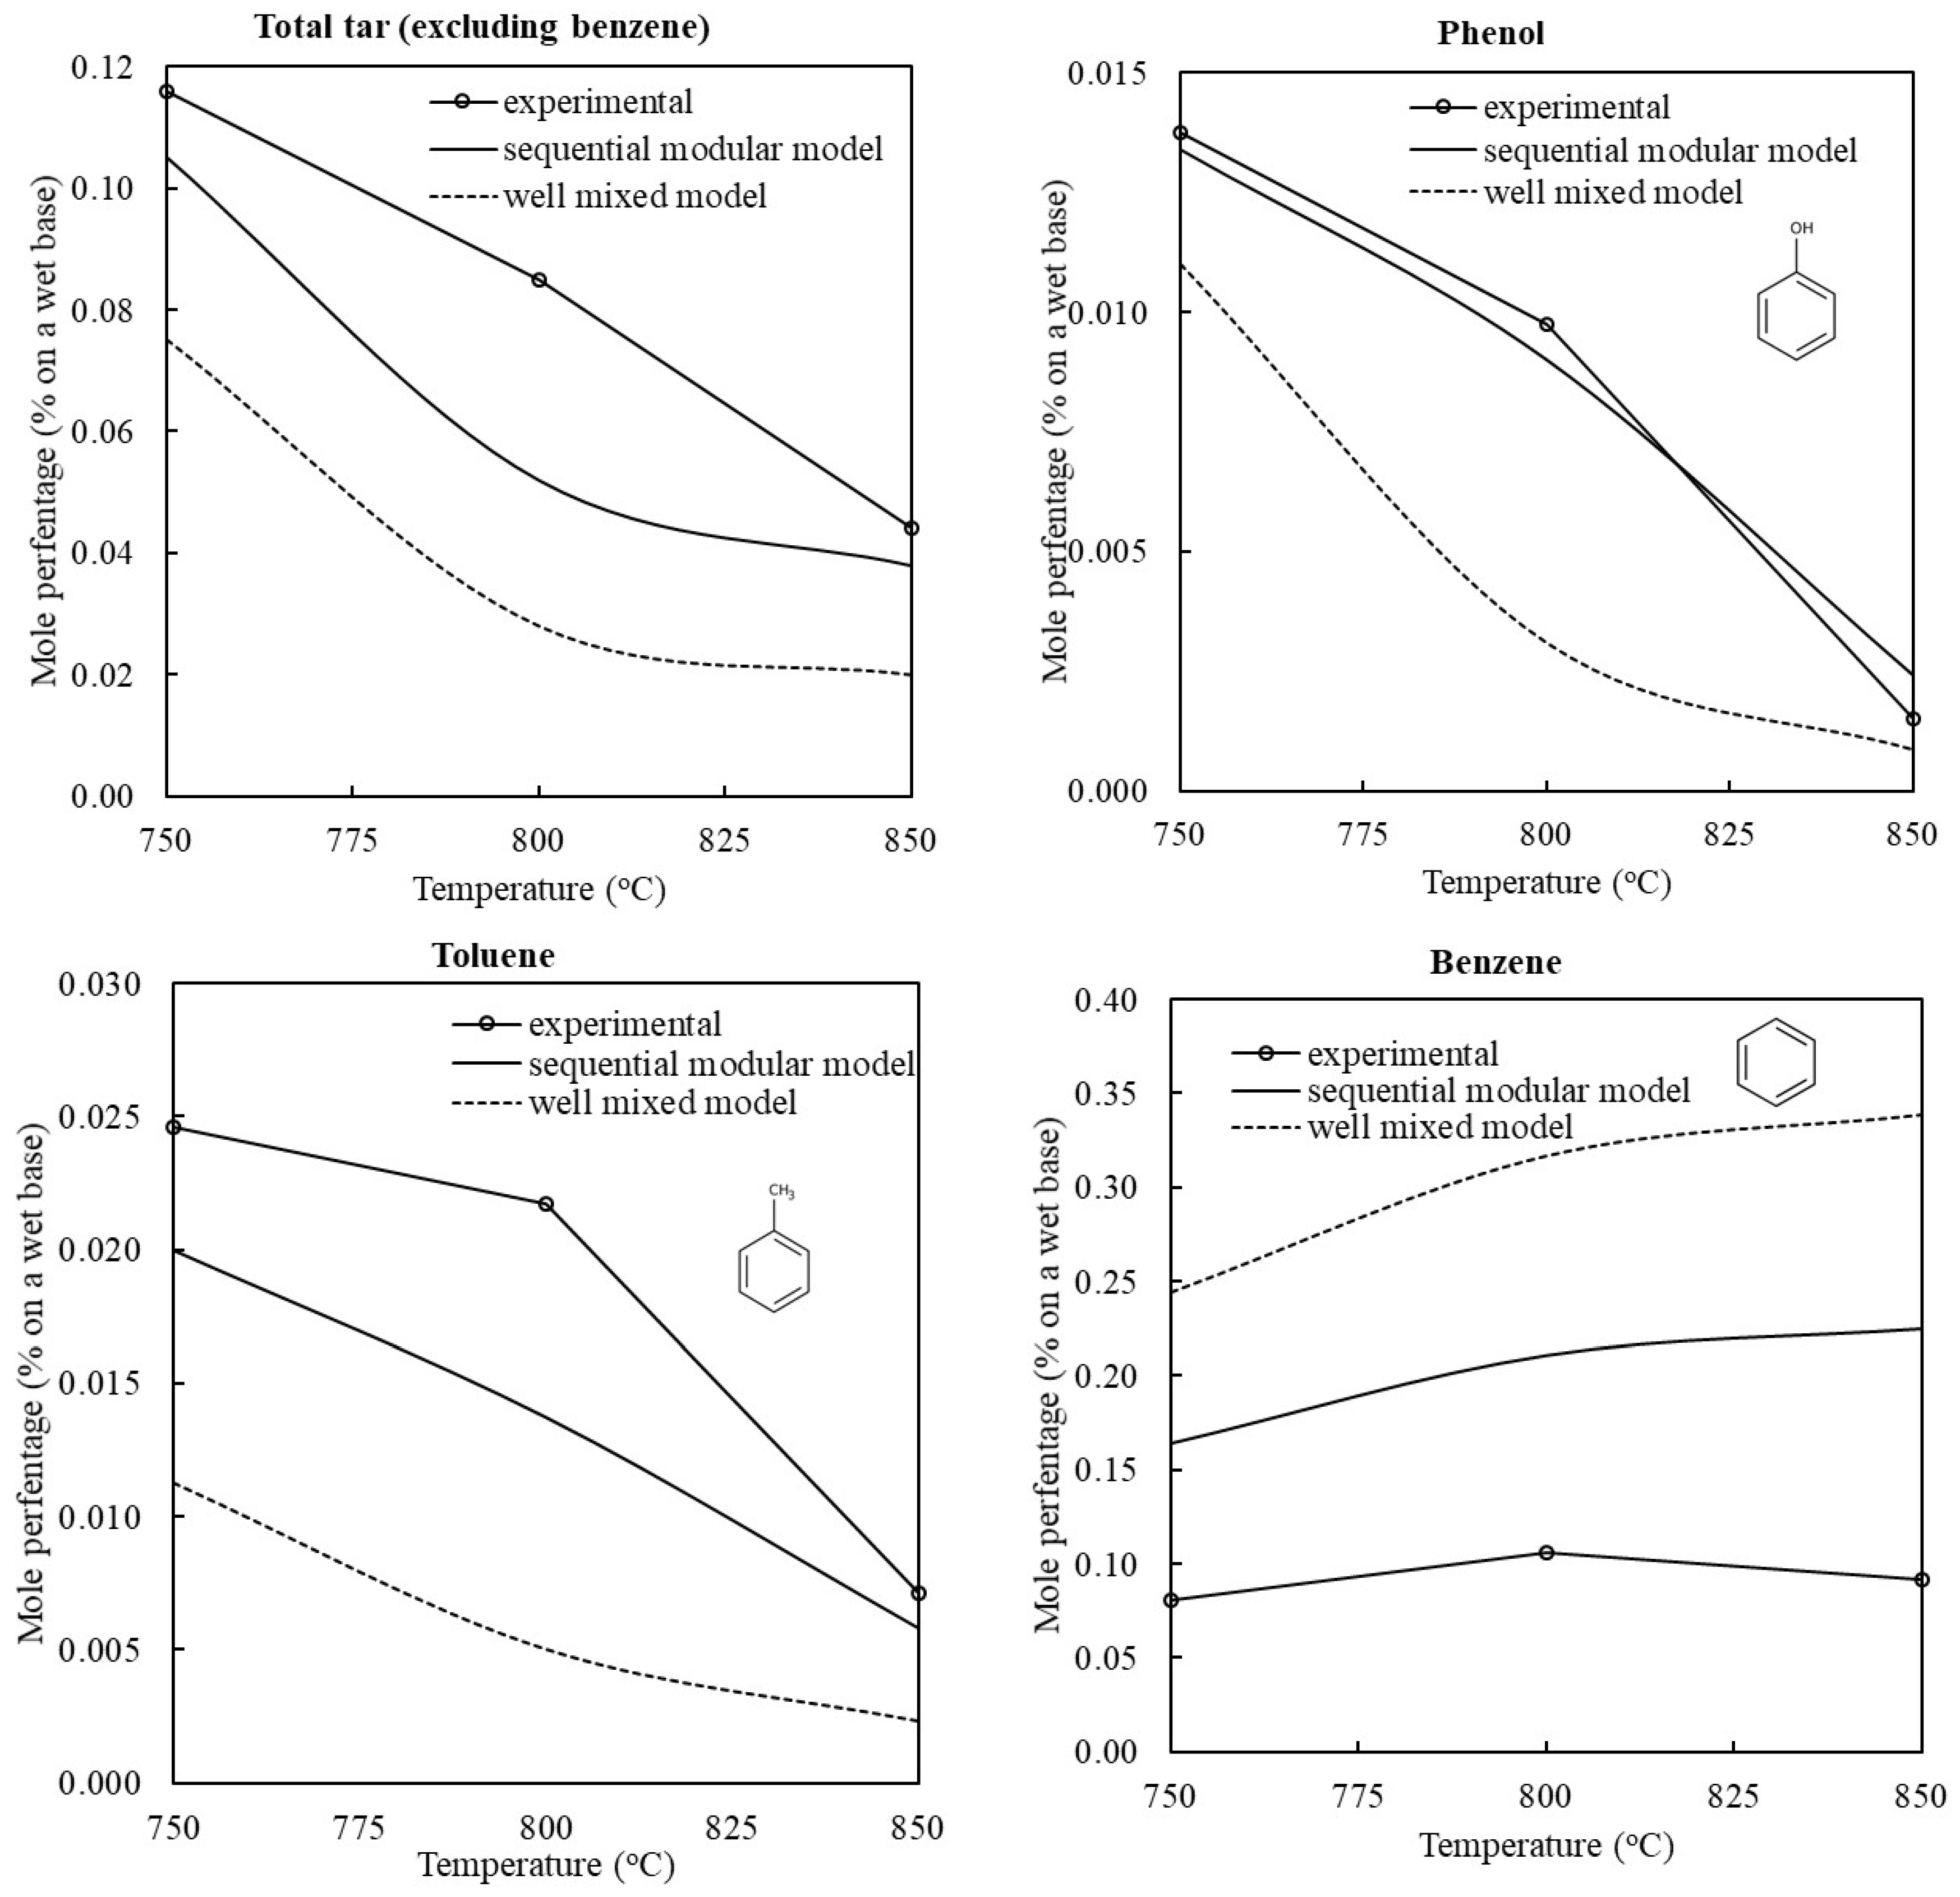
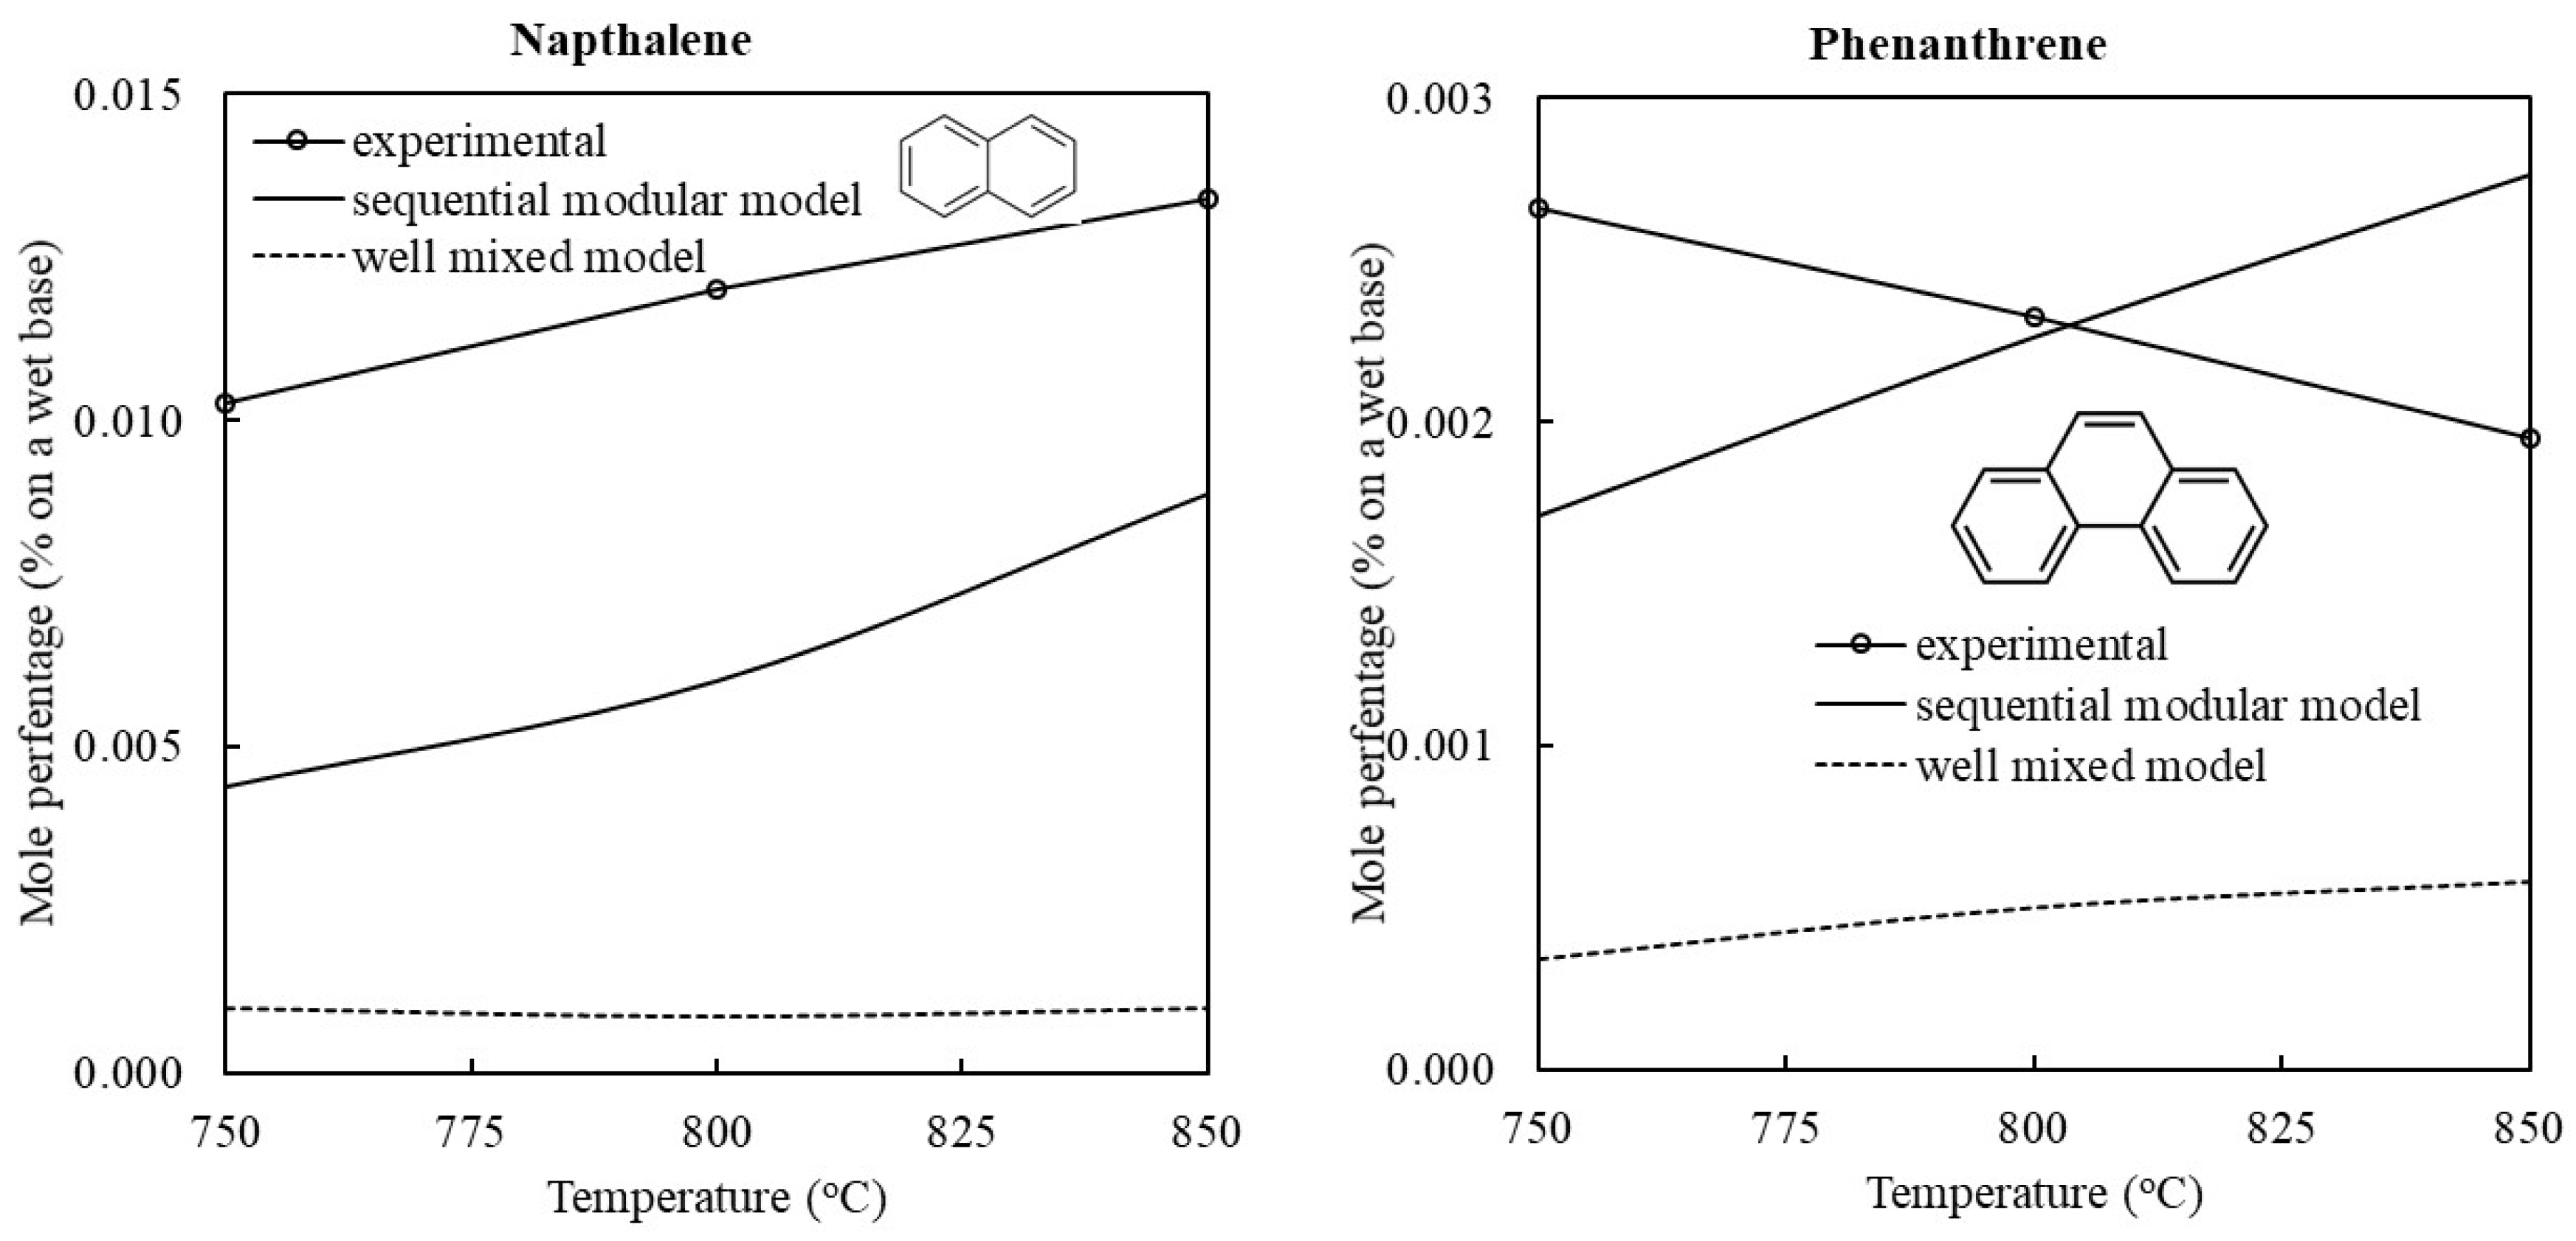
3.1. Validation of the Model

Figure 2 shows a comparison of the tar compositions in the syngas predicted by the SMHM-RK and measured using experiments reported in the literature [12]. Simulations were also conducted on the WMHM-RK to analyze the effects of mixing on the accuracy of the predicted tar contents. The total tar content was reported as the sum of individual tar compounds, excluding benzene, in the literature [12]. It can be seen from Figure 2 that the contents of major tar compounds and total tar predicted by the SMHM-RK were closer to the measured values than those predicted by the WMHM-RK. Therefore, a fluidized bed reactor cannot be modelled as a well-mixed CSTR. The sequential modular hydrodynamic model using a set of CSTRs and PFRs could better predict the hydrodynamics in a fluidized bed.
The predicted total tar content using the SMHM-RK agreed with the measured value. At 850 °C, the total tar contents in syngas predicted by the SMHM-RK and WMHM-RK were 0.038% and 0.02%, respectively, compared to the 0.044% measured value. The SMHM-RK over-predicted the benzene content by two to three times, but under-predicted some other tar compounds at various bed temperatures. As the tar was represented by a group of selected molecules, such as naphthalene and toluene, in the kinetic model, the neglect of some heavy tar compounds may have affected the prediction accuracy. Furthermore, the bed material (sand) was considered to be inert, and the neglect of its catalytic effects may also have affected the prediction accuracy [12]. Figure 2 also shows that the total tar content and the contents of primary tar compounds of phenol and toluene decreased, but the contents of benzene, naphthalene, and polycyclic aromatic hydrocarbons (PAHs) increased when the temperature increased. This means that the increase in the gasification temperature could decrease the total tar content but increase the tar compounds with higher dew points in the syngas. This trend was also reported in the literature [12].

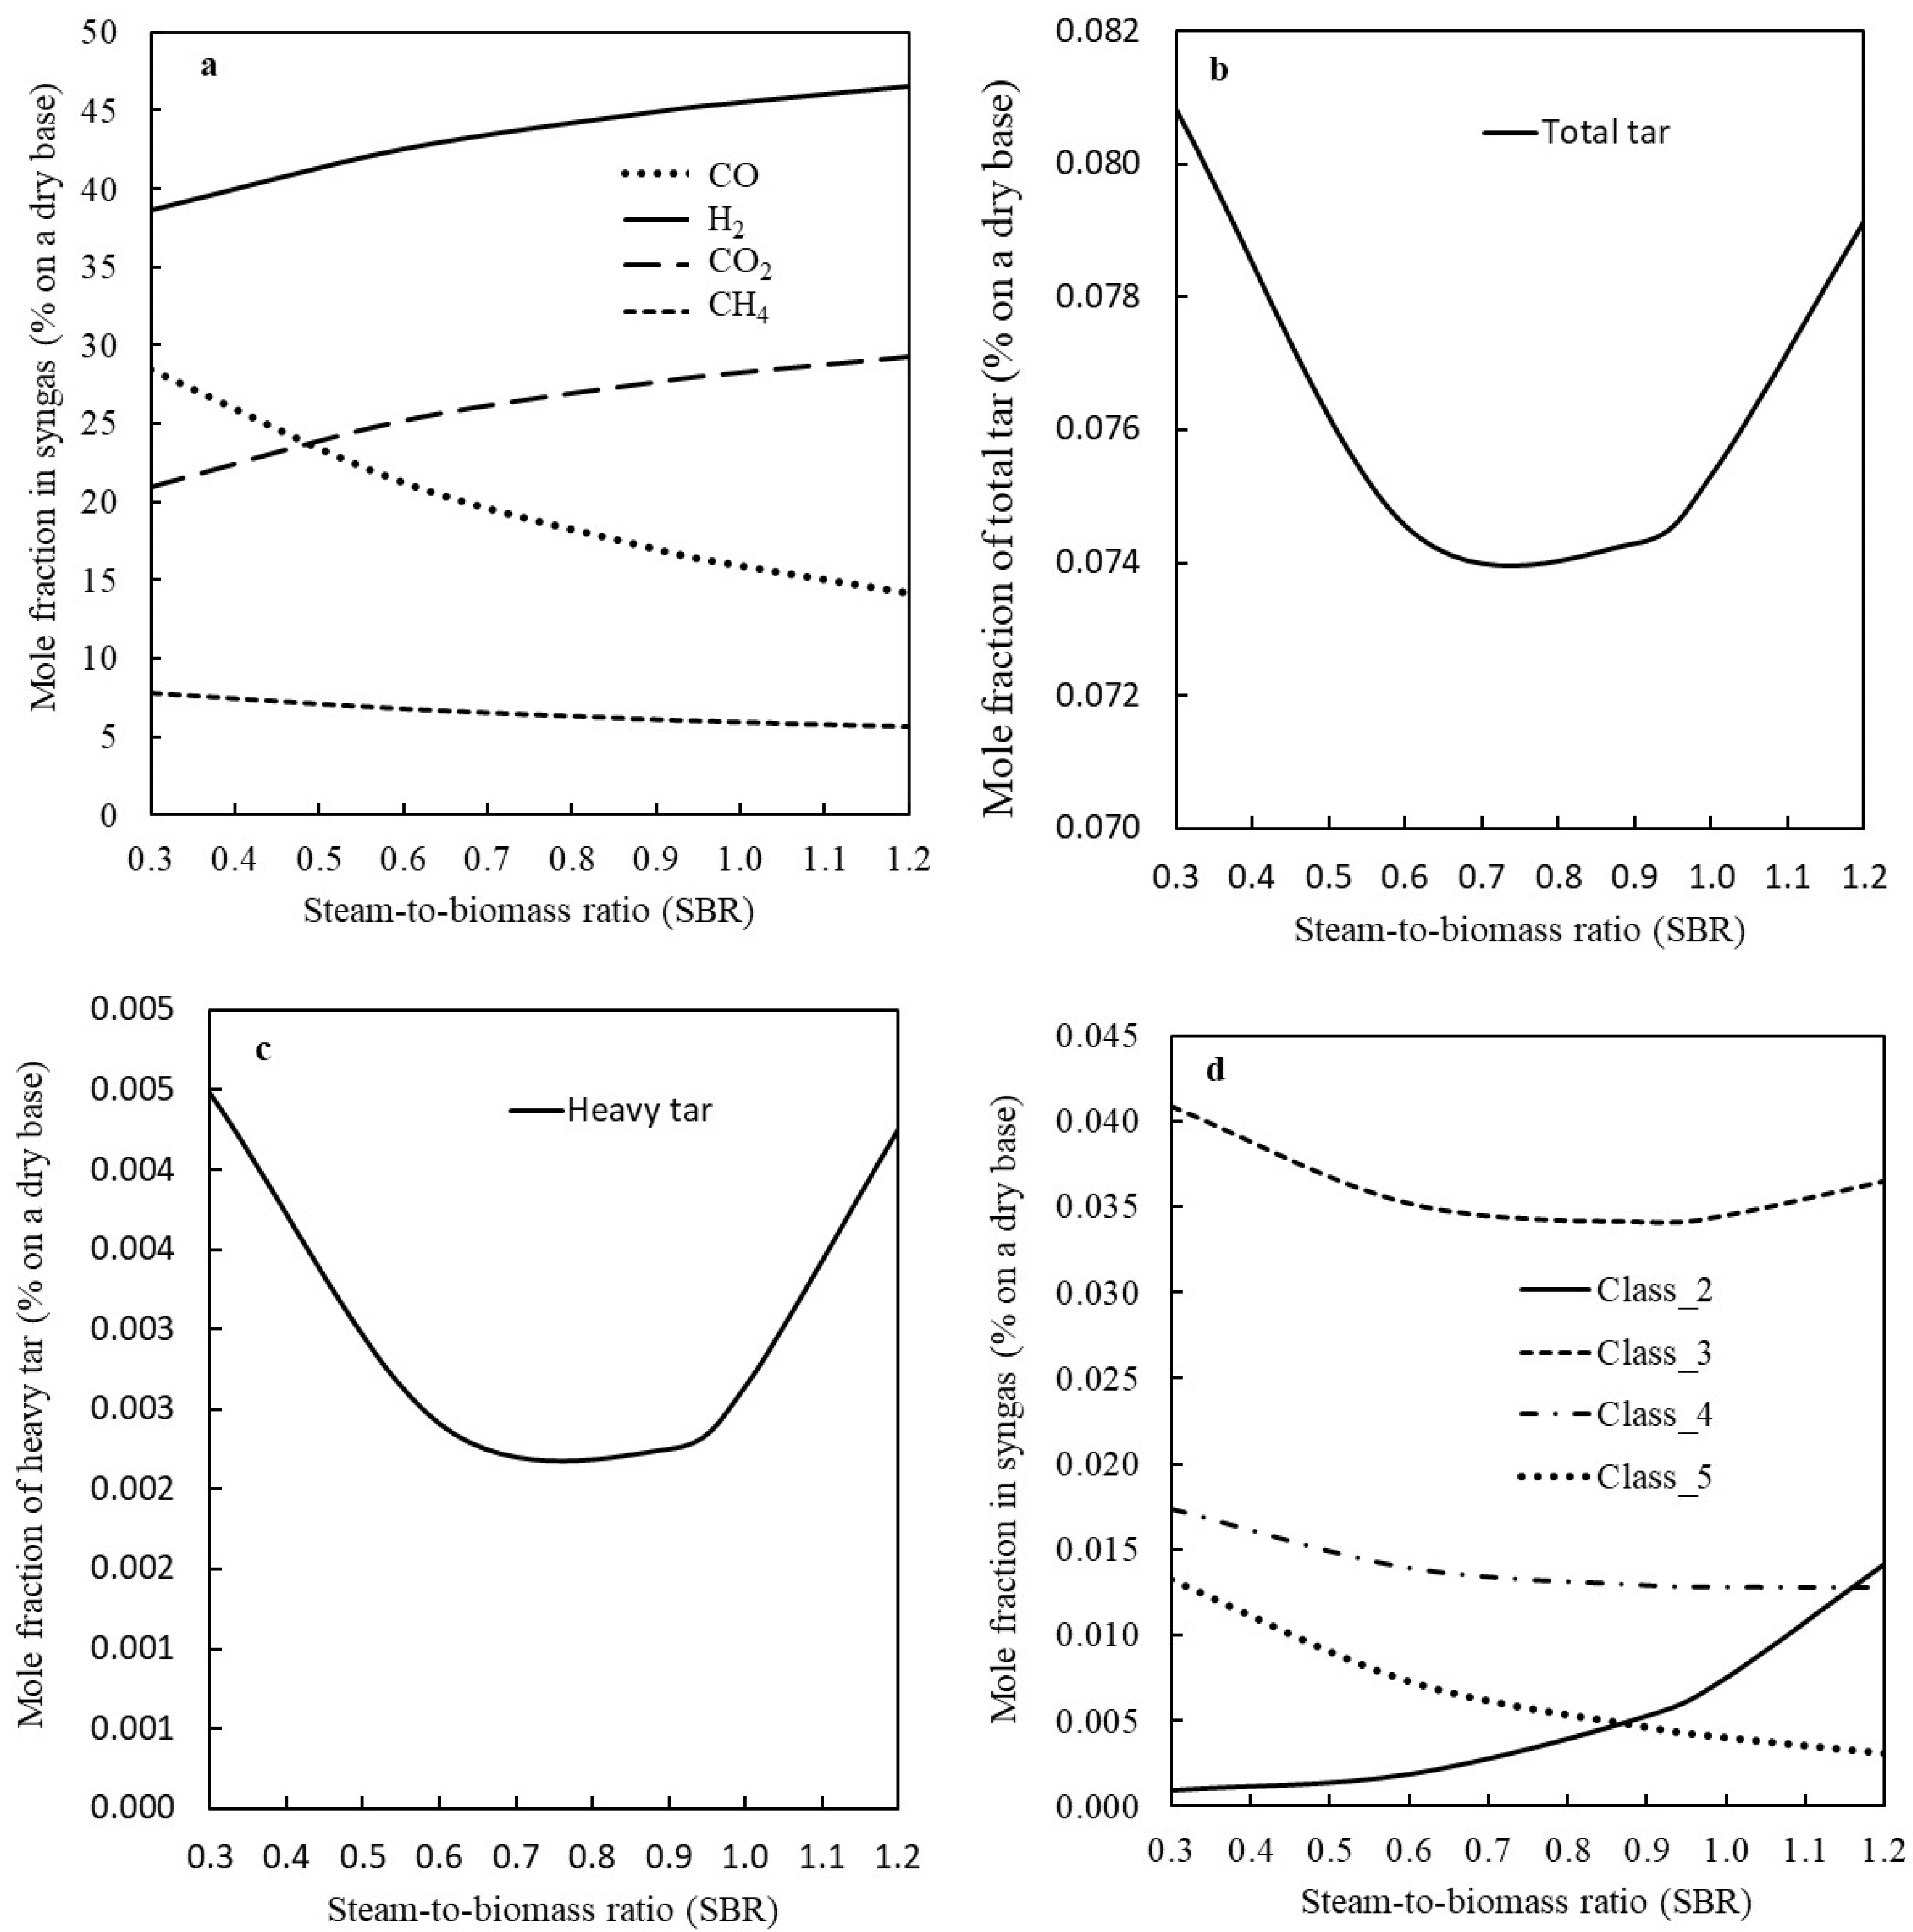
3.2. The Effect of Steam-to-Biomass Ratio on the Syngas Quality

Figure 3 shows the effect of steam-to-biomass ratio (SBR) on the syngas quality. As seen from Figure 3a, H2 and CO2 contents increased, while the CO and CH4 contents decreased when the SBR increased; this is due to the water–gas shift and steam-reforming reactions.
The results given in Figure 3b show that the total tar content and heavy tars decreased when the SBR increased from 0.3 to 0.9, and then increased when the SBR further increased; this is because of the lower residence time of the tar compounds in the gasifier at a higher SBR. It should be noticed that the increase in SBR can promote the steam-reforming of tar compounds, but can also decrease the residence time of those volatiles in the reactor. Therefore, there was an optimum SBR between 0.9 and 1 for minimizing the total tar and heavy tar contents. This number would be different if the other operating conditions and the reactor design were changed. Figure 3c shows that class 4 and class 5 tar components slightly decreased when the SBR increased within the range of 0.3 to 1.2. This result confirmed that the PAH tar was not decreased along the bed height when the residence time increased, and that their amount would increase after their initial formation. This means the increase in the residence time does not help to decrease these tar components, while the increase in the steam will decrease the initial formation of these PAH components. Figure 3c also shows that class 3 follows the same trend as total tar, but class 2 tar increases with the increase in the SBR, which means the quantity of this class of tar depends significantly on residence time rather than the steam-to-biomass ratio.

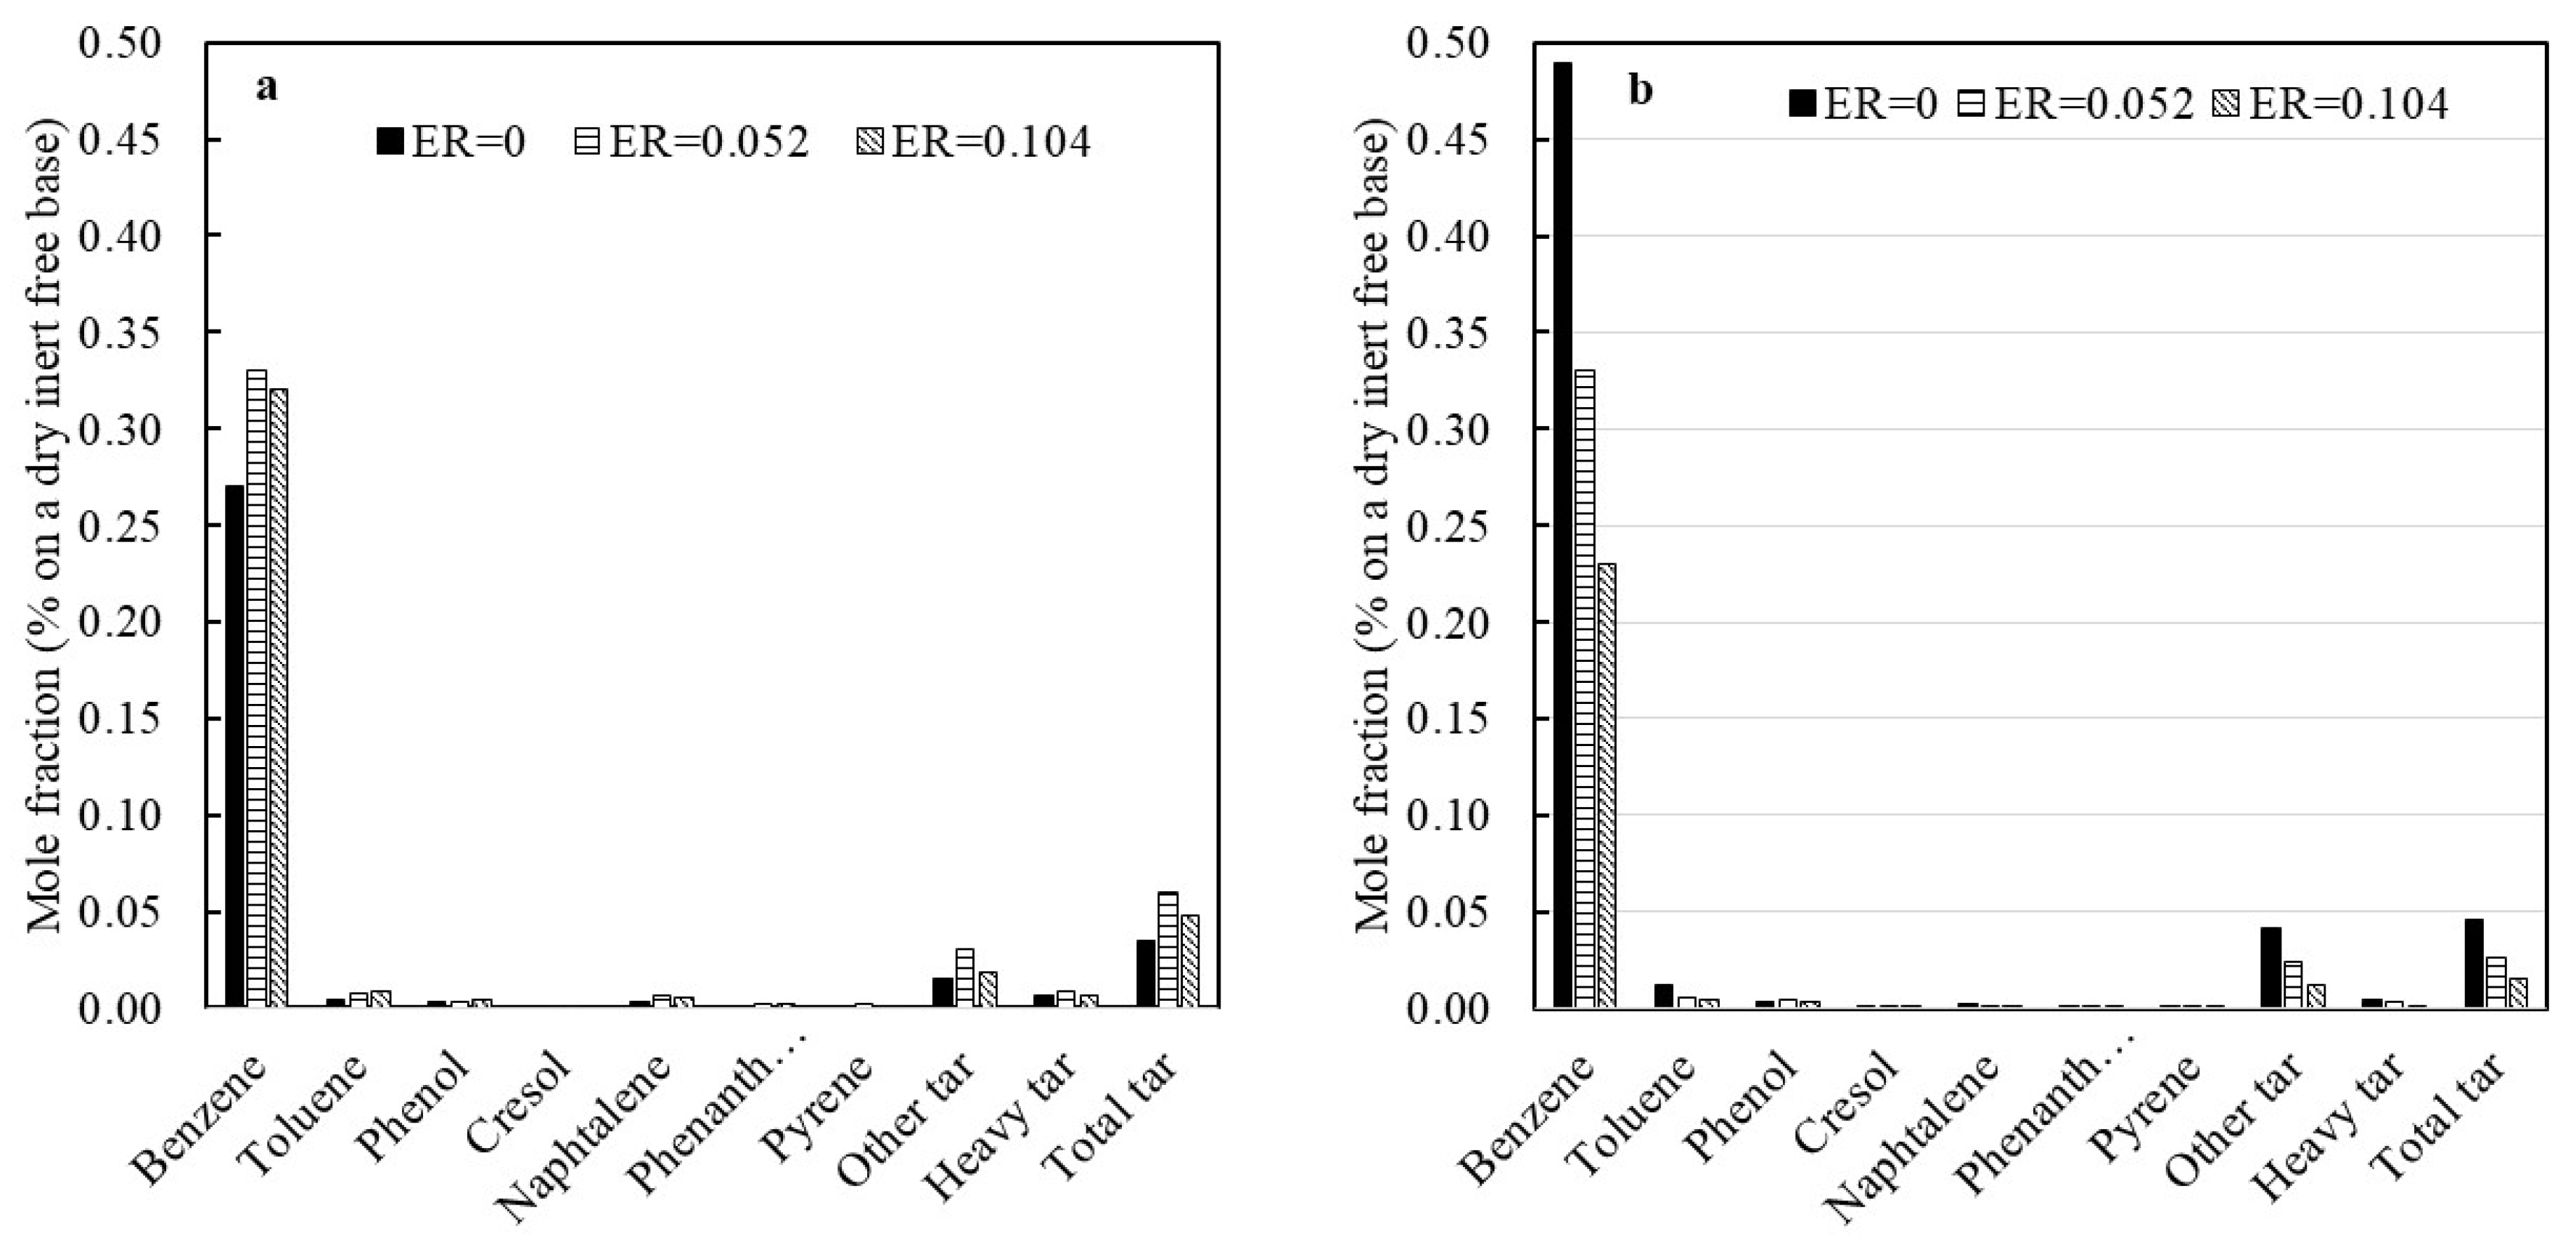
3.3. The Effect of Oxygen Injection in Steam Gasification on the Syngas Quality

Figure 4 shows the impact of oxygen injection in steam gasification on the reduction of tar content via oxidation. As shown in Figure 4a, the predictions of the SMHM-RK showed that the addition of a small amount of oxygen at an ER of 0.052 increased the total tar and heavy tar contents. However, the further increase in ER to 0.104 decreased the total tar content. The small amount of oxygen (e.g., ER = 0.052) that is injected at the bottom of the bed is consumed at the bottom of the bed via combustion, and no oxygen can reach the region above the feeding port to react with tar compounds. Therefore, the injection of a small amount of oxygen cannot destroy tars, which was also confirmed by the experimental data given in the literature [14]. However, the predictions of the WMHM-RK given in Figure 4b showed that the injection of a small amount of oxygen reduced tar formation, due the ignorance of the combustion zone at the bottom of the fluidized bed. Therefore, the hydrodynamic model should consider a separate combustion zone at the bottom of a fluidized bed gasifier.
A small amount of oxygen injected in the steam gasification of biomass was believed to increase the formation of naphthalene. Figure 5 compared the major reaction pathways of naphthalene in pure steam gasification and steam gasification with injected oxygen. As shown in Figure 5, the addition of oxygen into the steam gasification produces more CH3 and O radicals. The reactions of CH3 and O radicals produce more C2H4, C2H3, CH2CHO, CH2CO, and CH3CO, which further react with paracoumaryl alcohol (C9H10O2) and LVG (C6H10O5), which are major volatiles produced by the pyrolysis of biomass to produce more naphthalene (C10H8).
In a gasifier, there is a conversion triangle among phenyl radicals, benzene and naphthalene. Phenol (C6H5OH) is the first primary tar formed inside the gasifier. The phenol is then converted to benzene (C6H6) and naphthalene (C10H8). Benzene can react with C4H5 to produce hydrogen and naphthalene. Naphthalene reacts with hydrogen radicals to produce phenyl radicals. Phenyl radicals react with hydrogen to produce benzene through a reversible reaction. Therefore, the increase in hydrogen in the gasifier shifts toward the conversion of naphthalene to benzene.

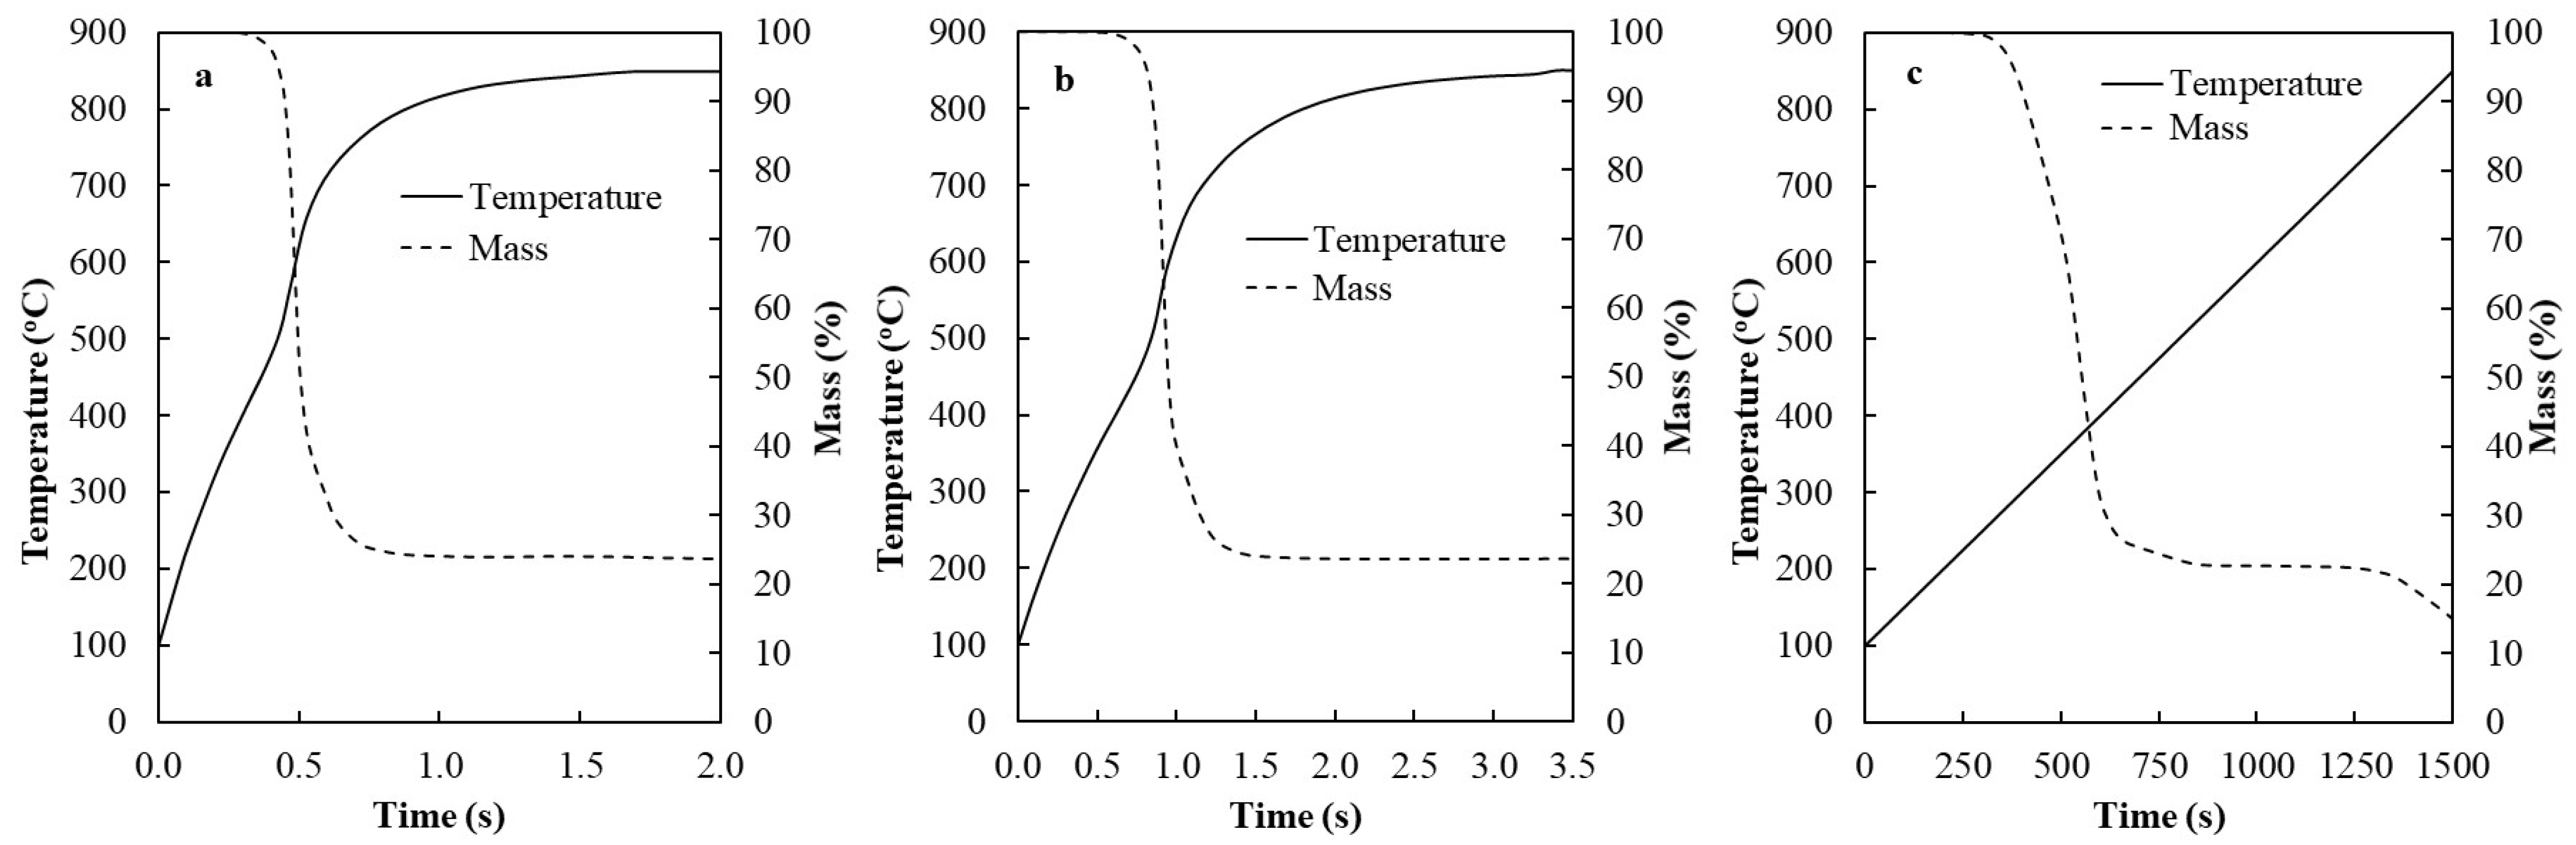
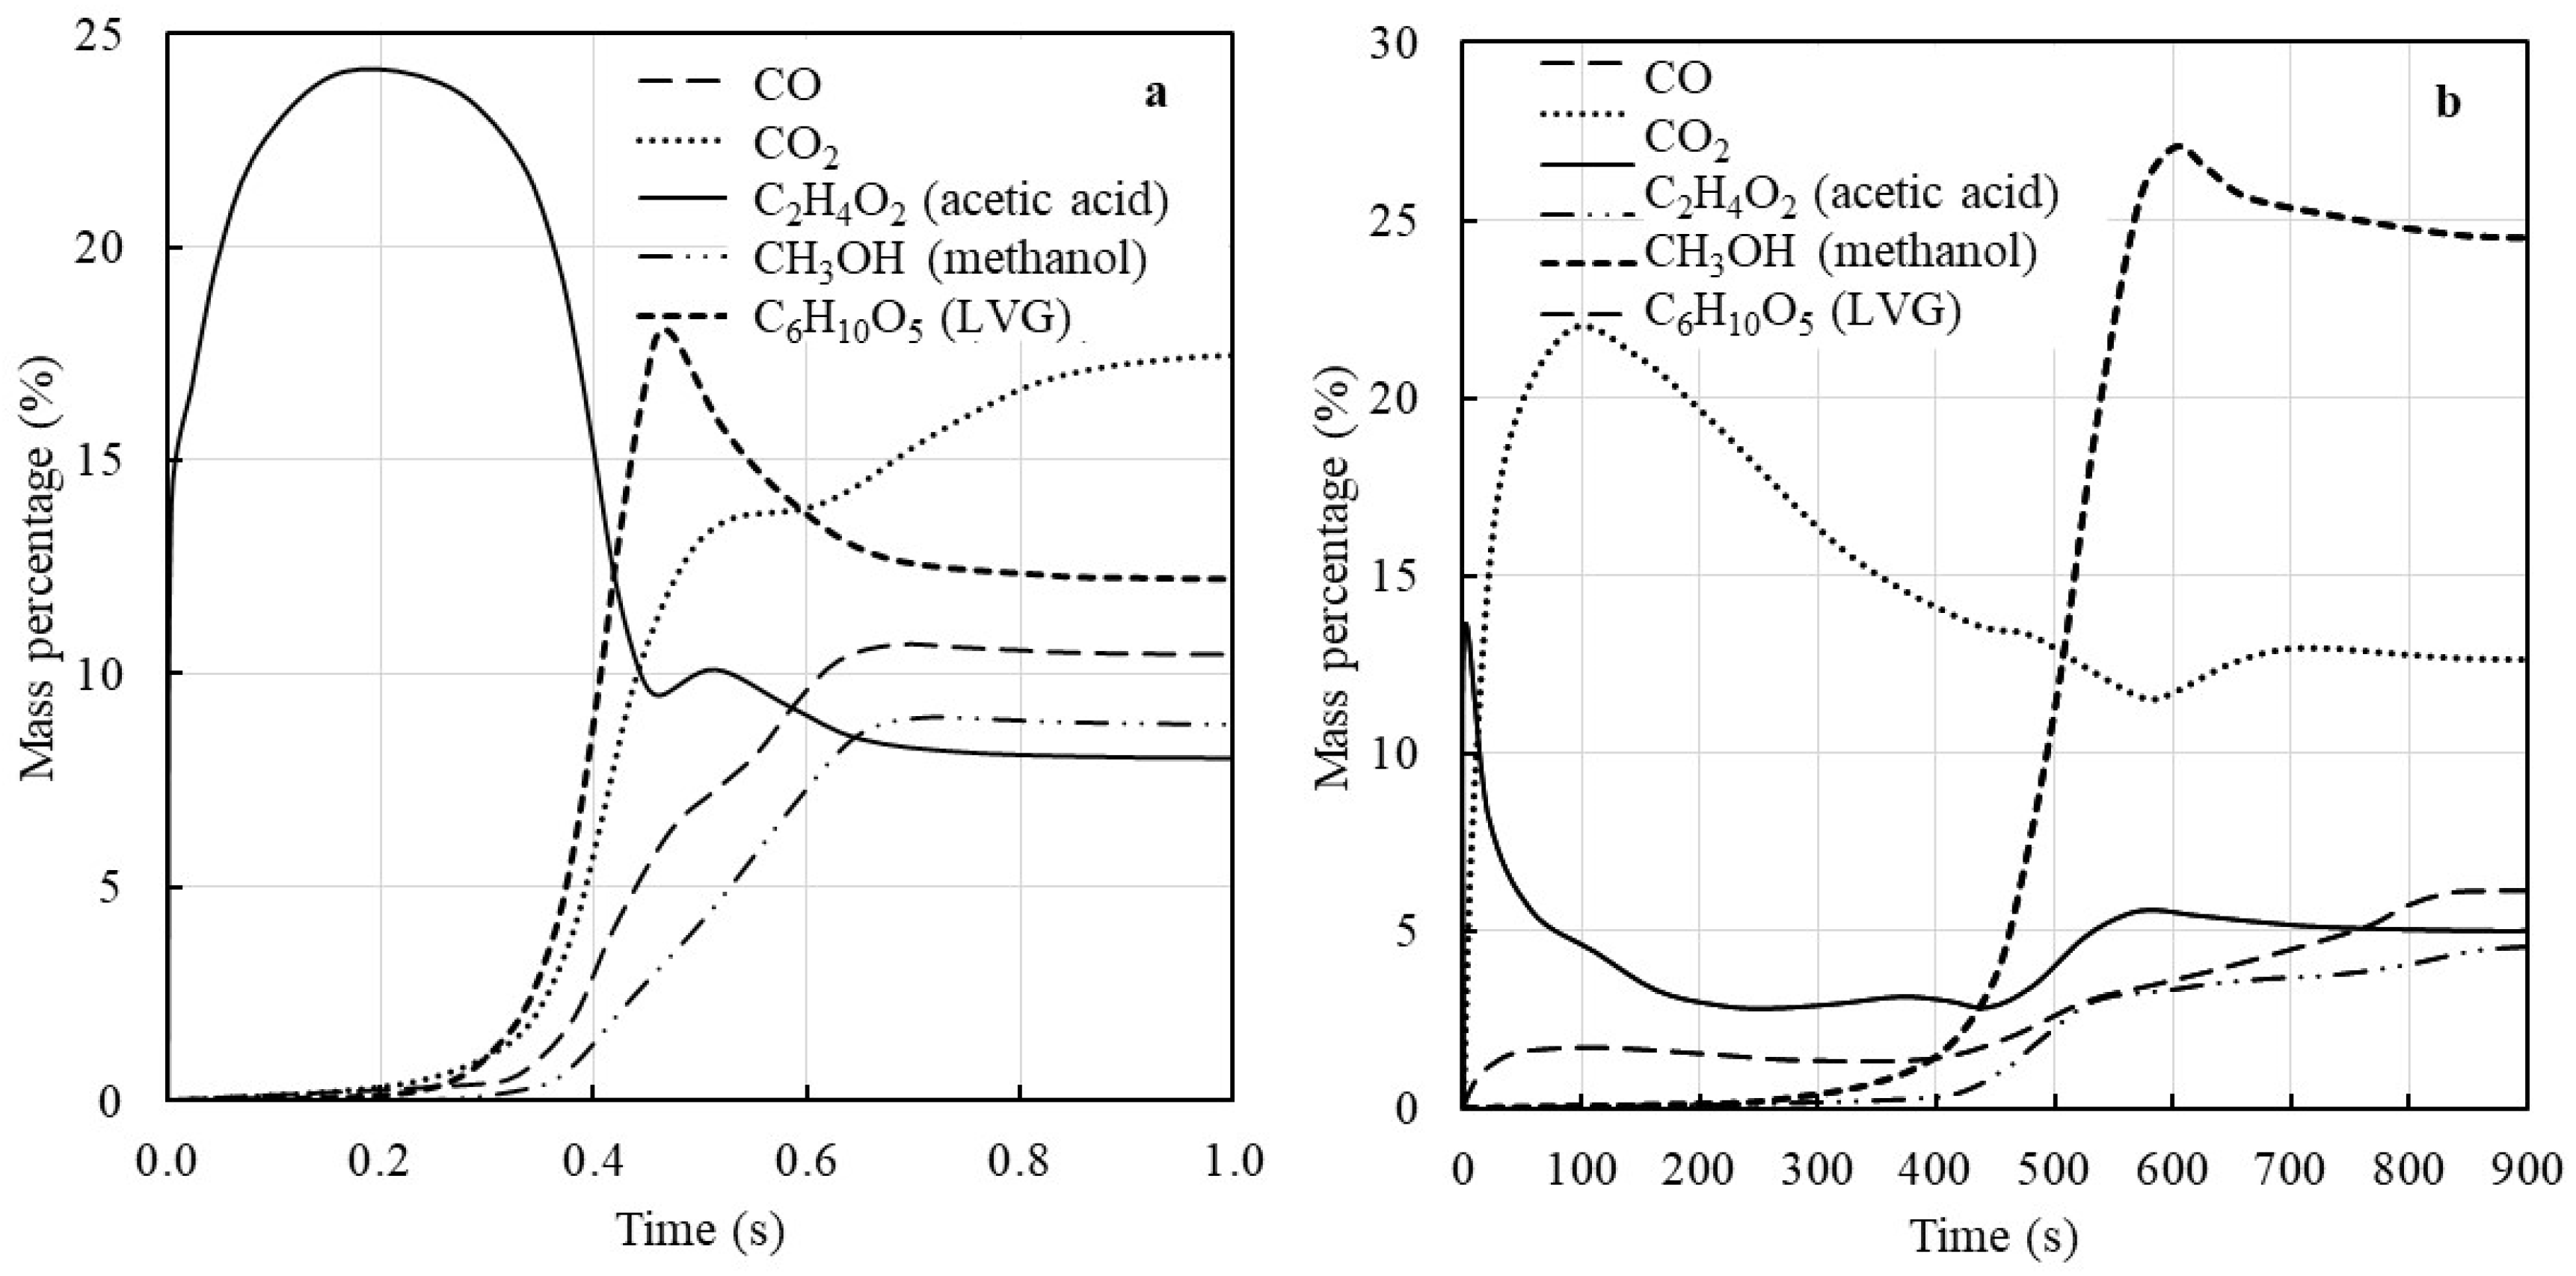
3.4. The Effect of Devolatilization Rate on Tar Formation

Figure 6 shows the mass loss of biomass at various sizes as a function of the time for which it was subjected to fast heating inside a fluidized bed at 850 °C and TGA at a heating rate of 30 °C/min. As shown in Figure 6, it took about 1.5 s and 3.5 s to increase the average temperature of the particles with a diameter of 1 mm and 2 mm in a fluidized bed at 850 °C from 100 °C to 850 °C. We can compare this time with the 1500 s it took for the particles in the TGA (at a heating rate of 30 °C/min) to reach 850 °C from an initial temperature of 100 °C. As shown in Figure 6a,b, the particles with a diameter of 1 mm and 2 mm started the devolatilization at about 0.25 s and 0.65 s after the particles were exposed to the bed temperature of 850 °C. The devolatilization of particles with a diameter of 1 mm and 2 mm was completed in 1.0 s and 1.5 s, respectively, when the average temperatures of the particles reached about 820 °C and 760 °C. The final mass at the end of devolatilization was about 24% of initial mass of the biomass particles. Therefore, all particles completed devolatilization before their temperatures reached the bed temperature of 850 °C. However, it took about 780 s to devolatilize the biomass to 24% of its mass at a temperature of 490 °C in the TGA. Therefore, it took much less time to complete the devolatilization of biomass in a TGA at a heating rate of 30 °C/min, before reaching a final temperature of 850 °C.
As shown in Figure 6a,b, the devolatilization occurred in three stages. About 60% of the volatiles were released almost instantly. There was an obvious decrease in the devolatilization rate when about 40% of the biomass was left. About 5% of original mass was attributed to the metaplastic species that were trapped in the biomass matrix and released gradually, at a much higher temperature but a much lower rate. As shown in Figure 6c, in the TGA, the gases trapped in metaplastic part of the biomass were not released until the temperature reached nearly 800 °C.
Table 3 gives the molar percentage of accumulated volatiles released from devolatilization of biomass in a fluidized bed at 850 °C and a TGA at a heating rate of 30 °C/min to a final temperature of 850 °C. The molar and volume percentages of the syngas and tar components in the volatiles from devolatilization were significantly affected by the heating rate. Devolatilization generated a large amount of water, which was 17.69% and 26.59% of the volatiles from the devolatilization in the fluidized bed at 850 °C and TGA at a heating rate of 30 °C/min to 850 °C, respectively. The volatiles generated in the fluidized bed at 850 °C and TGA at 850 °C contained 36.23% and 36.76% major syngas components (CO, H2, CO2 and CH4), respectively. CO and CO2 were the dominant syngas components in the volatiles, while only small amounts of H2 and CH4 were generated from the devolatilization. It can be seen from Table 3 that large amounts of CH2O (formaldehyde), CH3OH (methanol), C2H4O2 (acetic acid), C5H8O4 (glutaric acid), and C6H10O5 (LVG) presented in the volatiles.
Figure 7 compares the cumulative mass profiles of selected volatiles released from biomass in a fluidized bed at 850 °C and a TGA at heating rate of 30 °C/min to a final temperature of 850 °C. As shown in Figure 7, the amount of individual volatiles released from the biomass during devolatilization was a function of temperature and heating time, which depends on heating rate. There was large variation in volatile compositions during devolatilization. As the local distribution of biomass volatiles in a fluidized bed is affected by local temperature and heating time, biomass devolatilization and homogeneous gas reactions should be performed simultaneously in order to accurately predict the syngas and tar composition.

4. Conclusions

A SMHM-RK was developed and validated to improve predictions of the tar and syngas components produced by the steam gasification of biomass in a fluidized bed gasifier. The contents of major tar compounds and total tar predicted by the SMHM-RK were more close to the measured values than those predicted by the WMHM-RK. The model over-predicted the benzene and total tar content, which may have been caused by ignorance of catalytic effect of the bed material, and very large tar molecules in the kinetics. The increase in the temperature of steam gasification decreased the total tar content but increased the concentrations of PAHs. The increase in SBR from 0.3 to 0.9 decreased the total tar and heavy tar, and the further increase in SBR increased the total tar and heavy tar. The predictions showed that that class 4 and class 5 tar components decreased, but class 2 tar increased with the increase in SBR. Our simulations showed that the injection of a small amount of O2 in steam gasification could not reduce tar formation, as the O2 could not react with tar compounds due to its use in combustion at the bottom of the gasifier, which agreed with the experimental data reported in the literature. However, the predictions by the WMHM-RK showed that the injection of a small amount of O2 reduced tar formation. Therefore, the hydrodynamic model should consider a separate combustion zone at the bottom of a fluidized bed gasifier. Furthermore, our simulations showed that the devolatilization rate depends on the heating rate and temperature-affected pyrolytic volatile compositions, and thus the subsequent tar formation. Therefore, biomass devolatilization and homogeneous gas reaction kinetics should be carried out simultaneously to accurately predict the syngas and tar composition.

Author Contributions

Conceptualization, A.H. and L.W.; methodology, software, formal analysis, investigation, A.H.; resources, L.W. and A.S.; data curation and writing—original draft preparation, A.H.; writing—review and editing, and supervision, L.W.; project administration, L.W. and A.S.; funding acquisition, L.W. and A.S. All authors have read and agreed to the published version of the manuscript.

Funding

This research was funded by the U.S National Science Foundation, grant number: HRD-1736173. Mention of a trade name, proprietary products, or company name is for presentation clarity and does not imply endorsement by the authors or the university.

Data Availability Statement

The dataset for the detailed gasification reaction kinetics was obtained from the CRECK Modeling Group, wherein a mechanism of 451 species and 17,848 reactions was utilized (http://creckmodeling.chem.polimi.it/menu-kinetics/menu-kinetics-detailed-mechanisms, accessed on 24 May 2023). Cantera (https://cantera.org/, accessed on 24 May 2023), which is an open-source software, was used to import the complex kinetics in Chemkin format.

Conflicts of Interest

The authors declare no conflict of interest. The founding sponsors had no role in the design of this study; in the collection, analyses, or interpretation of data; in the writing of the manuscript, and in the decision to publish the results.

References

  1. Heidenreich, S.; Foscolo, P.U. New concepts in biomass gasification. Prog. Energy Combust. Sci. 2015, 46, 72–95. [Google Scholar] [CrossRef]
  2. Dayton, D. Review of the Literature on Catalytic Biomass tar Destruction: Milestone Completion Report; Department of Energy’s Office of Scientific and Technical Information: Oak Ridge, TN, USA, 2002. [Google Scholar] [CrossRef] [Green Version]
  3. Wang, L.J.; Hanna, M.A.; Weller, C.L.; Jones, D.D. Contemporary issues in thermal gasification of biomass and its application to electricity and fuel production. Biomass Bioenerg. 2008, 32, 573–581. [Google Scholar] [CrossRef]
  4. Li, X.; Wang, L.J.; Zhang, B.; Khajeh, A.; Shahbazi, A. Iron oxide supported on silicalite-1 as a multifunctional material for biomass chemical looping gasification and syngas upgrading. Chem. Eng. J. 2020, 401, 125943. [Google Scholar] [CrossRef]
  5. Wang, L.J.; Agyemang, S.A.; Amini, H.; Shahbazi, A. Mathematical modeling of production and biorefinery of energy crops. Renew. Sustain. Energy Rev. 2015, 43, 530–544. [Google Scholar] [CrossRef] [Green Version]
  6. Gerber, S.; Behrendt, F.; Oevermann, M. An Eulerian modeling approach of wood gasification in a bubbling fluidized bed reactor using char as bed material. Fuel 2010, 89, 2903–2917. [Google Scholar] [CrossRef]
  7. Oevermann, M.; Gerber, S.; Behrendt, F. Euler-Lagrange/DEM simulation of wood gasification in a bubbling fluidized bed reactor. Particuology 2009, 7, 307–316. [Google Scholar] [CrossRef]
  8. Debiagi, P.; Gentile, G.; Cuoci, A.; Frassoldati, A.; Ranzi, E.; Faravelli, T. A predictive model of biochar formation and characterization. J. Anal. Appl. Pyrolysis 2018, 134, 326–335. [Google Scholar] [CrossRef]
  9. Ranzi, E.; Debiagi, P.E.A.; Frassoldati, A. Mathematical modeling of fast biomass pyrolysis and bio-oil formation. Note I: Kinetic mechanism of biomass pyrolysis. ACS Sustain. Chem. Eng. 2017, 5, 2867–2881. [Google Scholar] [CrossRef] [Green Version]
  10. Corbetta, M.; Frassoldati, A.; Bennadji, H.; Smith, K.; Serapiglia, M.J.; Gauthier, G.; Melkior, T.; Ranzi, E.; Fisher, E.M. Pyrolysis of centimeter-scale woody biomass particles: Kinetic modeling and experimental validation. Energy Fuels 2014, 28, 3884–3898. [Google Scholar] [CrossRef]
  11. Ranzi, E.; Cuoci, A.; Faravelli, T.; Frassoldati, A.; Migliavacca, G.; Pierucci, S.; Sommariva, S. Chemical kinetics of biomass pyrolysis. Energy Fuels 2008, 22, 4292–4300. [Google Scholar] [CrossRef]
  12. Bates, R.B.; Ghoniem, A.F.; Jablonski, W.S.; Carpenter, D.L.; Altantzis, C.; Garg, A.; Barton, J.L.; Chen, R.; Field, R.P. Steam-air blown bubbling fluidized bed biomass gasification (BFBBG): Multi-scale models and experimental validation. AIChE J. 2017, 63, 1543–1565. [Google Scholar] [CrossRef]
  13. Rafati, M.; Hashemisohi, A.; Wang, L.J.; Shahbazi, A. Sequential modular simulation of hydrodynamics and reaction kinetics in a biomass bubbling fluidized-bed gasifier using Aspen plus. Energy Fuels 2015, 29, 8261–8272. [Google Scholar] [CrossRef]
  14. Cui, H.; Mostoufi, N.; Chaouki, J. Characterization of dynamic gas-solid distribution in fluidized beds. Chem. Eng. J. 2000, 79, 133–143. [Google Scholar] [CrossRef]
  15. Davidson, J.F.; Harrison, D. (Eds.) Fludized Particles; Cambridge University Press: Cambridge, UK, 1964; p. 155. [Google Scholar]
Figure 1. Scheme for the mathematical modeling of hydrodynamics in a fluidized bed reactor: (a) a sequential modular reactor model and (b) a perfectly mixed reactor model.
Energies 16 05283 g001
Figure 2. Comparison of the predicted mole fractions of total tar and selected tar compounds in the outlet syngas, produced with a steam-to-biomass ratio (SBR) of 1, at various temperatures with the measured values reported in the literature [12].
Energies 16 05283 g002aEnergies 16 05283 g002b
Figure 3. Effect of steam-to-biomass ratio on syngas and tar compositions: (a) syngas composition, (b) total tar content, (c) heavy tar content, and (d) various classes of tar composition.
Energies 16 05283 g003
Figure 4. Predicted contents of tar compounds affected by the oxygen/air injection into the steam gasification in a fluidized bed at 850 °C. (a) the predictions of the SMHM-RK, and (b) the predictions of the WMHM-RK.
Energies 16 05283 g004
Figure 5. Major pathways of naphthalene production: (a) steam gasification and (b) steam/oxygen gasification.
Energies 16 05283 g005
Figure 6. Temperature and devolatilization rate of biomass 1 mm and 2 mm particles in a fluidized bed at 850 °C and TGA at a heating rate of 30 °C/min. (a) 1 mm particles in a fluidized bed, (b) 2 mm particles in a fluidized bed, and (c) biomass in a TGA.
Energies 16 05283 g006
Figure 7. Comparison of the cumulative mass profiles of selected volatiles released from biomass in a fluidized bed and a TGA (a) in a fluidized bed at 850 °C, and (b) in a TGA at a heating rate of 30 °C/min to 850 °C.
Energies 16 05283 g007
Table 1. Hydrodynamic parameter data [13].
ParametersCorrelationReference
Voidage in bubble phase ε b = 1 A v o i d b 1 A v o i d b 2 e x p U 0 U m f A v o i d b ( 3 ) [14]
Voidage in emulsion phase ε e = 1 A v o i d e 1 A v o i d e 2 e x p U 0 U m f A v o i d e ( 3 ) [14]
Bubble fraction δ = A f 1 + A f 2 e x p U 0 U m f A f ( 3 ) [14]
Mass transfer coefficient between bubble and cloud K b c = 4.5 U e d b + 5.85 δ 0.5 g 0.25 d b 1.25 [15]
Mass transfer coefficient between cloud and emulsion K c e = 6.77 δ ε m f U b d b 3 0.5 [15]
Overall bubble–emulsion mass transfer coefficient 1 K b e = 1 K b c + 1 K c e [15]
Notes: Af(1), Af(2), and Af(3): constants of the dynamic two-phase model; Avoid-b(1), Avoid-b(2), and Avoid-b(3): constants for determining the voidage in the bubble phase; Avoid-e(1), Avoid-e(2), and Avoid-e(3): constants for determining the voidage in the emulsion phase.
Table 2. Physical and chemical properties of the biomass particles.
ParameterQuantityReference
Biomass density (kg/m3)850[10]
Biomass-specific heat [J/(kg K)]1500 + T[10]
Cellulose35%[12]
Hemicellulose40%[12]
Total lignin (LIG)25%[12]
Lignin with rich C (LIGC) represented by C15H14O40.99%[12]
Lignin with rich H (LIGH) represented by C16H10O6(OCH3)49.85%[12]
Lignin with rich O (LIGO) represented by C17H13O4(OCH3)514.17%[12]
Ultimate analysis (%wt dry basis)
Carbon49%[12]
Hydrogen6%[12]
Oxygen45%[12]
Moisture content3.95%[12]
Volatile matter84.79%[12]
Fixed carbon10.9%[12]
Table 3. Molar percentage of accumulative volatiles released from the devolatilization of biomass in a fluidized bed at 850 °C and a TGA at a heating rate of 30 °C/min to a final temperature of 850 °C.
ComponentMolar Percentage
TGA at a Heating Rate of 30 °C/min to 850 °CFluidized Bed at 850 °C
H2O26.5917.69
H21.070.59
CO13.7416.98
CO219.8917.73
CH42.060.94
CH2O (Formaldehyde)12.5218.89
CH3OH (Methanol)8.7811.54
C2H2O2 (Glyoxal)1.272.22
C2H4 (Ethylene)2.393.80
C2H4O (Acetaldehyde)1.571.70
C2H4O2 (Acetic acid)5.837.32
C2H5OH (Ethanol)1.232.13
C5H8O4 (Glutaric acid)10.682.35
C6H5OH (Phenol)0.030.03
C6H6O3 (HMFU)1.582.77
C6H10O5 (LVG)10.204.68
C9H10O2 (Ethyl benzoate)0.040.03
C11H12O4 (Ethyl acetylsalicylate)1.940.27
HCOOH (Formic acid)1.061.00
C2H5CHO (Propionaldehyde)3.284.92
C6H5OCH3 (Methoxybenzene)0.830.12
Disclaimer/Publisher’s Note: The statements, opinions and data contained in all publications are solely those of the individual author(s) and contributor(s) and not of MDPI and/or the editor(s). MDPI and/or the editor(s) disclaim responsibility for any injury to people or property resulting from any ideas, methods, instructions or products referred to in the content.

