Article

The La+3-, Nd+3-, Bi+3-Doped Ceria as Mixed Conductor Materials for Conventional and Single-Component Solid Oxide Fuel Cells

1
Department of Physics, Lahore College for Women University, Lahore 54000, Pakistan
2
Clean Energy Research Lab (CERL), Department of Physics, COMSATS University Islamabad, Lahore Campus, Lahore 54000, Pakistan
*
Authors to whom correspondence should be addressed.
Energies 2023, 16(14), 5308; https://doi.org/10.3390/en16145308
Submission received: 2 May 2023 / Revised: 30 June 2023 / Accepted: 6 July 2023 / Published: 11 July 2023
(This article belongs to the Special Issue Advances in Energy Materials and Clean Energy Technologies)

Abstract

:
Clean energy devices are essential in today’s environment to combat climate change and work towards sustainable development. In this paper, the potential materials A2Ce2O7−δ (A = La+3, Nd+3, Bi+3) were analyzed for clean energy devices, specifically for conventional and single-component solid oxide fuel cells (SC-SOFCs). The wet chemical route has been followed for the preparation of samples. X-ray diffraction patterns showed that all three samples exhibited a defected fluorite cubic structure. It also revealed the presence of dopants in the ceria, which was confirmed by the fingerprint region of FTIR. The optical behavior, fuel cell performance and electrochemical behavior were studied by UV–vis, fuel cell testing apparatus and EIS, respectively. The SEM results showed that all samples had irregular polygons. In Raman spectra, the F2g mode corresponding to the space group (Fm3m) confirms the fluorite structure. The Raman spectra showed that A2Ce2O7−δ (A = La+3, Nd+3, Bi+3) have different trends. The conventional fuel cell performance showed that the maximum power density of Bi2Ce2O7 was 0.65 Wcm−2 at 600 °C. The performance of A2Ce2O7−δ (A = La3+, Nd3+, Bi3+) as a single-component fuel cell revealed that Nd2Ce2O7−δ is the best choice with semiconductors conductors ZnO and NCAL. The highest power density (Pmax) of the Nd2Ce2O7/ZnO was 0.58 Wcm−2, while the maximum power output (Pmax) of the Nd2Ce2O7/NCAL was 0.348 Wcm−2 at 650 °C. All the samples showed good agreement with the ZnO as compared to NCAL for SC-SOFCs.

1. Introduction

Solid oxide fuel cells (SOFCs) contain three components: anodes, electrolytes, and cathodes [1]. In SOFCs, the most significant and basic component is the electrolyte [2]. The electrolyte plays the important role of separating the anode and cathode [3]. It also supports the movement of H+ from anode to cathode or O−2 from cathode to anode as part of the fuel cell function. Typically, SOFC research has been focused on reducing operative temperatures from 1000 °C to, e.g., 600 °C [3,4]. To address this issue, thin-film techniques are being explored to reduce the thickness of the electrolyte from millimeters to micrometers [5] or by using materials that have high ion conductivity and no electron conductivity [6]. However, fuel cell electrolytes need to be dense enough to prevent a cross-over phenomenon where anode gas is mixed with cathode gas. They must also be structurally and chemically stable at high temperatures and in both oxidative and reductive atmospheres [7].
In a recent study, the A2Ce2O7−δ structure-type was investigated as a denser material for the fuel cell electrolyte in SOFCs. CeO2 falls in an n-type semiconductor category and has the ability to hold its fluorite structure even after the absence of the oxygen atom in its lattice [8]. In addition, it has the potential to absorb oxygen from an environment that contains oxygen and releases oxygen in an environment lacking in it [9].
The ceria-based composition was chosen as it would assure an increase in ion conductivity and high sintering thickness at a temperature of about 1000 °C as compared to the known sintering temperature of about 1400 °C. [10]. The structure A2B2O7−δ was selected as A2B2O7-defected fluorites, like La2Zr2O7 and La2Ce2O7, showed good proton conduction [11]. Proton conduction has also been demonstrated by Nd2Ce2O7 and Gd2Ce2O7 [12]; however, Nd2Ce2O7 materials have a comparatively reduced sintering activity at densification temperatures up to 1500 °C [13]. If a dense electrolyte film could be produced at a lower temperature, it would reduce the cost and open possibilities for electrode-supported processes. Therefore, it is essential to develop a way for Nd2Ce2O7 materials that guarantees the formation of electrolytes at a correspondingly low temperature while having better conductivity.
The dopants used in ceria are La+3, Nd+3 and Bi+3, La2Ce2O7, Nd2Ce2O7, and Bi2Ce2O7, respectively. La and Nd are rare earth metals whereas Bi is a post-transition metal. Furthermore, as per our understanding, the bismuth oxide (Bi2O3) showed the highest ionic conductivity at comparable temperatures [14]. The ionic conductivity of stabilized Bi2O3 makes this material ideal as an electrolyte in SOFCs that function at lower temperatures < 1000 [15]. The objective of this paper is to primarily review the effect of La+3, Nd+3 and Bi3+ ions in ceria. The secondary objective is to compare dopants used as ceria-based solid electrolytes for conventional as well as single-component SOFCs.

2. Experimental Detail

2.1. Synthesis of A2Ce2O7−δ (A = La+3, Nd+3, Bi+3) Nanocomposite

Among wet chemical methods, the sol–gel method was used to fabricate A2Ce2O7−δ (A = La+3, Nd+3, Bi+3) nanocomposites. The ceria was doped individually with equal amounts of lanthanum, neodymium and bismuth to study the conduction behavior of nano composites, for single and conventional SOFCs. The A2Ce2O7−δ (A = La+3, Nd+3, Bi+3) compositions were prepared through wet chemicals. The precursors used as cerium, lanthanum, neodymium and bismuth sources for powder synthesis were cerium nitrate hexahydrate Ce(NO3)3·6H2O (99.9% Sigma Aldrich, China), lanthanum nitrate hexahydrate La(NO3)3·6H2O (99.9% Sigma Aldrich), neodymium nitrate Nd(NO3)3·6H2O (99.9% Alfa Aesar, China) and bismuth nitrate penta hydrate Bi(NO3)3·5H2O (BDH/RDH). Demineralized water was used as the solvent and citric acid (anhydrous) was used as a metal-chelating agent to tightly bind the metal ions [16].
The calculated amount of Ce (NO3)3·6H2O, La2(NO3)3·6H2O, Nd(NO3)3·6H2O and Bi(NO3)3·5H2O was separately dissolved in deionized water. Three separate solutions were subsequently formed by mixing Ce (NO3)3·6H2O and La2(NO3)3·6H2O, Ce (NO3)3· 6H2O and Nd(NO3)3·6H2O, and lastly Ce (NO3)3·6H2O and Bi(NO3)3·5H2O. These solutions were heated at 80 °C for half an hour. After the completion of this process, citric acid with the mole ratio of citric acid to cerium 2:1 [17] was added to each respective solution. Ammonia liquor was also pipetted to adjust the pH value of the solutions to 6–7 [18]. To stiffen the mixture, ethylene glycol with the mole ratio of ethylene glycol to cerium of 1:1.8 [19] was also added. Each sol–gel solution was then re-heated at 160 °C in an oven until all the water had evaporated so that the dry solid material could be obtained.
After grinding the solid to powder form, it was placed in a furnace and sintered for 5 h at a temperature of 900 °C. At the end with natural cool and grind, the powder of the nanocomposite was obtained.

2.2. Fabrication of Pellet

The pellets for fuel cell testing are formed in two ways. In the first type, the pellets are fabricated as conventional three-component SOFCs and in the second type, a single layer or single-component SOFCs have been fabricated. For the first method, the traditional SOFC three-layer structure was formed, where A2Ce2O7−δ (A = La+3, Nd+3, Bi+3) was taken as an electrolyte. The NiCuZnOx (NCZO) was taken as the anode [20] and La0.6Sr0.4Co0.2Fe0.8O3 (LSFC) was taken as the cathode [21]. The mass ratios of anodes, electrolytes, and cathodes were 0.3 g, 0.3 g, and 0.4 g, respectively. For the formation of pellets, the anode, electrolyte and cathode powders were successively placed in the stainless-steel die (13 mm). This die was then put in a hydraulic press to co-press in one step under the pressure of approximately 300 MPa. The pellets were then put into a muffle furnace at a temperature of 600 °C for 30 min to sinter. For current collection, the silver paste was used on one side of the cell. Nickel foam was used on the other side for the mechanical strength of the cell. For performance measurement, the pellet was then positioned in the sample fixture, which has four gas supply pipes, two of which are hydrogen supply/exit pipes, and the other two are air supply/exit pipes.
The same procedure was used for the single-component fuel cell, but with fewer steps, as only one coat of powder was employed. Co-pressed ionic and semiconducting material powder weighing over 0.5 g was applied to a porous nickel foam. Here, the ionic conductors were taken as A2Ce2O7−δ (A = La+3, Nd+3, Bi+3), while the semiconductors used were NCAL [22] and ZnO [23].

2.3. Characterization Techniques for Material and Fuel Cell Analysis

The Bruker D8 Advance X-ray diffractometer was used to recode the X-ray pattern of synthesized A2Ce2O7 (A = La+3, Nd+3, Bi+3) nanocomposites at room temperature. The Cu-Kα radiation (λ = 0.154 nm) at 40 KV and 30 mA in a 2θ range of 0°–90° was used. The Scherer’s formula was used to calculate the average crystallite size (Dβ) [24]:
Dβ = kλ/β cos θ
Here, Dβ is the measure of crystalline size, k stands for constant having value 0.94, λ is the wavelength, θ is the Bragg angle and β stands for the full width at half maximum (FWHM). The lattice strain (ε) was determined by [25]:
ε = β 4 tan θ
The UV-2600 spectrometer with the wavelength range of 200–800 nm was used to obtain the UV–visible absorption spectra of synthesized LDC, NDC and BDC. The energy gap was calculated with the following equation [26]:
ahv = A(hv − Eg)n/2
Here, A is an empirical value; α stands for absorption coefficient; h represents the proportionality constant, which is called Planck’s constant; and Eg is the band gap energy. In the above equation, n represents the transition between energy bands; here, the direct band gap corresponds to n = 1, and the indirect band gap corresponds to n = 4. The values of the absorption coefficient (α) have been calculated by the following relation:
α = 4 π k / λ
Here, λ represents the wavelength in nm and k represents the absorption index. The band gap energy was taken by the Tauc plot of (αhv)2 versus photon energy (hv).
To study the particle microstructure of prepared nanocomposites, the samples were examined by scanning electron microscopy (JEOL JSM-6480 LV, France). To observe the chemical bonds and functional groups of prepared nanocomposites, Fourier transform infrared spectroscopy (IRTracer-100 FTIR Spectrometer, China) was conducted. The Raman spectrum was analyzed by the InVia Raman Microscope by RENISHAW, UK. Raman spectrometry is an exceptional technique used worldwide to assess oxygen vacancies present in the fluorite structure, the phase present in material, and the quality and purity of the material. Electrochemical impedance spectroscopy was conducted by an electrochemical workstation (CS350, China) under the range of 0.01 Hz to 1 MHz frequency. Fuel cell performance was carried out by using the fuel cell testing setup at 650 °C with hydrogen as a fuel.

3. Results

3.1. XRD Analysis for A2Ce2O7 (A = La+3, Nd+3, Bi+3) Nanocomposite

The X-ray diffraction pattern of prepared A2Ce2O7−δ (A = La+3, Nd+3, Bi+3) nanocomposites are shown in Figure 1. In the graph, the measured peaks of A2Ce2O7 depicted that the composite oxide matched with the cubic fluoride structure of pure CeO2 (Fm3-m, No. 225) with a JCPDS card (01-076-0076). The diffraction pattern showed that the eight prominent diffraction peaks at 2θ = 28.7°, 33.2°, 47.7°, 56.6°, 59.3°, 69.7°, 77.1°, and 79.5° correspond to (111), (200), (220), (311), (222), (400), (331), and (420), respectively. These crystal planes indexed to fluorite-type cubic structured CeO2−δ [27]. A slight right shift was observed among diffraction peaks La2Ce2O7 < Nd 2Ce2O7 < Bi2Ce2O7. This may be due to the ionic radii of dopants compared to the Ce4+ ions. It has also been found that some peaks matched with rhombohedral cerium oxide (Ce7O12) or (CeO1.698) peaks have a JCPDS card (01-071-0567), which may be referred to the defected fluorite structure of CeO2. The reported work showed that Ce7O12 remained stable up to 1072 K, and then transformed into a fluorite-type structure with disordered oxygen vacancies [28]. Among La2Ce2O7, Nd2Ce2O7 and Bi2Ce2O7, it has been observed that Bi2Ce2O7 peaks matched well with cubic CeO2 as compared to the other two.
By using the Debye Scherrer relation in Equation (2), the crystallite sizes (D) of A2Ce2O7 materials were determined. The lattice strain was measured by using Equation (3) [29]. A steady shift towards higher diffraction angles was observed for La3+ < Na3+ < Bi3+ doping. Consequently, the lattice parameters were increased. All calculated parameters are given in Table 1. The lattice strain of La2Ce2O7 and Nd2Ce2O7 was found to be negative, which reflects the compressive nature of strain, whereas Bi2Ce2O7 showed the positive value of lattice strain, a sign of tensile strain.
From Figure 1, it can be observed that the peaks of La3+-, Nd3+- and Bi3+-doped CeO2 samples matched with the cubic CeO2 with a slight variation. The diffraction peaks of prepared nanocomposites showed a slight right shift towards greater diffraction angles. This may be due to the ionic radii of dopants compared to the Ce4+ ions; consequently, there was an increase in the lattice parameters. The larger La3+ cations replaced by smaller Ce4+ cations in the fluorite structure [r (La3+) = 1.06 Å, r (Ce4+) = 0.970 Å] had 8-fold coordination [29], which was further confirmed by Rietveld refinement, and the lattice parameter of LDC (a = 5.5730 ± 0.0001 Å) was increased in comparison with that of undoped CeO2 (a = 5.4081 ± 0.0001 Å) [30]. The same analogy was observed for Nd3+ and Bi3+ cation replacement with Ce4+ cations having ionic radii r (Nd3+) = 1.11 Å and r (Bi3+) = 1.03 Å. The measurements increased the lattice parameter of NDC (a = 5.4890 ± 0.0001 Å) and BDC (a = 5.4113 ± 0.0001 Å) with respect to CeO2. This supported the fact that dopants La3+, Nd3+ and Bi3+ cations were incorporated into the CeO2 lattice.
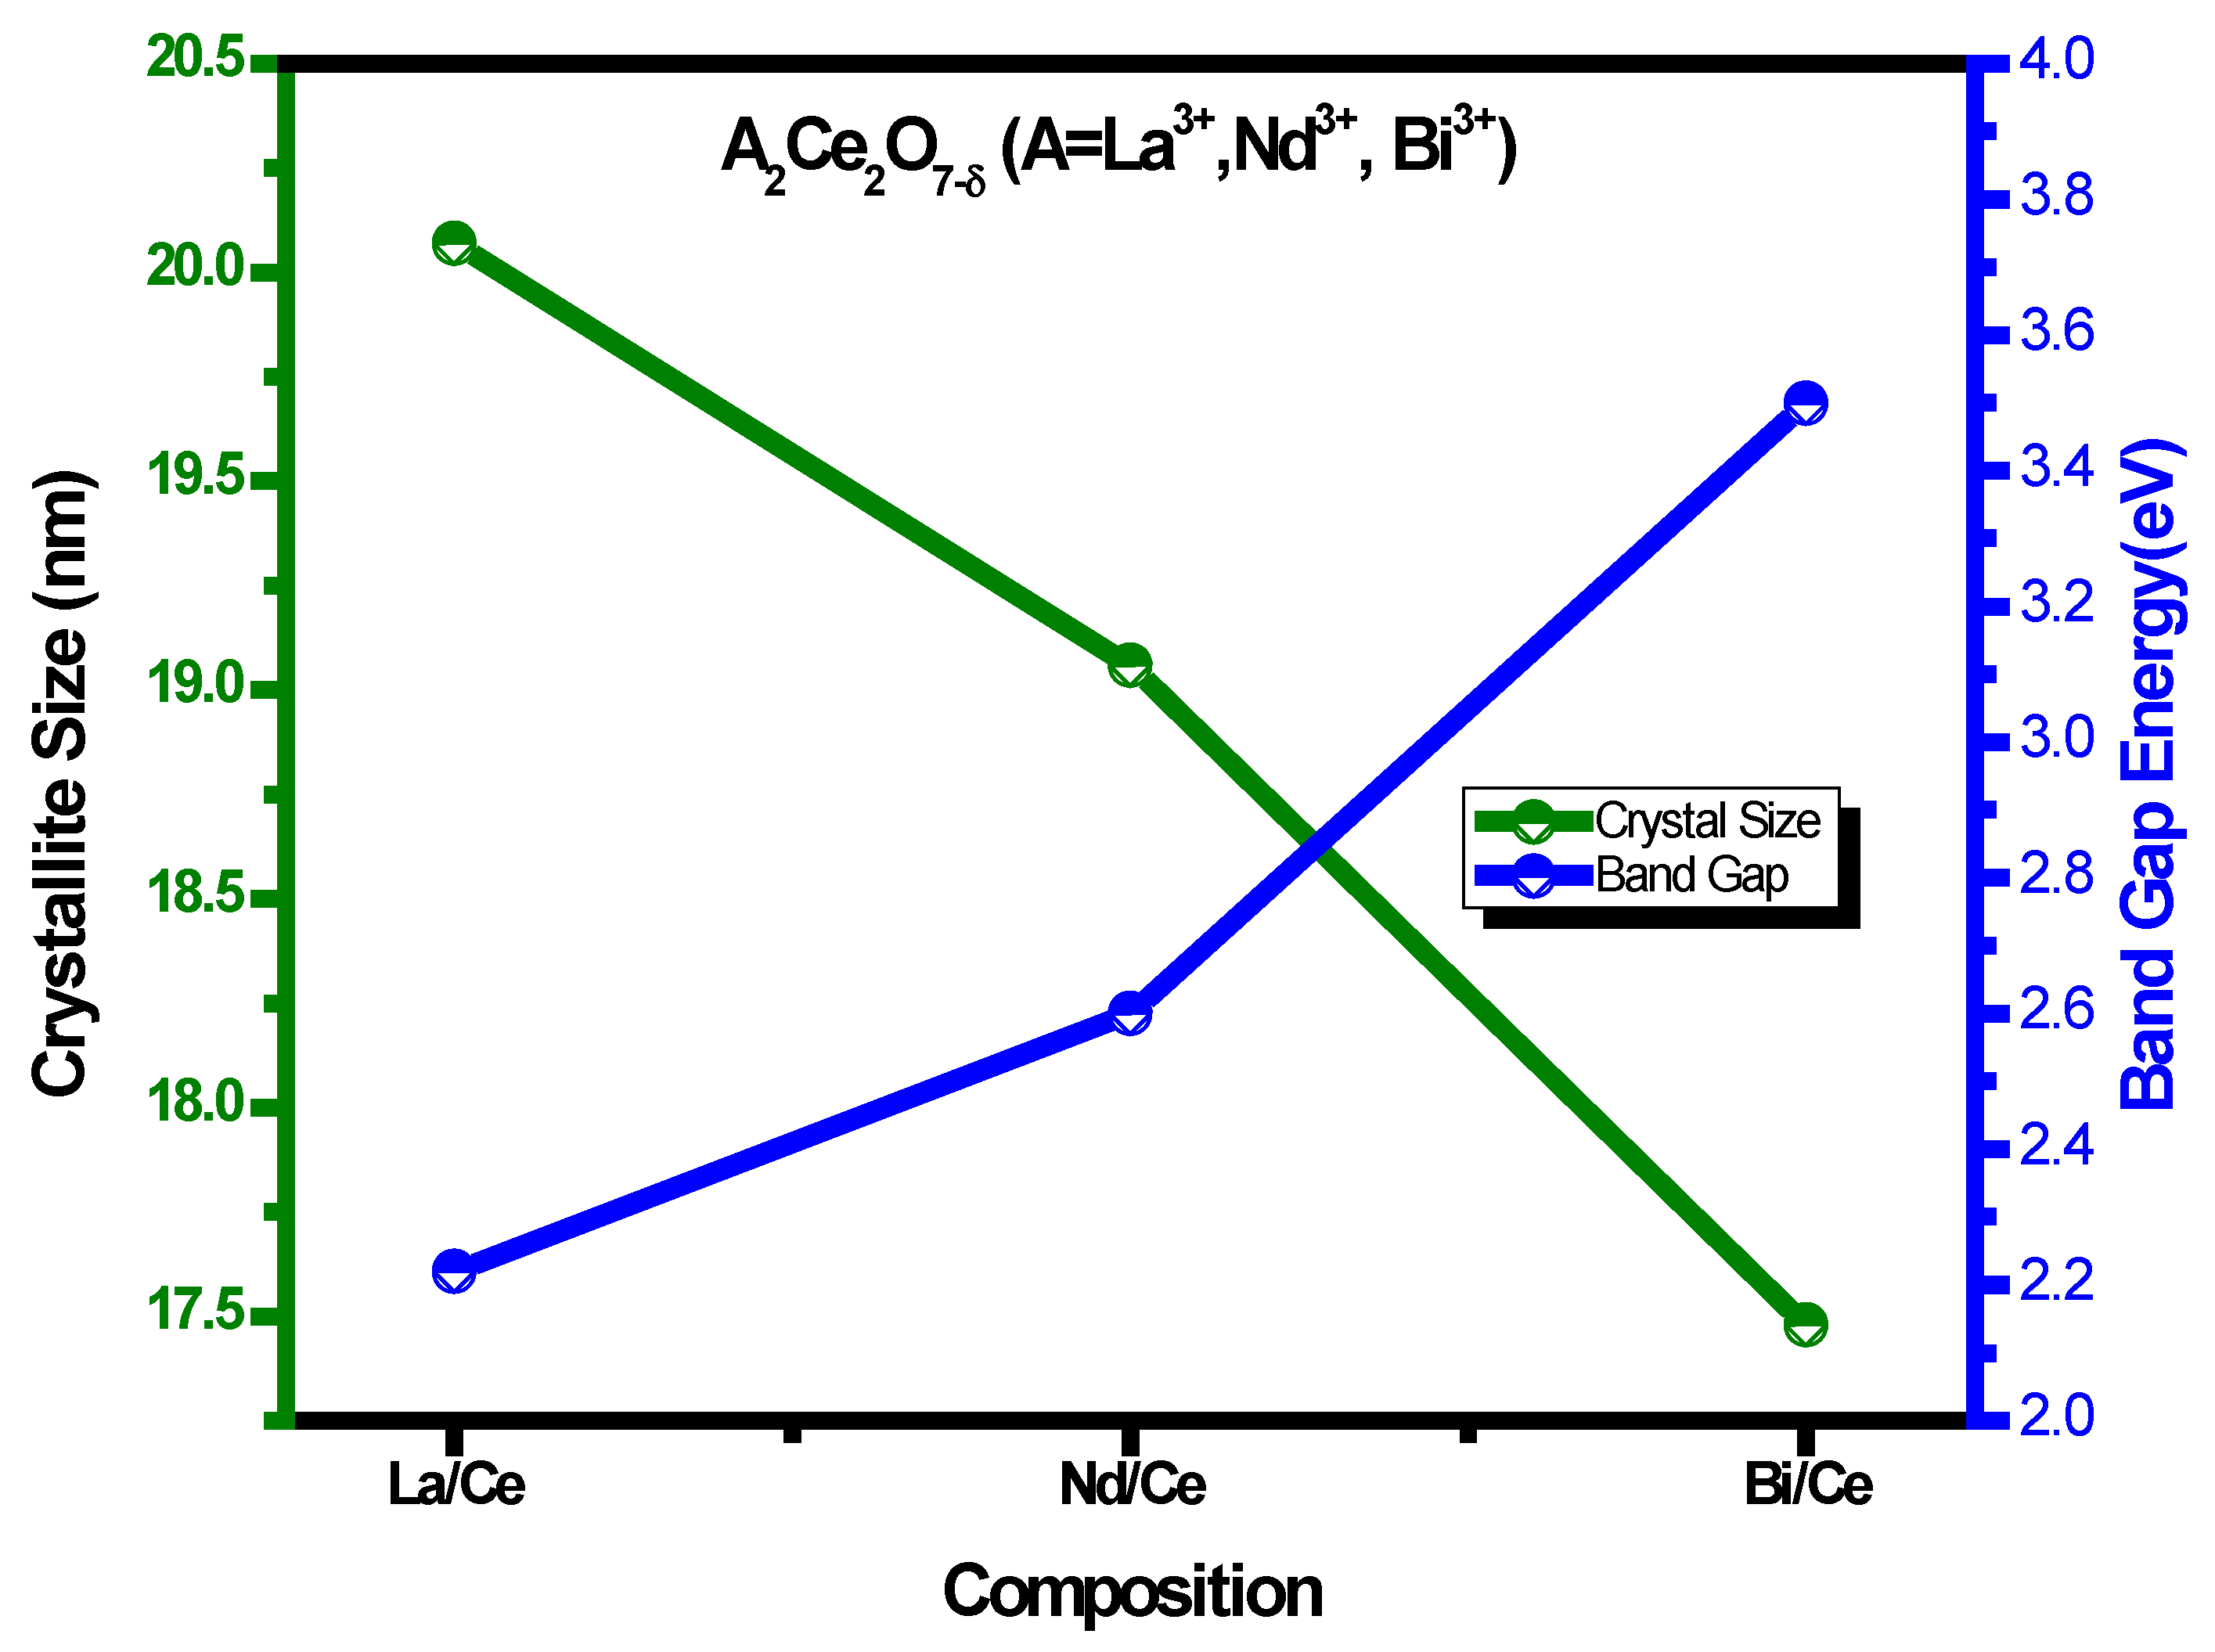
The deviation in optical band gap energy and the crystallite size of nanoparticles with different dopants in the ceria lattice is shown in Figure 2. It is inferred that the size of the nanoparticles was reduced while the band gap energy was increased. This means that the lattice parameter and band gap energy increase with decreasing crystallite size. The wide band gap materials show numeral characteristics that make them beneficial as compared to narrower band gap materials. The increase in the energy gap enables the devices to work at higher temperatures. At higher temperatures, band gaps usually shrink, which can cause problems when using conventional semiconductors.

3.2. Microstructure Analysis

The SEM was employed to analyze the micro-structure of nanocomposites [31,32]. Figure 3a–c show the SEM images of A2Ce2O7−δ (A = La+3, Nd+3, Bi+3) powders of all samples after sintering at a temperature of 1173 K. It can be seen that the particles of all samples have irregular polygon morphology.
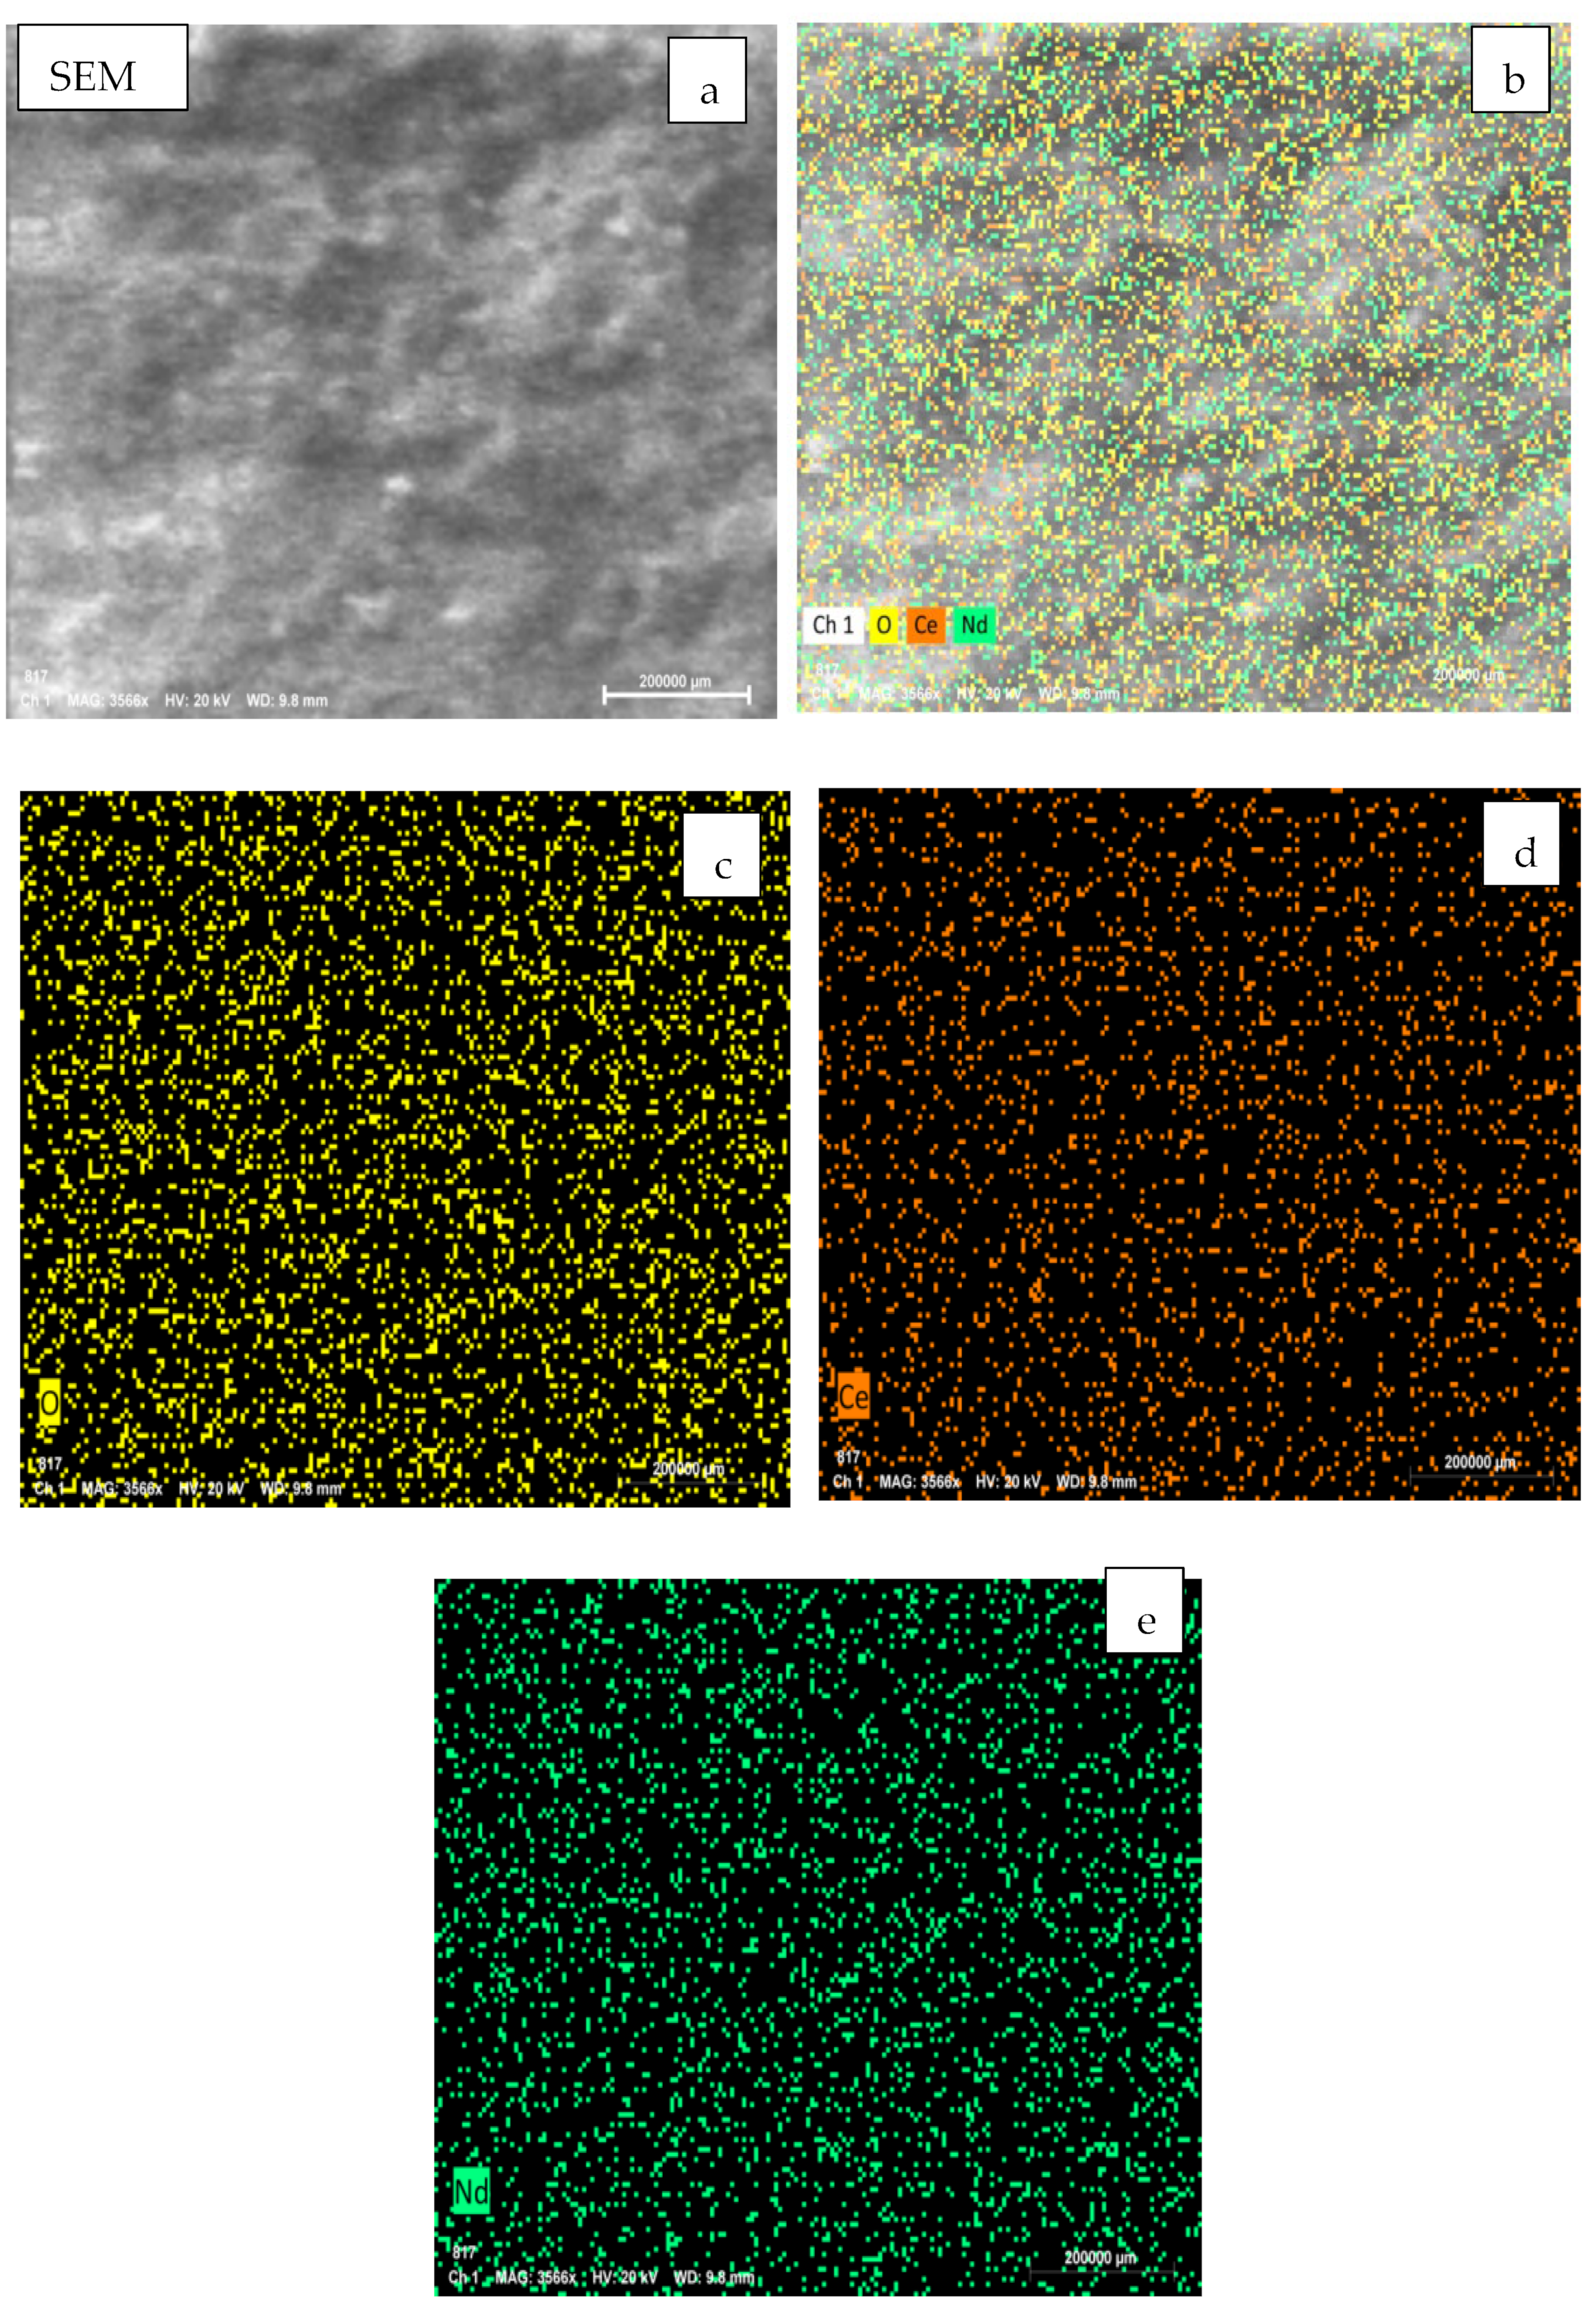
Figure 4a–d show the EDS spectrum results of the Nd2Ce2O7−δ sample. This spectrum showed the quantity of neodymium, oxygen and cerium elements in the sample. From the EDS quantitative analysis of elements, the neodymium contents on the sample powders were about 34.71 wt% and 9.68 at%, as shown in Table 2, while cerium was detected with as much as 33.15 wt% and 9.52 at%. The EDS spectrum showed that all elements were homogeneously dispersed. Figure 5 represents the EDS spectra.

3.3. UV–Visible Analysis (200 to 800 Nanometers)

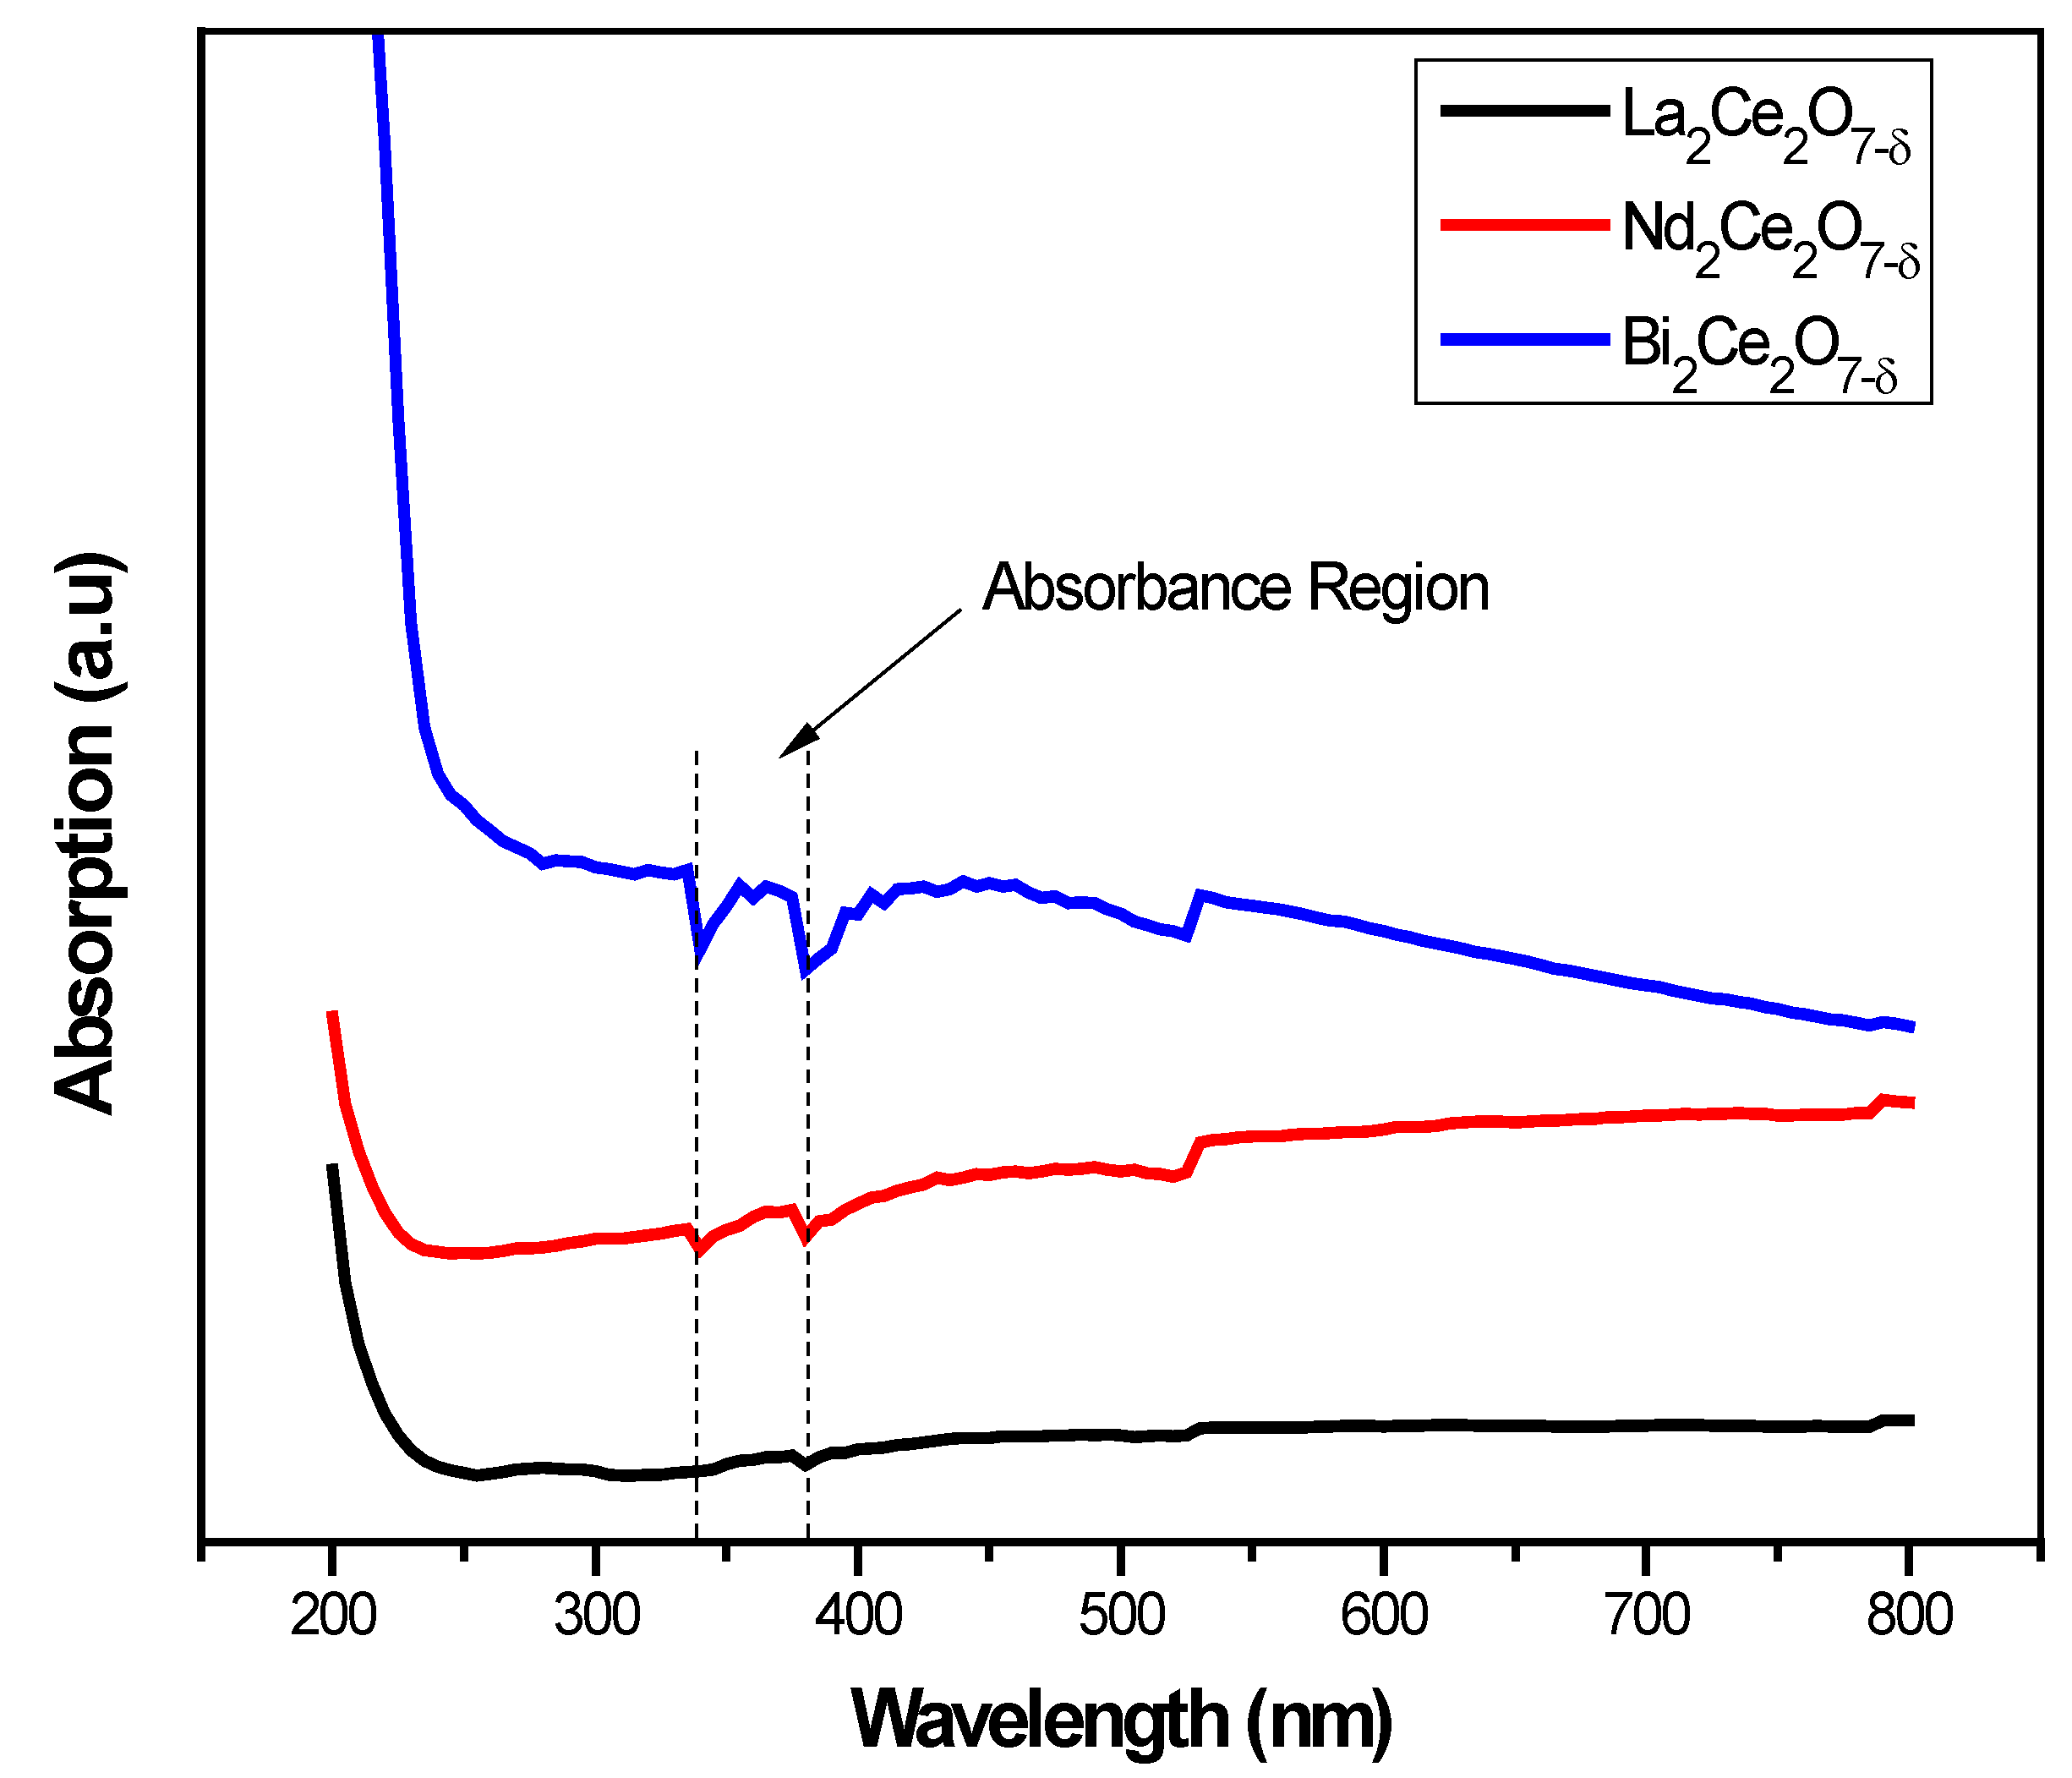
The UV–visible absorption spectra of A2Ce2O7−δ (A = La3+, Nd3+ and Bi3+) are displayed in Figure 6, ranging between 200 and 800 nm. The trend is the same for all three samples. The previous literature showed that the absorption peak of CeO2 is found to be at around 349 nm [33]. Currently, the broad absorption peaks for all nanocomposites have started from 340 nm and ended at 370 nm. In the graph, the La2Ce2O7 nanoparticles showed very insignificant absorption peaks. In the case of neodymium (Nd) and bismuth (Bi), the absorption peaks became significant.
The Tauc plots are shown in Figure 7. Previously, the direct band gap of pure CeO2 was found to be 2.69 eV [34]. Moreover, the band gap of La2Ce2O7 was found to be 2.22 eV. This means that it shows the red shift with respect to pure ceria. Nd2Ce2O7 showed a band gap of 2.6 eV. Bi2Ce2O7 showed a band gap of 3.6 eV, of which tilted towards the blue shift. By introducing different dopants in the ceria, the band gap energies of La2Ce2O7 and Nd2Ce2O7 were decreased as compared to the ceria. This may be due to the creation of oxygen vacancies in the ceria lattice. On the other hand, Bi2Ce2O7 showed an increase in band energy with respect to the ceria. This means no significant oxygen vacancies were created.

3.4. FTIR Spectra of A2Ce2O7−δ (A = La3+, Nd3+, Bi3+)

The FTIR spectroscopy of A2Ce2O7−δ (A = La3+, Nd3+, Bi3+) nanoparticles was carried out in the range of 4000−400 cm−1, as shown in Figure 8. Chemical bonds as well as functional groups were confirmed by a FTIR spectrum. In these results, most of the peaks exist in the region, 2500–2000 cm−1, which is attributed to triple bond region. Almost all of the peaks are broad, which implies the presence of intermolecular hydrogen bonding [35]. The medium peak was found at 2345 cm−1, which may be ascribed to N-H stretching. In previous studies, peaks between 2000 and 2300 cm−1 occur due to a conjugated effect, like carbon-di-amide, rather than pure nitriles C=N=N, N=C=N, C–O–O, N=C=O, etc. [36]. Absorption peaks found at 2162 cm−1 and 2017 cm−1 are due to azide (N=N=N) and ketenimine (C=C=N), respectively. In prior studies, a peak at 1516 cm−1 has been labelled as an unidentified nitrate vibration [37]. Therefore, the absorption peak around 1532 cm−1 may also be due to unidentified nitrate vibrations.
In FTIR, the finger print region (400 cm−1 and 1500 cm−1) is called fundamental infrared because most inorganic substances absorb IR in this region [38]. The peak at 653 cm−1 corresponds to the La–O stretching vibrations in reported work [39]. For La2Ce2O7, the absorption peak in the fingerprint region found at 678 cm−1 may be caused by La-O stretching. The peaks at 411 [40] and 533 cm−1 [41] correspond to the characteristic Nd-O vibrations of Nd2O3 particles. The Na2Ce2O7 band in the fingerprint region was found at 584 cm−1, near the literature value. For Bi2Ce2O7, the fingerprint peak was found at 852 and 657 cm−1, which may be due to Bi-O stretching, as the Bi-O band has been found at 844 cm−1 previously [42]. Overall, the FTIR results showed the presence of nitriles and carbenes (triple bonds) and some peaks for double bonds. The fingerprint values showed the presence of Ce, La, Nd and Bi oxides in the compositions.

3.5. Analysis of Crystal Structure and Oxygen Vacancies by Raman Spectroscopy

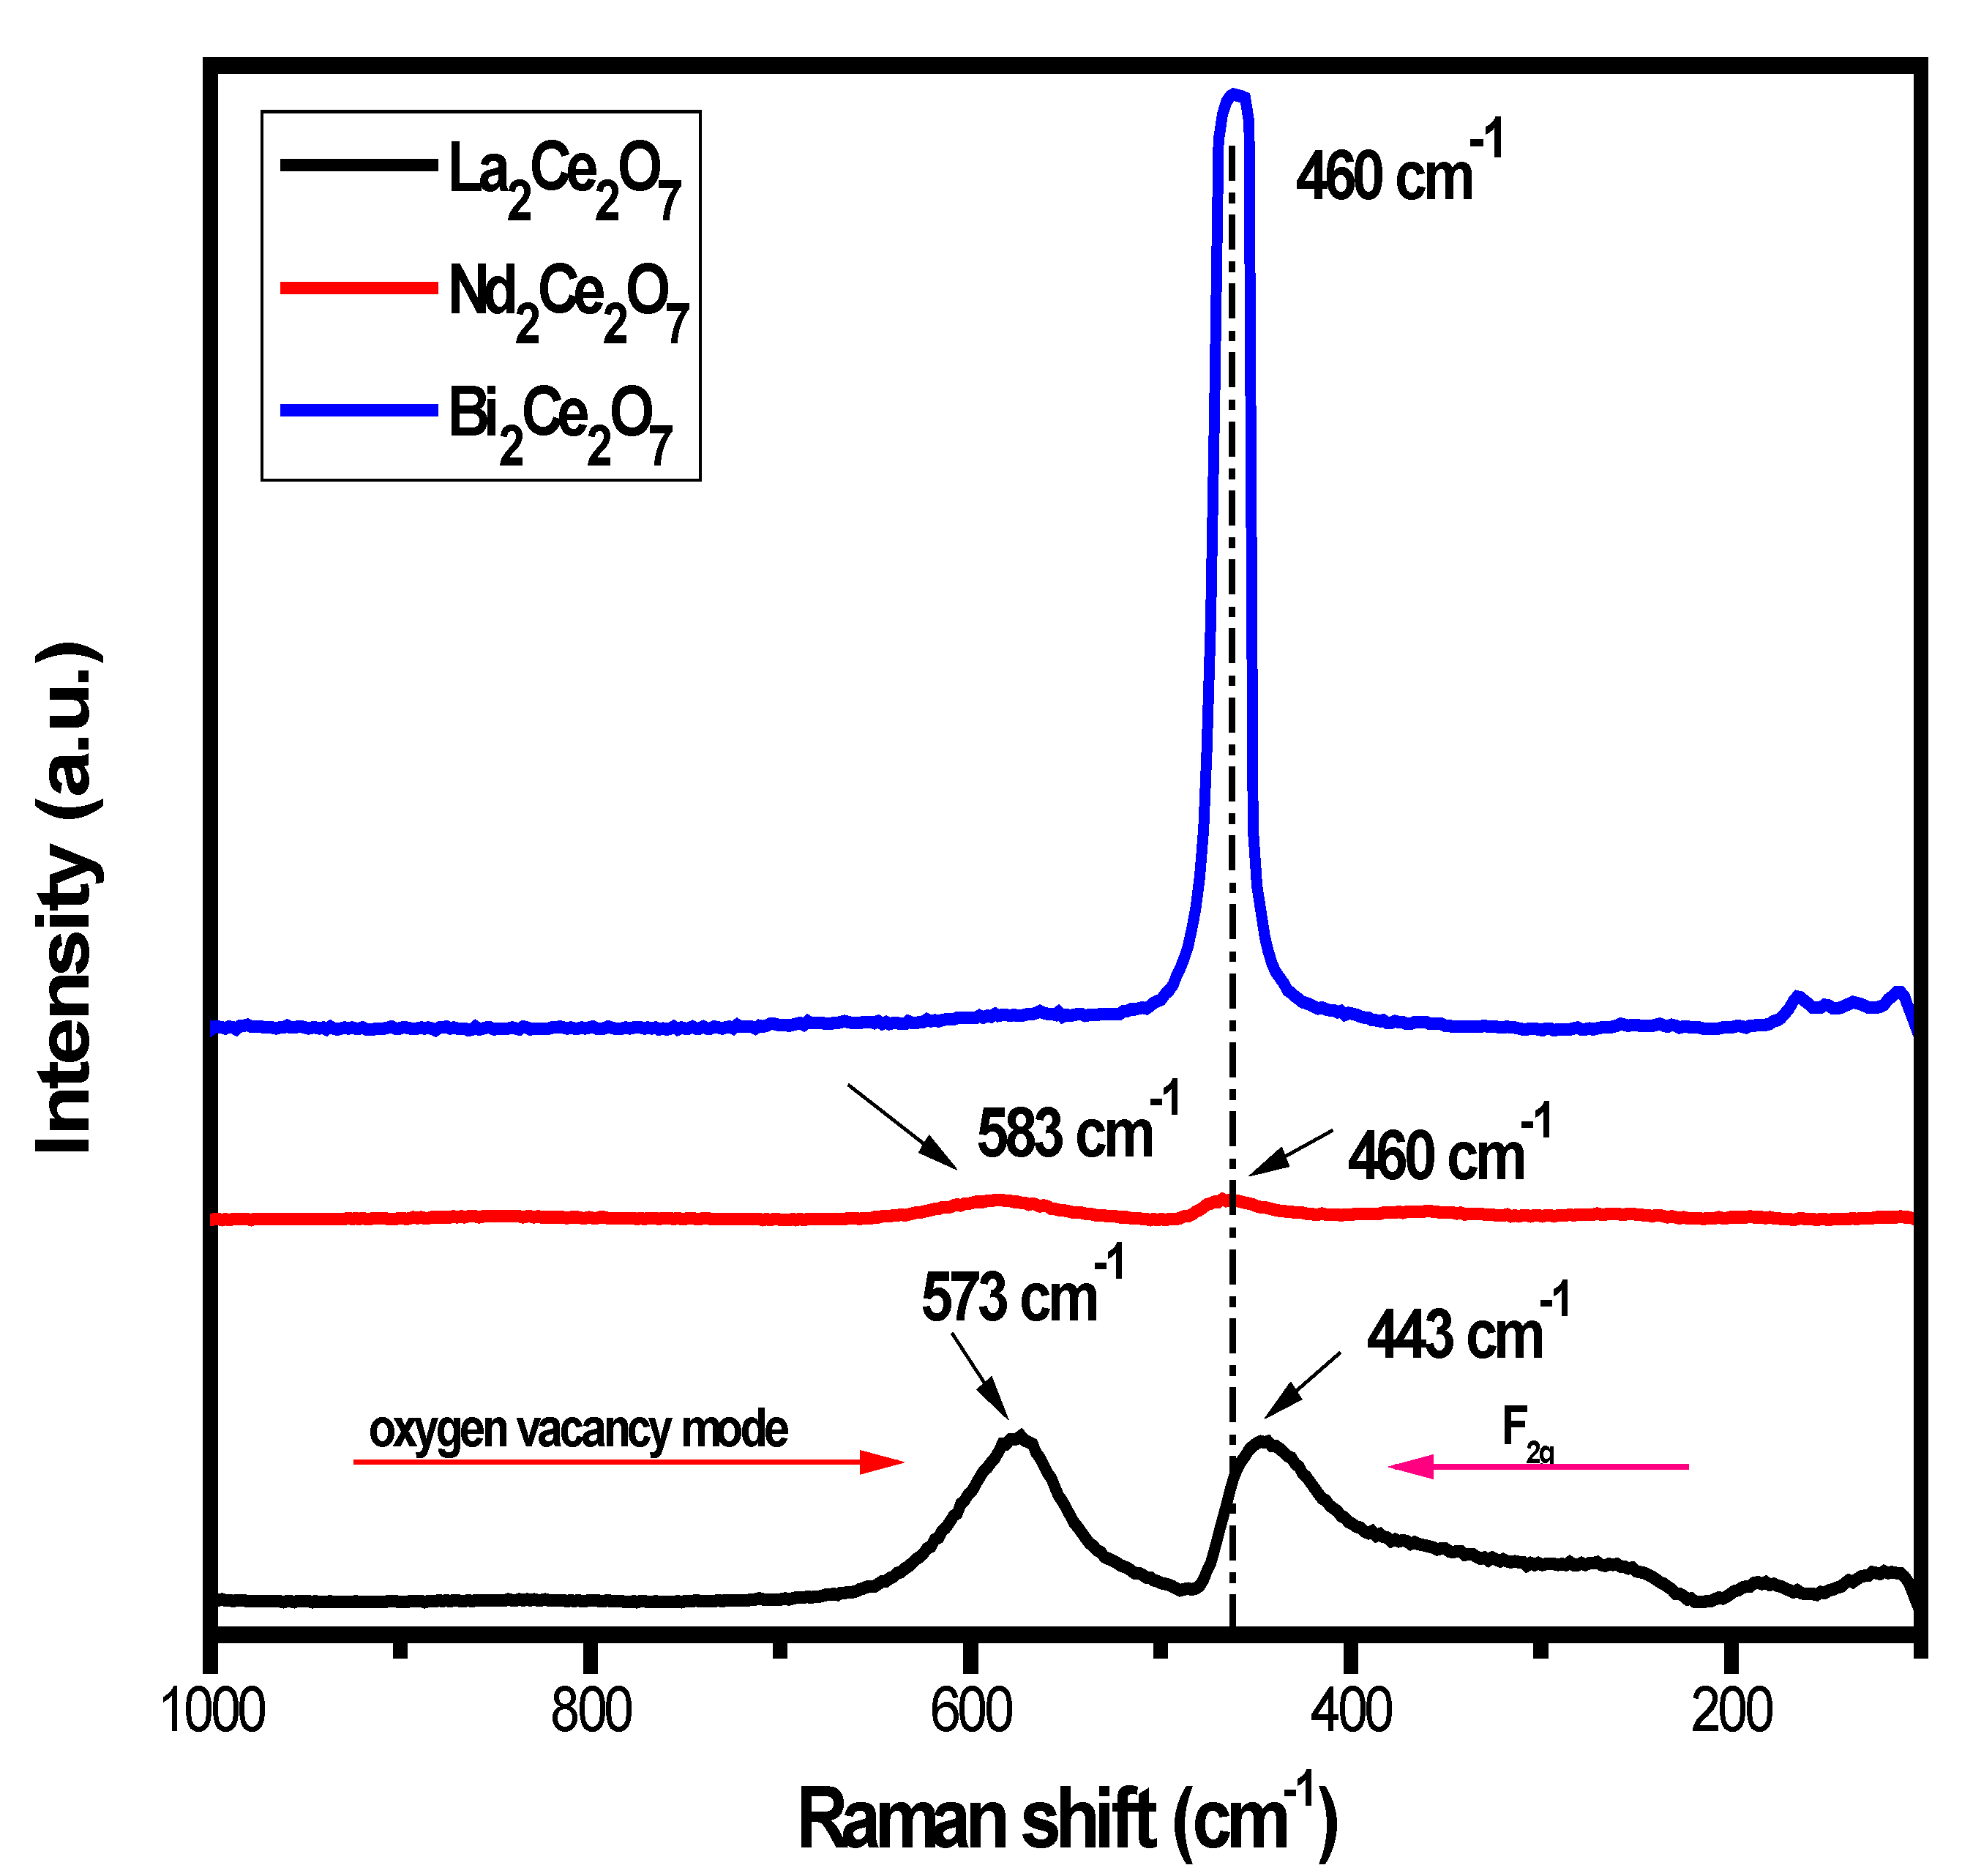
The changes in crystal lattices and oxygen vacancies caused by the dopants in each A2Ce2O7−δ powder were studied by Raman spectroscopy. Figure 9 clearly shows the Raman spectra of La2Ce2O7, Nd2Ce2O7 and Bi2Ce2O7 nanocomposites. Samples La2Ce2O7 and Nd2Ce2O7 exhibited the two characteristic peaks, whereas Bi2Ce2O7 showed only one peak. As previously reported [43], a well-crystallized CeO2 with an ideal cubic fluorite structure possesses only one Raman-active F2g mode at ~460 cm−1, matching the Ce-O bond vibration. Therefore, the existence of a peak near ~460 cm−1 confirms the fluorite structure of all prepared samples.
In these results, the F2g peak of La2Ce2O7 was moved to a lower wave number. This may be due to the doping of La3+ into the CeO2 lattice, of which has also been reported previously [44]. Another paper also confirmed that F2g mode peaks in cerium oxide migrated to the lower area (by 2 cm−1 to 14 cm−1) [45]. Due to this, the Raman peak of the La2Ce2O7 sample at ~443 cm−1 may be attributed to the F2g mode of the defective cubic fluorite phase, and the peak at ~574 cm−1 can be attributed to surface oxygen vacancies that were created by the integration of La3+ into the CeO2 lattice. Junwei Xu also found two Raman peaks of the La2Ce2O7-based samples at ~445 cm−1 and ~575 cm−1, which are quite near to the present results [46]. Previous studies explain that the shift in F2g mode is due to structural expansion when La3+ fuses into the fluorite structure. Nd2Ce2O7 showed almost the same behavior with blunter peaks. The peak at ~460 cm−1 is assigned to the F2g mode, and the bluntness of the peak is assigned to the expansion of the structure due to Nd3+ ions’ incorporation in the fluorite structure. The case of Bi2Ce2O7 is different from La2Ce2O7 and Nd2Ce2O7. The peak for Bi2Ce2O7 found at ~460 cm−1 is well-matched with the fluorite structure. This may show the full fusion of Bi3+ ions in the ceria lattice. No additional modes were observed. Accumulatively, no significant oxygen vacancy is created in case of Bi2Ce2O7. This also supports the band gap result of Bi2Ce2O7.
Due to oxygen vacancies, additional peaks were seen in spectra that had been doped with rare earth metals [47]. As charge compensation defects caused by the introduction of other metal cations into the crystal lattice of CeO2. To maintain the charge neutrality, Ce4+ ions replaced by La3+ and Nd3+ ions, which create extrinsic vacancies. The peak positions at 573 cm−1 and 583 cm−1 correspond to oxygen vacancies.

3.6. Electrochemical Impedance Spectroscopy (EIS)

Figure 10a shows the electrochemical properties of energy devices using A2Ce2O7−δ as an electrolyte for conventional fuel cells. The conventional device used LiNiCuZnOx (LNCZ) as an anode and La0.6Sr0.4Co0.2Fe0.8O3 (LSFC) as a cathode. The EIS spectra for conventional cells with the following combinations LNCZ/La2Ce2O7/LSFC, LNCZ/Nd2Ce2O2/LSFC and LNCZ/Bi2Ce2O7/LSFC have been recorded. The entire Nyquist plot for conventional SOFCs demonstrates two components: a depressed small semicircle at the high-frequency region and another complete arc at a low-frequency range. It is noticeable that Bi2Ce2O7 showed the lowest value of Ro among the other candidates.
Furthermore, the EIS data were simulated with Z-View software using the equivalent circuit model of Ro(RctCEPct)(R1CEP1), as shown in Figure 10b. Where R represents a resistance and CEP is the constant phase element representing a non-ideal capacitor! where ohmic resistance (Ro), charge transfer (Rct), mass transfer (R1), according to the simulated Ro + Rct, the total conductivity (σt), as presented in the Supplementary Materials.
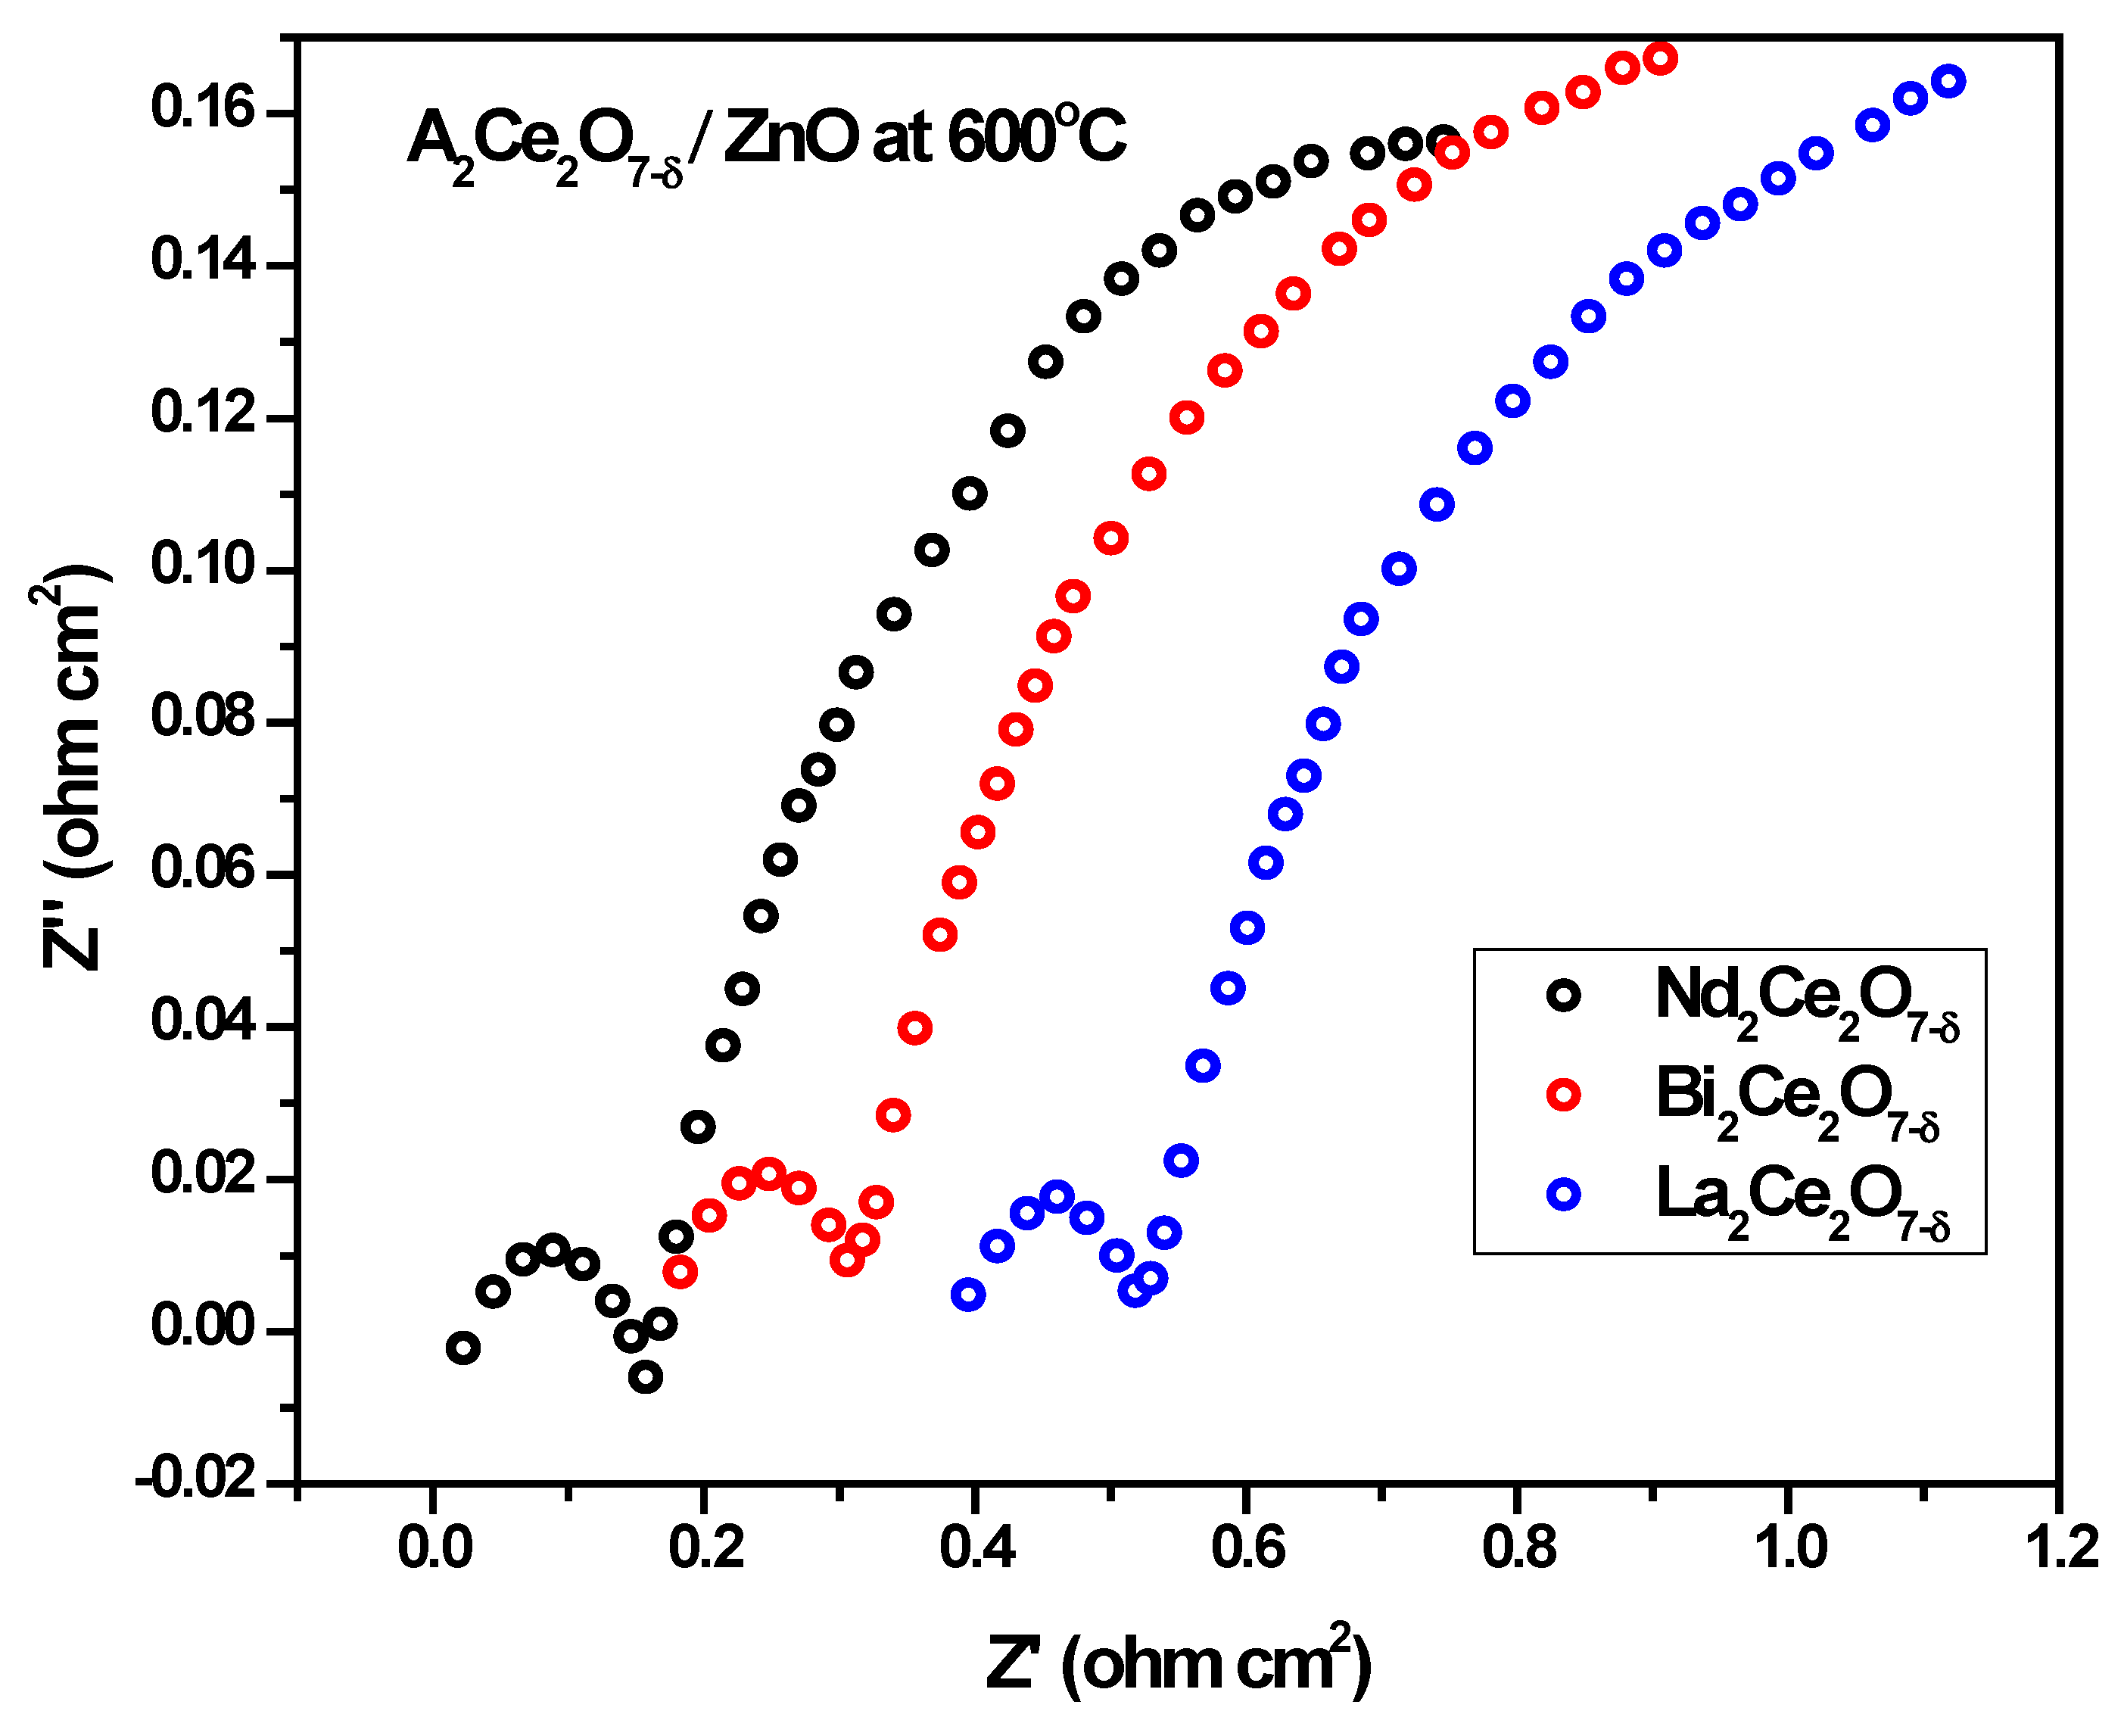
The A2Ce2O7/NCAL and A2Ce2O7/ZnO composite materials were used for a single-component solid oxide fuel cell (SC-SOFC) with a weight ratio of 5:5, measured at a temperature of 600 °C. The composite mixtures to be analyzed were La2Ce2O7/NCAL, Nd2Ce2O2/NCAL, Bi2Ce2O7/NCAL La2Ce2O7/ZnO, Nd2Ce2O2/ZnO, and Bi2Ce2O7/ZnO. In Figure 11, it was noticed that A2Ce2O7/NCAL nanocomposite materials were represented by the two semicircles on the Nyquist plot. The first semicircle was completed, whereas the second was incomplete. In Figure 12, the mixture of A2Ce2O7/ZnO show clear small semicircles for high frequencies, and for lower frequencies, curve lines are noticed.
For all nanocomposites, SC-SOFC were represented by the two semicircles on the Nyquist plot. The first semicircle depicts the inside of the grain, and the second one stands for the electrodes. At higher frequencies, the intercept on the real axis (Z′) corresponds to Ro. This is generally because of ionic and electronic resistances in the cell, and it varies with dopants. It was observed that Nd2Ce2O7−δ showed the lowest value of Ro than La2Ce2O7−δ and Bi2Ce2O7−δ for both combinations.

3.7. The Cell Performance with Hydrogen Fuel Using Conventional Fuel Cells

The fuel cell performance was investigated using various compositions in two ways:
(i)
A2Ce2O7−δ (A = La3+, Nd3+, Bi3+) were used as an electrolyte in conventional SOFCs with LNCZ as an anode and LSCF as a cathode.
(ii)
For a single-component solid oxide fuel cell (SC-SOFC), a mixture of ionic- and semiconductors was used as a single layer. The performance was tested with the mixtures A2Ce2O7−δ/NCAL and then A2Ce2O7−δ/ZnO.
The obtained fuel cell power for conventional devices is shown in Figure 13. The IV measurements of three devices NCZO/La2Ce2O7/LSFC, NCZO/Nd2Ce2O7/LSFC, and NCZO/Bi2Ce2O7/LSFC were recorded. In Figure 13, it can be seen that the open circuit voltage (OCV) has values ~0.95 V, 0.97 V and 1.05 V for La2Ce2O7, Nd2Ce2O and Bi2Ce2O7 electrolytes, respectively. Among them, NCZO/Bi2Ce2O7/LSFC showed a maximum power density of 0.65788 W cm−2 measured at 650 °C. This indicates that the A2Ce2O7 material can serve as a good electrolyte candidate.
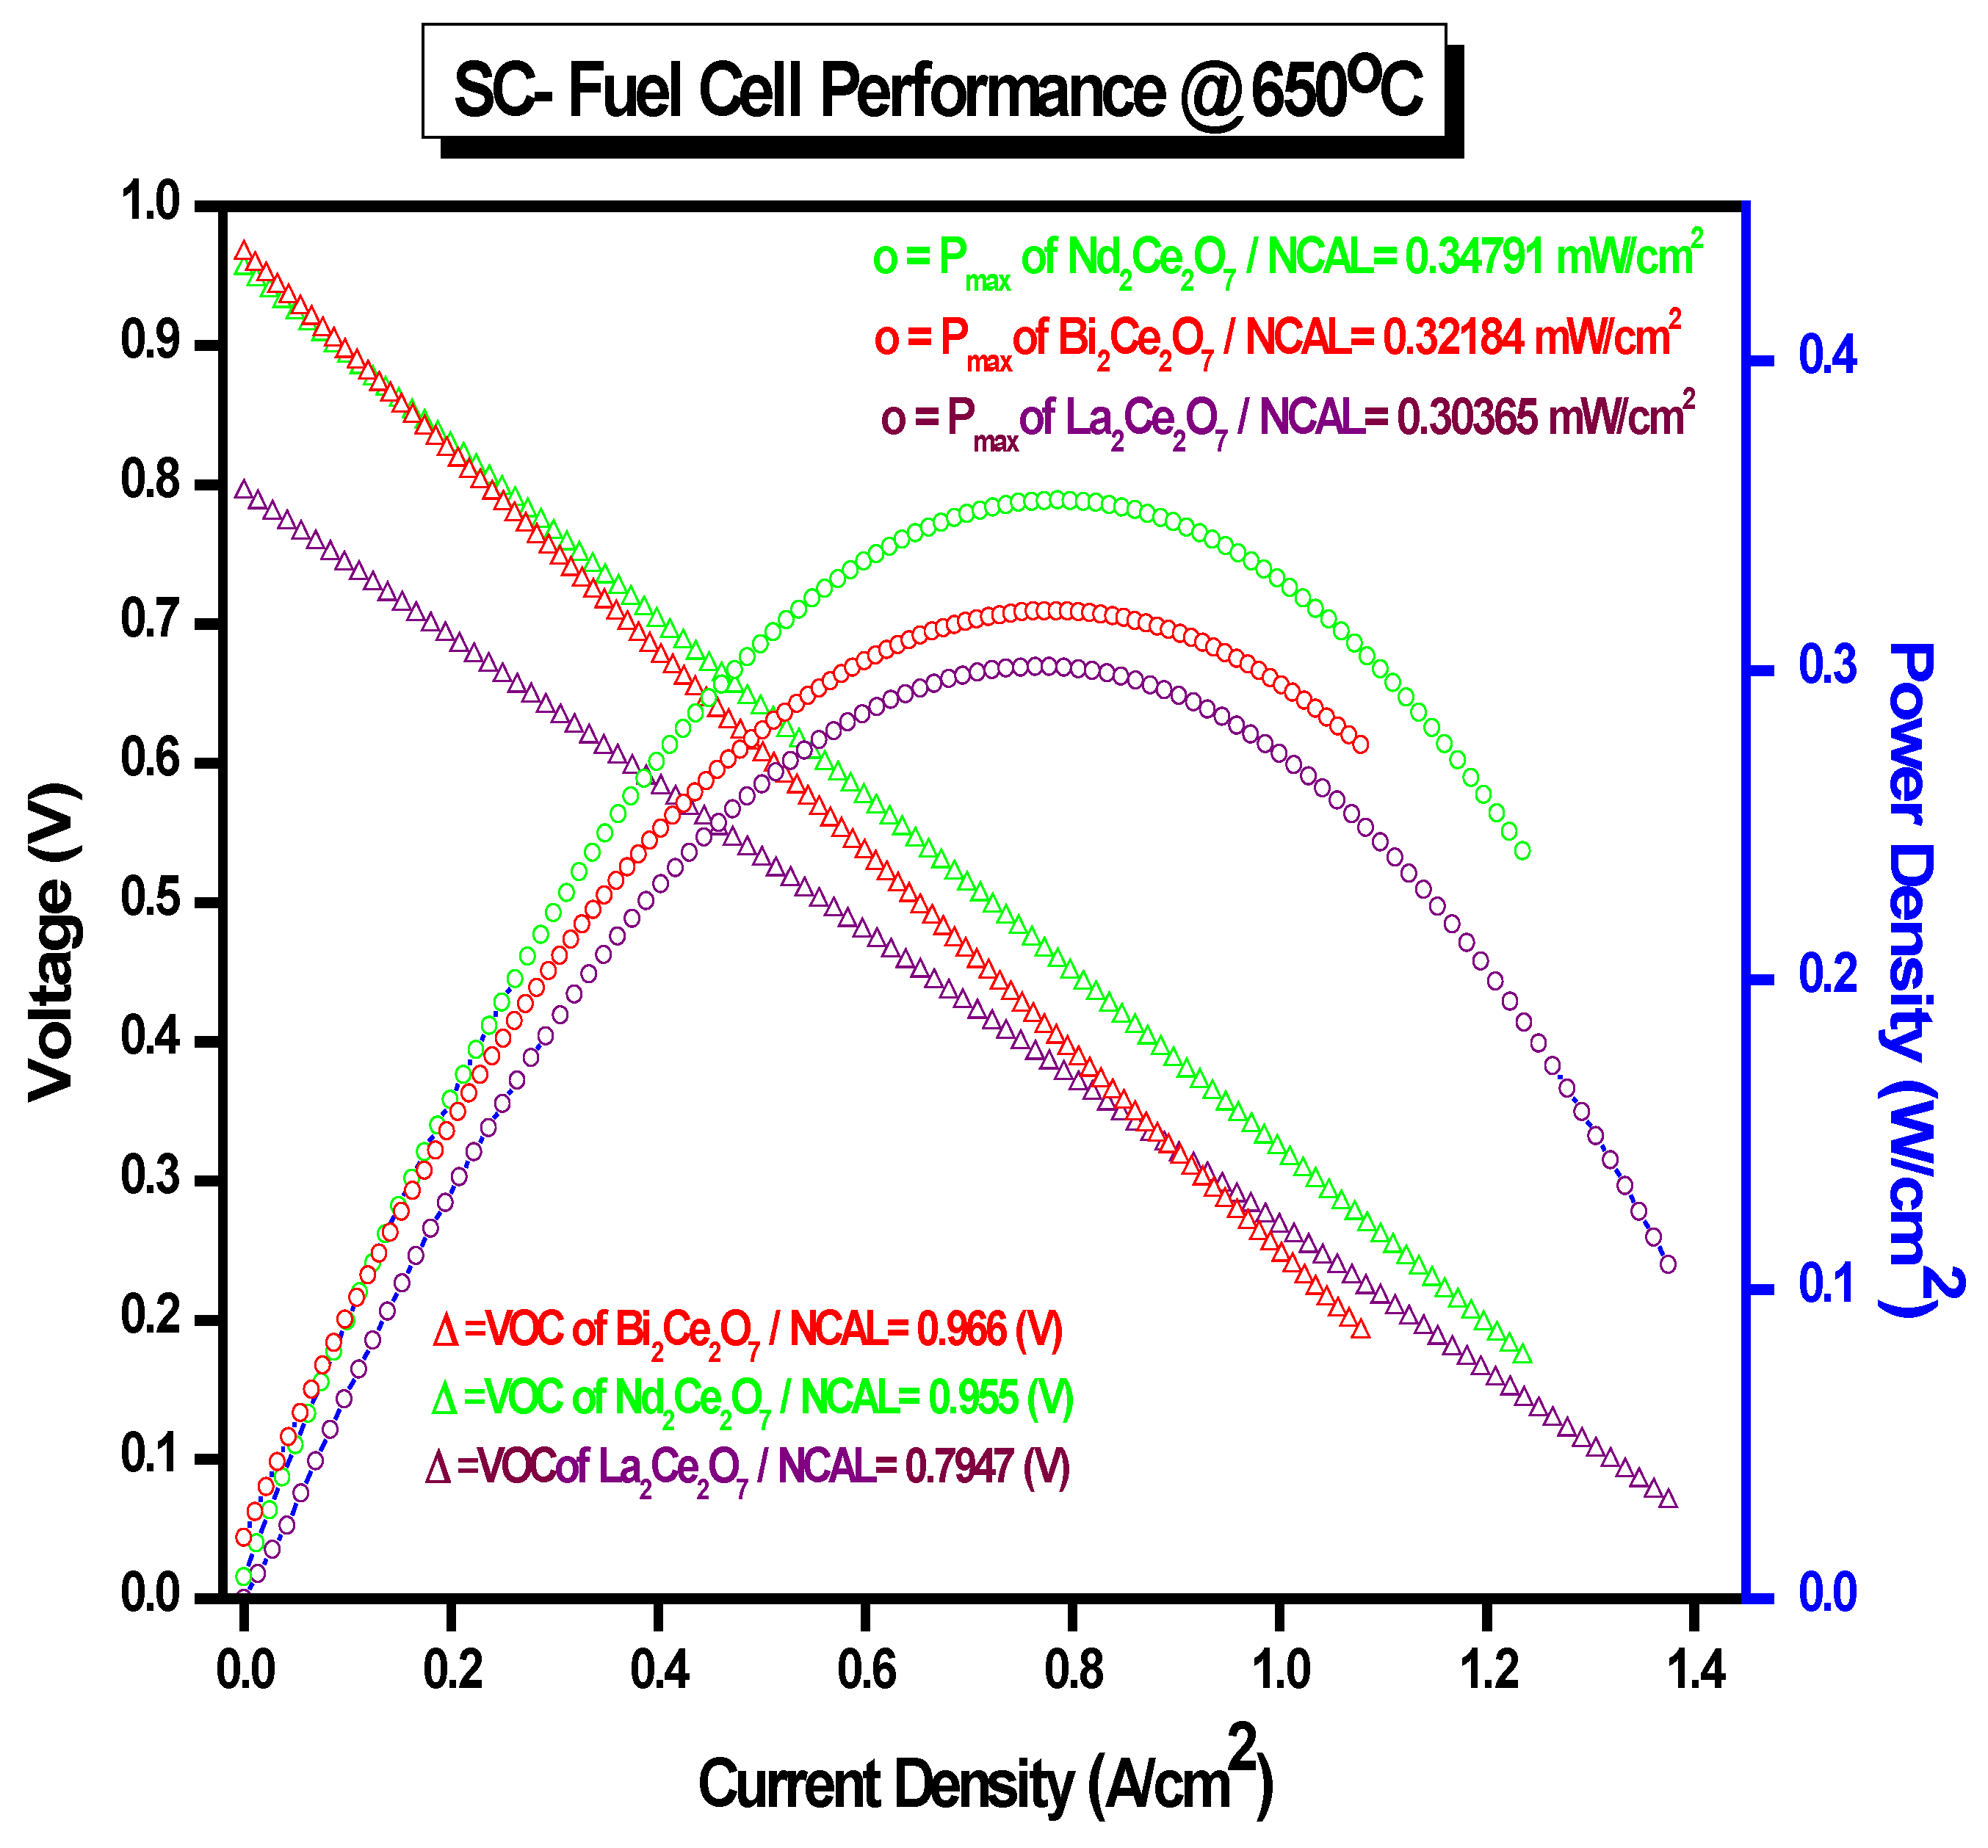
For a single-component device, the mixture of ionic- and semiconductors was taken with ratio 5A2Ce2O7-5NCAL. Figure 14 shows the fuel cell performance of La2Ce2O7/NCAL, Nd2Ce2O7/NCAL and Bi2Ce2O7/NCAL. Among them, Nd2Ce2O7/NCAL showed the maximum power output (Pmax), reaching 0.348 W cm−2 at 650 °C, and the OCV reached as high as 0.966 V.
Figure 15 shows the fuel cell performance of La2Ce2O7/ZnO, Nd2Ce2O7/ZnO, and Bi2Ce2O7/ZnO. Among them, Nd2Ce2O7/ZnO showed the best performance as SC-SOFCs. It exhibited the maximum power output (Pmax), reaching 0.5899 W cm−2 at 650 °C, and the OCV reached as high as 1.01 V.
The performance results show that the A2Ce2O7−δ (A = La3+, Nd3+, Bi3+) are good candidates for conventional as well as for single-component SOFCs. Among them, Bi2Ce2O7 showed the best performance as an electrolyte for conventional SOFCs, whereas Nd2Ce2O7 showed the best performance as SC-SOFCs for both combinations.

4. Conclusions

The nanocomposite materials A2Ce2O7−δ (A = La3+, Nd3+, Bi3+) were efficiently fabricated using the wet chemical method. The prepared composite materials were evaluated for conventional as well as for single-component SOFCs. The crystalline structure of A2Ce2O7−δ (A = La3+, Nd3+, Bi3+) verified the defective cubic fluorite structure. The FTIR spectra confirmed that dopants were well settled in the ceria by their associated bands. The particles of all samples had irregular polygon morphology. The Tauc plot demonstrated an increase in band gap energy with a decrease in crystalline size, which might be due to the generation of oxygen vacancies (Ov). The Raman results confirmed the defective cubic fluorite structure. The EIS and fuel cell performance of conventional fuel cells showed that Bi2Ce2O7 produced the best result with a maximum power density of 0.65788 W/cm2 at 650 °C. The EIS and fuel cell performance of A2Ce2O7−δ (A = La3+, Nd3+, Bi3+) with NCAL as ionic and semiconductor composites showed the best performance of Nd2Ce2O7, with a power density of 0.34 W/cm2. The fuel cell performance of A2Ce2O7−δ (A = La3+, Nd3+, Bi3+) with ZnO as ionic and semiconductor composites again showed Nd2Ce2O7/ZnO as the best candidate for SC-SOFCs with a power density of 0.58 W cm−2. The Nd2Ce2O7 showed good agreement with ZnO as compared to NCAL for SC-SOFCs. Overall, A2Ce2O7−δ (A = La3+, Nd3+, Bi3+) proved to be worthy candidates for conventional as well as for single-component SOFCs.

Supplementary Materials

The following supporting information can be downloaded at: https://www.mdpi.com/article/10.3390/en16145308/s1.

Author Contributions

Conceptualization, M.B., M.M., Z.N.K. and R.R.; Methodology, M.B., Z.N.K. and S.R.; Writing—review & editing, R.R. and M.M.; Supervision, M.M. All authors have read and agreed to the published version of the manuscript.

Funding

This research received no external funding.

Data Availability Statement

Not applicable.

Conflicts of Interest

The authors declare no conflict of interest.

References and Notes

  1. Singh, M.; Zappa, D.; Comini, E. Solid oxide fuel cell: Decade of progress, future perspectives and challenges. Int. J. Hydrogen Energy 2021, 46, 27643–27674. [Google Scholar] [CrossRef]
  2. Zakaria, Z.; Kamarudin, S.K. Advanced modification of Scandia-stabilized zirconia electrolytes for solid oxide fuel cells application—A review. Int. J. Energy Res. 2021, 45, 4871–4887. [Google Scholar] [CrossRef]
  3. Zhu, B.; Mi, Y.; Xia, C.; Wang, B.; Kim, J.-S.; Lund, P.; Li, T. A nanoscale perspective on solid oxide and semiconductor membrane fuel cells: Materials and technology. Energy Mater. 2022, 1, 100002. [Google Scholar] [CrossRef]
  4. Lu, Y.; Mi, Y.; Li, J.; Qi, F.; Yan, S.; Dong, W. Recent Progress in Semiconductor-Ionic Conductor Nanomaterial as a Membrane for Low-Temperature Solid Oxide Fuel Cells. Nanomaterials 2021, 11, 2290. [Google Scholar] [CrossRef]
  5. Mohebbi, H.; Mirkazemi, S.M. Controlling Yttria-stabilized zirconia/gadolinia-doped ceria interdiffusion layer in the solid oxide fuel cell electrolyte via flash sintering method. Ionics 2021, 27, 5219–5227. [Google Scholar] [CrossRef]
  6. Alipour, S.; Sagir, E.; Sadeghi, A. Multi-criteria decision-making approach assisting to select materials for low-temperature solid oxide fuel cell: Electrolyte, cathode& anode. Int. J. Hydrogen Energy 2022, 47, 19810–19820. [Google Scholar] [CrossRef]
  7. Chen, M.; Luo, J.-L.; Chuang, K.T.; Sanger, A.R. Fabrication and electrochemical properties of cathode-supported solid oxide fuel cells via slurry spin coating. Electrochim. Acta 2012, 63, 277–286. [Google Scholar] [CrossRef]
  8. Thajudheen, T. Spectroscopic Investigation of Oxygen Vacancies in CeO2; University of Nova Gorica: Rožna Dolina, Slovenia, 2021. [Google Scholar]
  9. Mamedov, D.; Karazhanov, S.Z. Doping-induced modulation of electronic, optical and wetting properties of CeO2. J. Phys. Chem. Solids 2022, 168, 110820. [Google Scholar] [CrossRef]
  10. Pesaran, A.; Jaiswal, A.; Ren, Y.; Wachsman, E.D. Development of a new ceria/yttria-ceria double-doped bismuth oxide bilayer electrolyte low-temperature SOFC with higher stability. Ionics 2019, 25, 3153–3164. [Google Scholar] [CrossRef]
  11. Kalland, L.-E.Q. Ab Initio Modelling and Experimental Studies of Order-Disorder, Hydration, and Ionic Conductivity of Fluorite Related Oxides. Ph.D. Thesis, University of Oslo, Oslo, Norway, 2021. [Google Scholar]
  12. Cheng, S. Defects and Transport in Fluorite Related Materials Nd2Ce2O7 and Gd2Ce2O7. Master’s Thesis, University of Oslo, Oslo, Norway, 2012. [Google Scholar]
  13. Jiang, Y.; Song, X.; Zhong, Z.; Lian, Z.; Peng, K. Sintering and electrochemical performance of Nd2Ce2O7 electrolyte with Bi7WO13.5 sintering aid for proton conductor solid oxide fuel cells. J. Alloys Compd. 2020, 836, 155539. [Google Scholar] [CrossRef]
  14. Cardenas-Terrazas, P.S.; Ayala-Ayala, M.T.; Muñoz-Saldaña, J.; Fuentes, A.F.; Leal-Chavez, D.A.; Ledezma-Sillas, J.E.; Carreño-Gallardo, C.; Herrera-Ramirez, J.M. High ionic conductivity dysprosium and tantalum Co-doped bismuth oxide electrolyte for low-temperature SOFCs. Ionics 2020, 26, 4579–4586. [Google Scholar] [CrossRef]
  15. Shri Prakash, B.; Pavitra, R.; Senthil Kumar, S.; Aruna, S.T. Electrolyte bi-layering strategy to improve the performance of an intermediate temperature solid oxide fuel cell: A review. J. Power Sources 2018, 381, 136–155. [Google Scholar] [CrossRef]
  16. Rout, S.K.; Pratihar, S. Tailoring of properties in the preparation level of nano crystalline Ce0.8Sm0.2O1.9-δ(SDC) for the use of SOFC electrolyte. Mater. Today Proc. 2021, 45, 5764–5768. [Google Scholar] [CrossRef]
  17. Malešević, A.; Radojković, A.; Žunić, M.; Dapčević, A.; Perać, S.; Branković, Z.; Branković, G.J.J.o.A.C. Evaluation of stability and functionality of BaCe1−x InxO3−δ electrolyte in a wider range of indium concentration. J. Adv. Ceram. 2022, 11, 443–453. [Google Scholar] [CrossRef]
  18. Davar, F.; Hassankhani, A.; Loghman-Estarki, M.R. Controllable synthesis of metastable tetragonal zirconia nanocrystals using citric acid assisted sol–gel method. Ceram. Int. 2013, 39, 2933–2941. [Google Scholar] [CrossRef]
  19. Tang, A.; Li, B.; Sang, W.; Hongsong, Z.; Chen, X.; Zhang, H.; Ren, B. Thermophysical performances of high-entropy (La0.2Nd0.2Yb0.2Y0.2Sm0.2)2Ce2O7 and (La0.2Nd0.2Yb0.2Y0.2Lu0.2)2Ce2O7 oxides. Ceram. Int. 2021, 48, 5574–5580. [Google Scholar] [CrossRef]
  20. Akbar, M.; Alvi, F.; Shakir, M.I.; Rehman, S.U.; Rafique, A.; Mushtaq, N.; Raza, R. Effect of sintering temperature on properties of LiNiCuZn-Oxide: A potential anode for solid oxide fuel cell. Mater. Res. Express 2019, 6, 105505. [Google Scholar] [CrossRef]
  21. Voloshin, B.; Koshevoi, E.; Ulihin, A.; Popov, M.; Nemudry, A.P. Modifying the La0.6Sr0.4Co0.2Fe0.8O3–δ cathodic material by ferroactive molybdenum cation. Russ. J. Electrochem. 2022, 58, 163–167. [Google Scholar] [CrossRef]
  22. Chen, G.; Sun, W.; Luo, Y.; Liu, H.; Geng, S.; Yu, K.; Liu, G. Investigation of layered Ni0.8Co0.15Al0.05LiO2 in electrode for low-temperature solid oxide fuel cells. Int. J. Hydrogen Energy 2018, 43, 417–425. [Google Scholar] [CrossRef]
  23. Hussain, S.; Li, Y.; Mustehsin, A.; Ali, A.; Thebo, K.H.; Ali, Z.; Hussain, S.J.I. Synthesis and characterization of ZnO/samarium-doped ceria nanocomposites for solid oxide fuel cell applications. Ionics 2021, 27, 4849–4857. [Google Scholar] [CrossRef]
  24. Yi, H.; Che, J.; Xu, Z.; Liang, G.; Liu, X.J.C.I. Sintering resistance of La2Ce2O7, La2Zr2O7, and yttria stabilized zirconia ceramics. Ceram. Int. 2021, 47, 4197–4205. [Google Scholar] [CrossRef]
  25. Kumar, D.; Kumar, A.; Prakash, R.; Singh, A.K. X-ray diffraction analysis of Cu2+ doped Zn1-xCuxFe2O4 spinel nanoparticles using Williamson-Hall plot method. AIP Conf. Proc. 2019, 2142, 070018. [Google Scholar] [CrossRef] [Green Version]
  26. Ali, U. Multi Doped Ceria based Electrolyte for Low Temperature Solid Oxide Fuel Cell. 2021. [Google Scholar]
  27. Zamudio-García, J.; dos Santos-Gómez, L.; Porras-Vázquez, J.M.; Losilla, E.R.; Marrero-López, D. Doping effects on the structure and electrical properties of La2Ce2O7 proton conductors. J. Alloys Compd. 2019, 816, 152600. [Google Scholar] [CrossRef]
  28. Hull, S.; Norberg, S.; Ahmed, I.; Eriksson, S.; Marrocchelli, D.; Madden, P. Oxygen vacancy ordering within anion-deficient Ceria. J. Solid State Chem. 2009, 182, 2815–2821. [Google Scholar] [CrossRef]
  29. Zhang, S.; Savaniu, C.; Irvine, J. Fluorite Materials for SOFC Electrolyte Applications. ECS Trans. 2019, 91, 1111–1119. [Google Scholar] [CrossRef]
  30. Bekheet, M.F.; Grünbacher, M.; Schlicker, L.; Gili, A.; Doran, A.; Epping, J.D.; Gurlo, A.; Klötzer, B.; Penner, S. On the structural stability of crystalline ceria phases in undoped and acceptor-doped ceria materials under in situ reduction conditions. Crystengcomm 2018, 21, 145–154. [Google Scholar] [CrossRef] [Green Version]
  31. Zou, D.; Yi, Y.; Song, Y.; Guan, D.; Xu, M.; Ran, R.; Wang, W.; Zhou, W.; Shao, Z. The BaCe0.16Y0.04Fe0.8O3−δ nanocomposite: A new high-performance cobalt-free triple-conducting cathode for protonic ceramic fuel cells operating at reduced temperatures. J. Mater. Chem. A 2022, 10, 5381–5390. [Google Scholar] [CrossRef]
  32. Komatsu, Y.; Sciazko, A.; Shikazono, N. Isostatic pressing of screen printed nickel-gadolinium doped ceria anodes on electrolyte-supported solid oxide fuel cells. J. Power Sources 2021, 485, 229317. [Google Scholar] [CrossRef]
  33. Ali, M.M.; Mahdi, H.S.; Parveen, A.; Azam, A. Optical properties of cerium oxide (CeO2) nanoparticles synthesized by hydroxide mediated method. AIP Conf. Proc. 2018, 1953, 030044. [Google Scholar] [CrossRef]
  34. Bakiro, M.; Ahmed, S.H.; Alzamly, A. Investigation of the band gap energy shift and photocatalytic properties of Bi3+-doped ceria. Inorg. Chem. Commun. 2020, 116, 107906. [Google Scholar] [CrossRef]
  35. Gandhi, S.; Nagalakshmi, N.; Baskaran, I.; Dhanalakshmi, V.; Nair, M.R.G.; Anbarasan, R. Synthesis and characterization of nano-sized NiO and its surface catalytic effect on poly(vinyl alcohol). J. Appl. Polym. Sci. 2010, 118, 1666–1674. [Google Scholar] [CrossRef]
  36. Klingenberg, B.; Vannice, M.A. Influence of Pretreatment on Lanthanum Nitrate, Carbonate, and Oxide Powders. Chem. Mater. 1996, 8, 2755–2768. [Google Scholar] [CrossRef]
  37. Singh, K.; Kumar, R.; Chowdhury, A. Synthesis of La-doped ceria nanoparticles: Impact of lanthanum depletion. J. Mater. Sci. 2016, 51, 4134–4141. [Google Scholar] [CrossRef]
  38. Misevicius, M.; Scit, O.; Grigoraviciute-Puroniene, I.; Degutis, G.; Bogdanoviciene, I.; Kareiva, A. Sol–gel synthesis and investigation of un-doped and Ce-doped strontium aluminates. Ceram. Int. 2012, 38, 5915–5924. [Google Scholar] [CrossRef]
  39. Méndez, M.; Carvajal, J.; Cesteros, Y.; Aguiló, M.; Díaz, F.; Giguère, A.; Drouin, D.; Martínez-Ferrero, E.; Salagre, P.; Formentín, P.J.O.M. Sol–gel Pechini synthesis and optical spectroscopy of nanocrystalline La2O3 doped with Eu3+. Opt. Mater. 2010, 32, 1686–1692. [Google Scholar] [CrossRef]
  40. Lembang, M.S.; Yulizar, Y.; Sudirman, S.; Apriandanu, D.O.B. A facile method for green synthesis of Nd2O3 nanoparticles using aqueous extract of Terminalia catappa leaf. AIP Conf. Proc. 2018, 2023. [Google Scholar] [CrossRef]
  41. Yuliani, H.; Mayasari, R.D.; Kalembang, E.; Deni, Y.; Santi, D.R.; Pangestika, P.W.; Purwanto, S.; Sugeng, B.; Suyanti, S.; Setyadji, M. ANALYSIS OF STRUCTURE AND ANTIMICROBIAL ACTIVITY OF CeO2 AND Nd2O3 NANOPARTICLES. Spektra J. Fis. dan Apl. 2019, 4, 105–112. [Google Scholar] [CrossRef]
  42. Bandyopadhyay, S.; Dutta, A. Optical and ionic transport mechanism γ-phase stabilized nanostructured Bi-Ce-O ionic conductors: A structure-property correlation study. Ionics 2019, 25, 2873–2886. [Google Scholar] [CrossRef]
  43. Syed, A.; Yadav, L.S.R.; Bahkali, A.H.; Elgorban, A.M.; Hakeem, D.A.; Ganganagappa, N. Effect of CeO2-ZnO Nanocomposite for Photocatalytic and Antibacterial Activities. Crystals 2020, 10, 817. [Google Scholar] [CrossRef]
  44. Schmitt, R.; Nenning, A.; Kraynis, O.; Korobko, R.; Frenkel, A.I.; Lubomirsky, I.; Haile, S.M.; Rupp, J.L.M. A review of defect structure and chemistry in ceria and its solid solutions. Chem. Soc. Rev. 2020, 49, 554–592. [Google Scholar] [CrossRef] [Green Version]
  45. Kainbayev, N.; Sriubas, M.; Virbukas, D.; Rutkuniene, Z.; Bockute, K.; Bolegenova, S.; Laukaitis, G. Raman Study of Nanocrystalline-Doped Ceria Oxide Thin Films. Coatings 2020, 10, 432. [Google Scholar] [CrossRef]
  46. Xu, J.; Zhang, Y.; Liu, Y.; Fang, X.; Xu, X.; Liu, W.; Zheng, R.; Wang, X.J.E.J.o.I.C. Optimizing the Reaction Performance of La2Ce2O7-Based Catalysts for Oxidative Coupling of Methane (OCM) at Lower Temperature by Lattice Doping with Ca Cations. Eur. J. Inorg. Chem. 2019, 2019, 183–194. [Google Scholar] [CrossRef]
  47. Sato, T.; Tateyama, S. Temperature dependence of the linewidth of the first-order Raman spectrum for crystalline CeO2. Phys. Rev. B 1982, 26, 2257–2260. [Google Scholar] [CrossRef]
Figure 1. Diffraction pattern for A2Ce2O7−δ (A = La3+, Nd3+, Bi3+) nanocomposites.
Energies 16 05308 g001
Figure 2. Comparison of the crystallite size and band gap of A2Ce2O7−δ (A = La3+, Nd3+, Bi3+) composite materials prepared by the wet chemical method.
Energies 16 05308 g002
Figure 3. (ac) SEM micrographs for A2Ce2O7−δ (A = La3+, Nd3+ and Bi3+) nanocomposite materials prepared by sol–gel and sintered at 1173 K for 5 h.
Energies 16 05308 g003
Figure 4. (ae) Elemental mapping analysis of the Nd2Ce2O7−δ pellet by the sol–gel method after sintering at 1250 °C for 12 h.
Energies 16 05308 g004
Figure 5. EDS spectrum of the Nd2Ce2O7−δ pellet by the sol–gel method after sintering at 1250 °C for 12 h.
Energies 16 05308 g005
Figure 6. UV–visible spectra for A2Ce2O7−δ (A = La3+, Nd3+ and Bi3+) nanocomposite materials.
Energies 16 05308 g006
Figure 7. Comparison of Tauc plots using UV–visible spectra for A2Ce2O7−δ (A = La3+, Nd3+ and Bi3+) nanocomposite materials.
Energies 16 05308 g007
Figure 8. FTIR spectra of A2Ce2O7−δ (A = La3+, Nd3+, Bi3+) composite material for energy devices.
Energies 16 05308 g008
Figure 9. Raman spectra of the A2Ce2O7−δ (A = La3+, Nd3+, Bi3+) composite material for SC-SOFCs.
Energies 16 05308 g009
Figure 10. (a) EIS spectra of A2Ce2O7 (A = La+3, Nd+3, Bi+3) as an electrolyte for conventional SOFCs at 600 °C. (b) The equivalent circuit with model Ro(RctCEPct)(R1CEP1).
Energies 16 05308 g010aEnergies 16 05308 g010b
Figure 11. EIS spectra of A2Ce2O7 (A = La+3, Nd+3, Bi+3)/NCAL as a single-component fuel cell at 600 °C.
Energies 16 05308 g011
Figure 12. EIS spectra of A2Ce2O7 (A = La+3, Nd+3, Bi+3)/ZnO as a single-component fuel cell at 600 °C.
Energies 16 05308 g012
Figure 13. Conventional fuel cell performance with La2Ce2O7, Nd2Ce2O7 and Bi2Ce2O7 as electrolyte materials using H2 fuel at 650 °C.
Energies 16 05308 g013
Figure 14. Fuel cell performance of La2Ce2O7/NCAL, Nd2Ce2O7/NCAL and Bi2Ce2O7/NCAL nanocomposite materials for SC-SOFCs operated with H2 fuel at 650 °C.
Energies 16 05308 g014
Figure 15. Fuel cell performance of La2Ce2O7/ZnO, Nd2Ce2O7/ZnO and Bi2Ce2O7/ZnO nanocomposite materials for SC-SOFCs operated with H2 fuel at 650 °C.
Energies 16 05308 g015
Table 1. Comparison of crystallite size, lattice constant and lattice strain from the XRD result of A2Ce2O7−δ (A = La3+, Nd3+, Bi3+) nanocomposites for SOFCs.
SamplesAngleFWHMCrystallite Size (nm)Lattice Constant (A°)Lattice Strain (ε)Phase
La2Ce2O727.670.426020.075.5730−0.15423Cubic
Nd2Ce2O728.110.44919.065.4890−0.6769Cubic
Bi2Ce2O728.520.4917.485.41130.488572Cubic
Table 2. EDS quantitative analysis of the Nd2Ce2O7−δ pellet.
ElementWeight%Atomic%
O K32.1480.80
Ce L33.159.52
Nd L34.719.68
Total100
Disclaimer/Publisher’s Note: The statements, opinions and data contained in all publications are solely those of the individual author(s) and contributor(s) and not of MDPI and/or the editor(s). MDPI and/or the editor(s) disclaim responsibility for any injury to people or property resulting from any ideas, methods, instructions or products referred to in the content.