Article

A Hybrid Artificial Ecosystem Optimizer and Incremental-Conductance Maximum-Power-Point-Tracking-Controlled Grid-Connected Photovoltaic System

by
Burhan U Din Abdullah
1,
Suman Lata
1,
Shiva Pujan Jaiswal
2,
Vikas Singh Bhadoria
3,*,
Georgios Fotis
4,
Athanasios Santas
5 and
Lambros Ekonomou
6,*
1
School of Engineering and Technology, Sharda University, Greater Noida 201301, Uttar Pradesh, India
2
Virendra Happiness School, Mirzapur 231304, Uttar Pradesh, India
3
Industry Integration Cell, Shri Vishwakarma Skill University, Palwal 121102, Haryana, India
4
Department of Electrical and Electronics Engineering Educators, ASPETE—School of Pedagogical and Technological Education, 14121 N. Heraklion, Greece
5
Smart Sustainable Social Innovations Single Member P.C., 96 Dimitriou Gounari Str., 15125 Athens, Greece
6
UBITECH Energy Sprl, 367 Avenue Louise, B-1050 Brussels, Belgium
*
Authors to whom correspondence should be addressed.
Energies 2023, 16(14), 5384; https://doi.org/10.3390/en16145384
Submission received: 5 June 2023 / Revised: 6 July 2023 / Accepted: 7 July 2023 / Published: 14 July 2023
(This article belongs to the Section A2: Solar Energy and Photovoltaic Systems)

Abstract

:
When tracking the peak power point in PV systems, incremental conductance is the most common technique used. This approach preserves the first trap in the local peak power point, but it is unable to quickly keep up with the ever-changing peak power point under varying irradiance and temperature conditions. In this paper, the authors propose a hybrid algorithm, combining an artificial ecosystem optimizer and an incremental-conductance-based MPPT to solve these issues of traditional MPPT under varying irradiance and temperature conditions. The proposed hybrid algorithm has been applied to three scenarios, namely the constant irradiance condition, the varying irradiance condition, and the varying temperature condition. Under the constant irradiance condition, the PV array is maintained at a temperature of 25 °C and an irradiance of 1000 W / m 2 . The voltage of the DC link of the neutral-pointed-clamped inverter is maintained at 1000 V. Under the varying irradiance condition, the irradiance of the PV array is increased from 400   W / m 2   to 1000 W / m 2 with a step size of 0.2 s. The same step size is maintained while decreasing the irradiance level from 1000 W / m 2 to 400 W / m 2 ,   with a step change of 0.2 s. However, the temperature is maintained at 25 °C. Under the varying temperature condition, the temperature of the PV array varies from 35 °C, 25 °C, 15 °C, 10 °C, 15 °C, 25 °C, and 35 °C with a step size of 0.2 s, and the irradiance is maintained at 1000   W / m 2 . The DC link voltage in all three conditions is maintained at 1000 V, which confirms that the hybrid algorithm has been able to vary the duty cycle of the pulse wave modulation generator in such a manner that the variable DC voltage produced by the PV array has been changed by the flyback converter into a stable DC voltage. The simulation results show that the total harmonic distortion (THD) under all the simulated scenarios is within 5%, which agrees with IEEE standards. In the future, this algorithm may be compared with other types of available MPPTs under partial shading.

1. Introduction

The increasing global population, as well as the demand for energy, has prompted the world to give widespread attention to solar energy as it is a renewable source of energy that is easily available everywhere. Photovoltaic cells are being used to harness solar energy, but their output is low. PV arrays are formed by connecting PV modules in series or in parallel to meet the load requirements. The PV array output changes continuously if there is any environmental change; thus, load characteristics need to be adjusted to track the maximum peak power point on an IV and PV curve. This real-time adjustment is called MPPT [1,2]. MPPT techniques can be either traditional techniques or intelligent techniques (algorithms). Traditional MPPTs were less complex and had independent working mechanisms, but for the partial shading conditions, their efficiency was not enough to be used further. To overcome such issues, intelligent MPPT techniques were verified by experiments that were effective to a large extent but were more complex and had a slow convergence speed. The PV curve is a nonlinear curve, with partial shading that results in the formation of various local peaks (LP) and a global peak (GP) amongst them. Most of the maximum power point tracking technologies are unable to track the GP during PS conditions. Firefly [3,4], flower pollination [5], particle swarm optimization (PSO) [6,7], improved PSO [8,9], ant colony [10,11], Cuckoo search [12], the sensor-less artificial vision algorithm [13], the improved rat swarm optimizer algorithm [14], and whale optimization [15] are all bio-inspired soft computing/optimization algorithms that are used to locate the GP. Although the GP moves in space and time as the shading pattern (SP) varies, research has confirmed that optimization approaches could generally follow it [16].These optimization algorithms have proven to be efficient in tracking the MPP during normal circumstances, but during PS, the process becomes complex, as it involves many iterations and is not suitable for dynamic environments individually. In [17], the implementation of a single-phase PV inverter model and its performance were first investigated for the movement of real and reactive power of a PV system after it was connected to the grid. A standard step-up DC–DC converter cannot deliver the required control in a grid-linked solar PV array if a load with batteries is not placed in the grid-linked PV system [18]. Due to the DC–DC step-up converter’s failure to keep a steady voltage, the control of the grid-linked solar PV array suffers. The converter works in both directions, increasing and decreasing the voltage. New techniques are being developed to support the continuous optimization of grid-connected and off-grid hybrid PV systems. The amplification of the duty cycle is used to control the system voltage and current [19]. All MPPT techniques work towards setting up an optimal duty cycle for the boost converter so that the voltage generated by the PV array can be boosted to the required level; this is to achieve the maximum power output, maintain a fast, steady output with controlled harmonics, and maintain efficient grid connectivity, even during dynamic environmental changes. The authors propose a hybrid technique based on the combination of an artificial ecosystem optimizer [20] and an incremental-conductance [21] MPPT (HAEOINC). The paper has been organized as follows: Section 2 describes the grid-linked PV scheme design with a hybrid artificial ecosystem optimizer and incremental-conductance MPPT. In Section 3, the MATLAB results of the hybrid artificial ecosystem optimizer and incremental-conductance MPPT for the PV-connected grid system with constant irradiance, varying irradiance conditions, and varying temperature are presented. In Section 4, remarks are provided with a conclusion.

2. Hybrid Artificial Ecosystem Optimizer (AEO) and Incremental-Conductance (HAEONIC) MPPT-Controlled PV-Integrated Grid System

The proposed hybrid AEO and incremental-conductance MPPT-controlled PV-integrated grid system is shown below in Figure 1. It consists of a solar PV array, a flyback converter, a three-phase neutral-point-clamped inverter, a filter inductor, a load, and a grid system. A hybrid artificial ecosystem and an incremental-conductance-based MPPT algorithm control the flyback converter. The three-phase inverter is controlled by feed forward decoupling control.
A brief about the various components is given below.

2.1. PV Array

Equation (1) given below is the mathematical representation for the (I–V) characteristics of photovoltaic (PV) cells under different irradiation conditions.
I P V = I S C × 1 A 1 × e V P V A 2 × V o c 1
where I p v   = output current of PV array; I s c   = short-circuit current; A 1   and   A 2 = quality parameters given by Equations (2) and (3) below, which depend on temperature and irradiance; V p v   = input voltage; and V o c = open-circuit voltage.
A 1 = 1 I M P I S C × e V M P A 2 × V O C
A 2 = V M P V O C 1 ln 1 I M P I S C
where A1 = dependent on the quality of PV and decreases as the I M P I S C ratio decreases; I M P   = current produced by the PV array at maximum power point (MPP); SC = the PV cell’s short-circuit current, referred to as the current generated when there is no voltage applied across the cell or module; VMP= the voltage at MPP; V O C   = the open-circuit voltage; and A2 = a parameter which depends on the properties of the Solar cell. A2 increases as the I M P / I S C ratio increases and V M P approaches V O C . The parameter A 2 is essentially a measure of the curvature of the PV array or module, and I is essentially a measure of the curvature of I–V curve of the PV array or module. It is critical in determining the array or module’s efficiency and performance.
Irradiance and temperature are the two factors that influence the parameters VMP, IMP, VOC, and ISC for the PV panel.
I S C G , T C = I S C S × G G S × 1 + δ × T C T S I M P G , T C = I M P S × G G S × 1 + δ × T C T S
I S C S   is the short-circuit current of the PV module for standard test conditions (STC), which are defined as 1.5 air mass, cell temperature at 25 °C, and irradiance at 1000 W / m 2 . The impact of T C   and   G   on   I S C and   I M P can be mathematically fitted using Equation (4). GS is the reference irradiance (1000   W / m 2 ), and T C is the temperature constant of short-circuit current, which measures how much the current decreases as the temperature rises. T S is the reference temperature (25 °C). IMP (G, TC) is the generated (MPP) current by the PV unit under given temperature and irradiance conditions. IMP is the current at MPP. Under standard test conditions, the open circuit voltage V o c at a given temperature is given by.
V O C T C = V O C S + ε × T C T S V M P T C = V M P S + ε × T C T S
  • VOC( T c ) = open-circuit voltage of the PV module for a given temperature;
  • VOCS = open-circuit voltage during STC;
  • ε = temperature constant of the open-circuit voltage used to measure the variation in voltage;
  • VMPS = voltage at MPP under STC.

2.2. Hybrid AEO and Incremental-Conductance MPPT

The output of a PV array depends on environmental conditions like irradiance and temperature. Therefore, PV should operate at peak power point, even for changing environmental conditions. To achieve this, the PV array is supported by a peak power tracker. To optimize power output, the authors propose using a novel MPPT algorithm that combines AEO and incremental conductance. A brief about AEO and INC MPPT is given in the subsection below.

2.2.1. Artificial Ecosystem Optimization

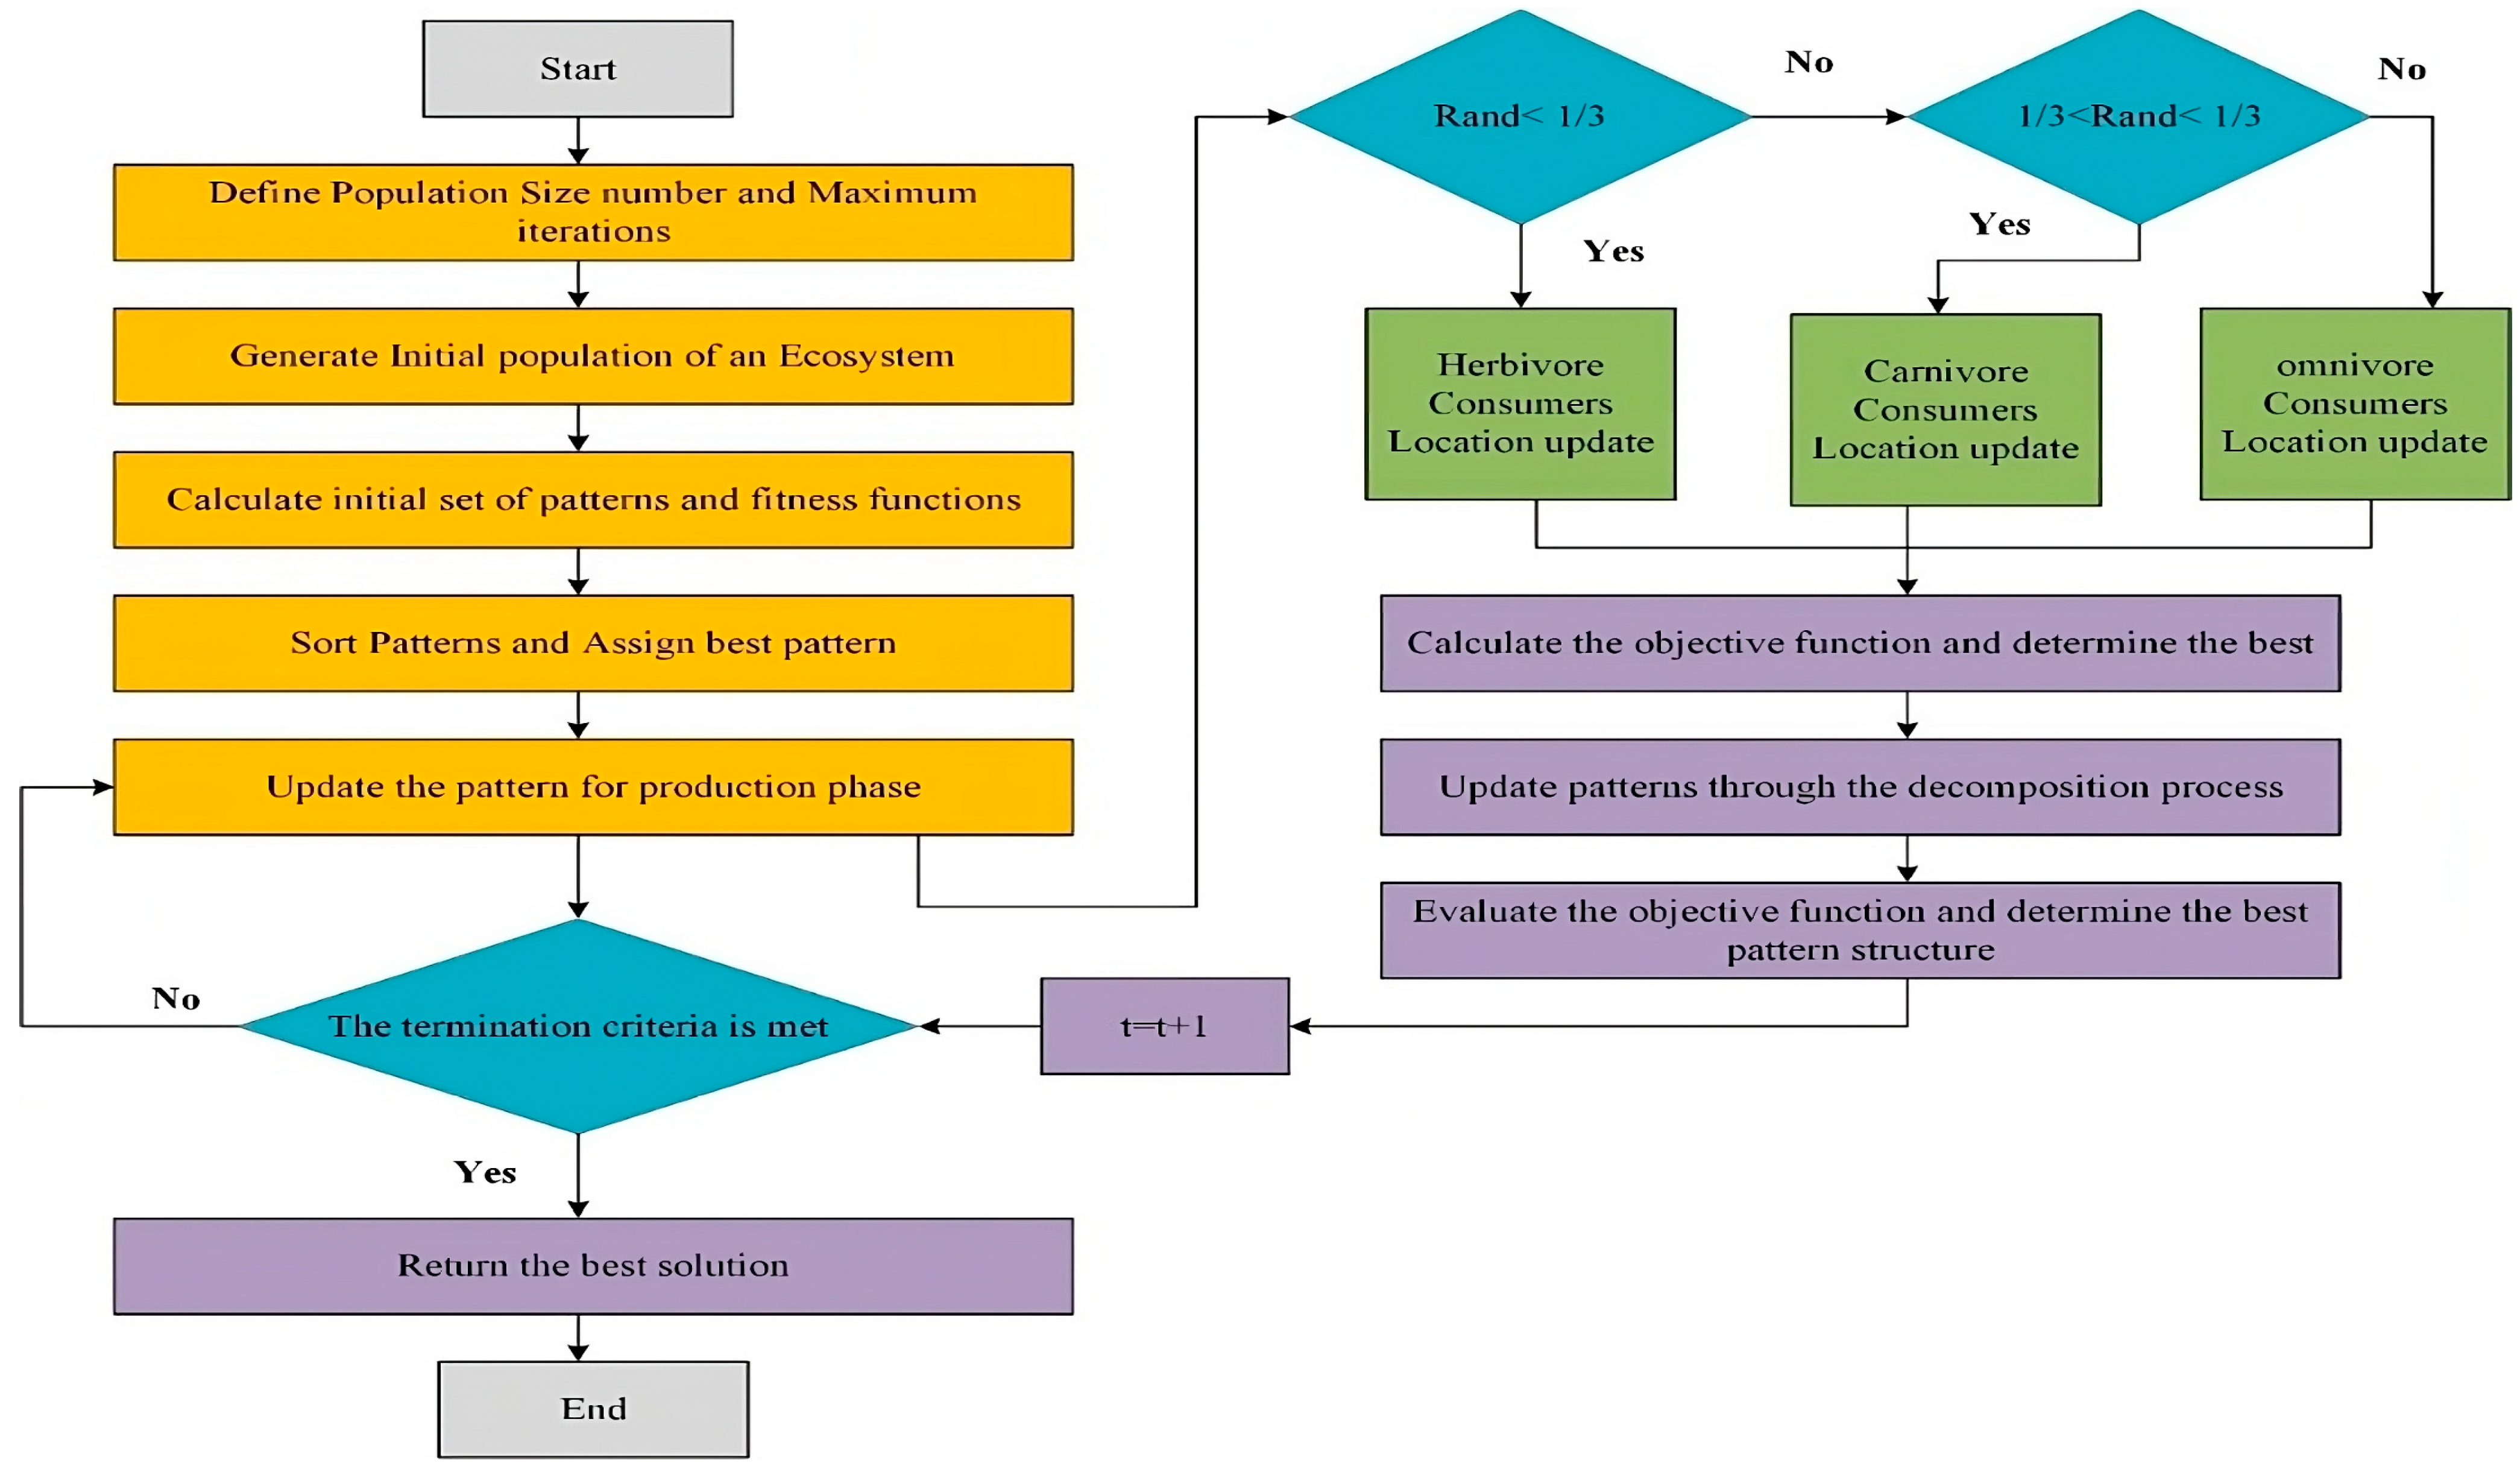
This optimization method based on a synthetic ecosystem has three operators, production, consumption, and decomposition, corresponding to three main species categories: producers, consumers, and decomposers. For the first operator, increasing the exploration-to-exploitation ratio is of paramount importance. The second operator enhances the exploratory capabilities of the algorithm, and the employment of the third operator approach is to find the best solution. The flowchart of AEO optimization is illustrated in Figure 2. Most of the population comprises consumers, who can be carnivores, herbivores, or omnivores. Using AEO, generating a new person to replace the present one might be either the best person ( x n ) or a person generated at random from the search space ( x r a n d ). The mathematical production of an operator can be modeled as the following:
x 1 t + 1 = 1 a x n t + a x r a n d t
a = 1 t T r 1
x r a n d = r U L + L
where r 1 is an arbitrary integer between 0 and 1; r is an arbitrary vector between 0 and 1; ‘a’ represents direct weight constant; and x r a n d is a randomly generated distinct location in the exploration space; T is the maximum number of repetitions; and L and U are the lowest and utmost bounds, respectively.
All consumers may conduct the consumption operator once the producer completes the production operator. A Levy-flight-like operator that mimics the foraging behavior of several animals is one of the algorithms inspired by nature to improve their optimization efficiency. Mathematically, it is represented by the equations given below.
C = 1 2 v a v b
V a ~ N 0 , 1 ,   V b ~ N 0 , 1
C” is the consumption factor, and V a and V b are two standard variables. The standard distribution N (0,1) has a mean of 0 and a standard deviation 1. A consumer can be the following:
  • Herbivore: A consumer will only eat the producer if it is a randomly selected herbivore. Equation (17) represents the herbivore eating pattern.
x i t + 1 = x i t + C . x i t x 1 t ,   i 2 , n
  • Carnivore: If a consumer is nominated randomly to be a carnivore, it can only arbitrarily eat a consumer who has a greater power level. Equation (12) represents the eating pattern of a carnivore.
x i t + 1 = x i t + C . x i t x j t ,   i 3 , n
j = r a n d i 2   i 1
  • Omnivore: If a consumer is arbitrarily selected as an omnivore, it may devour both producers and consumers with a greater power level. Equation (14) is the precise equivalence that describes the eating pattern of an omnivore.
x i t + 1 = x i t + C . ( r 2 x i t x 1 t , + 1 r 2 x i t x 1 j t ,   i 3 , n
j = r a n d i 2   i 1
For an ecosystem to function correctly, decomposition is a crucial process. Decomposition behavior is characterized by the weight coefficients e and h as well as the decomposition factor D. By adjusting both e and h, it is possible to approximate the location of the decomposer x n in relation to the i t h individual x i within the population. The behavior of the process is determined using the following equations.
x i t + 1 = x n t + D . e . x n t h . x i t i = 1 , n
D = 3 u ,   u ~ N 0 , 1
e = r 3 . r a n d i 1   2 1
  h = 2 . r 3 1

2.2.2. Incremental-Conductance MPPT

In this method, the controller can anticipate the effects of a voltage change by keeping track of minute fluctuations in current and voltage. The direction of the change in power with respect to the voltage can be calculated using Equation (6).
d p d v = V d l d v + I v
where ( d p / d v )   = differential power change with respect to voltage,   ( d l / d v ) = differential current change with respect to voltage, P = output power, V = output voltage and I v = output current as a function of voltage.
The flowchart for incremental-conductance MPPT is given in Figure 3.

2.3. Modeling of Flyback Converter and NPC

The combination of a flyback converter and neutral-point-clamped (NPC) inverter provides a reliable and highly efficient solution for converting the DC power generated by a PV array into AC power suitable for feeding into the utility grid. The NPC inverter produces high-quality output waveforms with minimal harmonic distortion, while the flyback converter provides voltage regulation and isolation.
The output of the flyback converter is given in Equation (21) and can be used as the input to the NPC inverter.
V o = ( DN V i n ) / ( 1 D )
The duty cycle of the switch (D) and the turns ratio of the transformer (N) are parameters used in the flyback converter to convert the input voltage ( V i n ) to the output voltage ( V o ). By adjusting the switch’s duty cycle, the output voltage of the flyback converter is varied. The NPC inverter uses the output of the flyback converter to transform the DC voltage into a three-phase AC connected to the grid. The NPC inverter’s output voltage can be written as
V o = ( V D C / 2 )   ( V D C / 2 )   3   D
The duty cycle (D) of the PWM signal utilized to govern the switches and the output voltage ( V o ) are related mathematically, as given in Equation (22). The output voltage of the NPC inverter can also be expressed as a function of the modulation index (m), as shown in Equation (23).
V o = V D C / 2   2 / 3 )     m     s i n w t
The modulation index (m), angular frequency ( w ), and time (t) are the variables. Using the peak value of the reference sinusoidal waveform ( V r e f ) and the DC voltage ( V D C ), the modulation index may be determined as follows in Equation (24).
m = V r e f / V D C / 2 s 2 / 3 )
  • The simulation of the flyback converter and NPC inverter used in the present work is shown in Figure 4.

2.4. Power-Decoupling Control for Grid-Connected Three-Phase Solar Inverters

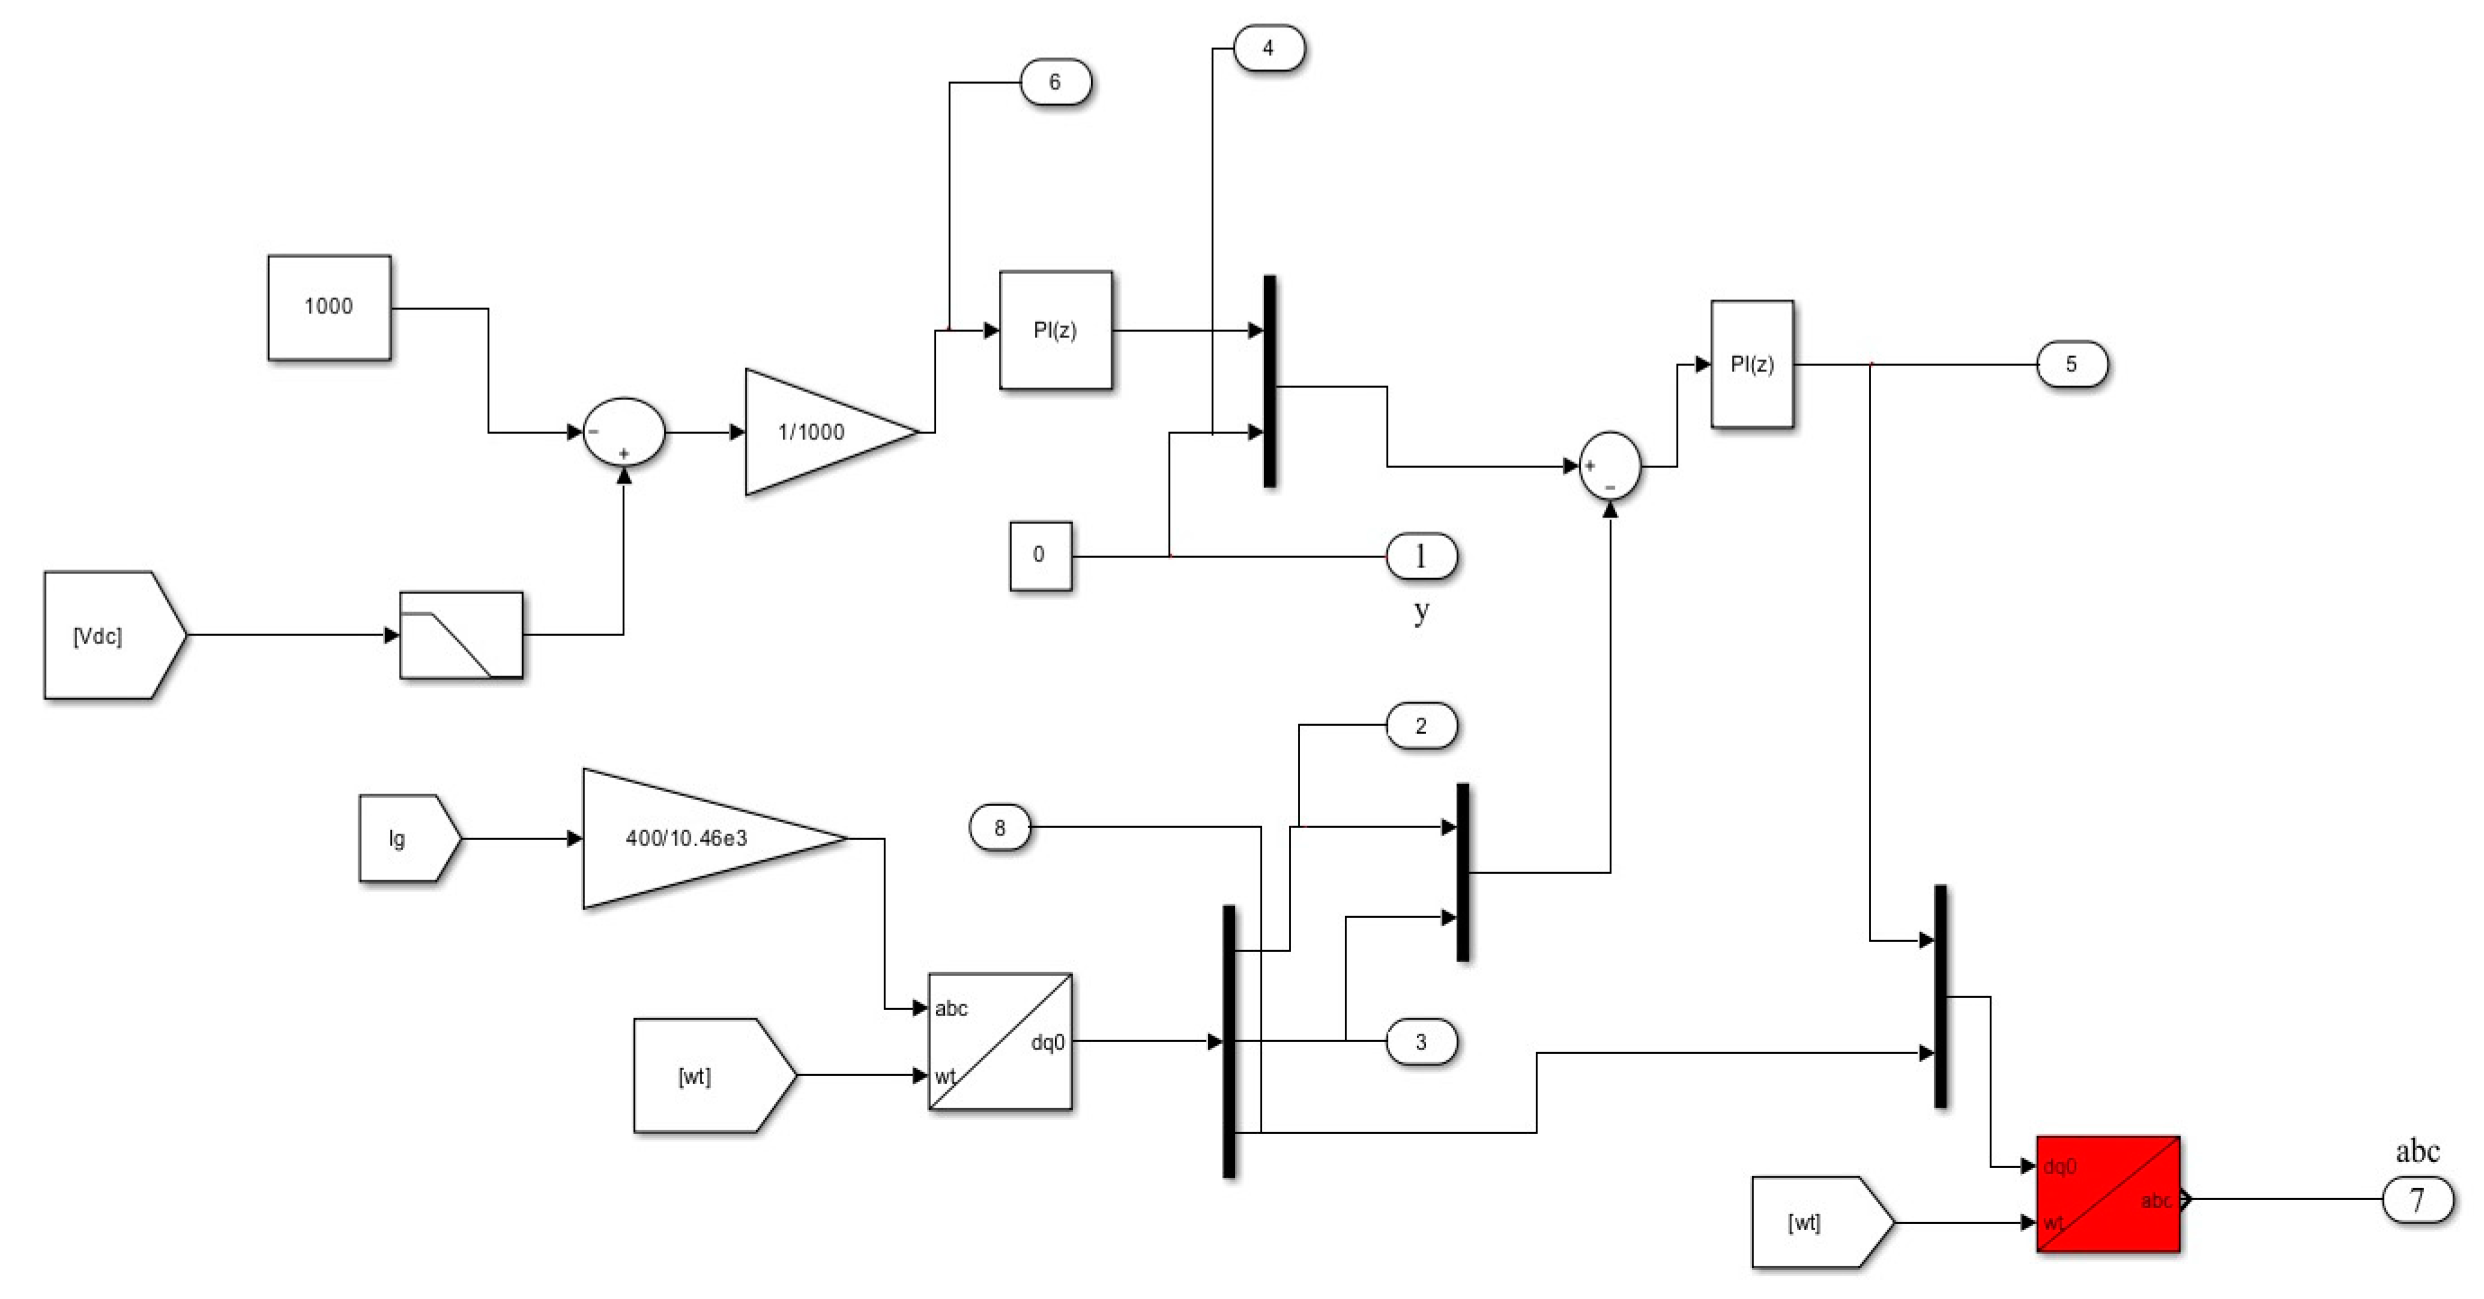
Controlled active and reactive power is used to maintain the regulation of electricity. The implemented control strategy is illustrated below in Figure 5 using the Simulink model.

3. Simulation of Hybrid Artificial Ecosystem Optimizer and Incremental-Conductance MPPT

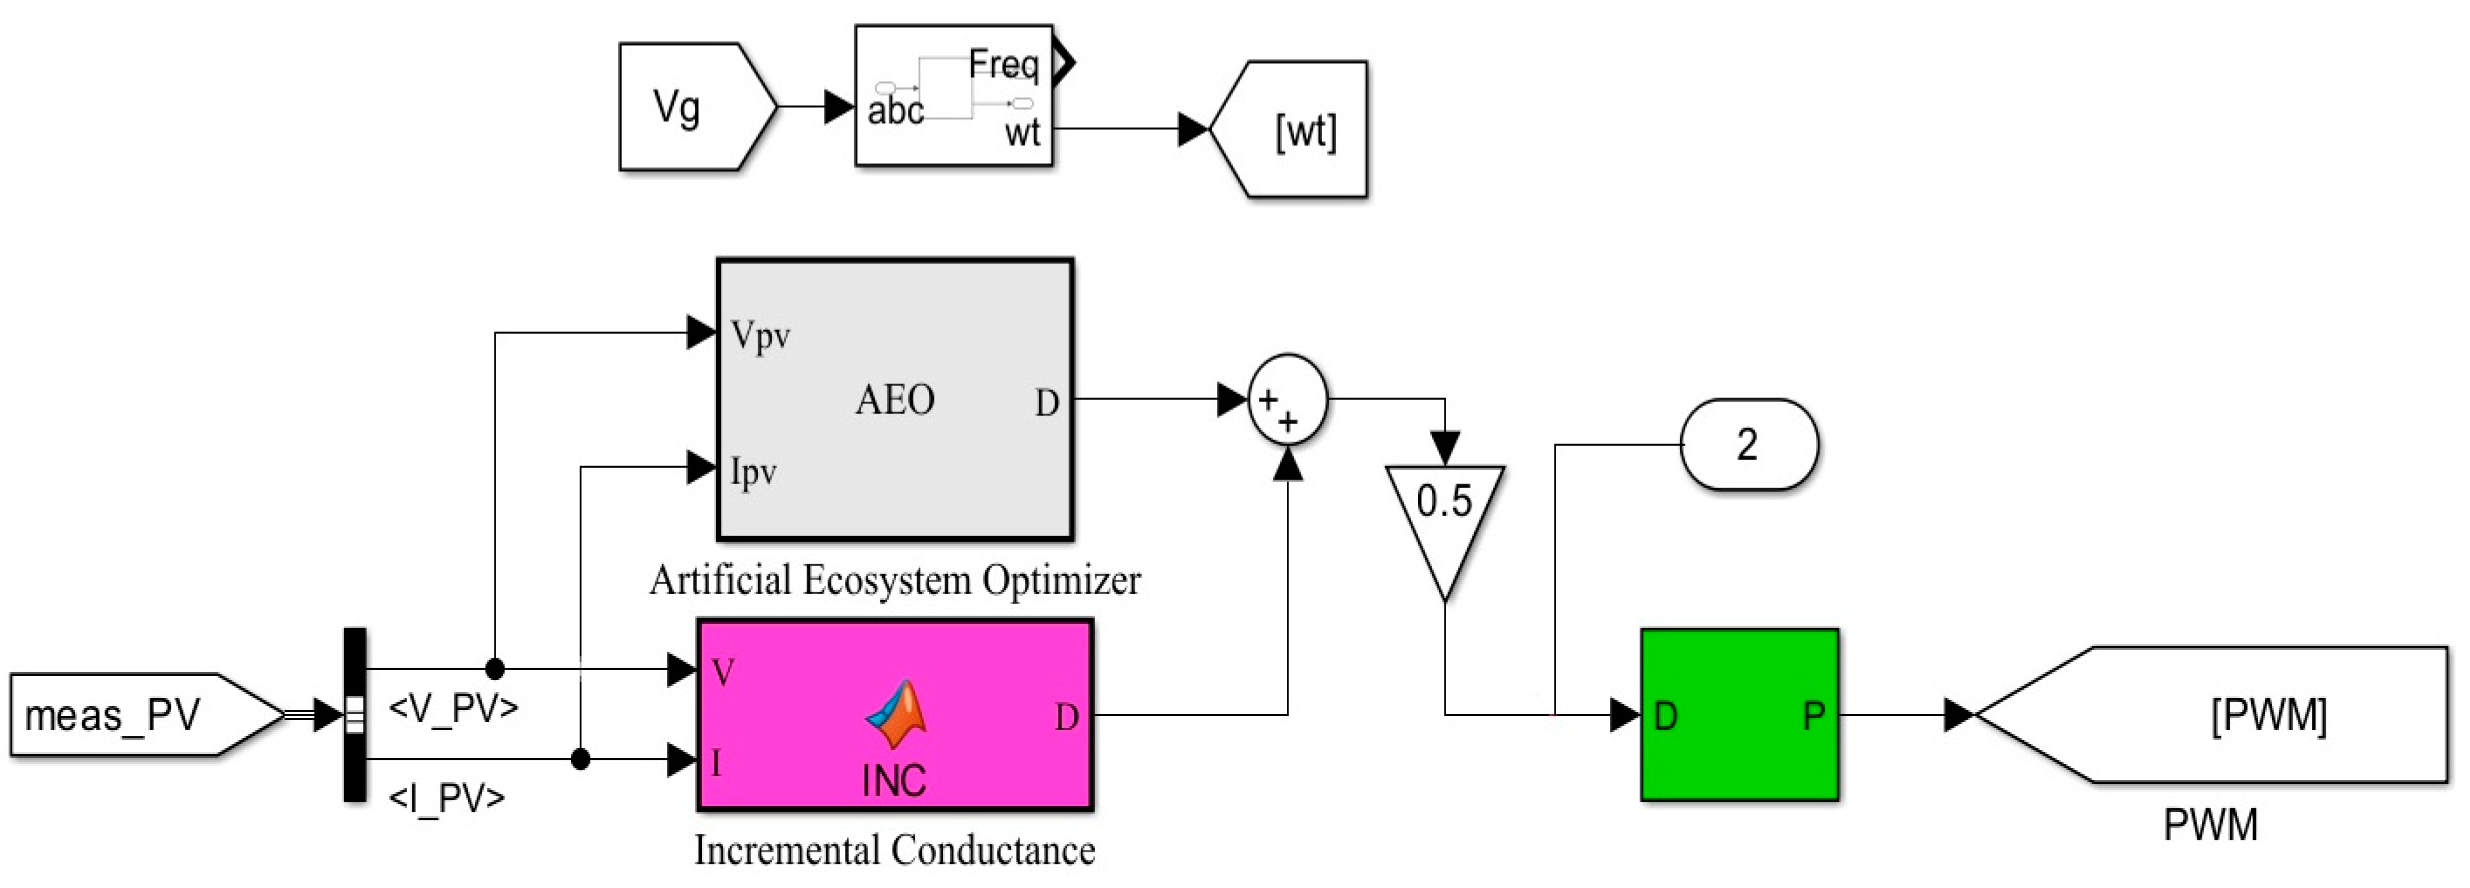
The main problems associated with traditional MPPT, like the INC algorithm, are the fluctuations at MPP and the trap at the local peak point (LPP) under the non uniform irradiance conditions. Again, the performance of optimization-algorithm-based MPPT for tracking the peak point in the IV curve is slow and complex for partial shading requirements. The proposed hybrid MPPT technique is a computational technique with the advantages of both algorithms mentioned above. The proposed algorithm exploits the global search capability of the AEO algorithm and the good local search capability of the INC algorithm. The proposed hybrid technique works in two stages. In the first stage, INC performs efficiently for uniform conditions with less convergence and oscillations at MPP, depending on the step size. MPP tracking becomes easier with a more significant step size, but the oscillations are high, contrary to smaller steps. The AEO algorithm is implemented in the second stage to find the GMPP and LMPP for dynamic environmental conditions. It helps to find the best solution based on the fitness assigned and compare it to the previous power output or the search space. If the power obtained is optimal, then the best fitness is assigned. Iterations are continued up to the limits until a new best solution is found or the converge criterion is met. The output of incremental-conductance MPPT and artificial ecosystem optimizer MPPT is combined and then used to regulate the PWM switch by providing the most appropriate duty cycle. The DC–DC converter extracts the peak power from the PV array using pulses generated by the PWM generator. A graphical representation of the hybrid artificial ecosystem optimizer and incremental-conductance MPPT is shown in Figure 6.
The simulation of the implemented AEOINC MPPT technique is shown in Figure 7.

4. Simulation Results and Discussions

This section presents the simulation outcome of the developed hybrid artificial ecosystem and incremental-conductance MPPT-controlled PV integrated grid system. The complete simulated prototype of the proposed PV integrated grid scheme is developed in MATLAB 2020a. The proposed model is evaluated for various operational scenarios, including the constant irradiance, the varying irradiance, and the fluctuating temperature conditions of the PV array. The simulation does not consider the relationship between irradiation and temperature.

4.1. Simulation Results for the Constant Irradiance Condition

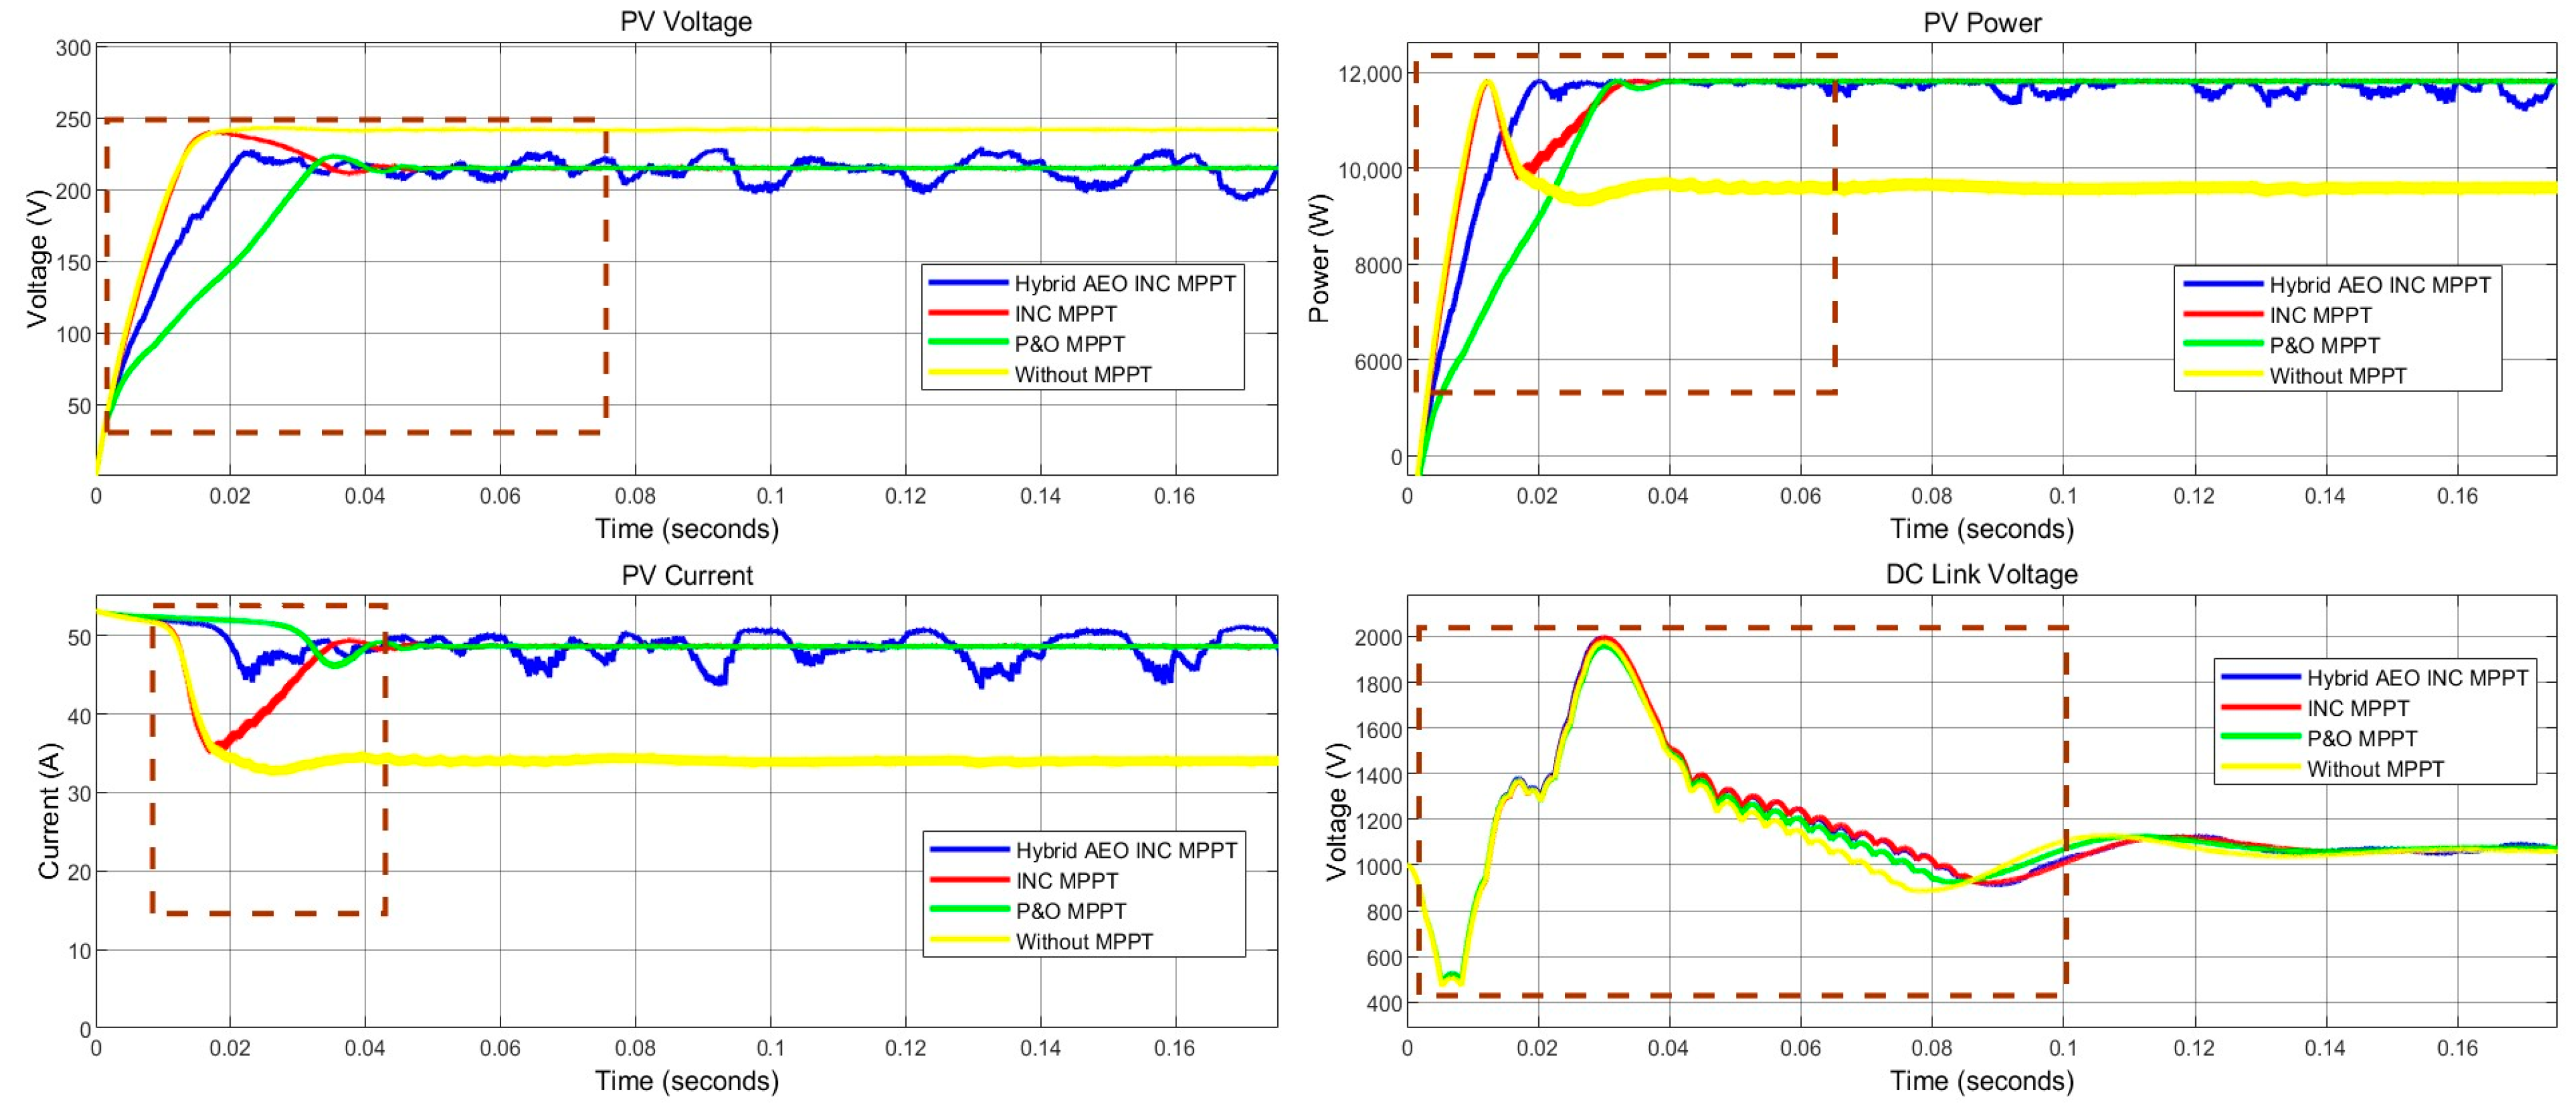
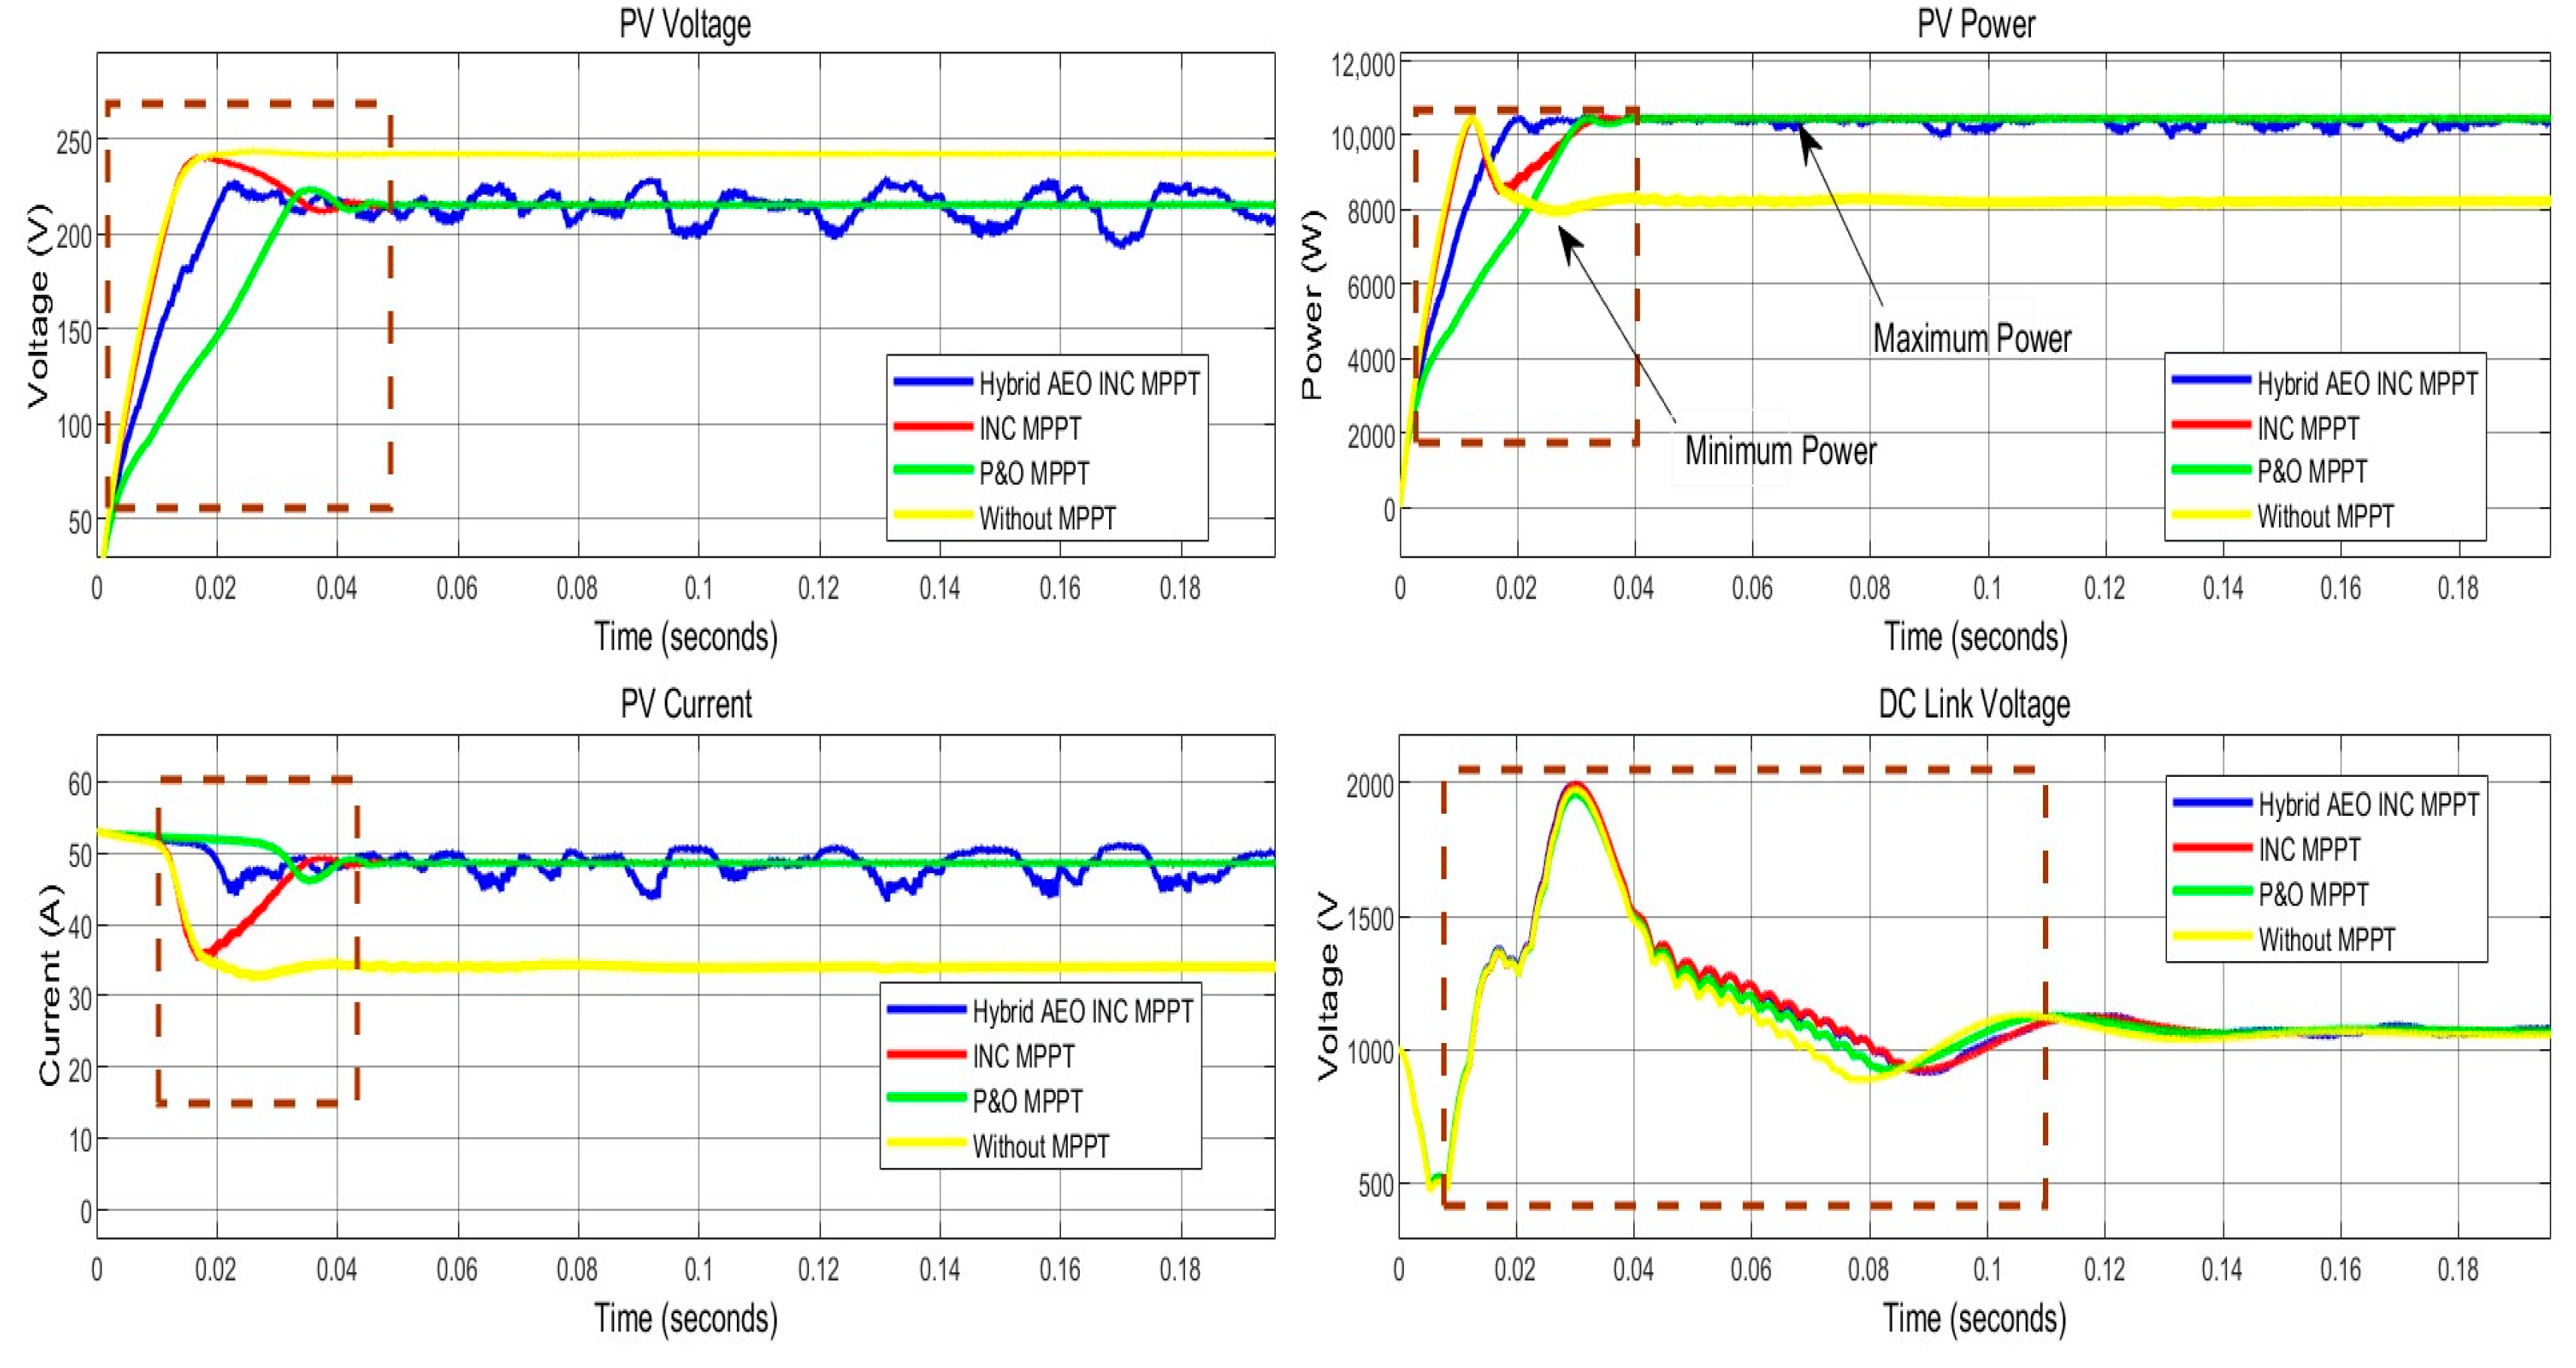
Measurements of PV voltage, PV current, PV power, and DC link voltage are taken while keeping the temperature and irradiance of the simulated PV system constant at 25 °C and 1000 W / m 2 , respectively. The graphical representation of all the measured parameters with reference to time is given in Figure 8 below. Figure 8 also illustrates the performance of the proposed MPPT, INC MPPT, P&O MPPT, and the system without MPPT.
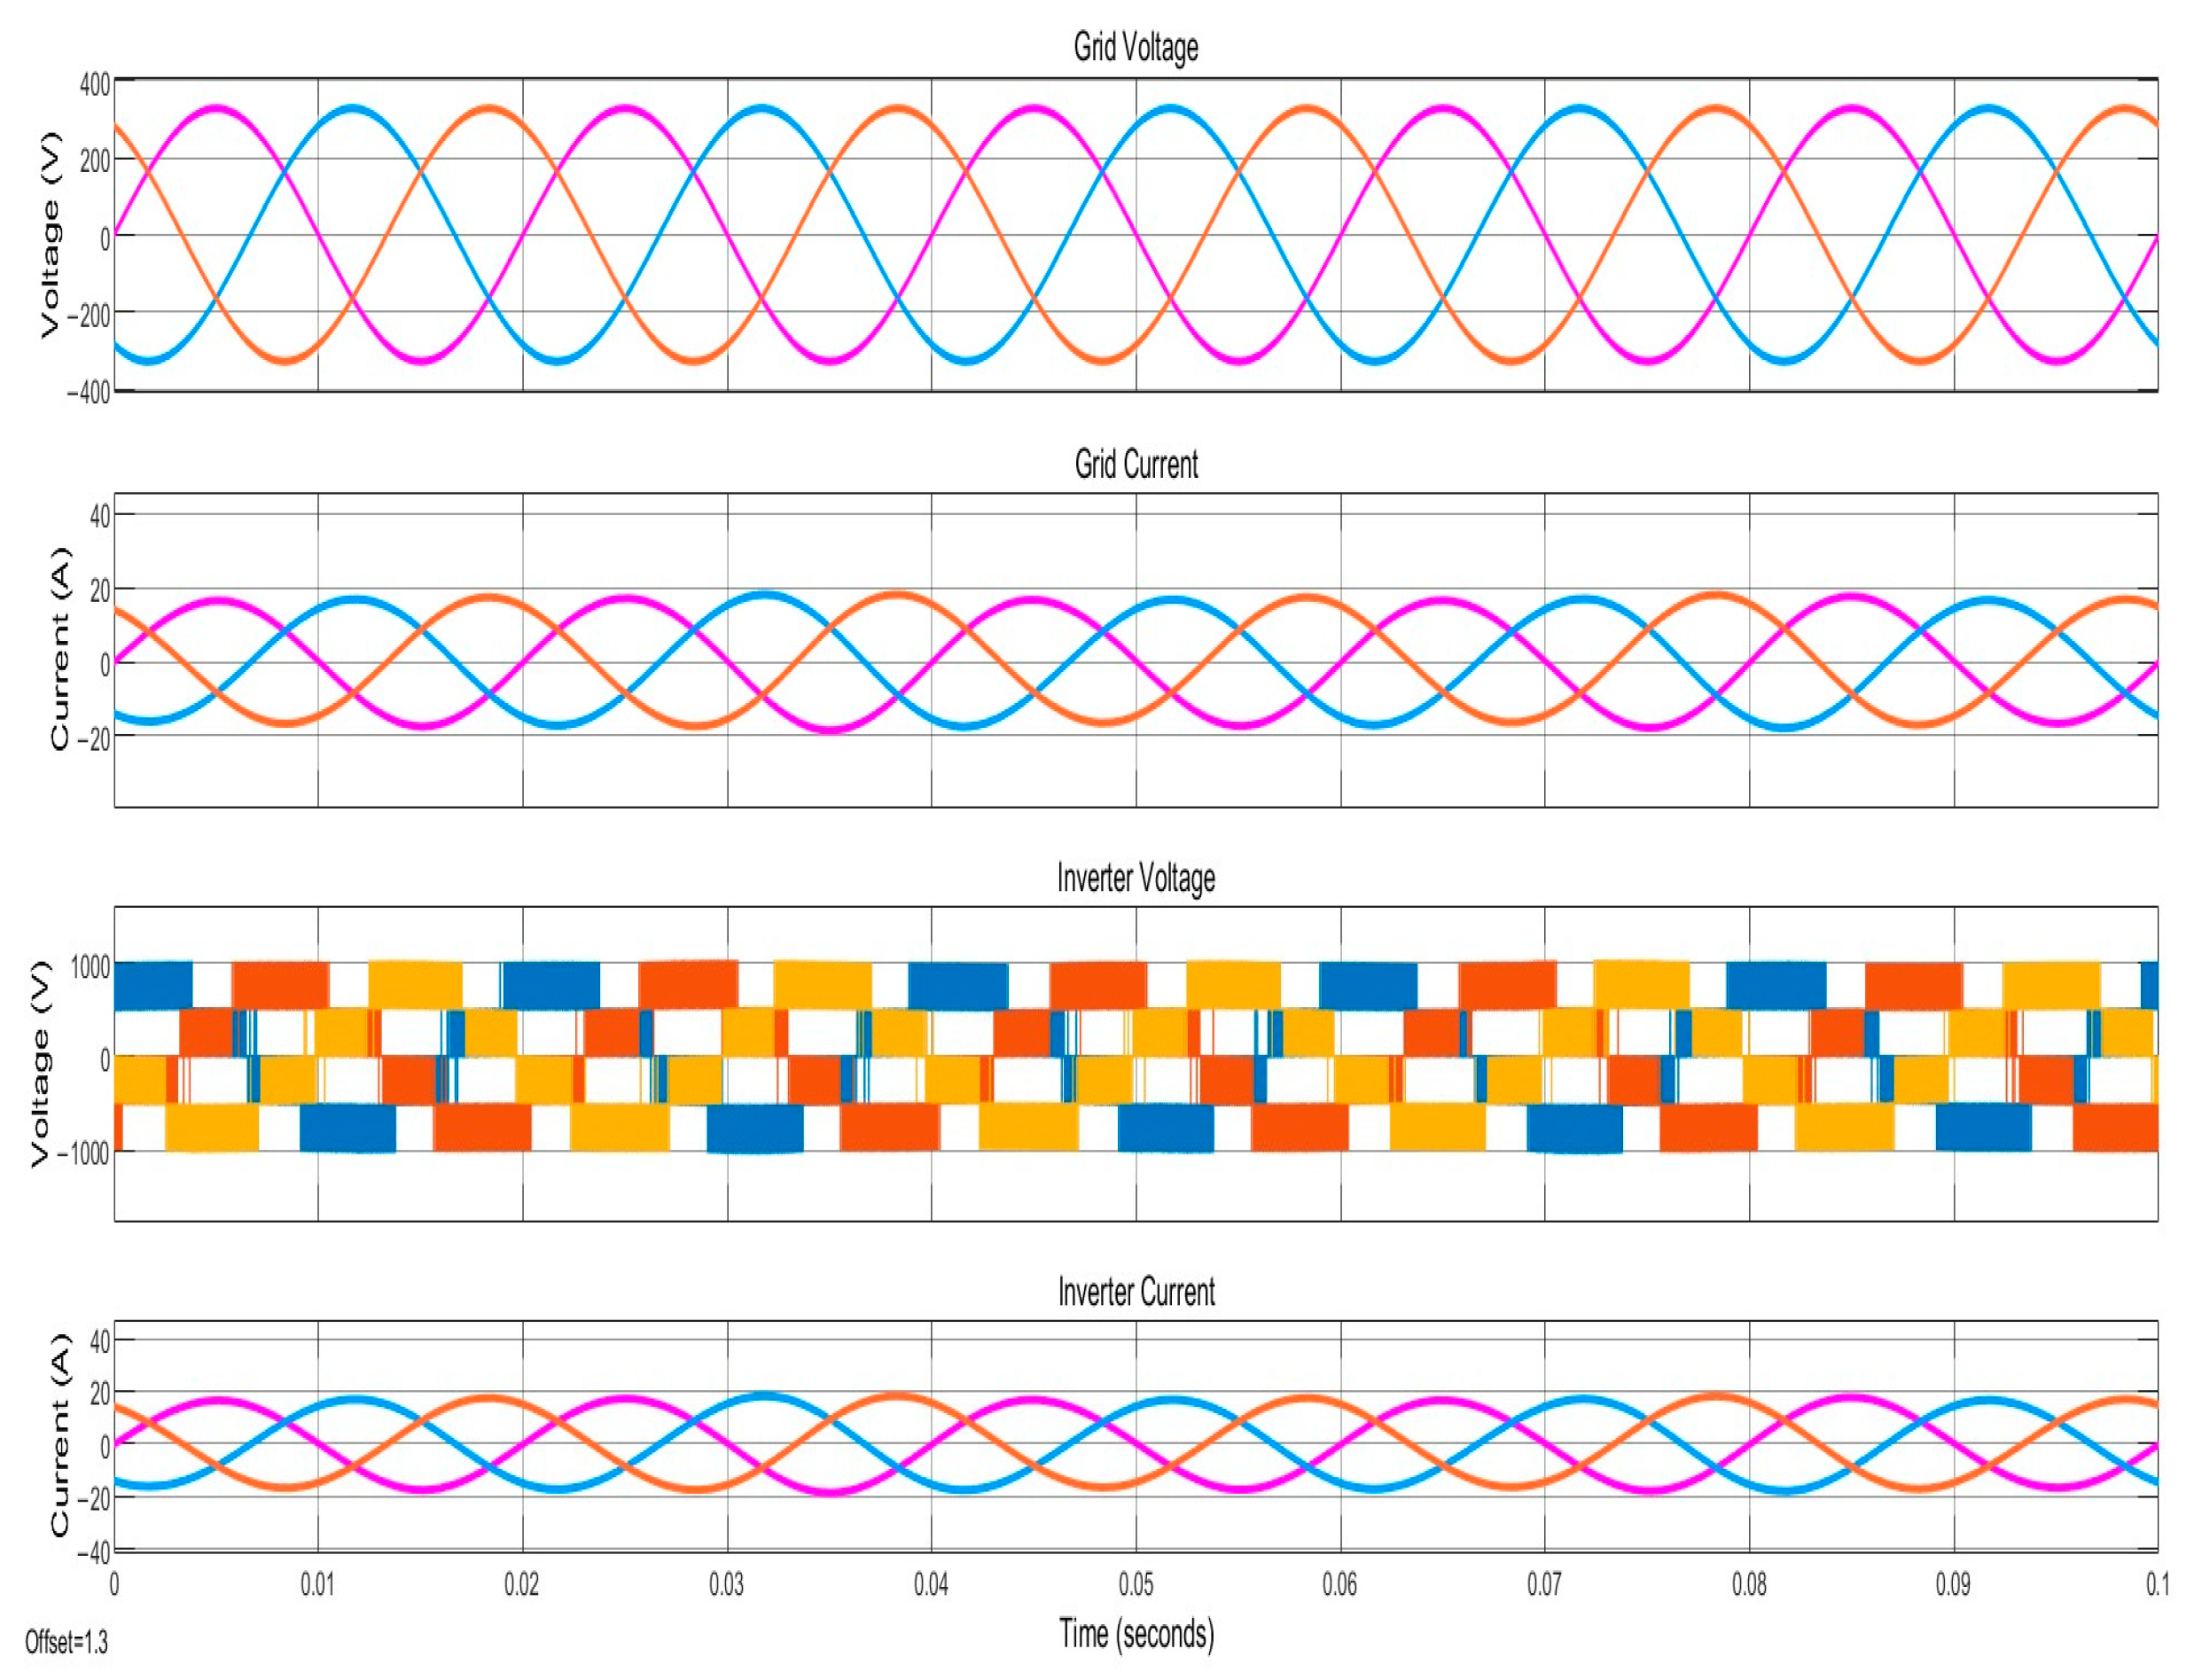
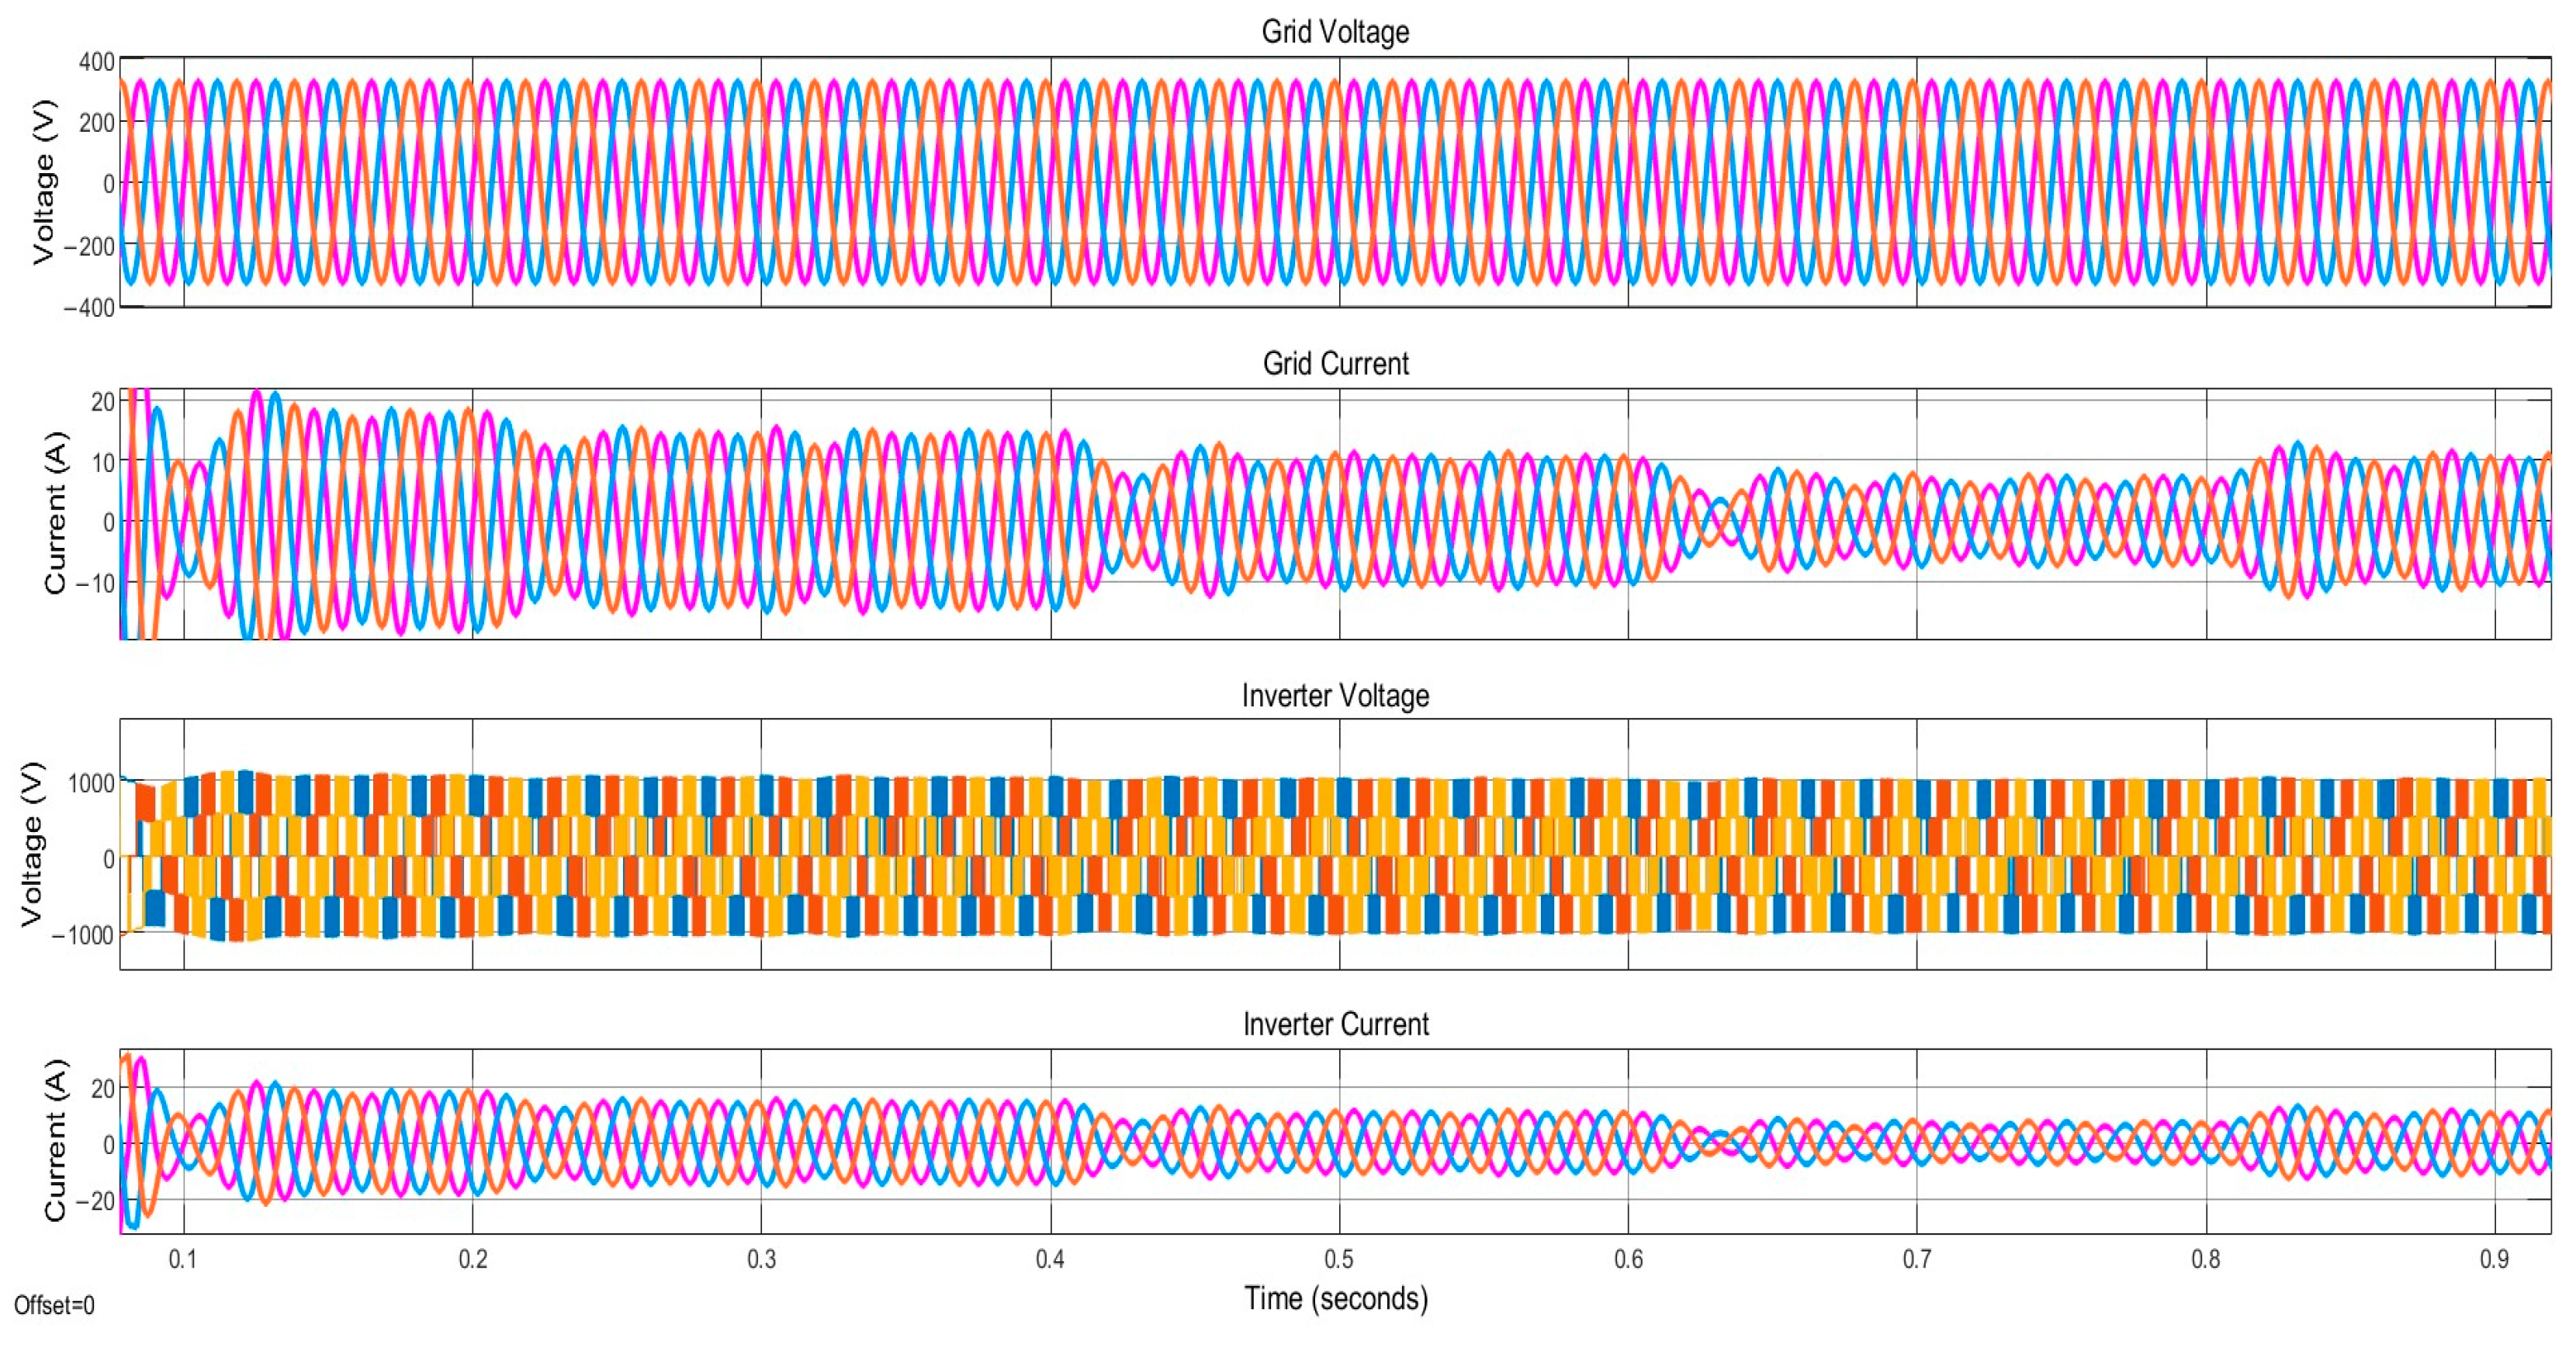
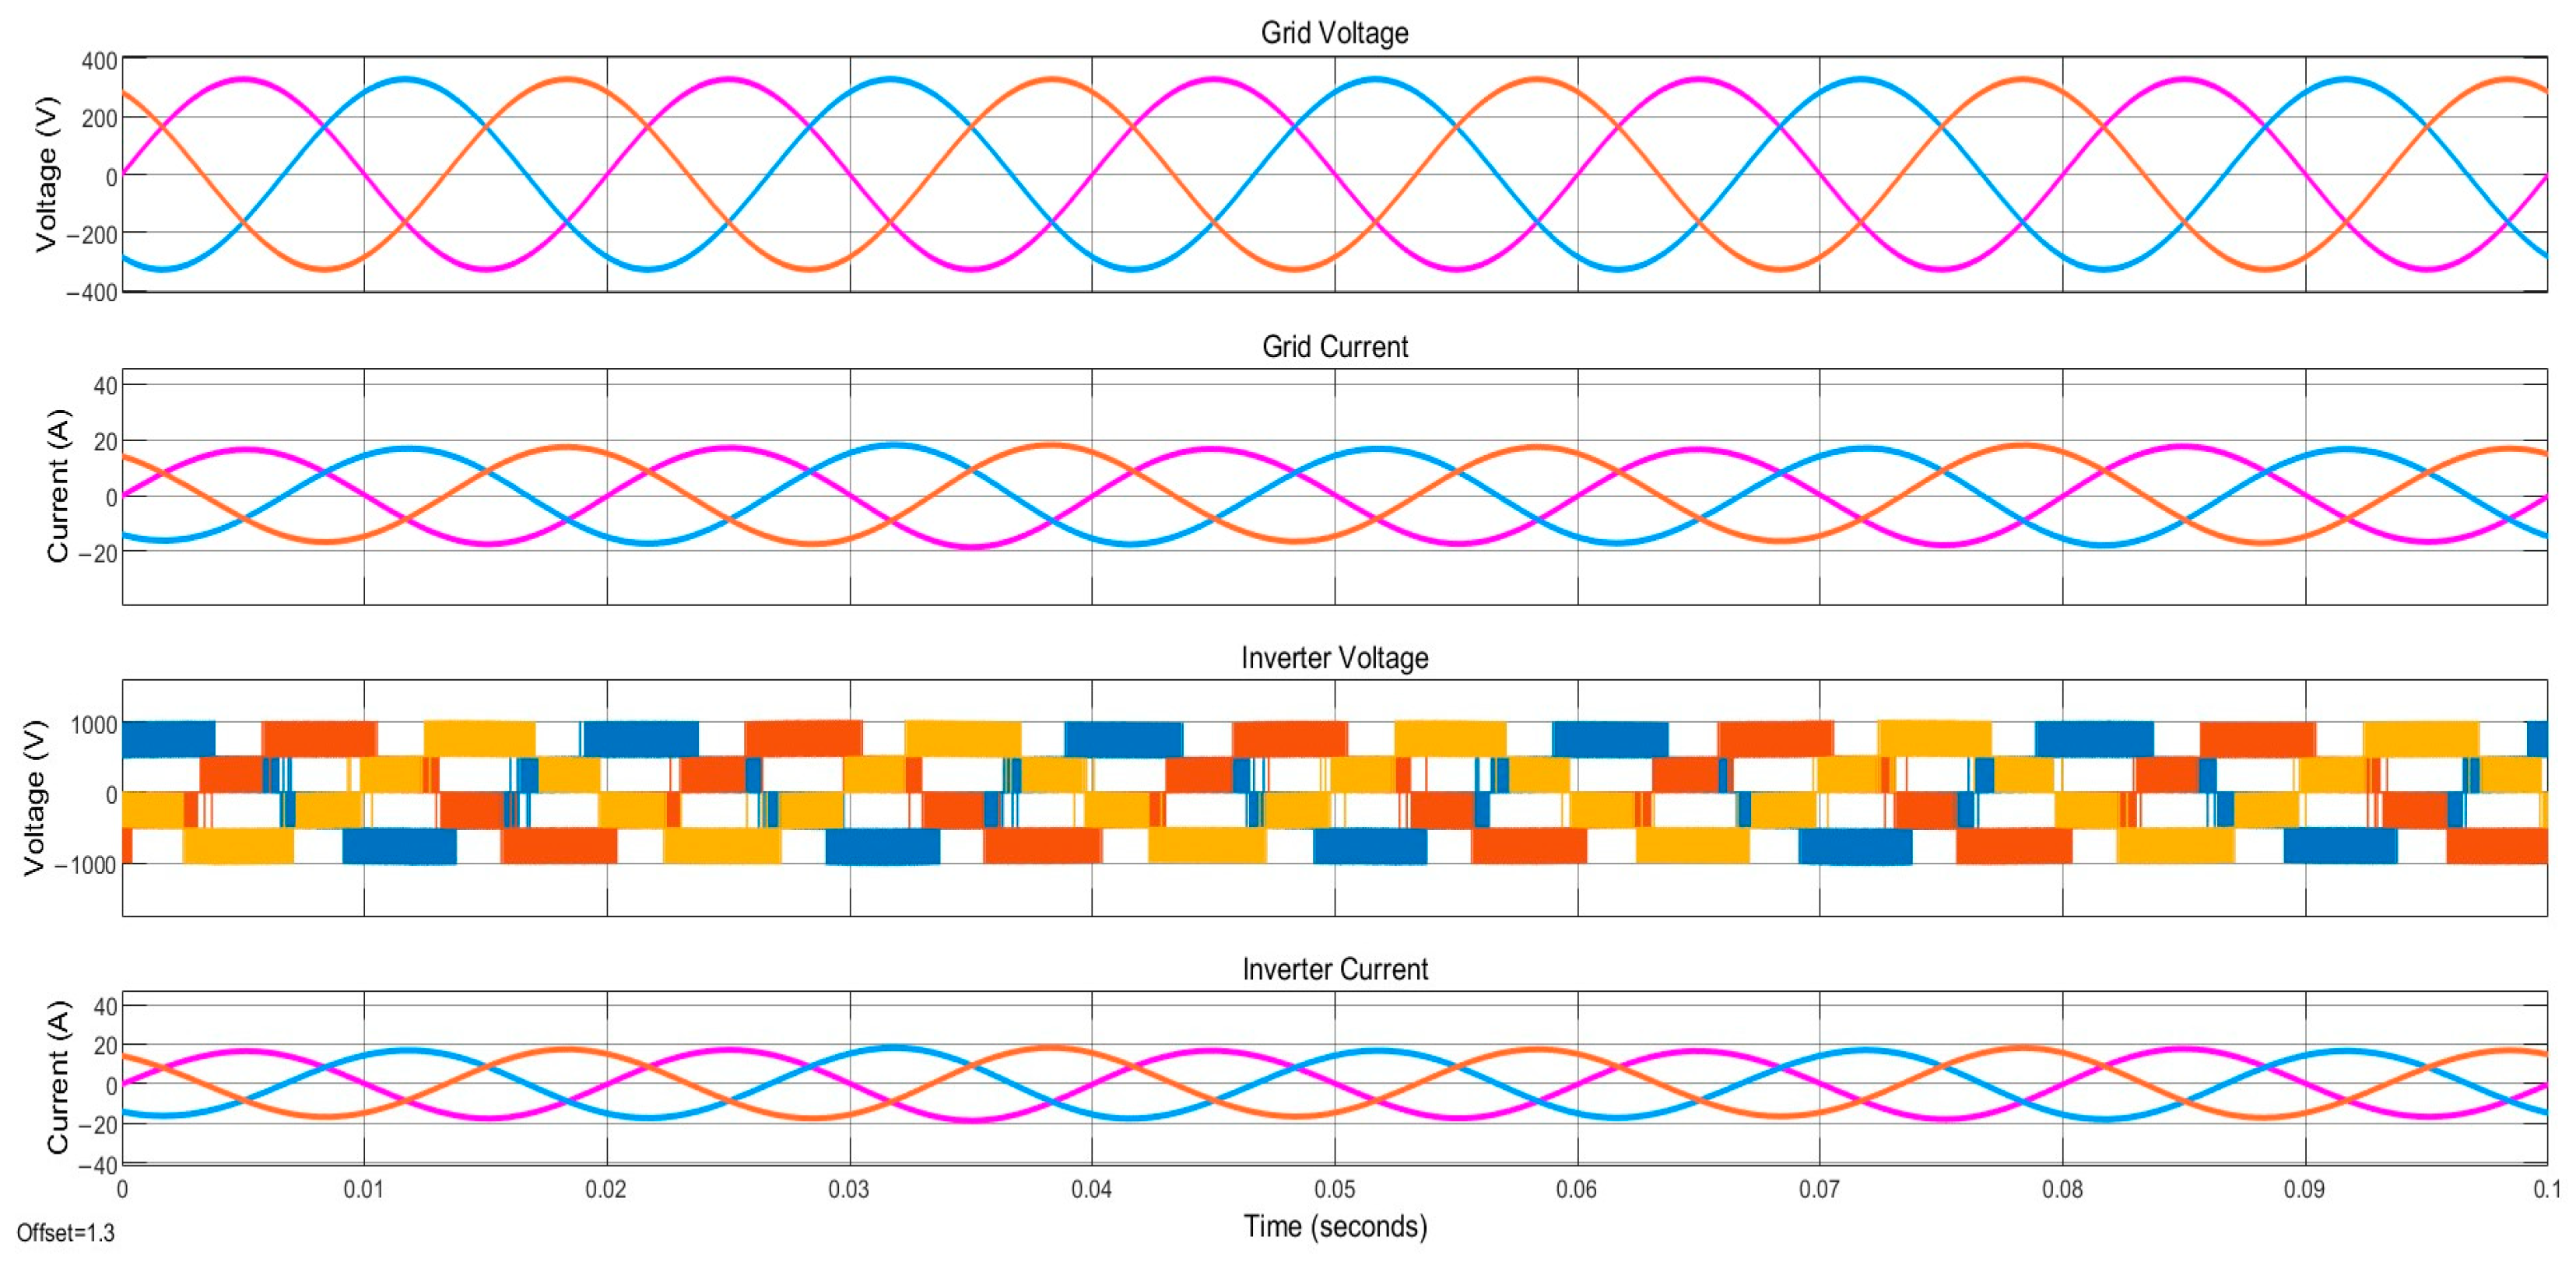
The line graph reveals that the PV voltage is maintained at 230 V, the PV current is maintained at 45.47 A, and the PV power is maintained at 10.43 kW. The voltage of the DC-link of the NPC inverter is maintained at 1000 V. Additionally, the voltage and current of the grid and inverter at 1000 W/ m 2 and 25 °C are evaluated and are depicted as line graphs in Figure 9. The grid voltage is 400 V (peak), and the grid current is maintained at 19 A (peak). The inverter voltage has a three-level output voltage, and inverter current is maintained at 20 A peak.
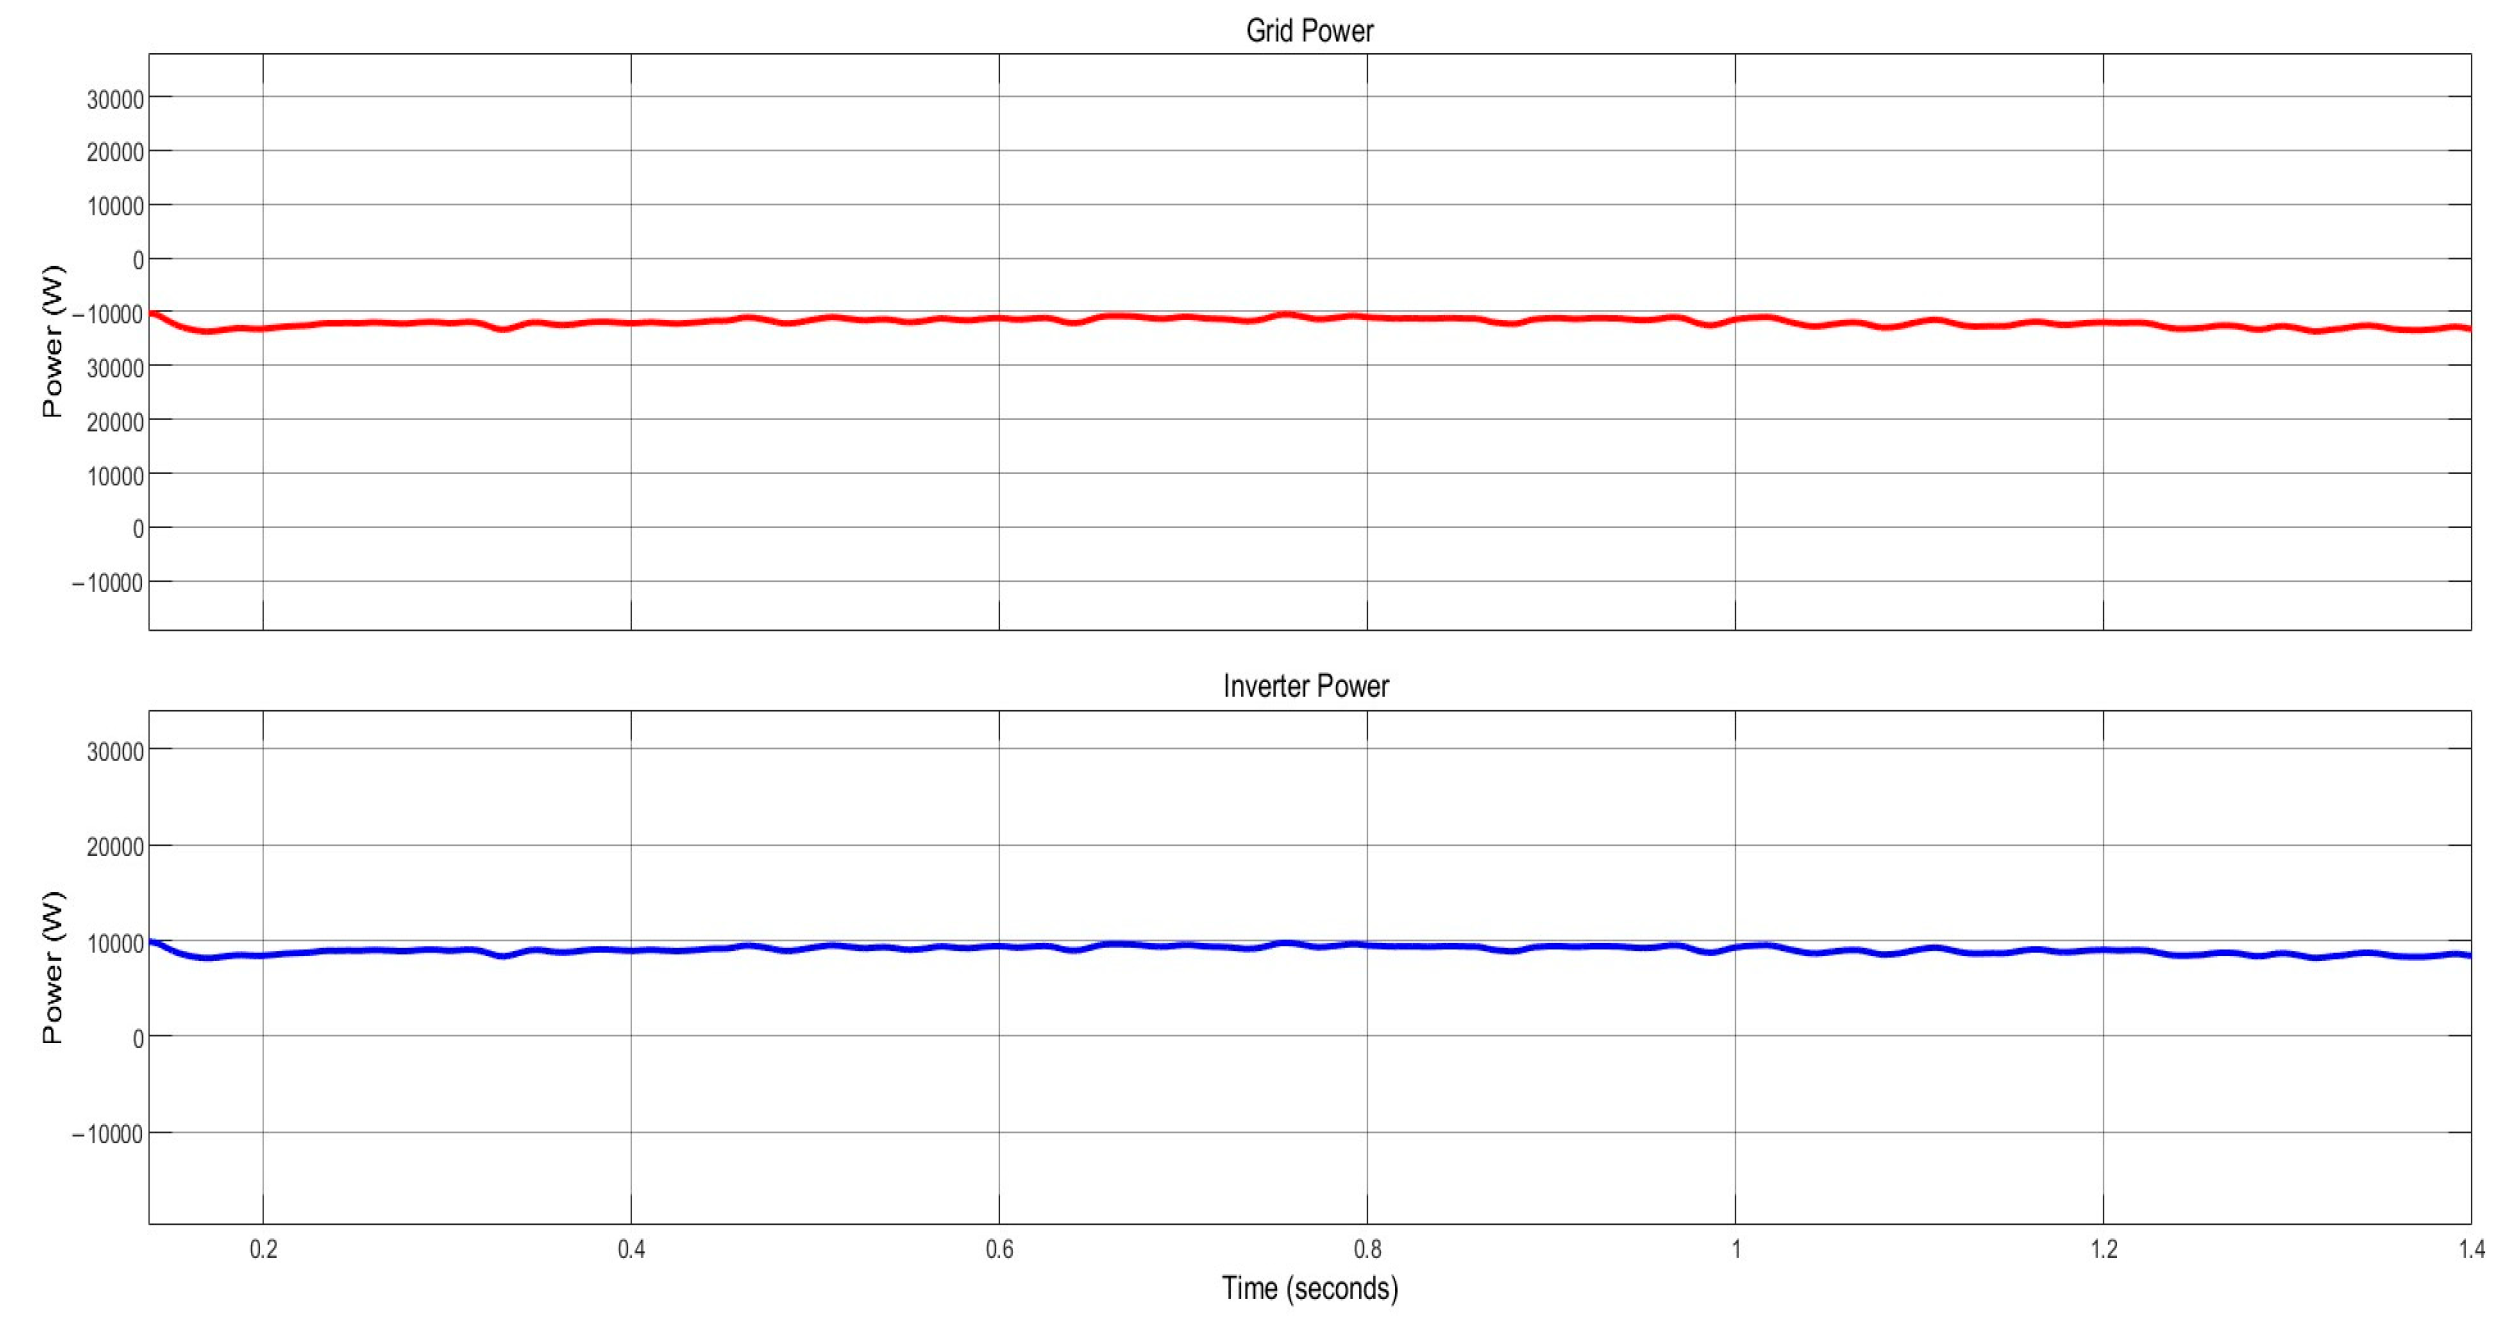
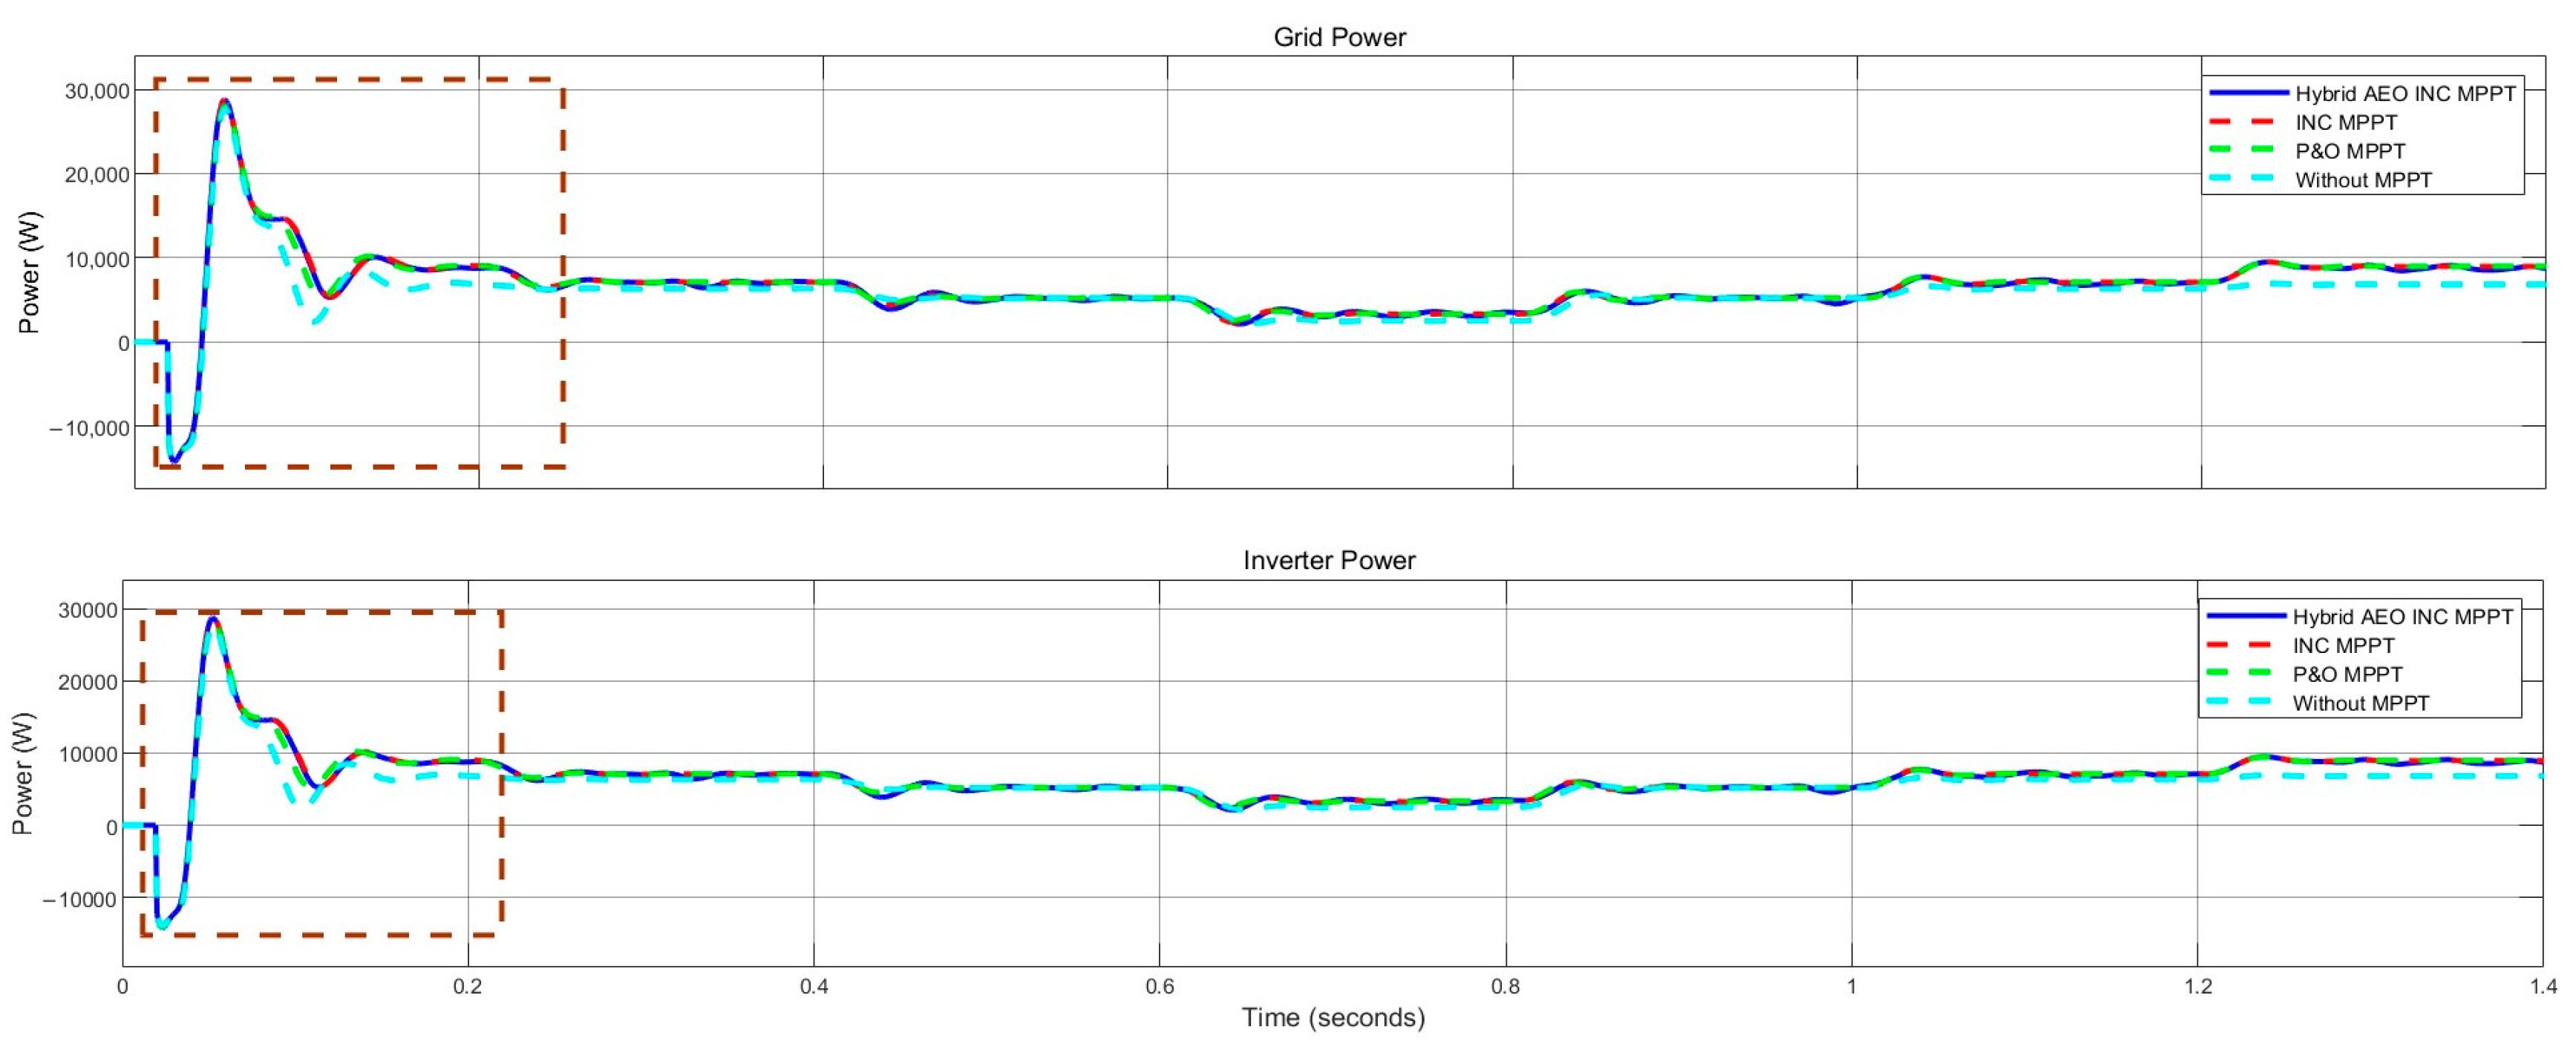
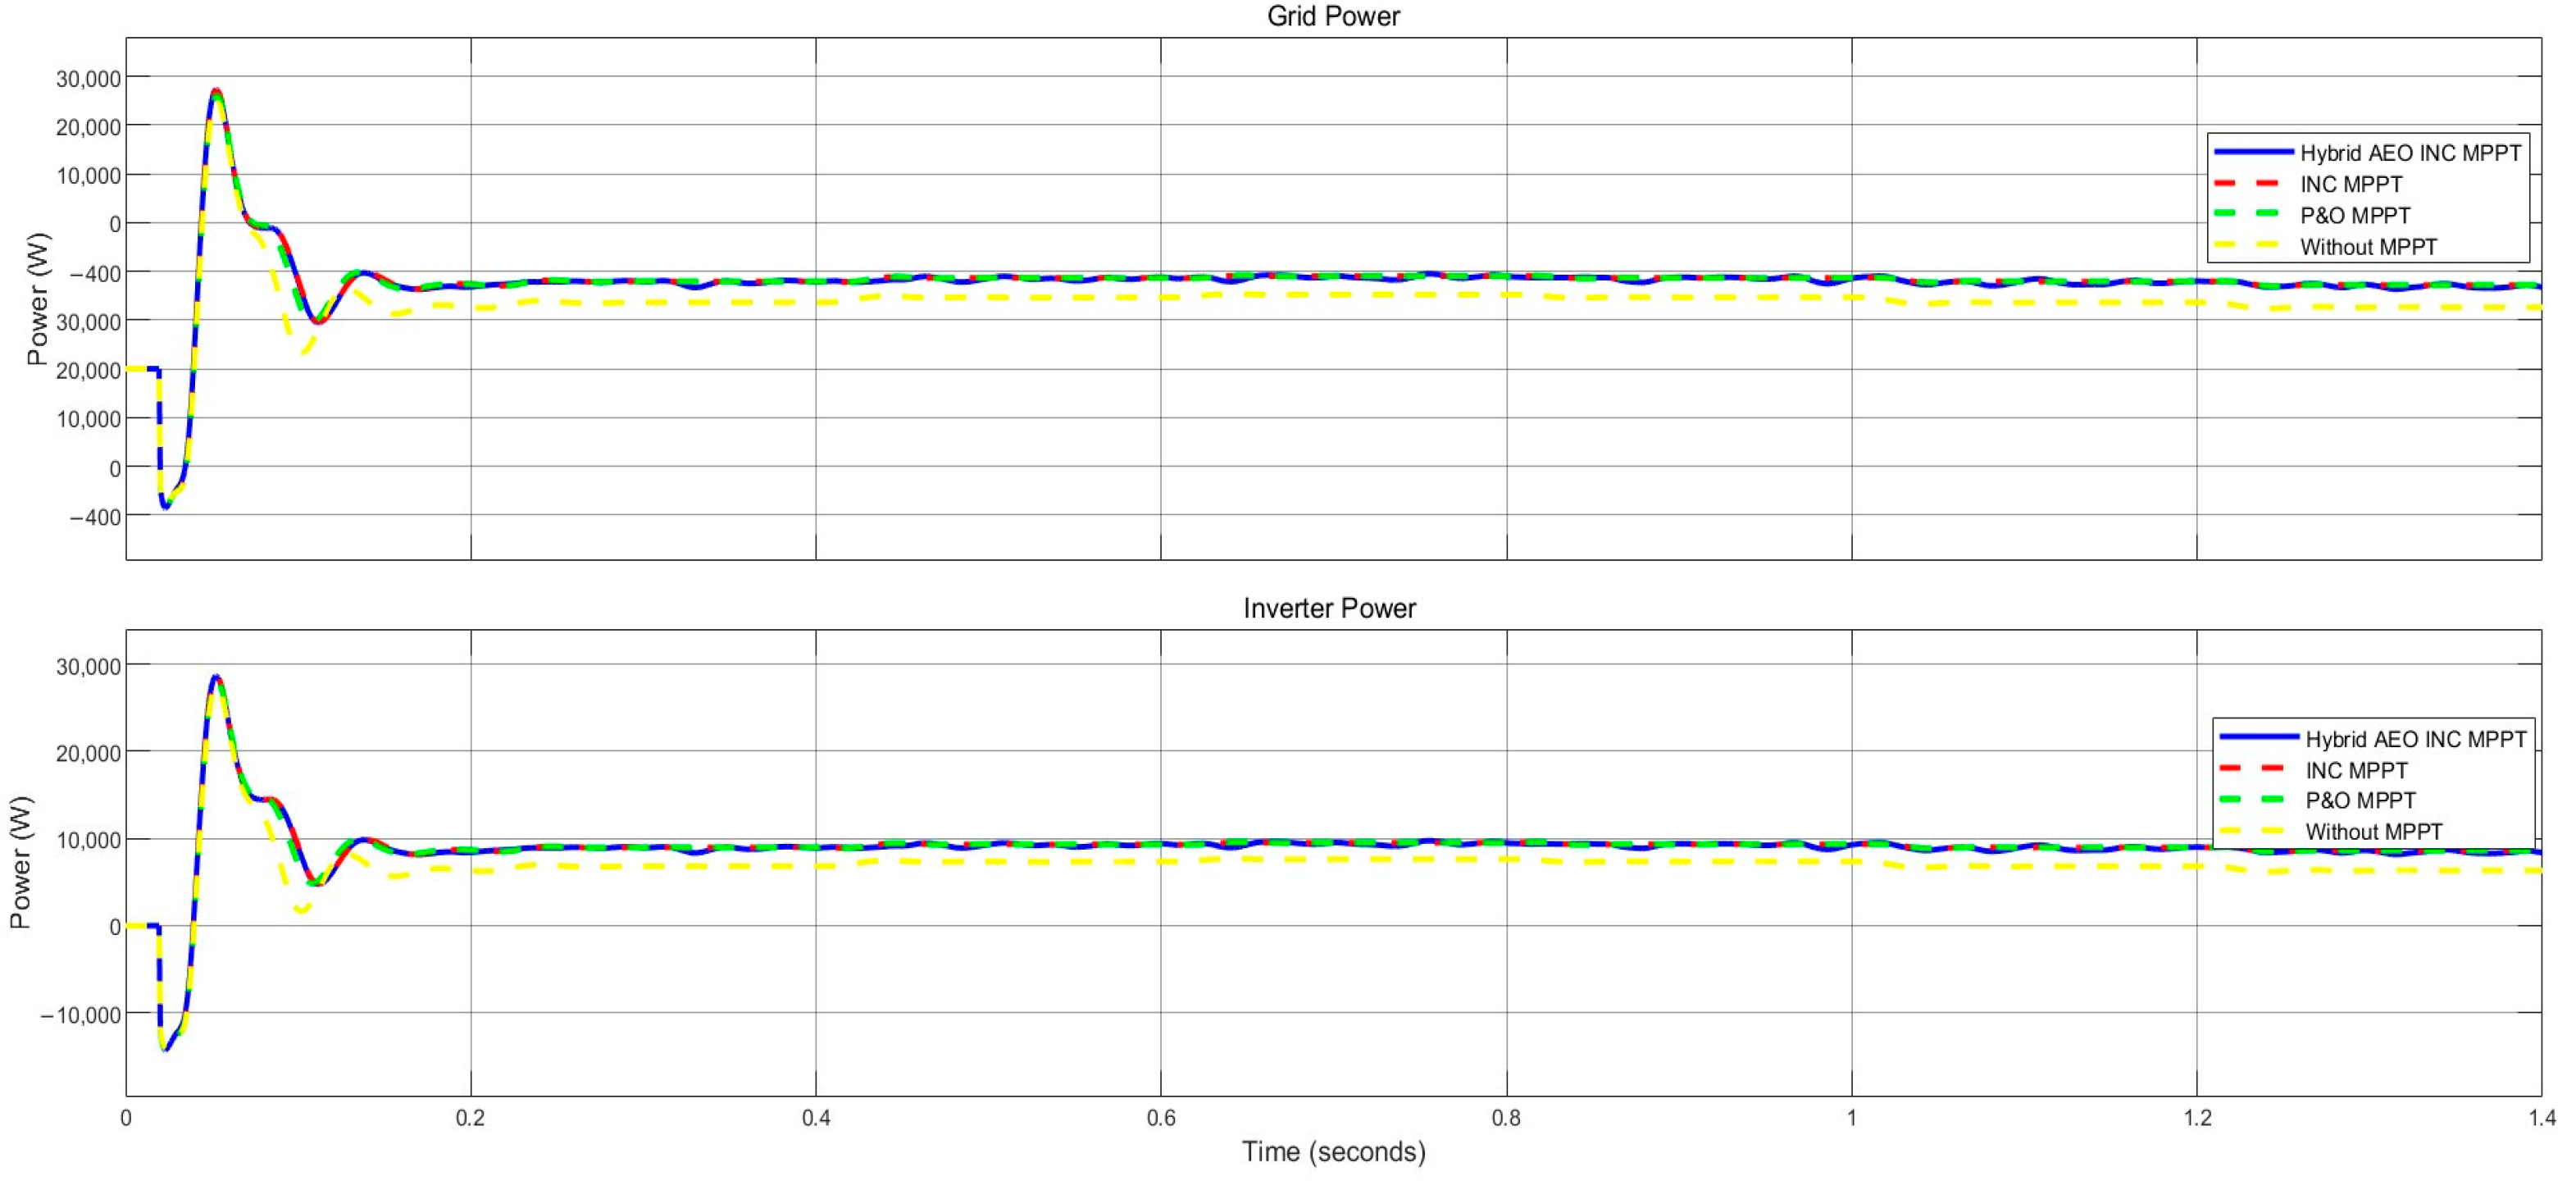
The results of the grid and inverter power for the constant temperature and irradiation conditions are shown in Figure 10. Grid and inverter power have been maintained at 9.6 kW and 9.7 kW, respectively.
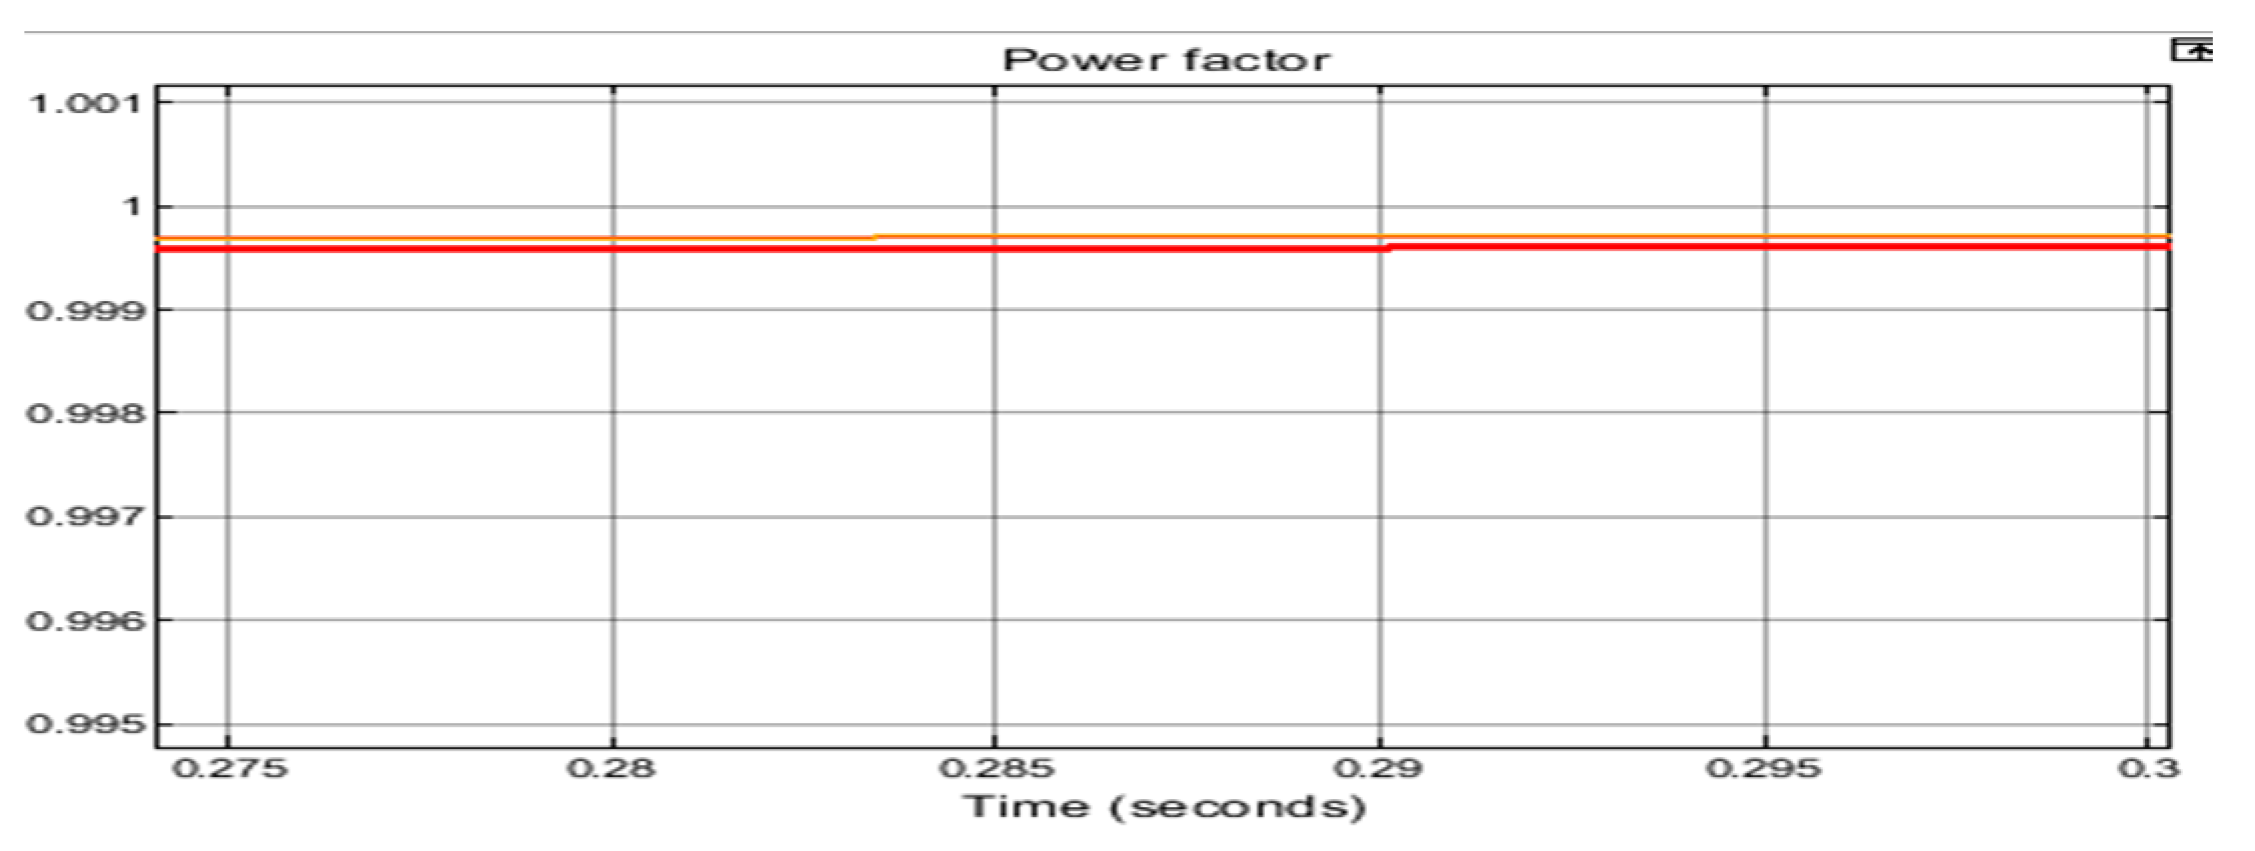
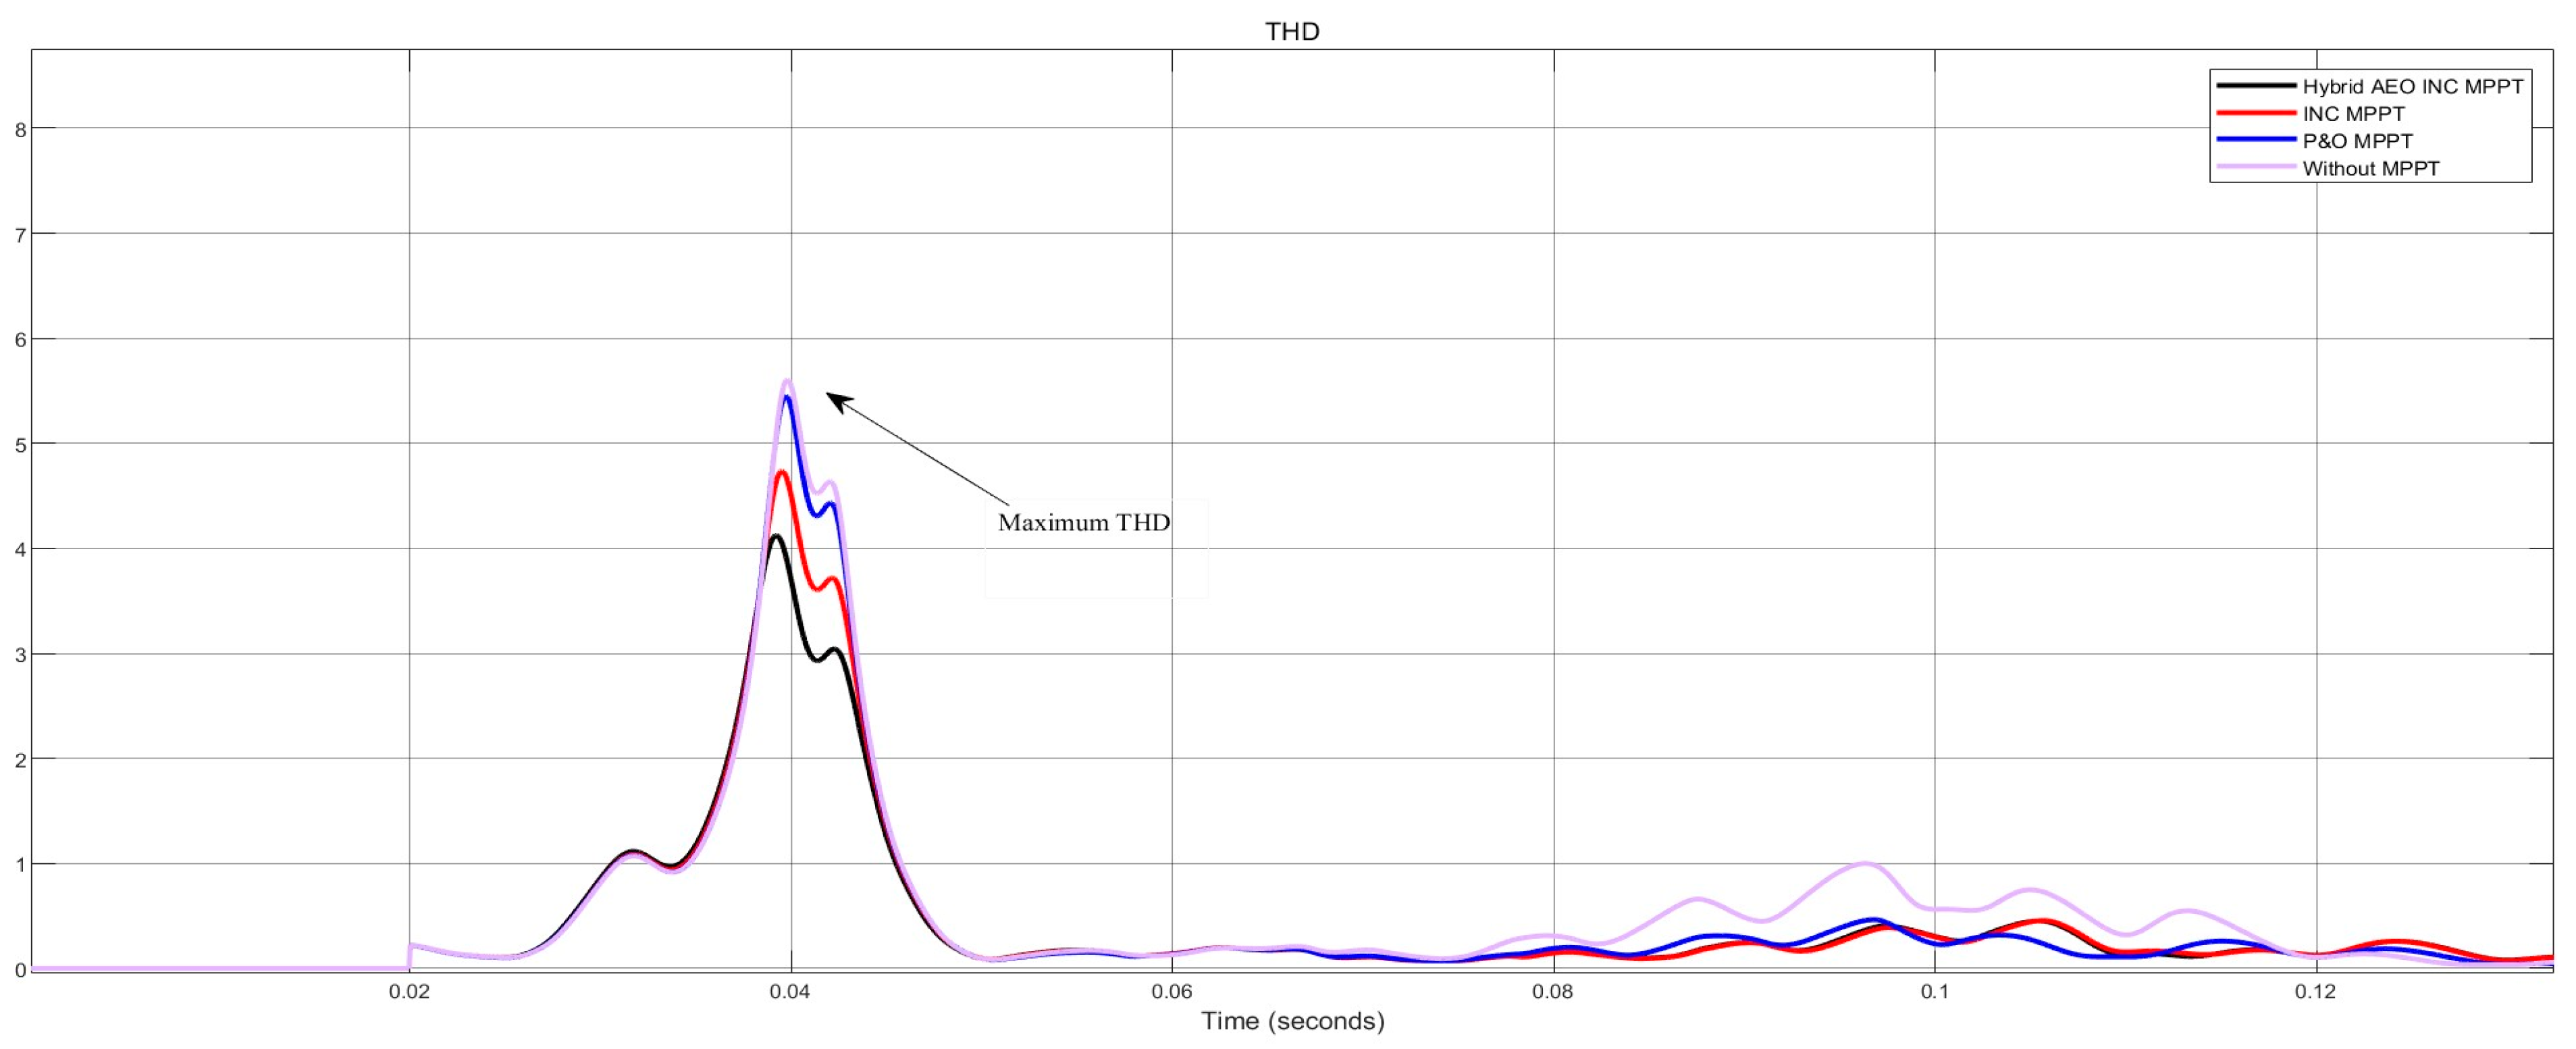
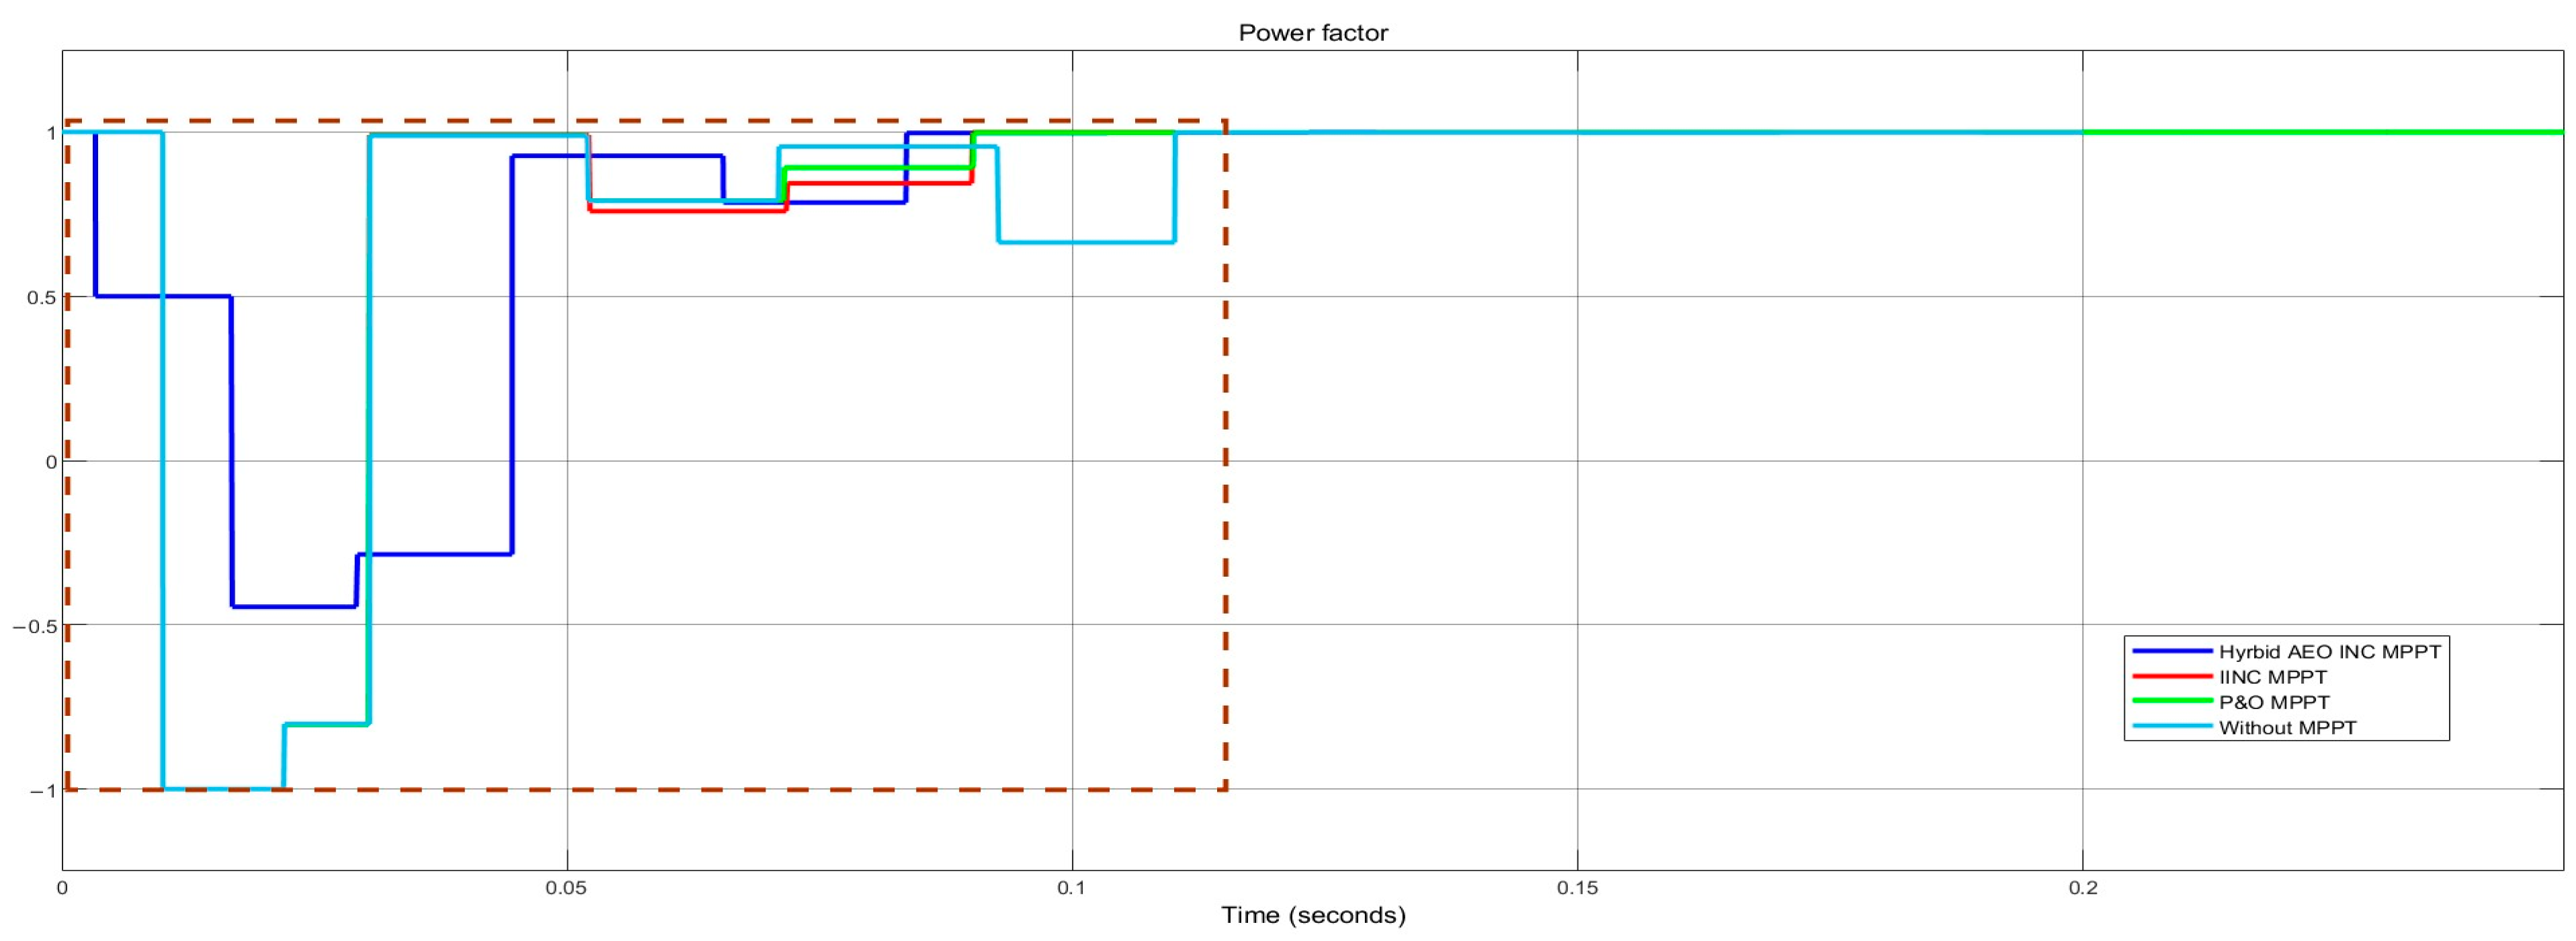
The results for the power factor of the grid and the total harmonic distortion (THD) of the grid current at 1000   W / m 2 and 25 °C are shown in Figure 11 and Figure 12, respectively. The plots reveal that the power factor is kept constant at 0.999, and the grid current has a total harmonic distortion that is less than 5% and complies with IEEE standards.`
The comparison of various performance parameters(rise time, settling time, peak power output, and THD) of the proposed MPPT, INC MPPT, P&O MPPT, and PV system without MPPT is tabulated in Table 1 below with a constant irradiance at 1000   W / m 2 and constant temperature at 25 °C.

4.2. Simulation Results forVarying Irradiance Condition

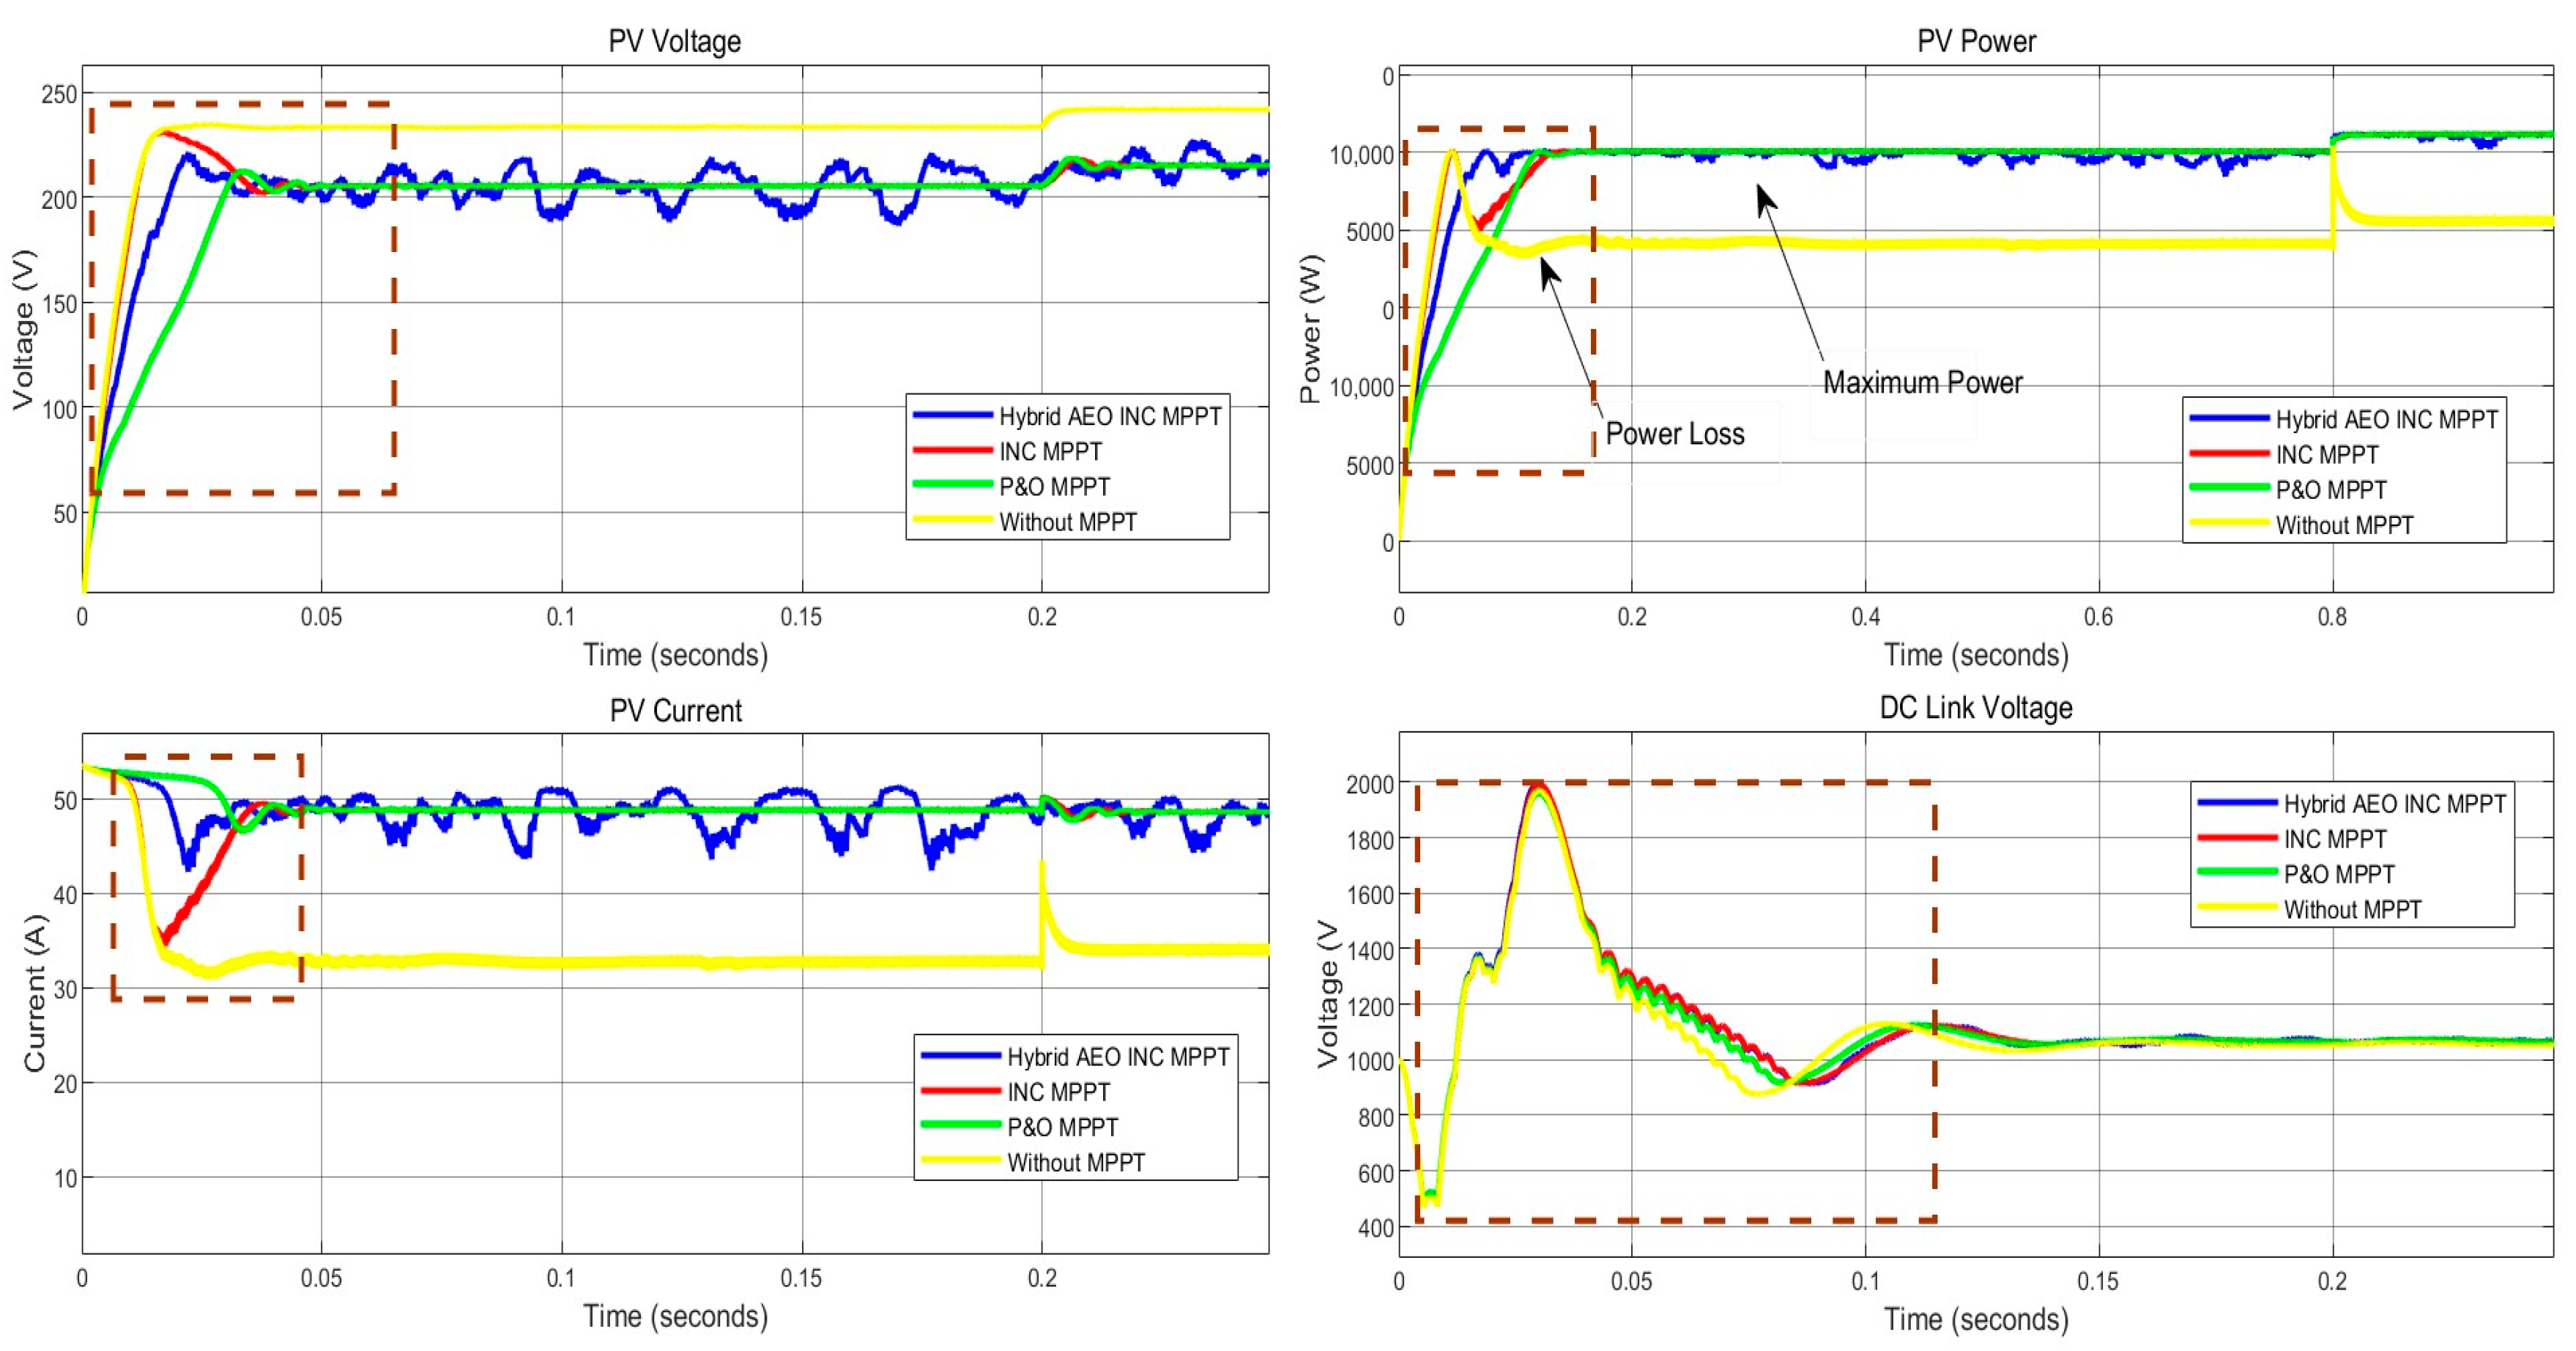
The irradiance of the PV array is initially decreased from 1000 W/ m 2 to 400 W/ m 2   with   a   step   size   of   0.2   s . Then , it   is   increased   from 400 W/ m 2   to   1000   W / m 2 with the same step size. The varying irradiance input, to which the PV system has been subjected, is represented in Figure 13. However, the temperature is maintained at 25 °C. Figure 14 depicts the simulation results of the PV system′s output voltage, current and the power and DC-link voltage output of the inverter at varying irradiance conditions. For the irradiance level of 1000   W / m 2 , the PV voltage is maintained at 230 V, the PV current is maintained at 45.47 A, and the PV power is maintained at 10.43 kW. Figure 14 also illustrates the performance of the proposed MPPT, INCMPPT, P&O MPPT, and the system without MPPT.
However, for the same PV, the voltage is held at 216 V, the current is held at 38.7 A, and the power is held at 8.36 kW for an irradiance of 800 W/m2. The PV voltage is maintained at 217 V, the PV current is maintained at 28.2A, and the PV power is maintained at 6.12 kW at 600 W/m2. The PV voltage is maintained at 216 V, the PV current is maintained at 18.56A, and the PV power is maintained at 4.01 kW at 400 W/m2. The DC link voltage is maintained at 1000 V for changing irradiance conditions. Figure 15 depicts the simulation results of the voltage and current of the grid and inverter at varying irradiance conditions. The Inverter voltage has a three-level output voltage. The grid and inverter currents vary with changing irradiance. A comparison of various parameters for the various irradiance levels has been presented in Table 2, given below.
Grid power and inverter power at varying irradiance conditions have been represented in Figure 16. The plots reveal that the grid and inverter power change with the PV scheme′s varying irradiance conditions.
Results of the power factor of the grid system at varying irradiance conditions have been depicted in Figure 17. The system’s power factor is maintained in the range of 0.996 to 0.999. Figure 18 illustrates the total harmonic distortion of grid current at varying irradiance conditions. The THD of grid current is attained below 5% and follows the IEEE standard.
The comparison of various performance parameters (rise time, settling time, peak power output, and THD) of the proposed MPPT, INC MPPT, P&O MPPT, and PV system without MPPT is tabulated in Table 3 below for the varying irradiance from 1000   W / m 2 to 400   W / m 2 and constant temperature at 25 °C.

4.3. Simulation Results forVarying Temperature Conditions

The temperature of the PV array is varied in the sequence 35 °C, 25 °C, 15 °C, 10 °C, 15 °C, 25 °C, and 35 °C with a step size of 0.2 s and irradiance maintained at 1000 W/m2. Figure 19 shows the PV voltage, current, power, and DC-link voltage of the inverter when the PV system is subjected to varying temperatures and constant irradiation conditions. The simulation results reveal that the PV voltage is maintained at 202.1 V, the PV current is maintained at 49.97 A, and the PV power is maintained at 10.1 kW at 35 °C. The PV output voltage is maintained at 230 V, the PV current is maintained at 45.47 A, and the PV power is maintained at 10.43 kW at 25 °C. The PV voltage is maintained at 222.8 V, the PV current is maintained at 49.14 A, and the PV power is maintained at 10.95 kW at 15 °C. The PV voltage is maintained at 229.8 V, the PV current is maintained at 47.84 A, and the PV power is maintained at 10.99 kW at 10 °C. The DC-link voltage is held at 1000 V for varying temperature conditions. Figure 19 also illustrates the performance of the proposed MPPT, INC MPPT, P&O MPPT, and the system without MPPT.
A summary of various parameters has been tabulated in Table 4 for different temperature conditions.
Figure 20 depicts the output of the voltage and current of the grid and inverter at varying temperature conditions. The voltage at the grid is maintained at 400 V. However, inverter voltage has three levels. The grid and inverter currents change with changing temperatures.
A plot of grid power and inverter power at varying temperature conditions has been depicted in Figure 21. The grid and inverter power varies according to the PV array′s temperature.
The power factor of the grid system at varying temperature conditions is represented in Figure 22. Also, the THD in the grid current has been plotted in Figure 23. The power factor of the grid system is constantly in the range of 0.996 to 0.999. The THD of the grid current is less than 5%, which again agrees with IEEE standards.
The comparison of various performance parameters (rise time, settling time, peak power output and THD) associated with proposed MPPT, INC MPPT, P&O MPPT, and PV system without MPPT is tabulated in Table 5 below for the constant irradiation of 1000   W / m 2 and temperature from 35 °C to 10 °C.

5. Conclusions

This paper presents a grid-interactive PV system having an MPPT based on a hybrid artificial eco-optimization and incremental-conductance (HAEOINC) method. Studies on the effectiveness of the HAEOINC approach have been conducted both qualitatively and quantitatively. The parameters used for testing the performance of the developed hybrid MPPT technique are PV voltage, PV current, PV power, grid voltage, grid current, inverter voltage, inverter current, grid power, inverter power, power factor, and THD. The parameters have been evaluated for three scenarios: the constant irradiance condition, the varying irradiance condition, and the varying temperature condition. The simulation results show that under all the simulated scenarios, the DC-link voltage is held at 1000 V, which indicates that the algorithm has been able to vary the duty cycle of MPPT in such a manner that the output of the flyback converter has been held at a constant level. The THD in all three scenarios is within 5%, which agrees with IEEE standards. The power factor of the grid system is constantly in the range of 0.996 to 0.999 under partial shading conditions. Hence, the proposed algorithm has been successfully validated. This work also compares performance parameters, namely rise time, setting time, peak power, and THD, associated with proposed MPPT, INC MPPT, P&O MPPT, and PV system without MPPT for all three scenarios. Based on the results, the authors conclude that the proposed algorithm performs better than traditional MPPT. In the future, this novel approach’s performance will be compared with the existing optimization and hybrid techniques.

Author Contributions

B.U.D.A.: Conceptualization, methodology, software, validation, formal analysis, investigation, data curation, writing—original draft. S.L. and S.P.J.: Methodology, formal analysis, writing—review and editing, supervision. G.F., A.S., L.E. and V.S.B.: Interpretation, validation, and writing—review and editing. All authors have read and agreed to the published version of the manuscript.

Funding

This research received no external funding.

Conflicts of Interest

The authors declare no conflict of interest.

Abbreviations

PVPhotovoltaic
MPPTMaximum Power Point Tracking
AEOArtificial Ecosystem Optimization
DCDirect Current
LPLocal Peak
GPGlobal Peak
SPShading Pattern
PSPartial Shading
NPCNeutral Point Clamped
PWMPulse Width Modulation
THDTotal Harmonic Distortion
P&OPerturb and Observe
INCIncremental Conductance

References

  1. Jalil, M.F.; Khatoon, S.; Nasiruddin, I.; Bansal, R.C. Review of PV Array Modelling, Configuration and MPPT Techniques. Int. J. Model. Simul. 2022, 42, 533–550. [Google Scholar] [CrossRef]
  2. Siti, M.W.; Tiako, R.; Bansal, R.C. A Model Predictive Control Strategy for Grid-Connected Solar-Wind with Pumped Hydro Storage. In Proceedings of the 5th IET International Conference on Renewable Power Generation (RPG 2016), London, UK, 21–23 September 2016; p. 79. [Google Scholar] [CrossRef]
  3. Chao, K.-H.; Zhang, S.-W. An Maximum Power Point Tracker of Photovoltaic Module Arrays Based on Improved Firefly Algorithm. Sustainability 2023, 15, 8550. [Google Scholar] [CrossRef]
  4. Farayola, A.M.; Sun, Y.; Ali, A. Global Maximum Power Point Tracking and Cell Parameter Extraction in Photovoltaic Systems Using Improved Firefly Algorithm. Energy Rep. 2022, 8, 162–186. [Google Scholar] [CrossRef]
  5. Tagayi, R.K.; Baek, J.; Kim, J. Flower Pollination Global Peak Search Algorithm for Partially Shaded Solar Photovoltaic System. J. Build. Eng. 2023, 66, 105818. [Google Scholar] [CrossRef]
  6. Refaat, A.; Khalifa, A.-E.; Elsakka, M.M.; Elhenawy, Y.; Kalas, A.; Elfar, M.H. A Novel Metaheuristic MPPT Technique Based on Enhanced Autonomous Group Particle Swarm Optimization Algorithm to Track the GMPP under Partial Shading ConditionsExperimental Validation. Energy Convers. Manag. 2023, 287, 117124. [Google Scholar] [CrossRef]
  7. Koh, J.S.; Tan, R.H.G.; Lim, W.H.; Tan, N.M.L. A Modified Particle Swarm Optimization for Efficient Maximum Power Point Tracking under Partial Shading Condition. IEEE Trans. Sustain. Energy 2023, 14, 1822–1834. [Google Scholar] [CrossRef]
  8. Shaqarin, T. Particle Swarm Optimization with Targeted Position-Mutated Elitism (PSO-TPME) for Partially Shaded PV Systems. Sustainability 2023, 15, 3993. [Google Scholar] [CrossRef]
  9. Senthilkumar, S.; Mohan, V.; Mangaiyarkarasi, S.P.; Karthikeyan, M. Analysis of Single-Diode PV Model and Optimized MPPT Model for Different Environmental Conditions. Int. Trans. Electr. Energy Syst. 2022, 2022, e4980843. [Google Scholar] [CrossRef]
  10. Chao, K.-H.; Li, J.-Y. Global Maximum Power Point Tracking of Photovoltaic Module Arrays Based on Improved Artificial Bee Colony Algorithm. Electronics 2022, 11, 1572. [Google Scholar] [CrossRef]
  11. Fan, L.; Ma, X. Maximum Power Point Tracking of PEMFC Based on Hybrid Artificial Bee Colony Algorithm with Fuzzy Control. Sci. Rep. 2022, 12, 4316. [Google Scholar] [CrossRef] [PubMed]
  12. Al-Wesabi, I.; Fang, Z.; Farh, H.M.H.; Al-Shamma’a, A.A.; Al-Shaalan, A.M.; Kandil, T.; Ding, M. Cuckoo Search Combined with PID Controller for Maximum Power Extraction of Partially Shaded Photovoltaic System. Energies 2022, 15, 2513. [Google Scholar] [CrossRef]
  13. Martin, A.D.; Cano, J.M. Sensorless Artificial Vision Mppt Algorithm under Partial Shading Conditions for Pv Systems; Preprint, SSRN, Elsevier: Rochester, NY, USA, 2023. [Google Scholar] [CrossRef]
  14. Mohammed, K.K.; Mekhilef, S.; Buyamin, S. Improved Rat Swarm Optimizer Algorithm-Based MPPT under Partially Shaded Conditions and Load Variation for PV Systems. IEEE Trans. Sustain. Energy 2022, 14, 1385–1396. [Google Scholar] [CrossRef]
  15. Premkumar, M.; Kumar, C.; Anbarasan, A.; Sowmya, R. A New Maximum Power Point Tracking Technique Based on Whale Optimisation Algorithm for Solar Photovoltaic Systems. Int. J. Ambient. Energy 2022, 43, 5627–5637. [Google Scholar] [CrossRef]
  16. Aguila-Leon, J.; Vargas-Salgado, C.; Chiñas-Palacios, C.; Díaz-Bello, D. Solar Photovoltaic Maximum Power Point Tracking Controller Optimization Using Grey Wolf Optimizer: A Performance Comparison between Bio-Inspired and Traditional Algorithms. Expert Syst. Appl. 2023, 211, 118700. [Google Scholar] [CrossRef]
  17. Maris, T.; Kourtesi, S.; Ekonomou, L.; Fotis, G.P. Modeling of a Single-Phase Photovoltaic Inverter. Sol. Energy Mater. Sol. Cells 2007, 91, 1713–1725. [Google Scholar] [CrossRef]
  18. Jagadeesh, I.; Indragandhi, V. Comparative Study of DC-DC Converters for Solar PV with Microgrid Applications. Energies 2022, 15, 7569. [Google Scholar] [CrossRef]
  19. Van Tan, N.; Nam, N.B.; Hieu, N.H.; Hung, L.K.; Duong, M.Q.; Lam, L.H. A Proposal for an MPPT Algorithm Based on the Fluctuations of the PV Output Power, Output Voltage, and Control Duty Cycle for Improving the Performance of PV Systems in Microgrid. Energies 2020, 13, 4326. [Google Scholar] [CrossRef]
  20. Artificial Ecosystem-Based Optimization: A Novel Nature-Inspired Meta-Heuristic Algorithm|SpringerLink. Available online: https://link.springer.com/article/10.1007/s00521-019-04452-x (accessed on 30 May 2023).
  21. Putri, R.I.; Wibowo, S.; Rifa’i, M. Maximum Power Point Tracking for Photovoltaic Using Incremental Conductance Method. Energy Procedia 2015, 68, 22–30. [Google Scholar] [CrossRef] [Green Version]
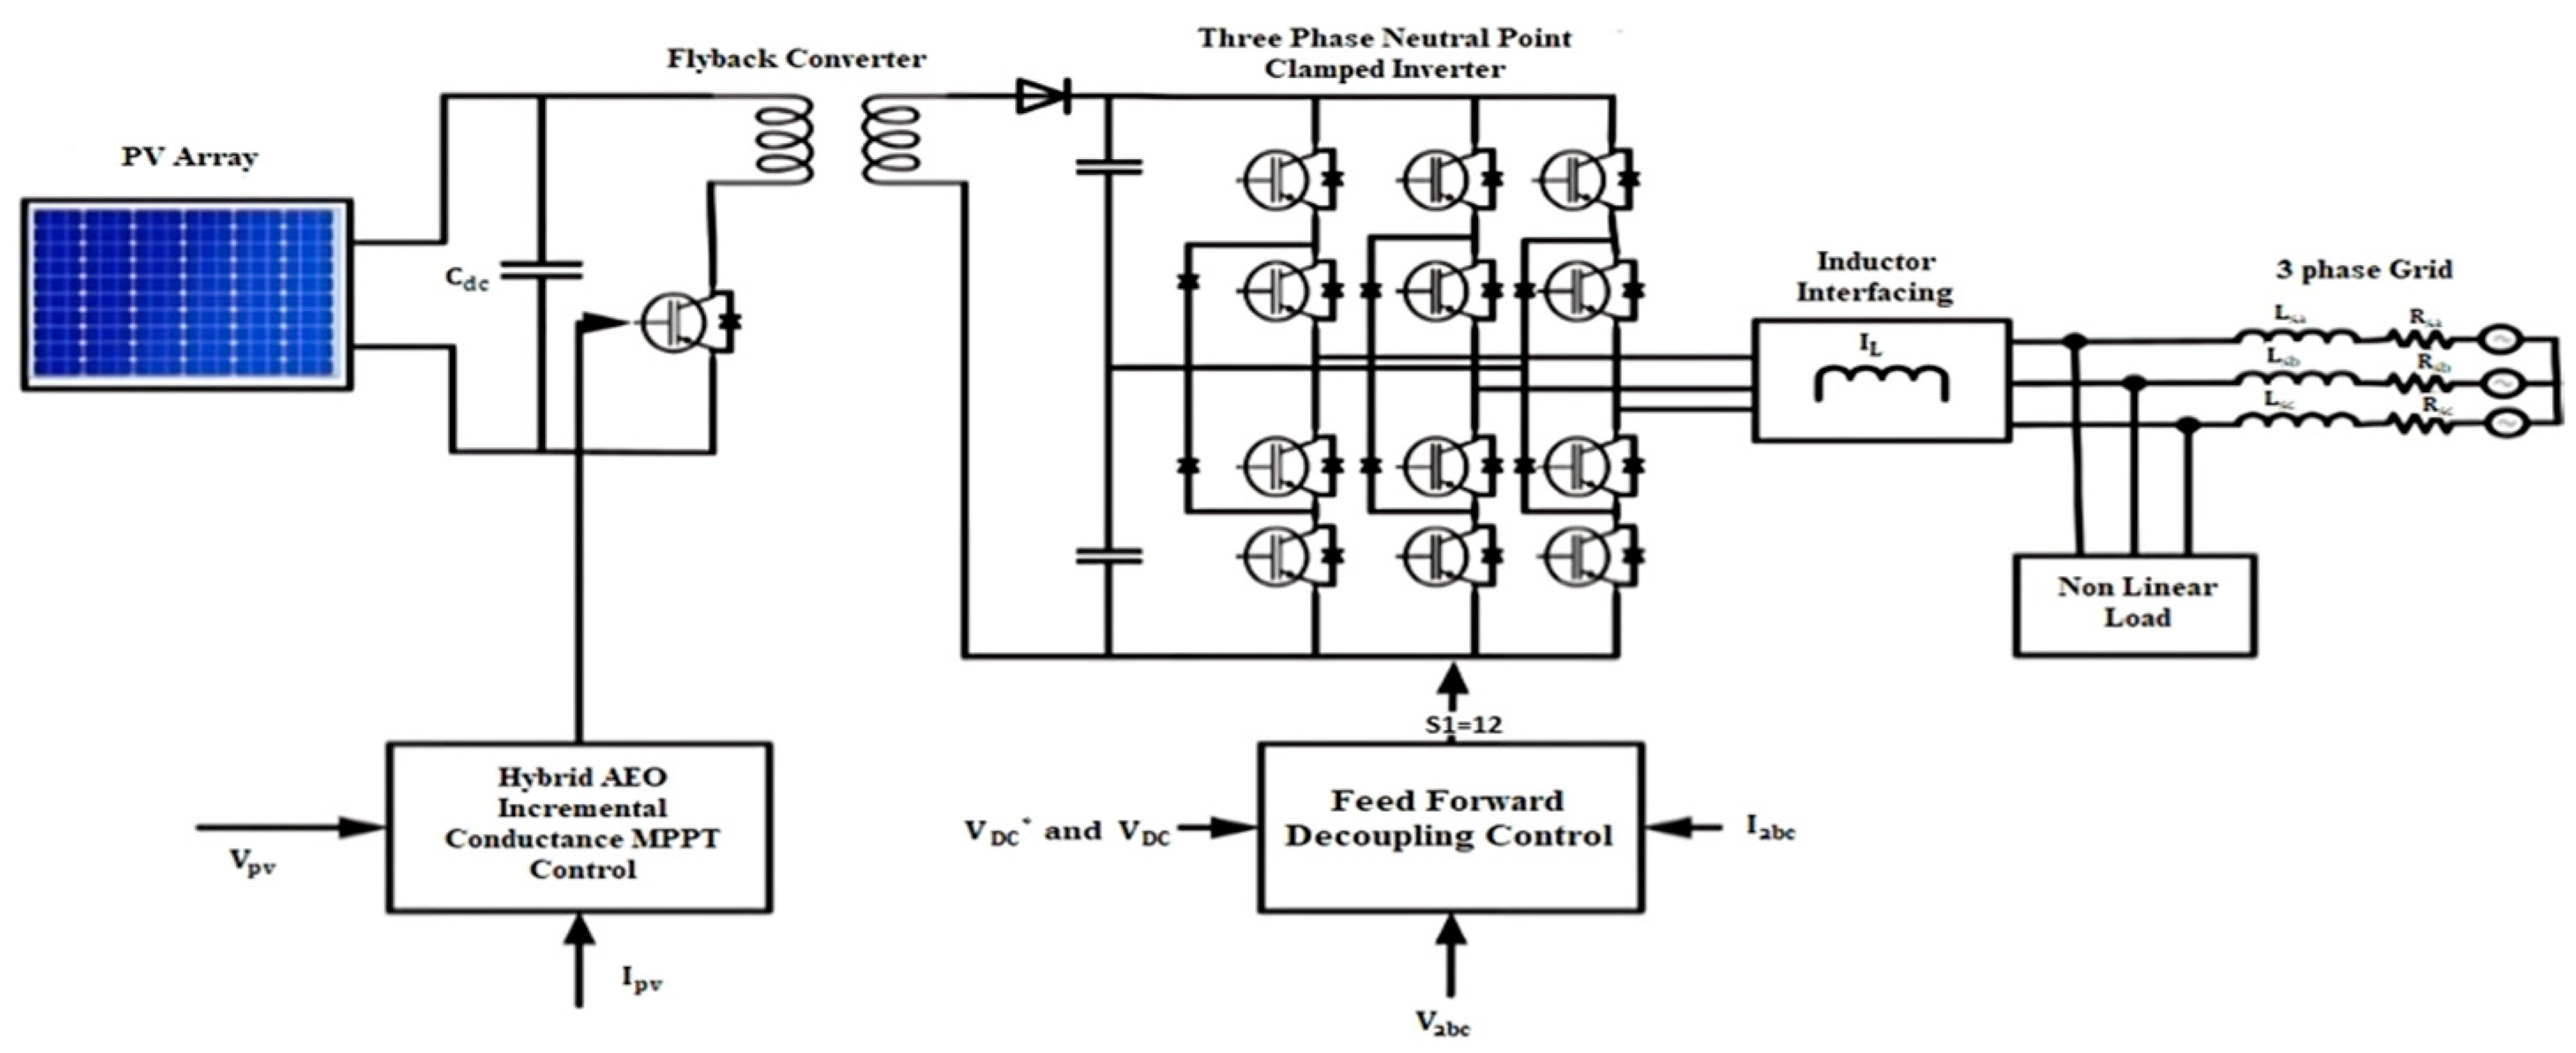
Figure 1. Proposed hybrid AEO incremental-conductance MPPT for PV system with grid integration.
Energies 16 05384 g001
Figure 2. Flowchart of AEO optimization.
Energies 16 05384 g002
Figure 3. Flowchart for incremental-conductance MPPT.
Energies 16 05384 g003
Figure 4. Flyback converter with NPC.
Energies 16 05384 g004
Figure 5. Control strategy.
Energies 16 05384 g005
Figure 6. Representation of hybrid artificial ecosystem optimizer and incremental-conductance MPPT.
Energies 16 05384 g006
Figure 7. AEOINC MPPT.
Energies 16 05384 g007
Figure 8. Plots of PV voltage, current, power, and DC-link voltage for constant irradiance conditions.
Energies 16 05384 g008
Figure 9. Plot of voltage and current of the grid and inverter vs. time for constant irradiance conditions.
Energies 16 05384 g009
Figure 10. Plot of grid and inverter power vs. time for constant irradiance condition.
Energies 16 05384 g010
Figure 11. Plot of power factor of the grid vs. time for constant irradiance conditions.
Energies 16 05384 g011
Figure 12. Plot of THD of the grid current vs. time for constant irradiance conditions.
Energies 16 05384 g012
Figure 13. Input variable irradiance.
Energies 16 05384 g013
Figure 14. Plots of PV voltage, current, power, and DC-link voltage for varying irradiance conditions.
Energies 16 05384 g014
Figure 15. Plot of voltage and current of the grid and inverter vs. time for varying irradiance conditions.
Energies 16 05384 g015
Figure 16. Plot of grid power and inverter power vs. time for varying irradiance conditions.
Energies 16 05384 g016
Figure 17. Plot of power factor of the grid current vs. time for changing irradiance conditions.
Energies 16 05384 g017
Figure 18. Plot of THD of the grid current vs. time for varying irradiance conditions.
Energies 16 05384 g018
Figure 19. Plot of PV voltage, current, power, and voltage of DC-link vs. time for varying temperature conditions.
Energies 16 05384 g019
Figure 20. Plot of voltage and current of the grid and inverter vs. time for varying temperature conditions.
Energies 16 05384 g020
Figure 21. Plot of grid power and inverter power vs. time for varying temperature conditions.
Energies 16 05384 g021
Figure 22. Plot of power factor of grid vs. time for varying temperature conditions.
Energies 16 05384 g022
Figure 23. Plot of THD of the grid current vs. time for varying temperature conditions.
Energies 16 05384 g023
Table 1. Comparison of various performance parameters for constant irradiation conditions.
MethodRise Time (s)Setting Time (s)Peak Power (kW)THD
Hybrid AEO INC0.0200.0309.93.00%
INC Method0.0350.0559.84.60%
P&O MPPT0.0370.0569.84.70%
Without MPPT0.0450.0657.95.80%
Table 2. Comparison of various parameters for varying irradiance.
Irradiance   ( w / m 2 ) PV Voltage (V)PV Current (A)PV Power (kW)DC-Link Voltage(V)
100023045.4710.431000
80021638.78.361000
60021728.26.121000
40021618.564.011000
Table 3. Comparison of various performance parameters for varying irradiation conditions.
Irradiation = 1000   W   / m 2
MethodRise Time (s)Setting Time (s)Peak Power (kW)THD
Hybrid AEO INC0.0200.0309.93.00%
INC Method0.0350.0559.84.60%
P&O MPPT0.0370.0569.84.70%
Without MPPT0.0450.0657.95.80%
Irradiation = 800   W / m 2
MethodRise Time (s)Setting Time (s)Peak Power (kW)THD
Hybrid AEO INC0.0180.0287.83.00%
INC Method0.0320.0517.74.90%
PO MPPT0.0350.0547.74.98%
Without MPPT0.0430.0626.1 6.00%
Irradiation = 600 W   / m 2
MethodRise Time (s)Setting Time (s)Peak Power (kW)THD
Hybrid AEO INC0.0170.0255.94.50%
INC Method0.0300.0465.75.60%
P&O MPPT0.0330.0487.65.70%
Without MPPT0.0390.0544.26.78%
Irradiation = 400   W / m 2
MethodRise Time (s)Setting Time (s)Peak Power (kW)THD
Hybrid AEO INC0.0150.0213.94.98%
INC Method0.0290.0413.75.90%
P&O MPPT 0.0310.0443.75.70%
Without MPPT0.0320.0532.57.00%
Table 4. Comparison of various parameters for varying temperatures.
Temperature (°C)PV Voltage (V)PV Current (A)PV Power (kW)DC Link Voltage (V)
35202.149.9710.11000
2523045.4710.431000
15222.849.1410.951000
10229.847.8410.991000
Table 5. Comparison of various performance parameters for varying temperature conditions.
Temperature = 35 °C
MethodRise Time (s)Setting Time (s)Peak Power (kW)THD
Hybrid AEO INC0.0190.0299.83.10%
INC Method0.0340.0539.64.80%
P&O MPPT0.0370.0579.54.91%
Without MPPT0.0440.0627.55.90%
Temperature = 25 °C
MethodRise Time (s)Setting Time (s)Peak Power (kW)THD
Hybrid AEO INC0.0200.0309.93.00%
INC Method0.0350.0559.84.60%
P&O MPPT0.0370.0569.84.70%
Without MPPT0.0370.0657.9 5.80%
Temperature = 15 °C
MethodRise Time (s)Setting Time (s)Peak Power (kW)THD
Hybrid AEO INC0.0220.03211.12.90%
INC Method0.0370.05610.54.20%
P&O MPPT0.0410.05810.44.35%
Without MPPT0.0480.0678.15.50%
Temperature = 10 °C
MethodRise Time (s)Setting Time(s)Peak Power(kW)THD
Hybrid AEO INC0.0250.03511.52.70%
INC Method0.0380.05910.94.10%
P&O MPPT0.0410.06210.84.20%
Without MPPT0.0490.0688.55.10%
Disclaimer/Publisher’s Note: The statements, opinions and data contained in all publications are solely those of the individual author(s) and contributor(s) and not of MDPI and/or the editor(s). MDPI and/or the editor(s) disclaim responsibility for any injury to people or property resulting from any ideas, methods, instructions or products referred to in the content.