Article

Characterization of Flow Parameters in Shale Nano-Porous Media Using Pore Network Model: A Field Example from Shale Oil Reservoir in Songliao Basin, China

1
Exploration and Development Research Institute of Daqing Oilfield Company Ltd., Daqing 163712, China
2
Heilongjiang Provincial Key Laboratory of Reservoir Physics & Fluid Mechanics in Porous Medium, Daqing 163712, China
3
College of Petroleum Engineering, China University of Petroleum (Beijing), Beijing 100083, China
*
Author to whom correspondence should be addressed.
Energies 2023, 16(14), 5424; https://doi.org/10.3390/en16145424
Submission received: 7 June 2023 / Revised: 6 July 2023 / Accepted: 13 July 2023 / Published: 17 July 2023
(This article belongs to the Special Issue Unconventional Oil and Gas Well Monitoring and Development)

Abstract

:
The pore-throat radius of the shale oil reservoir is extremely small, and it is difficult to accurately obtain the absolute permeability and oil–water two-phase relative permeability of the actual oil reservoir through conventional core experiments. However, these parameters are very important for reservoir numerical simulation. In this paper, a method for characterizing flow parameters based on a pore network model that considers differential pressure flow and diffusion flow is proposed. Firstly, a digital core was reconstructed using focused ion beam scanning electron microscopy (FIB-SEM) from the Gulong shale reservoir in the Songliao Basin, China, and a pore network model was extracted. Secondly, quasi-static single-phase flow and two-phase flow equations considering diffusion were established in the pore network model. Finally, pore-throat parameters, absolute permeability, and oil–water two-phase permeability curves were calculated, respectively. The results show that the pore-throat distribution of the Gulong shale reservoir is mainly concentrated in the nanometer scale; the mean pore radius is 87 nm, the mean throat radius is 41 nm, and the mean coordination number is 3.97. The calculated permeability considering diffusion is 0.000124 mD, which is approximately twice the permeability calculated without considering diffusion. The irreducible water saturation of the Gulong shale reservoir is approximately 0.4, and the residual oil saturation is approximately 0.35. The method proposed in this paper can provide an important approach for characterizing the flow parameters of similar shale oil reservoirs.

1. Introduction

Shale oil reservoirs have a wide distribution of pore throats (ranging from nanoscale to micrometer scale), with complex pore geometries and pore-throat structures [1,2]. The micro pore-throat structure is an important factor affecting the macroscopic reservoir properties and fluid flow in shale oil reservoirs [3]. Therefore, quantitative evaluation and characterization of the micro pore-throat structure of shale reservoirs [4] (pore geometry, size distribution, connectivity, etc.) is of great significance for understanding the fluid flow patterns of shale reservoirs. The commonly used methods for characterizing the complex pore-throat structure of porous media are digital cores [5,6,7,8,9,10] and pore network models [11,12,13,14,15,16,17]. Direct flow simulation methods based on digital cores (such as the lattice Boltzmann method [18,19,20,21], computational fluid dynamics method [22,23], and Monte Carlo simulation [24,25]) take a long time to calculate, require a large amount of memory, and are powerless for large-scale flow simulation and parameter sensitivity analysis. Considering the extremely small pore-throat size and strong micro-heterogeneity of shale oil reservoirs, which make it difficult to obtain characterization units or have larger sizes, direct flow simulation methods based on digital cores of shale reservoirs will be very challenging. Based on previous studies, it has been shown that pore network simulation is basically consistent with core-scale experiments in obtaining macroscopic physical parameters (capillary pressure curves, relative permeability curves, etc.) [26,27,28,29,30,31,32,33,34]. Moreover, pore network simulation computation time is relatively short, which is very advantageous for large-scale flow calculations. Therefore, the pore network model is selected as the method for pore-level flow simulation in shale reservoirs in this paper.
Although porous flow parameters such as flow rate-differential pressure curve, permeability, capillary pressure curve, and relative permeability curves can be obtained through core experiments [35,36], the micro-nano pore-throat development of shale rock core and fluid flow in it is very slow, is time-consuming and expensive to obtain macro-physical parameters such as phase permeability through experiments, and the flow rate is low, resulting in large measurement errors. At present, direct flow simulation methods based on digital cores are time-consuming and occupy a large amount of memory, while pore network simulation can quickly and accurately predict macroscopic physical parameters [37,38,39,40,41,42], making it a powerful method for predicting macroscopic physical parameters of shale reservoirs. The pore network model uses regular geometry to replace the characteristics of complex pore-throat structures and uses a form factor to characterize the irregularity of pore-throat structures. Based on the percolation theory, the pore-level flow characteristics of porous media fluid are studied [43,44,45]. In 1957, Broadbent and Hannersley [46] first proposed the concept of percolation and pointed out its prospects in the application of porous flow. Afterward, many scholars conducted extensive research on the simulation of pore network flow. In the 1970s, Dullien [47] applied the percolation theory to the pore network model and explored the flow rules of fluids in the network model. Lenormand [48] proposed the invasion percolation model and applied it to the simulation of the displacement process simulation of the displaced fluid in porous media. Oak et al. [49] used the pore network model to study the oil–water two-phase and oil–gas–water three-phase relative permeability curves of water-wet Berea sandstone. In recent years, Blunt, Ø ren, and van Dijke et al. [50,51,52,53] conducted extensive research on the effects of reservoir wettability on pore level flow, three-phase flow, and the prediction of capillary pressure and relative permeability curves using pore network models. Capillary pressure is the main driving force determining saturation changes in quasi-static network models. For the capillary pressure at the inlet of each network model, the equilibrium position of the interface between the fluids is determined according to the fluid displacement model. Based on the criteria of each displacement mode, displacement and fluid location in the network model occur gradually in order. In addition to being used for theoretical research, many scholars have proposed network models that can be used to predict macroscopic physical property parameters according to research needs. Vogel [54,55] predicted the soil’s relative permeability using a network model generated by a series of thin-slice techniques that can characterize the complex pore structure of soil. In 2002, Blunt et al. [56] pointed out that by combining pore-scale physical phenomena with geometrically equivalent pore-throat cross-section shapes, a representative network model could be used to accurately predict capillary pressure curves and relative permeability curves. In 2005, Piri and Blunt [28] established a pore network flow model that included all the important characteristics of pore scale immiscible fluid flow (such as water film, oil layer, wetting hysteresis, and wettability change). The corresponding model was used to calculate the oil–water relative permeability, invasion path, and capillary pressure curve in different displacement processes. In the water-wetting system, the oil–water relative permeability curve predicted by the model was in good agreement with the experimental results. With the deepening of research, the capillary pressure curves and relative permeability curves during different displacement processes under mixed wetting conditions have gradually been successfully predicted. The quasi-static pore network model for the three-phase flow of oil, gas, and water has gradually been developed.
In view of the above problems, this paper proposes a characterization method of flow parameters in shale nano-porous media using a pore network model. The structure of this article is as follows. In Section 2, the FIB-SEM experiment and the calculation method of flow parameters in porous media are introduced. The model validation is introduced in Section 3. The results and discussion are introduced in Section 4. Finally, the conclusions are drawn in Section 5. In this paper, mass transfer caused by differential pressure and diffusion are both considered in the calculation of gas permeability. The results are more reliable and can provide guidance for the characterization of parameters of similar shale oil reservoirs.

2. Methodology

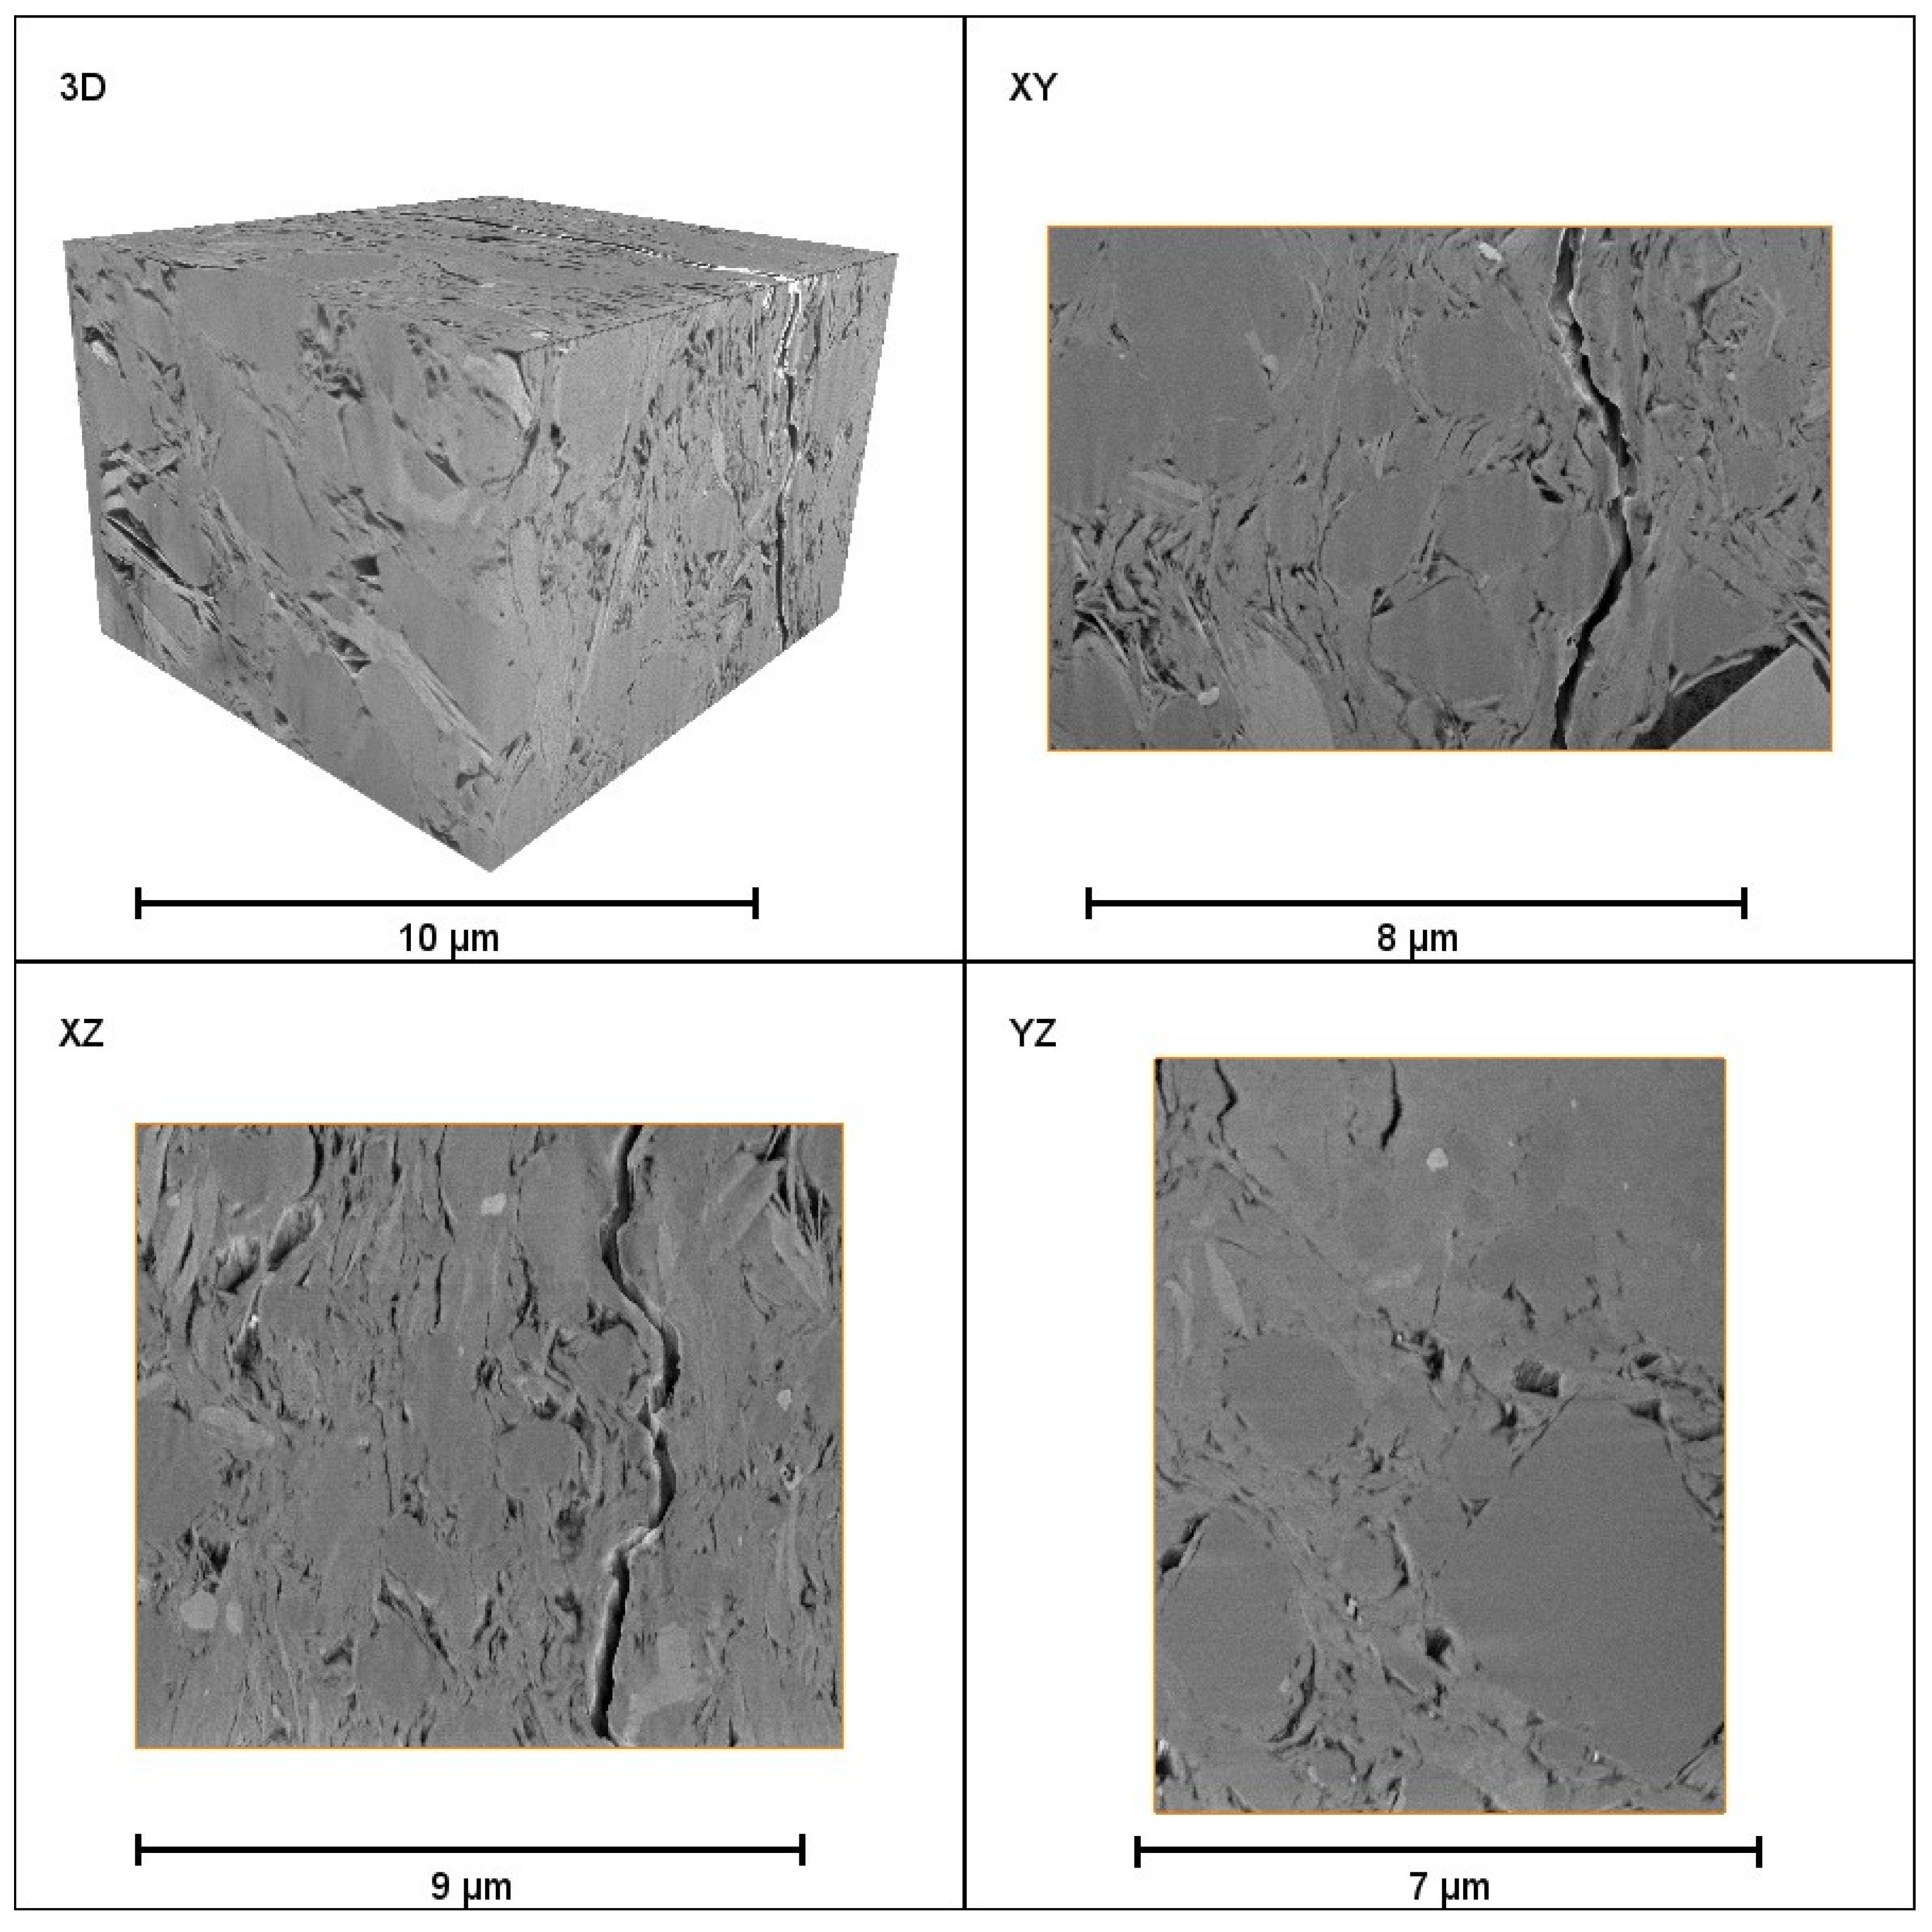
2.1. Establishment of Pore Network Model Based on FIB-SEM

The core samples of this experiment are from the Gulong shale oil reservoir in the Songliao Basin, China, which is a typical liquid-rich shale oil reservoir. The experiment used a focused ion beam scanning electron microscope (FIB-SEM) with a resolution of 2 nm, Helios 5 CX DualBeam model, to perform high-precision scanning of the shale sample. The electron beam current range was 0.8 pA–176 nA, and the acceleration voltage range was 200 V–30 kV. The ion beam current range was 1 pA–100 nA, and the acceleration voltage range was 500 V–30 kV.
For the images generated by FIB-SEM, the angle between the ion beam and the electron beam was 52 degrees. Due to the angle between the milled surface and the imaging axis not being 90 degrees, the original image presents geometric artifacts compared to the real profile. Therefore, it is necessary to cut and stretch the image stack to achieve image alignment. In addition, with FIB cutting on the surface of rock samples, the difference in hardness on the surface of the rock sample can cause a difference in cutting speed, resulting in the formation of marks parallel to the cutting direction on the surface of the rock sample. In the FIB-SEM image, it appears as vertical stripe noise with varying brightness, resembling a curtain, which is called the “curtain effect”. Therefore, the preprocessing of FIB-SEM images mainly involves image alignment and denoising filtering. This article used Avizo software to process FIB-SEM images, providing the FIB Stack Wizard and image filters that can align and preprocess FIB-SEM image stacks. Firstly, the FIB-SEM image stack was aligned and shadow corrected using the FIB stack wizard. Then, the image was denoised and filtered using non-local mean filtering. Then, the striped artifacts caused by the “curtain effect” in the image were eliminated through fast Fourier transform filtering. Finally, the filtered image was edge enhanced by non-sharpening masking to complete image preprocessing. The final FIB-SEM image is shown in Figure 1. In this experiment, six shale core samples are used to construct the pore-network model by FIB-SEM. From the statistics and analysis of their pore-throat radius distribution, the results show that these six cores have similar pore-throat parameters. Then, one of the real pore network models is used in this study.
After preprocessing, the signal-to-noise ratio (SNR) of the image can be effectively improved, and then the preprocessed image needs to be segmented, mainly to gain a deeper understanding of the pore structure of the rock and identify the pore phase. Therefore, the Avizo software is used to combine two segmentation methods, interactive threshold segmentation, and interactive top-hat segmentation, in order to accurately segment the pore structure. Then, the pore network model with true topological relationships is obtained through the pore-centered axis method and the maximum sphere method. Figure 2 shows the three-dimensional pore structure of the Gulong shale core after FIB-SEM segmentation and the extracted pore network model.

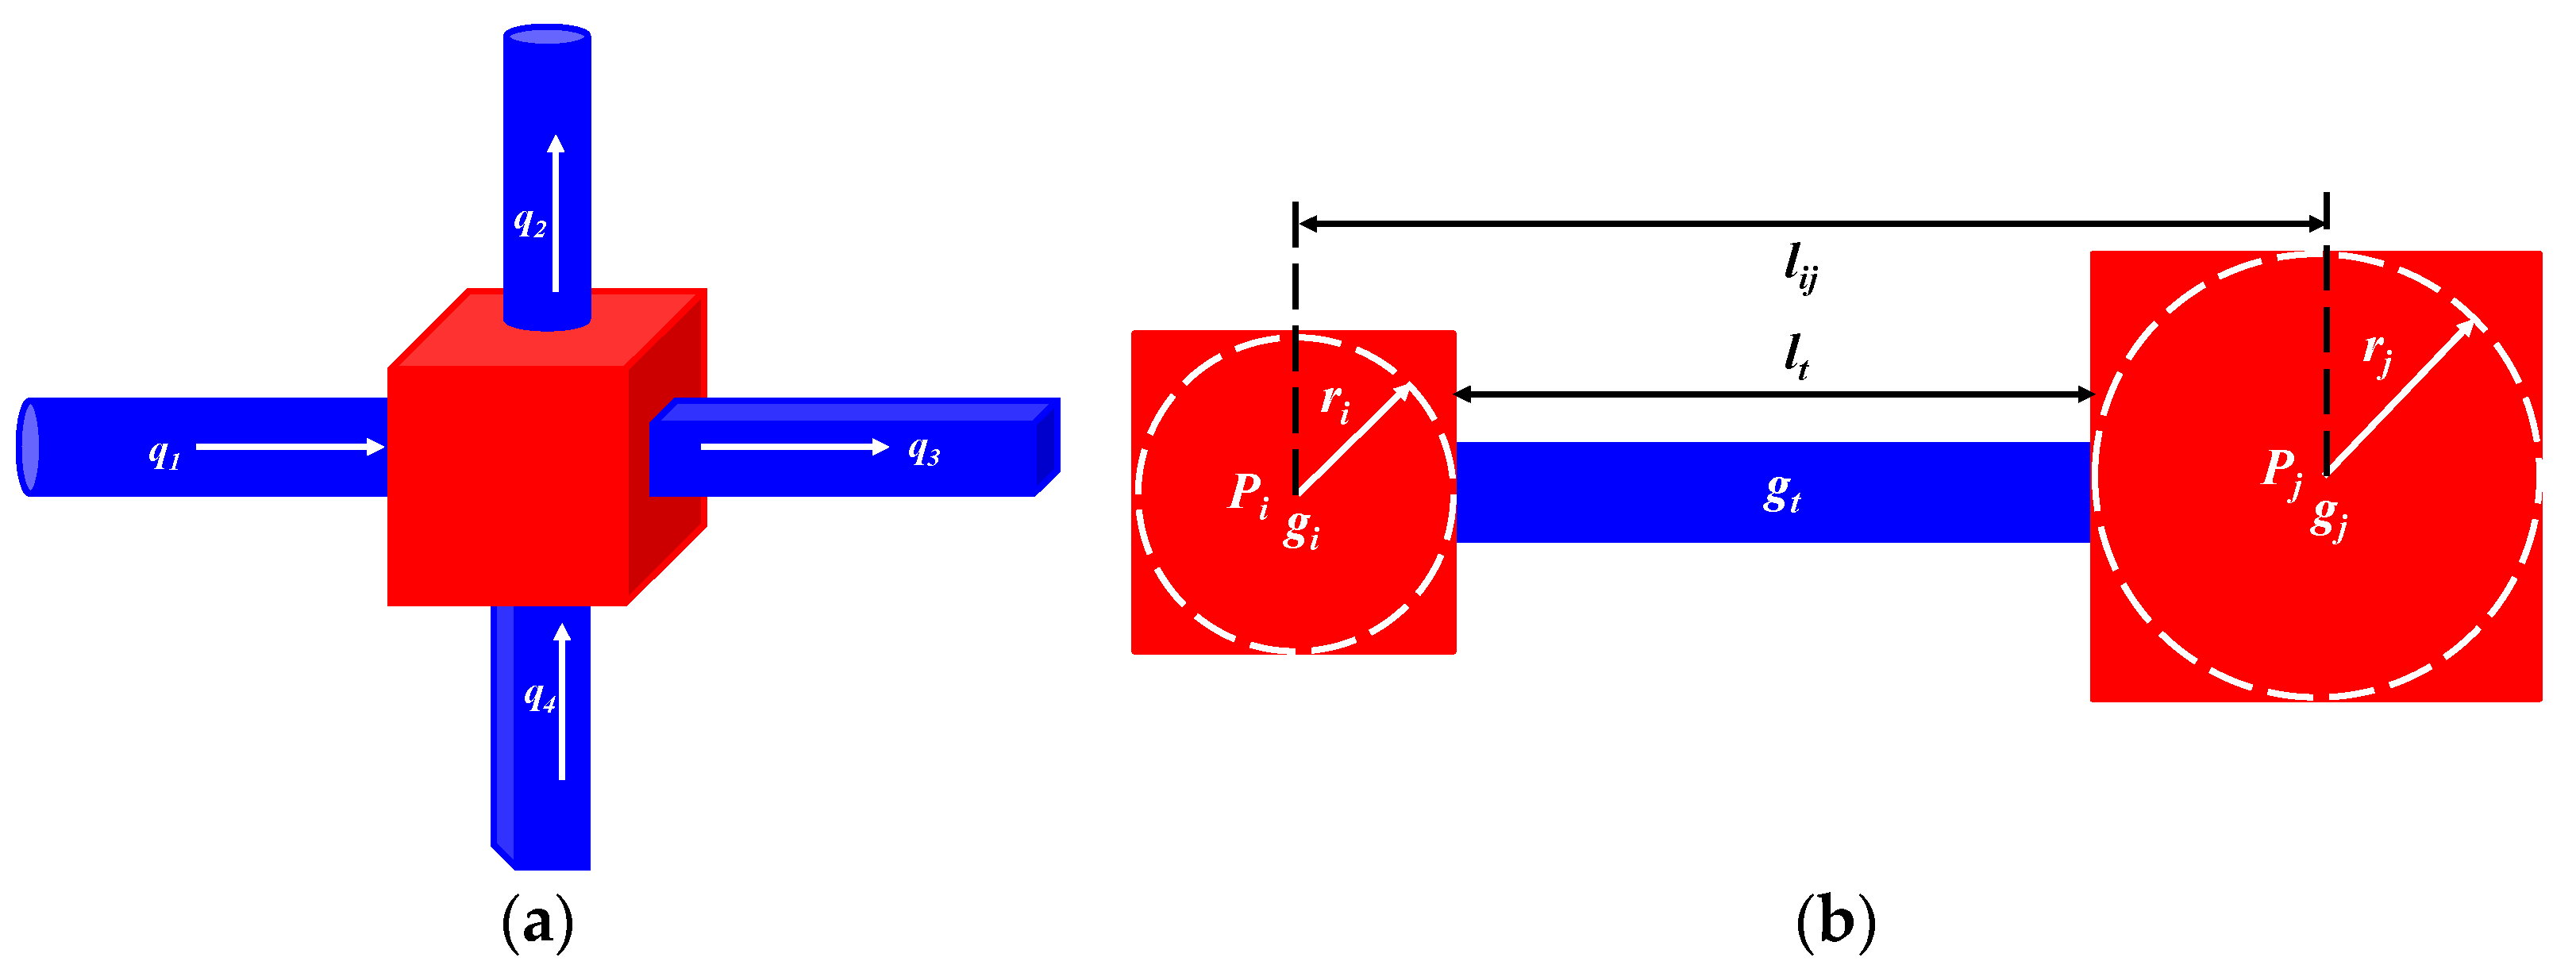
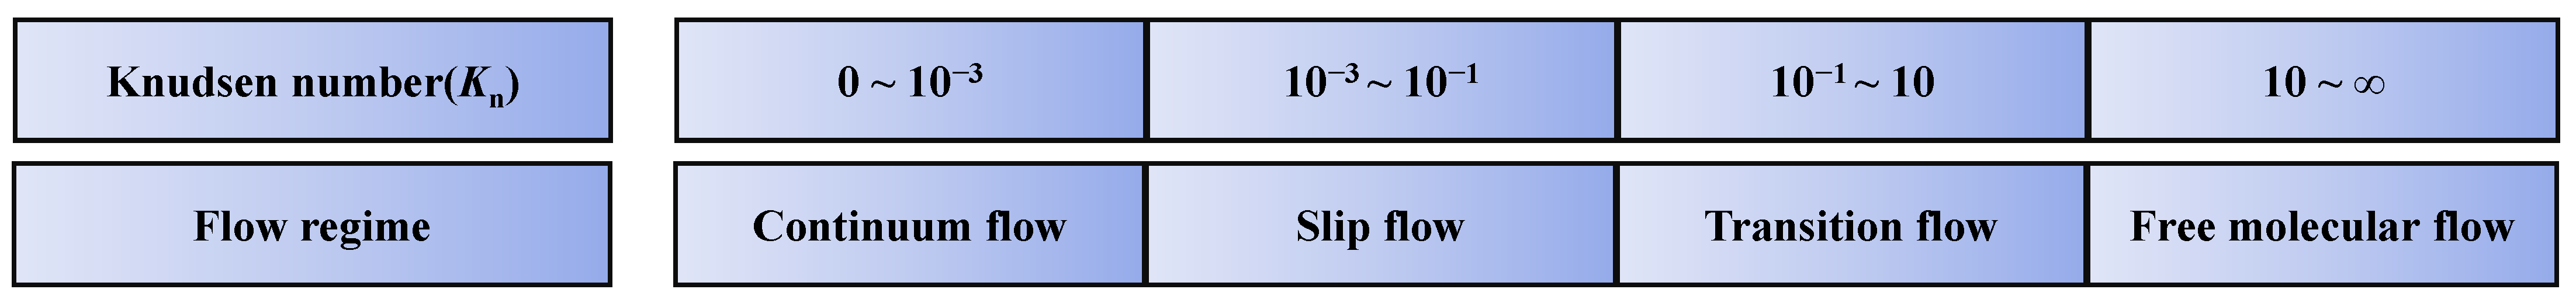
2.2. Quasi-Static Single-Phase Flow Equations Considering Diffusion

The objective of single-phase flow is to accurately obtain the permeability of the shale core. The flow rate into and out of a certain pore in the pore network model satisfies the law of mass conservation (Figure 3a) [57,58]:
j = 1 N i q i j = 0
where Ni is the number of pores connected to pore i; qij is the flow into or out of pore i; j is the pore number connected to pore i. The flow from one pore into or out of its adjacent pore qij is satisfied as follows:
q i j = g i j p i p j L i j
where gij is conductivity; pi, pj are pore pressure of pore i, j; Lij is the distance between two adjacent pores. The conductivity gij can be obtained by the harmonic average of the conductivity of adjacent pores and the middle throat (Figure 3b):
g i j = L i j L i g i + L t g t + L j g j
In addition to pressure differences, diffusion also contributes to flow rates in shale nanopores. Therefore, based on the Knudsen number, the mass transfer modes of Gulong shale oil at different scales are divided. In addition to differential pressure mass transfer, Knudsen diffusion at small pore size, molecular diffusion at large pore size, and transition diffusion at medium pore size are respectively established to characterize diffusion coefficients at different scales. Knudsen number Kn is defined as follows [59]:
K n = λ d = k B T 2 π δ 2 p d
where λ is the mean free path; d is the equivalent pore-throat diameter; kB is the Boltzmann constant, 1.3806488 × 10⁻²³ J/K; δ is the collision diameter of molecule m; T is the temperature, K; p is the total pressure, Pa.
Gas diffusion mechanisms in porous media mainly include Fick diffusion, transition diffusion, and Knudsen diffusion. When Kn < 0.1, the flow regime is primarily continuous and slip flow, mainly occurring in large pores. At this time, gas molecules collide with each other and ignore collisions with the pore wall. Diffusion takes the form of Fick diffusion. When Kn > 10, the flow regime is primarily free molecular flow, mainly occurring in small pores. At this time, only a single molecule can pass through the pore, and molecules collide with the pore wall. Diffusion takes the form of Knudsen diffusion. When 0.1 < Kn < 10, the flow regime is primarily transitional flow. At this time, gas molecules and the wall both experience collisions, and diffusion takes the form of transitional diffusion, as shown in Figure 4.
When calculating the gas flow velocity caused by diffusion, one of the most important variables is the diffusion coefficient. When Knudsen diffusion is dominant, the diffusion coefficient is the Knudsen diffusion coefficient DK, which can be calculated using the following formula:
D K = d 3 8 R T π M
When Fick diffusion is dominant, the diffusion coefficient is the Fick diffusion coefficient DF, which can be calculated using the following formula:
D F = k B T 3 2 π δ 2 p 8 R T π M
where M is molecular molar mass, g/mol; R is the ideal gas constant, 8.314462 J/(mol·K). When transitional flow is dominant, the diffusion coefficient is the transition diffusion coefficient DT, which is a combination of the Fick diffusion coefficient and the Knudsen diffusion coefficient. The calculation formula is as follows [59]:
1 D T = 1 D K + 1 D F
Therefore, after considering diffusion, the flow equation in a single pore throat is as follows:
Q = Q p + Q d = π d 4 128 μ L ρ M + π d 2 4 L D R T Δ p
The pressure at each pore node of the network model can be obtained by combining (1), (2), (3), and the single-phase conductivity coefficients of any shape section. Inlet and outlet nodes were used to calculate the inlet and outlet flows, and Darcy’s law was used to calculate the absolute permeability K of the network model:
k abs = Q μ L m A Δ p
where Q is the outlet or inlet flow of the network model, m3/s; Lm is length of pore network model, m; A is the cross-sectional area of the network model, m2; Δp is the differential pressure at both ends of the network model, Pa.

2.3. Quasi-Static Two-Phase Flow Equations

The objective of two-phase flow is to accurately obtain the oil–water relative permeability of the shale core. The relative permeability of oil and water in the initial displacement process can be calculated at any point in the displacement process. In the two-phase flow process, if there is at least one connected cluster in the network model (the connected cluster in the two-phase flow is defined as a fluid of a phase in the network model connected to the inlet and outlet through pores and throats), then the relative permeability of the phase is not zero. On the connected cluster, for each phase of fluid, the flow into and out of a certain pore satisfies the law of conservation of mass [57,58]:
j q p , i j = 0
The flow rate of phase P between pore i and its connected pore j is satisfied as follows:
q p , i j = g p , i j L i j P p , i P p , j
The conduction coefficient gp,ij between two adjacent pores can be used as the harmonic average of the conduction coefficient between two adjacent pores and the connecting throat:
L i j g p , i j = L i n g p , i n + L i j b g p , i j b + L j n g p , j n
where gp,ij is the effective conduction coefficient between pore i and connected pore j; Lij is the distance between pore i and adjacent pore j; Pp,i, Pp,j is the pore i and p phase fluid pressure in j.
In the initial displacement process, oil is the non-wetting phase, and water is the wetting phase. At the throat section, the water film is located at the corner, and the oil phase is located at the center of the pore. In the process of two-phase flow, when two phases of oil and water coexist in the same pore or throat, the oil phase conduction coefficient is the bulk phase conduction coefficient, and the water phase conduction coefficient is the sum of all existing water film conduction coefficients. The expression is:
g o = g o , b , g w = k = 1 n g w , c k
By combining the above formulas, the pressure of the p-phase fluid at each pore node in the network model can be obtained, and then the effective permeability of the p-phase fluid can be obtained using Formula (13):
k p = μ p Q p L T A T Δ p
The calculation formula for relative permeability of p phase is shown in Equation (14):
k r p = k p k abs
In the initial displacement process, water saturation of the pore network model is:
S w = i = 1 M j = 1 n A c , j A i V i + i = 1 N V i i = 1 M + N V i
where Sw is the water saturation of the pore network model; V is volume of the pore network model, m3; A is the cross-sectional area of the pore network model, m2. In this paper, the injection direction is along the X direction. The parameters used in the pore network flow simulation are all from the field data of the Gulong shale oil reservoir, and the detailed parameters are shown in Table 1.

3. Model Validation

Based on Section 2, a pore network model of the Gulong shale oil reservoir was constructed. The accuracy and reliability of the method were validated by comparing them with actual measurement data from core experiments. In this paper, the basic parameters are tested by the experimental core, mainly including porosity and permeability. The porosity was tested using the gas adsorption method, and the permeability was tested using the pulse depletion method; they are shown in Table 2. Through comparison, it was concluded that the simulated flow parameters and basic parameters matched well with the field core measurement data. In addition, the simulated flow parameters are also matched with the parameters from experiments by Sun et al. [60], demonstrating the reliability of the pore network model for the shale oil reservoir.

4. Results and Discussion

4.1. Pore-Throat Parameter Characterization

The three-dimensional slices of the Gulong shale core were obtained by FIB-SEM, and the three-dimensional digital core was constructed. The total porosity was about 9.6%, but the effective connected porosity was only 4.6%. Figure 5a,b show the radius distribution of the pore and throat, respectively. The minimum pore radius and throat radius were, respectively, 2 nm and 1 nm. The maximum pore radius and throat radius were, respectively, 438 nm and 334 nm; the mean pore radius was 87 nm, and the mean throat radius was 41 nm. Figure 5c,d show the coordinate number and shape factor of the Gulong shale core respectively, and the mean coordination number was 3.97. The results show that the pores of the shale core were mainly nanopores, and the flow capability of the fluids in the nanopores was very poor. In addition, its coordination number was about 4, indicating that the overall connectivity of the Gulong shale oil reservoir is not poor. Therefore, the difficulty of development of shale oil reservoir is due to the extremely small pore-throat radius.

4.2. Apparent Permeability Characterization

Due to the extremely low permeability of shale oil reservoirs, the gas permeability of shale cores can be obtained by general laboratory experiments. We set different pressure differentials along the X direction and calculated the flow rate at the corresponding pressure differentials. Figure 6 shows the flow rate–differential pressure curve calculated with and without diffusion. The permeability predicted by the combined effects of differential pressure displacement and diffusion in nanopores was greater than that under differential pressure mass transfer, and the permeability calculated with diffusion was 0.00124 mD. The permeability calculated without considering diffusion was 0.000531 mD. Considering the mass transfer by diffusion, the calculated permeability was basically consistent with the experimental results, which are shown in Table 2.

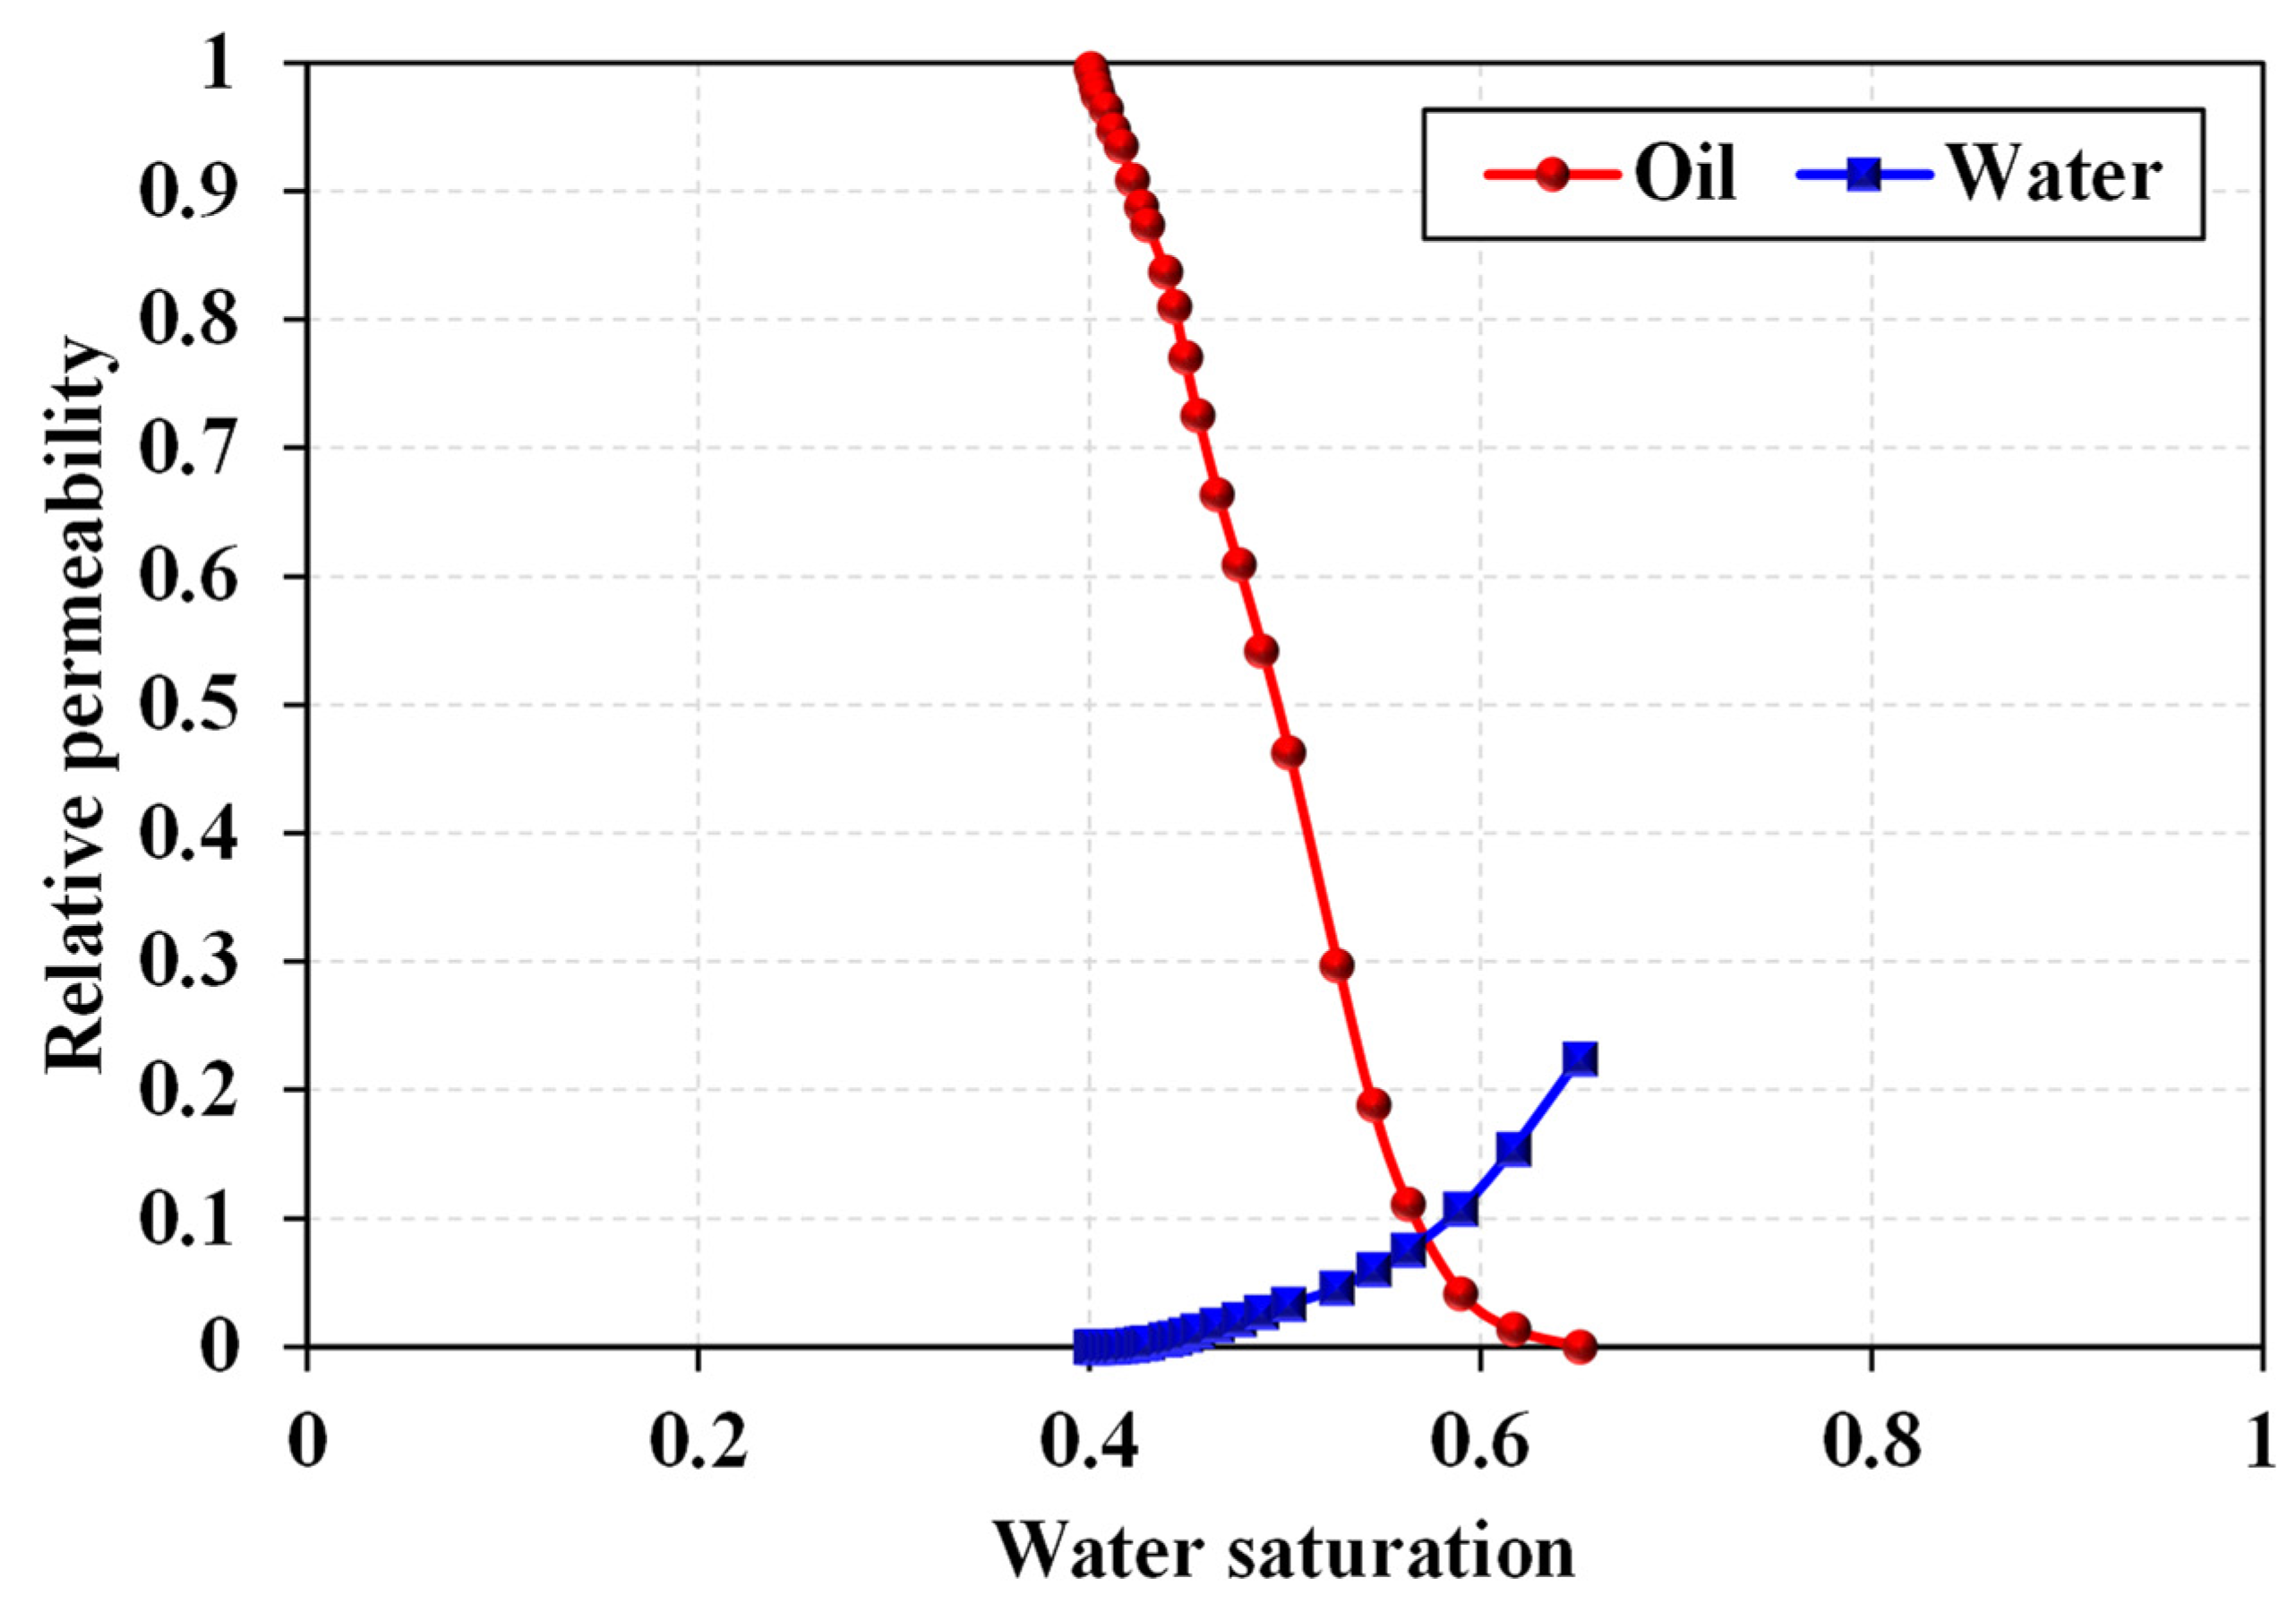
4.3. Relative Permeability Curves Characterization

The key technology for shale oil reservoir development is hydraulic fracturing. The process of fracturing and flowback is a process of oil–water two-phase flow, so the oil–water relative permeability curves are very important. Figure 7 shows the distribution of oil and water in the pore network model under different water saturation conditions. Injected water preferentially flows along large pore channels, and only with the increase of water saturation can injected water gradually enter small pores.
The relative permeability curve of oil and water in the Gulong shale reservoir was calculated through the simulation of oil–water two-phase pore network. The irreducible water saturation of the Gulong shale reservoir was calculated to be about 0.4, and the residual oil saturation was about 0.35. The oil–water relative permeability curve is shown in Figure 8. This method can provide an important approach for characterizing the relative permeability curves of oil–water two-phase.

5. Conclusions

In this paper, a characterization method of flow parameters in shale nano-porous media using a pore network model is proposed to characterize the key flow parameters of the Gulong shale reservoir in the Songliao Basin, China. The conclusions are as follows:
(1) The pore radius of the Gulong shale oil reservoir ranges from 2 nm to 438 nm, and the throat radius ranges from 1 nm to 334 nm. The mean coordination number is 3.97, which indicates that the overall connectivity of the Gulong shale oil reservoir is not poor. Therefore, the difficulty of development of shale oil reservoir is due to the extremely small pore-throat radius.
(2) The permeability predicted by both effects of pressure differential and diffusion in nanopores is greater than that under the pressure differential. The calculated permeability considering diffusion was 0.000124 mD, while the calculated permeability without diffusion was 0.0000531 mD. Considering the mass transfer by diffusion, the calculated permeability was basically consistent with the experimental results.
(3) The oil–water relative permeability of the Gulong shale oil reservoir was calculated through the quasi-static two-phase pore network simulation. The irreducible water saturation predicted by PNM was about 0.4, and the residual oil saturation predicted by PNM was about 0.35.

Author Contributions

Conceptualization, Q.W.; methodology, Z.J.; software, Z.J.; validation, Q.W.; formal analysis, F.Q.; investigation, D.D.; resources, F.Q.; data curation, Y.L.; writing-original draft preparation, Z.J.; writing—review and editing, P.J.; visualization, Q.W.; supervision, L.C.; project administration, B.L.; funding acquisition, B.L. All authors have read and agreed to the published version of the manuscript.

Funding

This research was funded by the CNPC Major Technology Project “Theory and Key Technologies of Exploration and Development of Daqing Gulong Shale Oil”, Topic 2 “Theory and Key Technologies of Beneficial Development of Gulong Shale Oil”, grant number 2021ZZ10-02.

Data Availability Statement

Not applicable.

Conflicts of Interest

The authors declare no conflict of interest.

Nomenclature

ACross-sectional area of the network model, m2
DKKnudsen diffusion coefficient, m2/s
DFFick diffusion coefficient, m2/s
DTTransition diffusion coefficient, m2/s
dEquivalent pore-throat diameter, m
gijConductivity
gp,ijEffective conductivity of p phase
KnKnudsen number
kBBoltzmann constant, 1.3806488 × 10⁻²³ J/K
kabsAbsolute permeability, mD
kpEffective permeability of p phase, mD
krpRelative permeability of p phase
LLength of pore network model, m
LijDistance between pore i and adjacent pore j
NiThe number of pores connected to pore i
pThe differential pressure at both ends of the network model, Pa
pi, pjPore pressure of numbered i, j
Pp,i, Pp,jThe pore i and p phase fluid pressure in j
QThe outlet or inlet flow of the network model, m3/s
qFlow into or out of the pore
MMolecular molar mass, g/mol
RIdeal gas constant, 8.314462 J/(mol·K)
SwWater saturation of the pore network model
VVolume of pore network model, m3
λMean free path, m
δCollision diameter of molecule, m

References

  1. Dou, W.; Liu, L.; Jia, L. Pore structure, fractal characteristics and permeability prediction of tight sandstones: A case study from Yanchang Formation, Ordos Basin, China. Mar. Pet. Geol. 2021, 123, 104737. [Google Scholar] [CrossRef]
  2. Jia, Z.; Cheng, L.; Feng, H. Full composition numerical simulation of CO2 utilization process in shale reservoir using projection-based embedded discrete fracture model (pEDFM) considering nano-confinement effect. Gas Sci. Eng. 2023, 111, 204932. [Google Scholar] [CrossRef]
  3. Noiriel, C.; Seigneur, N.; Le Guern, P. Geometry and mineral heterogeneity controls on precipitation in fractures: An X-ray micro-tomography and reactive transport modeling study. Adv. Water Resour. 2021, 152, 103916. [Google Scholar] [CrossRef]
  4. Lai, J.; Wang, G.; Wang, Z. A review on pore structure characterization in tight sandstones. Earth-Sci. Rev. 2018, 177, 436–457. [Google Scholar] [CrossRef]
  5. Hasnan, H.K.; Sheppard, A.; Hassan, M.H. Digital core analysis: Characterizing reservoir quality through thin sandstone layers in heterolithic rocks. J. Appl. Geophys. 2020, 182, 104178. [Google Scholar] [CrossRef]
  6. Hasnan, H.K.; Sheppard, A.; Hassan, M.H. Digital core analysis: Improved connectivity and permeability characterization of thin sandstone layers in heterolithic rocks. Mar. Pet. Geol. 2020, 120, 104549. [Google Scholar] [CrossRef]
  7. Lv, W.; Chen, S.; Gao, Y. Evaluating seepage radius of tight oil reservoir using digital core modeling approach. J. Pet. Sci. Eng. 2019, 178, 609–615. [Google Scholar] [CrossRef]
  8. Ettemeyer, F.; Lechner, P.; Hofmann, T. Digital sand core physics: Predicting physical properties of sand cores by simulations on digital microstructures. Int. J. Solids Struct. 2020, 188–189, 155–168. [Google Scholar] [CrossRef]
  9. Venkatarangan, W. Investigating 3D geometry of porous media from high resolution images. Phys. Chem. Earth Part A Solid Earth Geod. 1999, 24, 593–599. [Google Scholar] [CrossRef]
  10. Tan, M.; Su, M.; Liu, W. Digital core construction of fractured carbonate rocks and pore-scale analysis of acoustic properties. J. Pet. Sci. Eng. 2021, 196, 107771. [Google Scholar] [CrossRef]
  11. Xiong, Q.; Baychev, T.G.; Jivkov, A.P. Review of pore network modelling of porous media: Experimental characterisations, network constructions and applications to reactive transport. J. Contam. Hydrol. 2016, 192, 101–117. [Google Scholar] [CrossRef]
  12. Xu, Z.; Lin, M.; Jiang, W. Rapid multiscale pore network modeling for drainage in tight sandstone. J. Pet. Sci. Eng. 2021, 204, 108682. [Google Scholar] [CrossRef]
  13. Yi, Z.; Hu, S.; Wu, S. Pore network extraction for shale gas flow in nanoporous media. Mar. Pet. Geol. 2021, 126, 104896. [Google Scholar] [CrossRef]
  14. Meng, Z.; Sun, W.; Liu, Y. Effect of pore networks on the properties of movable fluids in tight sandstones from the perspective of multi-techniques. J. Pet. Sci. Eng. 2021, 201, 108449. [Google Scholar] [CrossRef]
  15. El-Zehairy, A.A.; Nezhad, M.M.; Joekar-Niasar, V. Pore-network modelling of non-Darcy flow through heterogeneous porous media. Adv. Water Resour. 2019, 131, 103378. [Google Scholar] [CrossRef]
  16. Ahmad, F.; Talbi, M.; Prat, M. Non-local equilibrium continuum modeling of partially saturated drying porous media: Comparison with pore network simulations. Chem. Eng. Sci. 2020, 228, 115957. [Google Scholar] [CrossRef]
  17. Rodríguez de Castro, A.; Goyeau, B. A pore network modelling approach to investigate the interplay between local and Darcy viscosities during the flow of shear-thinning fluids in porous media. J. Colloid Interface Sci. 2021, 590, 446–457. [Google Scholar] [CrossRef] [PubMed]
  18. Yin, X.; Zhang, J. An improved bounce-back scheme for complex boundary conditions in lattice Boltzmann method. J. Comput. Phys. 2012, 231, 4295–4303. [Google Scholar] [CrossRef]
  19. Matsuyama, T.; Abe, T.; Yamamoto, H. Lattice Boltzmann method study of Rayleigh instability of a charged droplet. Adv. Powder Technol. 2007, 18, 93–104. [Google Scholar] [CrossRef]
  20. Pribec, I.; Hubman, A.; Urbic, T. A discrete reactive collision scheme for the lattice Boltzmann method. J. Mol. Liq. 2021, 332, 115871. [Google Scholar] [CrossRef]
  21. Wilde, D.; Krämer, A.; Bedrunka, M. Cubature rules for weakly and fully compressible off-lattice Boltzmann methods. J. Comput. Sci. 2021, 51, 101355. [Google Scholar] [CrossRef]
  22. Shams, M.; Raeini, A.Q.; Blunt, M.J. A numerical model of two-phase flow at the micro-scale using the volume-of-fluid method. J. Comput. Phys. 2018, 357, 159–182. [Google Scholar] [CrossRef]
  23. Carrillo, F.J.; Bourg, I.C.; Soulaine, C. Multiphase flow modeling in multiscale porous media: An open-source micro-continuum approach. J. Comput. Phys. X 2020, 8, 100073. [Google Scholar] [CrossRef]
  24. Sengupta, A.; Adhikari, J. Fluid phase equilibria of triangle-well fluids confined inside slit pores: A transition matrix Monte Carlo simulation study. J. Mol. Liq. 2016, 221, 1184–1196. [Google Scholar] [CrossRef]
  25. Karki, S.; Chakraborty, S.N. A Monte Carlo simulation study of hydrogen adsorption in slit-shaped pores. Microporous Mesoporous Mater. 2021, 317, 110970. [Google Scholar] [CrossRef]
  26. Ryazanov, A.V.; Dijke, M.I.; Sorbie, K.S. Two-Phase Pore-Network Modelling: Existence of Oil Layers During Water Invasion. Transp. Porous Media 2009, 80, 79–99. [Google Scholar] [CrossRef]
  27. Høiland, L.K.; Spildo, K.; Skauge, A. Fluid flow properties for different classes of intermediate wettability as studied by network modelling. Transp. Porous Media 2007, 70, 127–146. [Google Scholar] [CrossRef]
  28. Piri, M.; Blunt, M.J. Three-dimensional mixed-wet random pore-scale network modeling of two- and three-phase flow in porous media. I. Model description. Phys. Rev. E Stat. Nonlin. Soft Matter Phys. 2005, 71, 026301. [Google Scholar] [CrossRef]
  29. Piri, M.; Blunt, M.J. Three-dimensional mixed-wet random pore-scale network modeling of two- and three-phase flow in porous media. II. Results. Phys. Rev. E Stat. Nonlin. Soft Matter Phys. 2005, 71, 026302. [Google Scholar] [CrossRef] [Green Version]
  30. Valvatne, P.H.; Blunt, M.J. Predictive pore-scale modeling of two-phase flow in mixed wet media. Water Resour. Res. 2004, 40, W07406. [Google Scholar] [CrossRef] [Green Version]
  31. Bakke, S.; Øren, P.E. 3-D Pore-Scale Modelling of Sandstones and Flow Simulations in the Pore Networks. SPE J. 1997, 2, 136–149. [Google Scholar] [CrossRef] [Green Version]
  32. Bryant, S.; Blunt, M. Prediction of relative permeability in simple porous media. Phys. Rev. A 1992, 46, 2004–2011. [Google Scholar] [CrossRef] [PubMed]
  33. Ryazanov, A.; Dijke, M.V.; Sorbie, K. Pore-network Prediction of Residual Oil Saturation Based on Oil Layer Drainage in Mixed-wet Systems. In Proceedings of the SPE Improved Oil Recovery Symposium, Tulsa, OK, USA, 24–28 April 2010. [Google Scholar] [CrossRef]
  34. Joekar-Niasar, V.; Prodanović, M.; Wildenschild, D. Network model investigation of interfacial area, capillary pressure and saturation relationships in granular porous media. Water Resour. Res. 2010, 46, W06526. [Google Scholar] [CrossRef] [Green Version]
  35. Jones, F.O.; Owens, W.W. A Laboratory Study of Low-Permeability Gas Sands. J. Pet. Technol. 1980, 32, 1631–1640. [Google Scholar] [CrossRef]
  36. Tian, X.; Cheng, L.; Cao, R. A new approach to calculate permeability stress sensitivity in tight sandstone oil reservoirs considering micro-pore-throat structure. J. Pet. Sci. Eng. 2015, 133, 576–588. [Google Scholar] [CrossRef]
  37. Valvatne, P.H.; Piri, M.; Lopez, X. Predictive Pore-Scale Modeling of Single and Multiphase Flow. Transp. Porous Media 2005, 58, 23–41. [Google Scholar] [CrossRef]
  38. Zheng, D.; Reza, Z. Prediction of pore-scale transport properties in unconventional reservoirs using novel theoretical dendroidal pore-network model. J. Pet. Sci. Eng. 2018, 170, 712–720. [Google Scholar] [CrossRef]
  39. Tian, X.; Daigle, H. Permeability prediction from a pore-scale network model constrained by low-pressure nitrogen sorption isotherms. J. Pet. Sci. Eng. 2018, 162, 554–566. [Google Scholar] [CrossRef]
  40. Azarafza, A.; King, A.J.; Mead-Hunter, R. Prediction of residual saturation and pressure drop during coalescence filtration using dynamic pore network model. Sep. Purif. Technol. 2021, 254, 117588. [Google Scholar] [CrossRef]
  41. Merey, Ş. Prediction of transport properties for the Eastern Mediterranean Sea shallow sediments by pore network modelling. J. Pet. Sci. Eng. 2019, 176, 403–420. [Google Scholar] [CrossRef]
  42. Dakhelpour-Ghoveifel, J.; Shahverdi, H. Prediction of gas-oil capillary pressure of carbonate rock using pore network modeling. J. Pet. Sci. Eng. 2020, 195, 107861. [Google Scholar] [CrossRef]
  43. Dias, M.M.; Wilkinson, D. Percolation with trapping. J. Phys. A Math. Gen. 1986, 19, 3131–3146. [Google Scholar] [CrossRef]
  44. Knackstedt, M.A.; Sahimi, M.; Sheppard, A.P. Invasion percolation with long-range correlations: First-order phase transition and nonuniversal scaling properties. Phys. Rev. E 2000, 61, 4920–4934. [Google Scholar] [CrossRef] [PubMed] [Green Version]
  45. Wilkinson, D.; Willemsen, J.F. Invasion percolation: A new form of percolation theory. J. Phys. A Math. Gen. 1983, 16, 3365–3376. [Google Scholar] [CrossRef]
  46. Broadbent, S.R.; Hammersley, J.M. Percolation processes: I. Crystals and mazes. Math. Proc. Camb. Philos. Soc. 1957, 53, 629–641. [Google Scholar] [CrossRef]
  47. Dullien, F.A.L. New network permeability model of porous media. Aiche J. 1975, 21, 299–307. [Google Scholar] [CrossRef]
  48. Lenormand, R.; Zarcone, C.; Sarr, A. Mechanisms of the displacement of one fluid by another in a network of capillary ducts. J. Fluid Mech. 1983, 135, 337–353. [Google Scholar] [CrossRef] [Green Version]
  49. Oak, M.J.; Baker, L.E.; Thomas, D.C. Three-Phase Relative Permeability of Berea Sandstone. J. Pet. Technol. 1990, 42, 1054–1061. [Google Scholar] [CrossRef]
  50. Øren, P.E.; Pinczewski, W.V. Fluid distribution and pore-scale displacement mechanisms in drainage dominated three-phase flow. Transp. Porous Media 1995, 20, 105–133. [Google Scholar] [CrossRef]
  51. Blunt, M.J. Effects of Heterogeneity and Wetting on Relative Permeability Using Pore Level Modeling. SPE J. 1997, 2, 70–87. [Google Scholar] [CrossRef]
  52. Blunt, M.J. Physically-based network modeling of multiphase flow in intermediate-wet porous media. J. Pet. Sci. Eng. 1998, 20, 117–125. [Google Scholar] [CrossRef]
  53. Øren, P.; Bakke, S.; Arntzen, O.J. Extending Predictive Capabilities to Network Models. SPE J. 1998, 3, 326–336. [Google Scholar] [CrossRef]
  54. VOGEL, J.H. Morphological determination of pore connectivity as a function of pore size using serial sections. Eur. J. Soil Sci. 2008, 48, 365–377. [Google Scholar] [CrossRef]
  55. Vogel, H.J. A numerical experiment on pore size, pore connectivity, water retention, permeability, and solute transport using network models. Eur. J. Soil Sci. 2000, 51, 99–105. [Google Scholar] [CrossRef]
  56. Blunt, M.J.; Jackson, M.D.; Piri, M. Detailed physics, predictive capabilities and macroscopic consequences for pore-network models of multiphase flow. Adv. Water Resour. 2002, 25, 1069–1089. [Google Scholar] [CrossRef]
  57. Chen, M.; Cheng, L.; Wang, X. Pore network modelling of fluid flow in tight formations considering boundary layer effect and media deformation. J. Pet. Sci. Eng. 2019, 180, 643–659. [Google Scholar] [CrossRef]
  58. Jia, Z.; Cheng, L.; Zhou, J. Upscaling simulation method of fluid flow for fracturing-shut in-flowback-production process in tight oil reservoirs: Hysteresis effects of capillary pressure and relative permeability. Geoenergy Sci. Eng. 2023, 226, 211792. [Google Scholar] [CrossRef]
  59. Cai, J.; Lin, D.; Singh, H.; Zhou, S.; Meng, Q.; Zhang, Q. A simple permeability model for shale gas and key insights on relative importance of various transport mechanisms. Fuel 2019, 252, 210–219. [Google Scholar] [CrossRef]
  60. Sun, L.; Cui, B.; Zhu, R.; Wang, R.; Feng, Z.; Li, B.; Zhang, J.; Gao, B.; Wang, Q.; Zeng, H.; et al. Shale oil enrichment evaluation and production law in Gulong Sag, Songliao Basin, NE China. Pet. Explor. Dev. 2023, 50, 505–519. [Google Scholar] [CrossRef]
Figure 1. FIB-SEM image results of Gulong shale core.
Energies 16 05424 g001
Figure 2. Reconstructed digital core and extracted pore network model. (a) Pore structure extracted by binarization method; (b) pore network model extracted by pore-centered axis method and the maximum sphere method.
Energies 16 05424 g002
Figure 3. Fluid flowing through a pore and conductance between two neighboring pores. (a) Fluid flowing through a pore; (b) conductance between two neighboring pores [57].
Energies 16 05424 g003
Figure 4. Various flow regimes and diffusion types depending on Knudsen number.
Energies 16 05424 g004
Figure 5. Probability density function of pore-throat parameters. (a) Pore radius distribution; (b) throat radius distribution; (c) coordination number distribution; (d) shape factor distribution. Pdf represents the probability density function and Cdf represents the cumulative distribution function.
Energies 16 05424 g005
Figure 6. Flow rate–differential pressure curve. The blue line means that diffusion mass transfer is considered, and the red line means that diffusion mass transfer is not considered.
Energies 16 05424 g006
Figure 7. Distribution of oil and water in the pore network model under different water saturation conditions. Blue represents water and red represents oil. (a) 40% Sw; (b) 45% Sw; (c) 50% Sw; (d) 55% Sw; (e) 60% Sw; (f) 65% Sw.
Energies 16 05424 g007aEnergies 16 05424 g007b
Figure 8. Relative permeability curve of Gulong shale oil reservoir calculated by the quasi-static two-phase pore network flow simulation.
Energies 16 05424 g008
Table 1. Parameters used in pore network flow simulation.
Parameter TypesSimulation ParameterUnitValue
Basic pore-throat ParametersPore number/8717
Throat number/18,494
Initial temperature°C137
Initial pressureMPa37.5
Single-phase flow parametersGas viscositymPa·s0.02
Collision diameterm3 × 10−10
Molecular molar massg/mol28
Two-phase flow parametersOil densityg/cm30.7
Water densityg/cm31
Oil viscositymPa·s0.5
Water viscositymPa·s1
Oil–water contact angle°60
Oil–water interfacial tensionmN/m20
Table 2. Model validation results.
ParametersUnitsPhysical ExperimentsExperiments by Sun et al. [60]Pore Network Model
Effective Porosity%8.298.4~9.17.96
PermeabilitymD0.0020.001~0.050.00124
Disclaimer/Publisher’s Note: The statements, opinions and data contained in all publications are solely those of the individual author(s) and contributor(s) and not of MDPI and/or the editor(s). MDPI and/or the editor(s) disclaim responsibility for any injury to people or property resulting from any ideas, methods, instructions or products referred to in the content.

