Abstract
The current study is focused on how varying injection pressure in the fuel supply system of multi-point injection systems can improve fuel atomization and injection jet range. The aim is to achieve a more efficient mix dosage, thus improving combustion and reducing exhaust emissions. In addition, it is intended to develop a characterization of the injection actuators, specifically the injectors, through a series of tests in which the injector pressure, engine speed and injection pulse are modified. To carry out these tests, a heuristic testing technique, like the empirical approach, was implemented, and a mobile device was used to capture the spray frames of the injectors. These data were then used to generate a correlation model between injection and spray angles, considering 0.5 bar pressure variation intervals within the established ranges. This approach made it possible to visualize and record the behavior of the spray in the injector, including the spray angle, the injected fuel flow rate and the working pressure during the operation process. Following the guidelines established in the proposed methodology, a significant result was obtained by varying the pressure at 5 bar and with an injection pulse of 2 ms. In this case, a flow reduction of 66 mL of the injected fluid was achieved, which corresponds to a significant reduction in fuel consumption. Additionally, a spray angle of 10.48° was observed with optimized atomization. These results were verified on vehicles with similar injection systems by testing on the GT-600-PRO injection test bench. In summary, this study shows that by varying the injection pressure and optimizing other parameters, it is possible to achieve a significant reduction in fuel consumption and improve fuel atomization in multipoint injection systems. These findings have a significant impact on the Ecuadorian vehicle fleet and provide a scientific approach to improving fuel efficiency and performance.
1. Introduction
At present, there is an inherent focus on the analysis of fuel consumption, with the aims of directly reducing emissions for each kilometer of vehicle circulation, reducing economic expenditures by having more efficient vehicles in injection systems and constantly improving of the quality of fuels.
Several alternatives to improve consumption are based on the behavior of combustion. In the study of L. Cervera et al. [1], combustion in the engine has several important factors to analyze, such as fuel consumption, emissions [2,3] and environmental impact [4], in addition to the noise caused by the power through which the engine passes [5]. To this end, several companies are currently engaged in producing vehicles with lower wear and greater reliability and efficiency [6,7]. As a result, multipoint injection (MPI) systems have been significantly developed in the automotive industry due to their ability to inject fuel directly into each cylinder of an engine with an ideal working pressure [8]. Thus, to ensure their maximum optimization, ongoing research predetermines that the pressures are controlled, respectively, at 0.8 MPa and 0.7 MPa, adjusting the pressure regulators to obtain the difference in fuel and air pressure in ranges of 0.1 MPa, respectively [9].
However, assuming the specified information, the systematization of variables in experimental tests for an injector is designed to achieve different objectives, such as the pressure in the fuel injector and the changes in its structure during the injector measurement operation to achieve optimized results [10]. On the other hand, the final context of our possible volatility factors will be parameterized by various empirical variables, using the injector bank as a primary analytical tool [11]. In addition, research related to this topic shows a hegemony in assistance by controlling the injection pulse [12], making the injector better atomize the fuel during the injection phase. On the other hand, the fuel injection time depends on different fuel characteristics such as density, volume modulus and kinematic viscosity [13]. However, Y. so Yu et al. [14] shows that the injection time varies its durability depending on the calorific value of the fuel, since having more calories causes combustion to generate greater thrust force in the working phase of the engine.
The operation of the fuel injection system and its impact on pressure changes, as does obtaining adequate performance in the duty cycle of the internal combustion engine [15]. The variation of the characteristics of pressure and especially of pulverization generate alterations in the scope of the jet in the processes of a combustion engine of direct injection, generating a significant alteration in the process of combustion [16]. The injector is the most important component in this analysis test, as it will allow us to evaluate its spent fuel supply efficiency and how it evolves quantitatively at different operating pressures [17] as well as the different options it will present in the fuel consumption simulation [18]. The efficiency and speed of combustion depend on the process of mixing and fuel injection [19], for which the behavior of combustion must also be analyzed according to the characteristics of the mixture and dosing of fuel in its reaction processes, altering the parameters of spraying and pressure as performed by Liu X. et al. [20].
It is important to ensure that the injector is in good working order to avoid contamination or wear of the nozzle, as well as poor spraying, which causes losses of power, thrust torque, overheating, ignition and increased fuel consumption. In severe cases, it can damage the electrons in the spark plug [21]. In some studies, various methods can be found to improve fuel consumption and increase SIE power through various technologies, such as variable valve control [22], modified compression ratio [23], thermal management [24] and combined spray technology [25], among others with advantages and excellent results. In this sense, it is essential to identify the behavior of the fuel injection pressure when spraying, since adding these variables will mean a significant decrease in the output flow of the injector in study tests.
According to a lot of the investigations, when injecting fuel into the engine, various problems will occur that hinder its power and development due to insufficient pressure and injection distance [16,26]. The work guide made by Schrödinger et al. [27] examines the effect of fuel injection time on the flame shape and stability position and also shows parameters of variability in combustion in the process of ignition of the mixture as performed by Liu X. et al. [20]. However, the main objective of the synthesis study will be to change the injection pressure to increase the jet range for better range at the intake valve inlet of the engine and the atomization of the fuel to generate better dosing of the air–fuel mixture.
2. Materials and Methods
2.1. Experimental Setup
2.1.1. Injector Bench
In this research, the GT-600-PRO injector bench is used as a technical resource to collect the necessary data. This kit works like a vehicle in that it supplies pressure to the different injectors and uses a test fluid to check its shape, flow and spray angle.
It is essential to make sure that the fluid used in these tests meets the required specifications in terms of density and flammability. This is because the fluid not only serves as a lubricating element to prevent the pump from rusting during the operation process but also plays an important role in contrasting the injector characteristics.
Concerning this information, Figure 1 provides an overview of the injector bank used in this study. In addition, Table 1 details the operating capacity and other relevant characteristics associated with the GT-600-PRO injector bank.
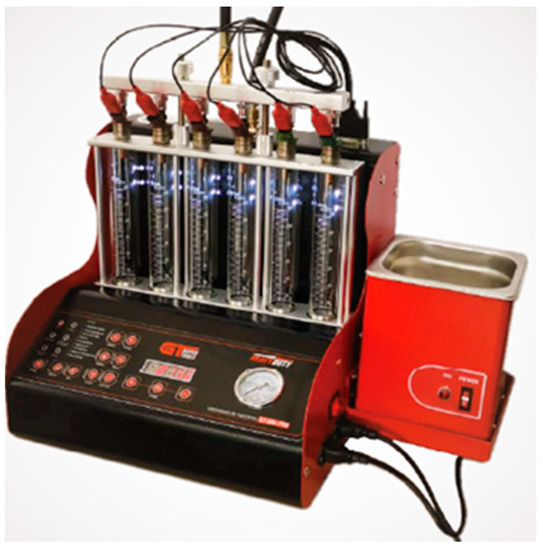
Figure 1.
Injection bench.

Table 1.
Technical characteristics of the injector bank.
The use of this technical equipment is essential to carry out the necessary tests and obtain the data required in the investigation. It provides a reliable and accurate tool to evaluate the performance and characteristics of injectors, contributing to a more complete and scientific analysis of fuel injection in-vehicle power systems.
The GT-600-PRO bench is internally made up of several components that allow for injector tests. These components include a fuel feed pump to supply fuel to the injectors to be tested, a manometer that shows the pressure in a range of 0 to 10 bar, a pressure variation that allows the pressure to be adjusted in the range of 0 to 10 bar, a fuel tank and a control panel that allows control of key test parameters.
The control panel makes it easy to adjust injection pressure, injection pulse (the length of time the injector is activated to inject fuel), engine revolutions per minute and different working ranges, such as engine speed idling (750 min−1), half load (2500 min−1) and full load (4000 min−1) during acceleration.
Additionally, graduated specimens numbered from 0 to 120 mL are used to control and measure the volume of injection mass. These specimens allow you to have precise control over the amount of fuel injected during testing.
In summary, the GT-600-PRO bench has a series of components and devices that allow testing on injectors. These components include a feed pump, pressure gauge, pressure regulator, fuel tank and control panel. Additionally, graduated specimens are used to control and measure the volume of shot mass during testing.
2.1.2. Injectors
The injector for this research is from the Hyundai Sonata NF 2008 G2.0 35310-25200 engine (Hyundai, Seoul, Republic of Korea). From another point of view, the injector used is common for several models of car engines such as Kia and Hyundai, which use Denso indirect injection systems. The type of injector is a 12-volt DC solenoid; the specifications are given in Table 2.
Table 2.
Technical sheet of injectors.
Table 3 shows the characteristics of the electrical consumption of the injectors during the working conditions established in the tests.
Table 3.
Injector current draw at different speeds.
In Figure 2 you can see the diameter of the holes of the injectors to be used, which is 150 μm, while in Figure 3, the number of injector holes is shown, which, in the operational stages of the tests, will not influence the characterization of the results, since the injection specifications are used in most injectors of the range of vehicles from pressure ranges 3.5 to 4 bar, respectively.
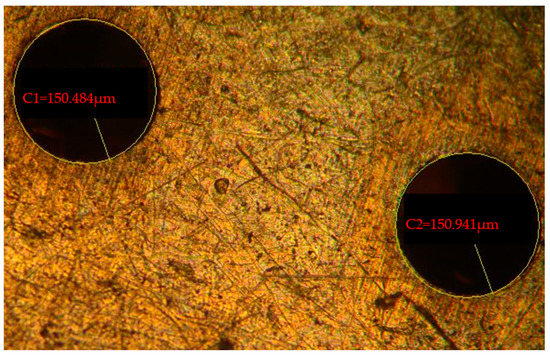
Figure 2.
Injector hole diameter.
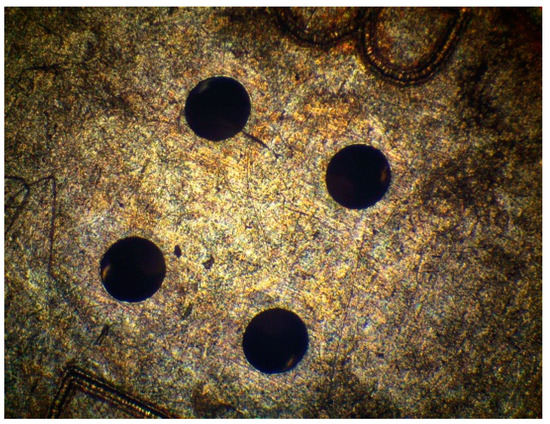
Figure 3.
Number of injector holes.
2.1.3. Experimental Design
The entire experimental process was carried out according to the working characteristics performed by an ignition internal combustion engine caused by the indirect fuel injection system of the Hyundai Sonata NF 2008 G2.0 engine with a pressure range of 3.5 bar of constant work without pressure regulation, as identified in the operating diagram of Figure 4.
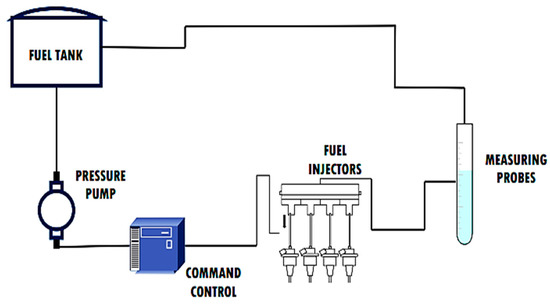
Figure 4.
Operating Diagram.
During the operation process of the different variables, the aforementioned injector bank was used as the main tool. In this bank of injectors (GT-600-PRO), the variability of the characteristics of the fuel injection rate was carried out following the operation specifications detailed in Table 1.
It is important to highlight that, to carry out this type of test, the NTE INEN OIML R117-1 standard was followed as a technical reference. This standard establishes the requirements and precision criteria for measurement systems used in performance tests. According to this standard, the maximum admissible error, depending on the 0.5 precision class, for measurement systems in performance tests is 0.3% in the maximum admissible range and 0.5% in case of failures. These were significant in the different measurement trials.
By following these guidelines and technical standards, the accuracy and reliability of the results obtained during data collection at the injector bench are guaranteed. This ensures that the measurements made are consistent and comply with the quality standards established for this type of testing in the field of fuel injection [28].
To ensure the validity and reliability of the data obtained, approximately 4 tests were performed for each variable of pressure, pulse and speed. This allowed enough data to be obtained for analysis and corroboration, as shown in Table 4.
Table 4.
Initial values of pollutant emissions.
It is important to point out that the development of this research has been carried out authentically by the current authors. This implies that the proper procedures and methodologies have been followed, the necessary equipment and resources used and accuracy in data collection and analysis ensured.
By running multiple tests and guaranteeing the authenticity of the research, the validity of the obtained results is strengthened. This provides a strong foundation for the conclusions and recommendations derived from this study. Furthermore, it allows other researchers and professionals to trust the presented findings and use them as references in future research or practical applications related to fuel injection.
2.2. Method
The present study focuses on the variation of the injection rate, verifying the change in the behavior of the measured volume according to the variety of the fundamental parameters of the injection pressure, the variety of the pulse duration, and the variety of the value of the angle of sprinkling.
In the tests carried out, the parameters of the vehicle, emissions and fuel consumption of the engine were obtained; in each test, an operation of data measured in the GT-600-PRO bank was established. The operational design in this research is based on the operating diagram in Figure 4.
Study Design
The experimental-explanatory study used in this research consisted of obtaining data from the execution of several tests with specifications that compare constant variables to determine the causes and effects provided by the modifications made to the engine injection system [29]. Considering the previous premise, it is important to verify that in most of the institutional evaluation processes of the universities, research by experimental processes is considered a very important aspect of the integral development of society and is considered important to include as another function within the global evaluation of the institution as a requirement for different technical careers [30].
The characterization of the experimental study is based on the modification of the injection pressure characteristics (bar), energization time (ms) and motor speed range (min−1). The objective is to determine the optimum working range for spraying, thus allowing the maintenance of efficient operation and reducing fuel consumption thanks to a better dosage of the mixture.
In summary, a detailed analysis of how changes in injection pressure, energization time and engine speed affect fuel atomization is carried out. The main focus is to find the optimal balance that guarantees optimal performance and a decrease in fuel consumption through precise proportioning of the fuel mixture.
2.3. Experimental Conditions
2.3.1. Measurement Protocol
In this context, a measurement protocol has been created that is crucial to conduct research effectively. A graphical representation of this protocol has been developed in Figure 5, which shows the stages and steps necessary to perform the measurements properly.
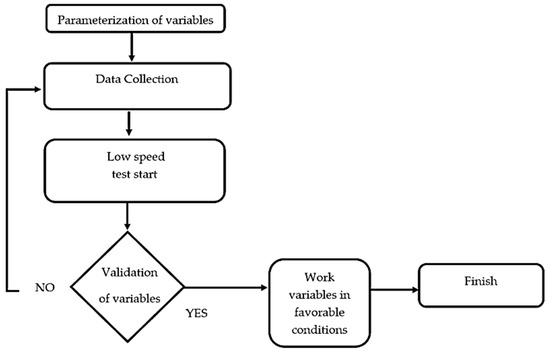
Figure 5.
Flow diagram.
The correct implementation of this measurement protocol is essential to guarantee the obtaining of reliable data, which are reflected in the aforementioned Table 4. Figure 5 provides a clear and detailed visual guide of how the measurements should be carried out at each stage of the process.
By following the measurement protocol outlined in Figure 5, you ensure consistency and accuracy in data collection. This allows consistent and reliable results to be obtained, which is essential for the analysis and conclusions of the investigation.
In summary, the graphical schematization of the measurement protocol, represented in Figure 5, is a crucial tool to ensure the correct execution of the measurements in the study. Following this protocol, reliable and consistent data is obtained, which is essential to support the findings and conclusions of the study.
In addition, the research process described is intended to make a compilation of all the angles obtained in the series of experimental tests through photographs that allow us to capture the evolution of the fuel jet and the shape of the fuel spray with the help of the injector bank as expressed in Figure 6a,b.
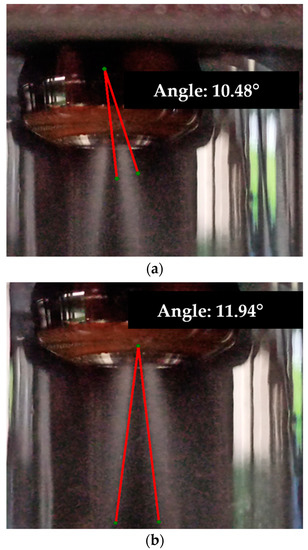
Figure 6.
Angles injector in parameters 3.5 bar, pulse 5 ms, 750 min−1: (a) Spray angle; (b) injection angle.
Therefore, to obtain the spray and injection angle, IC Measure software was used, which allows the capture of frames through the images reached to capture the operating angle performed by the injector in the work process of the configured low-speed parameters.
2.3.2. Data Logging
To start this process, the Hyundai type 35310-25200 solenoid injector found in the Hyundai Sonata NF 2008 G2.0 engine was used. This injector has detailed specifications, which are presented in Table 3.
The Hyundai type 35310-25200 solenoid injector is the starting point of this research and was selected due to the specific characteristics that make it relevant to the study. Table 3 provides precise information on the technical and functional specifications of this particular injector, which helps one understand its performance and capability in the context of the fuel injection process.
By using this specific injector as a starting point, researchers can obtain more accurate and relevant data for analysis and evaluation. This allows a deeper understanding of the injection characteristics and, in turn, contributes to the research objectives in terms of optimizing fuel consumption and improving mixture metering.
In summary, the Hyundai 35310-25200 type solenoid injector, present in the Hyundai Sonata NF 2008 G2.0 engine, is used as the initial basis for this research. Its characteristics and specifications, detailed in Table 3, are fundamental to the analysis and results obtained in the study.
Additionally, it is vitally important to establish an optimal comparison range considering our type of experimental methodology.
- In this case, each test is performed at a single speed, considering a range of variability of 750 min−1 as the initial range to 3000 min−1 as the final speed range.
- On the other hand, according to the technical reports visualized in the previous sections, in this test different operating pressures are applied concerning the injector, which consisted of increasing by 0.5 bar for each pressure and parameterizing a regime of 2 bar as a start and 9 bar as the final pressure value.
- Instead, the injection pulse is set in the already established data whose determination ranges from 0.8 ms to 5 ms in ranges of variability, with consecutive increases of 0.2 ms pulses as the test progressively increases.
Specifically, the allowances described above are carried out during 4 current tests to obtain values with a consistent level of criticality that allow us to identify 90% affirmative values in our mathematical model.
In this way, the tests carried out are executed at idle, establishing 1500 min−1 and 3000 min−1 as the maximum acceleration condition [31], because, due to stress load conditions, the engine reaching 3000 min−1 is at half workload and is the optimal maximum point of fuel consumption from our academic perspective.
Therefore, following the guidelines described in the previous paragraph, the data obtained in Table 4 are visualized; their importance is paramount for the execution of the models described in the subsequent section.
In this study, the parameter of 3.5 bar is selected as an exemplary value of initiation, since usually the actual operating values in a low-pressure injection system work in a range where fuel works at a range of 6 bar of pressure in the mixture that is formed outside the cylinder injecting and in the part of air at a pressure of 5.5 bar [32].
The pre-mix is transformed into a combustion chamber by the existing mechanical valve, with mechanical control or by electronic control solenoid, thus diluting the pre-mix in the engine cylinder and as a result obtaining complete combustion with fewer gas emissions.
The measurement of pollutant emissions was carried out in the standard condition of the engine, whose values are shown in Table 4.
For sampling and comparison, a total of 839 tests were carried out where the parameters mentioned in Table 5 were varied. A total of 20,800 data items were collected and analyzed through a comprehensive statistical analysis.
Table 5.
Log data obtained with the measurement protocol.
3. Results
Mathematical Model with Suggested Statistical Basis
Equation (1) allows us to recognize the injection flow values to be obtained without the use of the injector bank but with previous knowledge of the variables of speed, pulse, working pressure and spray angle. Below is the equation to be used.
Table 6 presents a brief description of the variables to be used in Equation (1), where you can see the obtaining of the injection flow (Q).
Table 6.
Variables of Equation (1).
To determine the injection flow rate, an alternative calculation model of the actual injection flow rate was generated according to the characteristics of the spray angle and injection pressure as the most substantial weight variables as shown in Figure 7, accompanied by control and dependency variables for the analysis of other types of injectors.
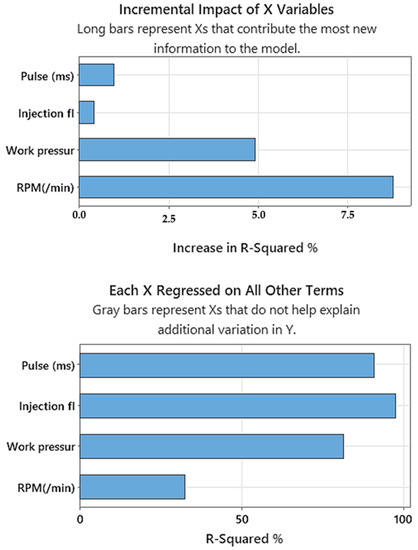
Figure 7.
Study variables relevant to spray angle.
In this study, the analysis of the results presented was performed using Minitab software version 20. This software provides a platform for data collection and evaluation, as well as the application of various basic and advanced statistical techniques.
Using Minitab, the researchers were able to perform a comprehensive analysis of the pressure, pulse and angle variables and assess their impact on the fuel injection process. The software allows them to perform statistical calculations, generate graphs, perform hypothesis tests and obtain measures of central tendency and dispersion, among other functions.
The systemization provided by Minitab makes it easy to organize and process the collected data, which in turn enables accurate and reliable results. Researchers can use the statistical functions of the software to identify patterns, make comparisons, explore correlations and perform regression analysis, among other statistical analyses.
In summary, Minitab software plays a key role in the analysis of the data and variables presented in this investigation. Its ability to perform basic and advanced statistical functions, as well as its ability to organize and systematize, allowed researchers to deepen their understanding of the results and draw significant conclusions from them.
To understand the influence of fuel atomization on the combustion process during the intake phase, dosing calculations of the air–fuel mixture were carried out. These calculations made it possible to optimize combustion, seeking to reduce associated emissions.
Proper fuel atomization is crucial to achieving a smooth and uniform air–fuel mixture in the combustion chamber. Poor spraying can result in an unbalanced mixture, which negatively affects combustion efficiency and can increase pollutant gas emissions.
Various factors, such as injection pressure, angle and spray distribution, among others, were taken into account when making the air–fuel mixture dosage calculations. These parameters were adjusted and optimized to achieve an optimal mixture that favors efficient combustion and reduces emissions.
The information obtained through these calculations provides a solid basis for understanding how fuel atomization directly affects the combustion process and the emissions generated. By optimizing the pulverization and dosage of the mixture, it is possible to improve combustion efficiency and reduce polluting emissions to the level specified in the book of F. Payri [33] and J. Soriano [34].
Air to fuel ratio (dose of mixture):
Stochiometric dose:
Relative or efficient air dosing:
Inlet pressure:
where ma is the mass of air, mf is the mass of fuel, A is the dosing of the mixture, Ae is the stochiometric dose and lambda is the relative dosing of air.
Through the tabulation of data obtained in the injector bank, it was observed that the original injection of the Hyundai Sonata NF 2008 G2.0 engine, in injector spray phases, acts at a pressure of 3.5 bar and a pulse of 2.2 ms, at different speeds; different injection flow filling is obtained, as shown in Table 7.
Table 7.
Comparison flow injection original.
In this way, in each variation of speed at the time of accelerating and reaching a pulse of 5 ms in the original injection in which the engine normally works, it can be determined that the injection flow obtains the values shown in Table 8.
Table 8.
Comparison flow injection pulse five original.
Therefore, it can be determined that when there is a higher pressure with a pulse either the same or lower, the injection flow will increase or will remain in a similar range, all depending on the pressure levels at which the injector is kept working. An example is the pressure of 5 bar to a pulse of 2 ms, which is less than the normal pulse operated in the injector, as indicated in Table 9.
Table 9.
Comparison flow injection pulse two with the pressure of 5 bar.
On the other hand, various comparisons are interpreted, such as the injection flow rate with the pulse, as expressed in Figure 8, indicating how the flow rate progressively increases when the pulse increases slightly.
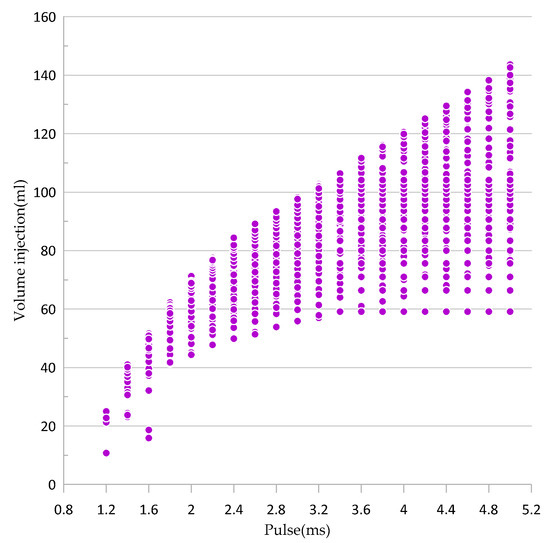
Figure 8.
Volume injection vs. pulse.
Analyzing the comparison between the injection flow and the RPM, the flow will increase markedly in the different variations of speeds now that there is an acceleration, both at idle and at the maximum acceleration capacity, as indicated in Figure 9. Considering the 3000 min−1, it can be noted that there is not too much injection flow compared to the other speeds, so it is understood that at this speed the injector does not inject too much fuel.
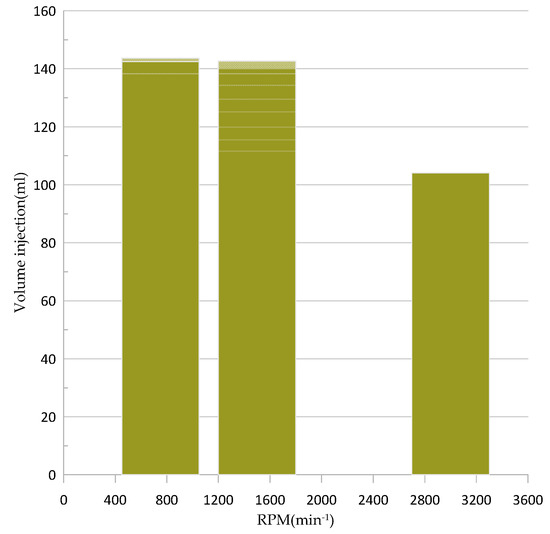
Figure 9.
Volume injection vs. min−1.
An analysis of the comparison of the injection volume with the working pressure can be seen in Figure 10. There is a decrease in the working pressure at the time of performing the test in the pressure with which the test begins; this continues the more the injection volume is granted by the injector at the time of fuel spraying.
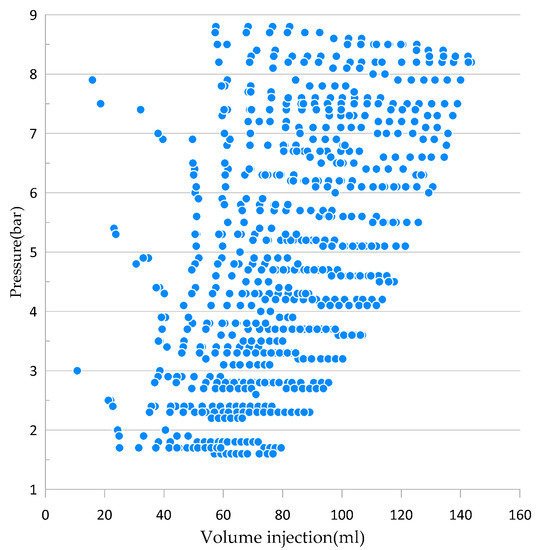
Figure 10.
Volume injection vs. pressure.
It is observed that when the injection pressure increases, the flow rate increases, so by decreasing the injection pulse to compensate for the increase in flow rate, we can establish an improvement in the reduction of the injected volume, especially when working with a pressure between 4 bar and 6 bar, to maintain the latent behavior of Figure 8 and Figure 9.
In the spray angle, an increase can be seen as the injection flow rate increases, as shown in Figure 11. But at a speed of 3000 min−1 and about a pulse of 3.4 ms, and as the pressure increases, both the injection flow rate and the spray angle remain constant.
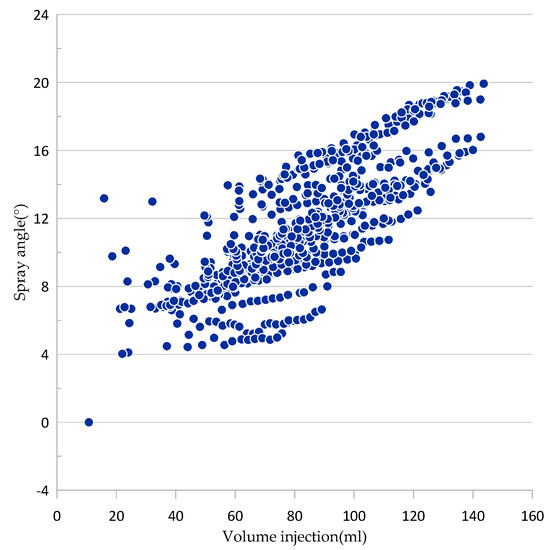
Figure 11.
Volume injection vs. spray angle.
Engine rotation speed (min−1) is a steady-state condition in the characteristics of the dashboard instrumentation panel of a vehicle which can be taken as direct reference data. The injection pulse must be analyzed using an automotive scanner, while the pressure is specific data for indirect injection engines which works for a range of 3 bar to 4 bar. On the other hand, the variable to be considered is the spray angle, which can be determined by employing a bank of injectors to analyze what the value is at normal pressure and more optimal high pressure.
4. Discussion
The results obtained in this study have allowed us to demonstrate the capacity of the model proposed in Equation (1) to determine the study injection flow of an injector. This model is based on the analysis of key variables, such as revolutions per minute (min−1), working pressure and spray angle.
Using this model, we have been able to establish a quantitative relationship between these variables and the injection flow rate. This has allowed us to understand how the different configurations of the variables influence the quantity of fuel injected per unit of time.
Including revolutions per minute as a variable allows us to consider engine operating speed, which can vary in different driving situations. The working pressure and spray angle also play a crucial role in precise fuel dosing during injection.
The results obtained through this model provide us with a valuable tool to predict and control the injection flow based on the analyzed variables. This has significant implications in the design and optimization of fuel injection systems, as it allows us to adjust and optimize these variables to achieve more efficient and precise injection.
In summary, the results of this study support the effectiveness and validity of the model proposed in Formula (1) to determine the injection flow of an injector. The analysis of the variables min−1, working pressure and spray angle has allowed us to understand and quantify the relationship between these variables and the injection flow rate, which provides key information to improve the efficiency and precision of injection systems.
When performing the equation, a balance is seen at the general level of the tabulated data and at the same time an average similarity of 100 ± 2% is observed; therefore, this value is acceptable at a comparative level as can be seen in Table 10.
Table 10.
Percent of data.
Figure 3 in the methods section provides important information supporting the validity of the method used in this study. This method is valid for four- and five-hole indirect injection injectors operating at an original pressure of 3.5 to 4 bar, which is common in current mid-range vehicles.
Figure 12 shows a comparative representation between the flow rate measured and the flow rate calculated. The results demonstrate a great similarity between these two values, which indicates the high precision obtained in this study.
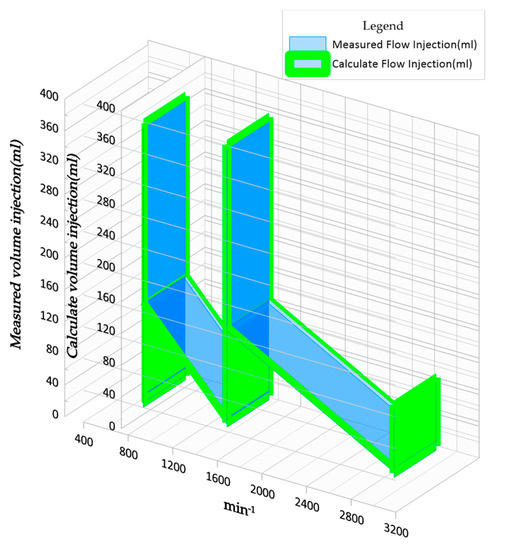
Figure 12.
Comparative of volume injection obtained vs. volume injection calculate.
These findings support the reliability and accuracy of the method used to measure and calculate the injection flow rate. The consistency between the measured and calculated values suggests that the model and the parameters used are effective for accurately estimating the injection flow in the analyzed injectors.
In summary, the results obtained and presented in Figure 12 support the validity and accuracy of the method used in this study. The comparison between the measured flow and the calculated flow shows a high similarity, indicating the reliability of the model and the data analyzed.
Usually, the mass injection flow rate is calculated with Bernoulli’s equation, considered an alternative to the proposed model, as evidenced in Equation (6).
where the number of holes is needed, the is the fuel density, the discharge coefficient is , the injector area is A and finally the pressure difference between the injection pressure minus the ambient pressure is [35].
Therefore, to obtain the discharge coefficient, the result of the relationship between the flow calculated and the flow obtained as shown in Equation (7) is taken as a reference.
Another alternative calculation involves the use of Equations (8) and (9) proposed in this section and illustrated by R. Payri et al. [35] in this work, in which he uses these equations to find the mass flow rate and the spray impulse flow, with the variable of dimensionless coefficients, fuel density and pressure difference.
Where:
Therefore:
Figure 13 shows the behavior of the injection volumes calculated using two different models. On the one hand, the model of Equation (8) is used, and on the other hand, the correlation model presented in Equation (1) is used.
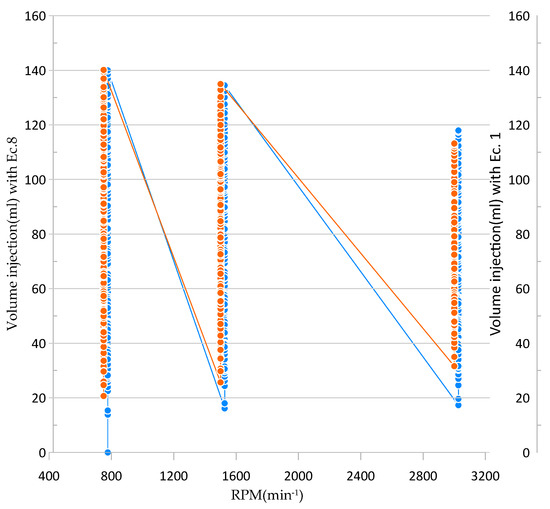
Figure 13.
Comparative of volume injection calculated Ec.8 vs. volume injection calculated Ec. 1.
This comparison makes it possible to analyze and evaluate the accuracy and performance of the two models in predicting the injection volume. Observing the behavior of the injection volumes calculated by both models provides information on their ability to accurately estimate the amount of fuel injected.
By comparing the results of both models, it is possible to determine which model best fits the data collected in the study and therefore provides better accuracy in the estimation of the injection volume. This is crucial to ensure the optimal and efficient operation of the fuel injection system.
In summary, Figure 13 shows the comparison between the injection volumes calculated using two different models: the model in Equation (8) and the correlation model in Equation (1). This analysis facilitates the accuracy and performance of both models in predicting the injection volume to be assessed, which helps to determine which model provides more accurate and reliable results.
These demonstrate the effectiveness of the research process in determining the optimum injection rate. However, due to the inclusion of multiple variables and factors, it is important to consider the need to implement each of the alternatives proposed in this study according to the specific analyses carried out by the researcher.
The investigation addressed various variables and took into account factors related to the injection rate, such as pressure, pulse, spray angle and possibly other relevant variables. Each of these variables can have a significant impact on injection flow rate and therefore it is essential to consider them properly and accurately.
It is important to highlight that the implementation of the alternatives proposed in this study must be carried out by the researcher, who must carry out the necessary analyses to assess the suitability of each alternative in the context of their specific investigation. This implies considering the objectives and particular conditions of each case study, as well as the resources and limitations available.
Consequently, the research offers a variety of alternatives and approaches to determine the optimum injection rate. However, the researcher must analyze and select the most appropriate alternatives based on his study, taking into account the relevant variables and the specific considerations of his research.
Finally, Table 11 shows the variation of emissions generated during the pressure variation process, showing a greater stability in emissions but above all a reduction in some parameters such as HC and CO2, emphasizing that when the injection pressure range is increased, emissions are altered in a direct and negative way. The data collection was carried out with calibrated equipment and, above all, in each test condition, the control and learning parameters of the injection system were reset or re-established to ensure their functionality and accuracy in the measurement of pollutant gases and fuel consumption.
Table 11.
Emission values at different pressure ranges and engine speeds.
5. Conclusions
For better optimization of fuel spraying, it was determined that the more pressure elevation and the lower the pulse, the better (or equal) range of injection flow obtained. This can be seen from the pressure of 5 bar and a pulse of 2 ms at idle speed, which reached the same flow rate as that of a normal working magnitude, that is, a pressure of 3.5 bar.
It was observed at the speed of 3000 min−1 revolutions as the maximum acceleration condition that the injection flow rate and the spray angle from a pulse of 3.4 ms normally remained constant until the test was finished at a pulse of 5 ms.
The model established for this work is considered acceptable according to the established analysis, since at the general level of the tabulation of data obtained it presented a margin of error of 100 ± 2% of efficiency.
According to the experimental development developed in the research, the results are affirmative when varying the pressure in ranges of 3.5 bar to 5 bar of work, since the angle of spraying increases progressively by varying its pulsation value in ranges of 3.4 ms to 5 ms, respectively.
In general, the technical study carried out showed in its results an injection angle of 11.92° equal at speeds from 750 min−1 to 3000 min−1; therefore, the pressure variation does not influence this variable and serves as a checking element to verify the operation of the fuel injector.
Therefore, in the research process of the article, the working pressure decreased in the first stage with values of 0.1 to 0.3 bar, and in the second stage the oscillation of working pressure was predetermined in ranges of 0.1 to 0.2 bar. In the completion stage, the values remained constant until reaching 3.6 ms as the pulse value.
To carry out future study processes, a prediction model of the spray angle according to the variation of pressure, injection pulse and working speed of the engine is necessary to determine the range of the jet and the spray generated according to the working characteristics of the MPI engines.
6. Recommendations
In the test of 3000 min−1 as a maximum condition of acceleration, it is recommended to analyze the pulses of 1.2 to 3.4 ms; this is because at pulses of smaller quantity, the injector will not have an opening, while at larger pulses the same flow, the same working pressure and the same angle of spraying will remain, as was demonstrated in this work.
It is recommended to analyze the behavior of the spray to know exactly the injection flow depending on the number of holes in an injector, since most manufacturers create injectors with different injection angles.
The spray angle and the injection angle are very important as they depend specifically on the conditions of the intake manifold diameter that allows fuel to pass through in the fuel intake process.
The working characteristics of an engine are directly influenced by the flow conditions of the intake of air and fuel in an indirect injection, which is why a fluid behavior analysis (CFD) study is important for understanding how the flow condition of the injection varies the pressure plus the airflow.
Author Contributions
Conceptualization, C.G.-G.; Methodology, V.R.-R., C.G.-G. and J.A.S.; Validation, V.R.-R., C.G.-G. and J.A.S.; Formal analysis, J.A.S.; Investigation, V.R.-R. and C.G.-G.; Resources, S.D.-E.; Data curation, S.D.-E. and C.G.-G.; Writing—original draft, S.D.-E.; Writing—review & editing, S.D.-E.; Visualization, J.A.S.; Supervision, V.R.-R. All authors have read and agreed to the published version of the manuscript.
Funding
This research received no external funding.
Acknowledgments
In memorial of the tragic death of our dear and appreciated student Ricardo Javier Guajala Agila of Salesian Polytechnic University, Ecuador.
Conflicts of Interest
The authors declare no conflict of interest.
Nomenclature
| Stoichiometric dosage | |
| Relative dosage | |
| Intake pressure | |
| Operating Parameter | |
| Atmospheric parameter | |
| MPI | Multi-Point injection |
| SIE | Spark ignition engine |
References
- Cervera, L. Analysis of the Variation of Injection Pressure to Determine the Specific Fuel Consumption in 3000cc Common Rail Engines, Chiclayo; Cesar Vallejo University: Trujillo, Peru, 2018; Available online: https://hdl.handle.net/20.500.12692/28562 (accessed on 19 February 2023).
- Lv, G.; Song, C.L.; Pan, S.Z.; Gao, J.H.; Cao, X.F. Comparison of number, surface area and volume distributions of particles emitted from a multipoint port fuel injection car and a gasoline direct injection car. Atmos. Pollut. Res. 2014, 5, 753–758. [Google Scholar] [CrossRef]
- Tuan, N.T.; Dong, N.P. Improving performance and reducing emissions from a gasoline and liquefied petroleum gas bi-fuel system based on a motorcycle engine fuel injection system. Energy Sustain. Dev. 2022, 67, 93–101. [Google Scholar] [CrossRef]
- Pham, P.X.; Vo, D.Q.; Jazar, R.N. Development of fuel metering techniques for spark ignition engines. Fuel 2017, 206, 701–715. [Google Scholar] [CrossRef]
- Qu, L.; Wang, W.; Li, M.; Xu, X.; Shi, Z.; Mao, H.; Jin, T. Dependence of pollutant emission factors and fuel consumption on driving conditions and gasoline vehicle types. Atmos. Pollut. Res. 2021, 12, 137–146. [Google Scholar] [CrossRef]
- Erazo, G.; Mayorga, F.; Núñez, M. Diagnóstico y Mantenimiento de Inyectores de Sistemas de Inyección Directa de Gasolina GDI. Infociencia 2015, 9, 37–43. [Google Scholar]
- Huang, Y.; Surawski, N.C.; Zhuang, Y.; Zhou, J.L.; Hong, G. Dual injection: An effective and efficient technology to use renewable fuels in spark ignition engines. Renew. Sustain. Energy Rev. 2021, 143, 110921. [Google Scholar] [CrossRef]
- Mitukiewicz, G.; Dychto, R.; Leyko, J. Relationship between LPG fuel and gasoline injection duration for gasoline direct injection engines. Fuel 2015, 153, 526–534. [Google Scholar] [CrossRef]
- Shin, J.Y.; Lee, S.; Bae, C.; Jung, J.; Son, Y.; Heo, H.; Lee, J. Effect of late intake valve closing on the particle number emissions of a turbocharged gasoline direct injection engine. Fuel Process. Technol. 2022, 230, 107209. [Google Scholar] [CrossRef]
- Yuan, Y.; Zhao, M.; Yu, H.; Li, W.; Guo, B.; Zeng, Q.; Su, B. Estimation of combustion efficiency range and pressure fluctuation at low working condition. Energy Rep. 2022, 8, 169–178. [Google Scholar] [CrossRef]
- Ordoñez, I. Institutional Repository of the Salesian Polytechnic University: Interpretation of the Effects of the Pressure Drop of an Internal Combustion Engine Ignited by Compression CRDi Hyundai Santa Fé 2.0 through Noise Analysis; Salesian Polytechnic University: Cuenca, Ecuador, 2015; Available online: https://dspace.ups.edu.ec/handle/123456789/7944 (accessed on 19 February 2023).
- Feng, L.; Sun, X.; Pan, X.; Yi, W.; Cui, Y.; Wang, Y.; Wen, M.; Ming, Z.; Liu, H.; Yao, M. Gasoline spray characteristics using a high pressure common rail diesel injection system by the method of laser induced exciplex fluorescence. Fuel 2021, 302, 121174. [Google Scholar] [CrossRef]
- Pandey, R.K.; Rehman, A.; Sarviya, R.M. Impact of alternative fuel properties on fuel spray behavior and atomization. Renew. Sustain. Energy Rev. 2012, 16, 1762–1778. [Google Scholar] [CrossRef]
- Soo Yu, Y.; Yang, S.; Jeong, M.; Kim, H.; Yi, H.; Hwan Park, J.; Park, S. Experimental investigations on the spray structure and nozzle tip wetting using various fuels with an LPDI injector. Fuel 2022, 318, 123719. [Google Scholar] [CrossRef]
- Vera, C. Variation of the Pressure in the Combustion Chamber of an MCI with Respect to the Angular Position of the Crankshaft; Technological Institute of Pachuca: Pachuca, Mexico, 2015; Available online: http://www.itpachuca.edu.mx/pdf/repositorio_tesis/13200930.pdf (accessed on 19 February 2023).
- Al-lehaibi, M.; Liu, X.; Im, H.G. Numerical investigation of n-dodecane ECN spray and combustion characteristics using the one-way coupled Eulerian-Lagrangian approach. Fuel 2023, 331, 125759. [Google Scholar] [CrossRef]
- Syaka, D.R.; Margono, G.; Tyasmadi, A.T.; Dewantoro, T. Influence of duration and fuel injection pressure on two stroke gasoline direct injection engine performance. IOP Conf. Ser. Mater. Sci. Eng. 2021, 1098, 062090. [Google Scholar] [CrossRef]
- Sok, R.; Kusaka, J. Fuel-reforming effects on a gasoline direct injection engine under a low-temperature combustion mode: Experimental and kinetics analyses. Energy Convers. Manag. 2022, 255, 115304. [Google Scholar] [CrossRef]
- Qian, Y.; Li, Z.; Yu, L.; Wang, X.; Lu, X. Review of the state-of-the-art of particulate matter emissions from modern gasoline fueled engines. Appl. Energy 2019, 238, 1269–1298. [Google Scholar] [CrossRef]
- Liu, X.; Aljabri, H.; Al-lehaibi, M.; AlRamadan, A.S.; Badra, J.; Im, H.G. Numerical investigation of the effect of injection strategy on a high-pressure isobaric combustion engine. Int. J. Engine Res. 2021, 24, 595–609. [Google Scholar] [CrossRef]
- Ceper, B.A. Experimental investigation of the effect of spark plug gap on a hydrogen fueled SI engine. Int. J. Hydrogen Energy 2012, 37, 17310–17320. [Google Scholar] [CrossRef]
- Zibani, I.; Marumo, R.; Chuma, J.; Ngebani, I.; Tsamaase, K. Stepping Valve Actuator Algorithm for a Camless IC Engine. Procedia Manuf. 2019, 33, 99–106. [Google Scholar] [CrossRef]
- Wittek, K.; Geiger, F.; Andert, J.; Martins, M.; Cogo, V.; Lanzanova, T. Experimental investigation of a variable compression ratio system applied to a gasoline passenger car engine. Energy Convers. Manag. 2019, 183, 753–763. [Google Scholar] [CrossRef]
- Gao, J.; Tian, G.; Sorniotti, A.; Karci, A.E.; Di Palo, R. Review of thermal management of catalytic converters to decrease engine emissions during cold start and warm up. Appl. Therm. Eng. 2019, 147, 177–187. [Google Scholar] [CrossRef]
- Sun, P.; Liu, Z.; Yu, X.; Yao, C.; Guo, Z.; Yang, S. Experimental study on heat and exergy balance of a dual-fuel combined injection engine with hydrogen and gasoline. Int. J. Hydrogen Energy 2019, 44, 22301–22315. [Google Scholar] [CrossRef]
- Guo, H.; Li, Y.; Lu, X.; Zhou, Z.; Xu, H.; Wang, Z. Radial expansion of flash boiling jet and its relationship with spray collapse in gasoline direct injection engine. Appl. Therm. Eng. 2019, 146, 515–525. [Google Scholar] [CrossRef]
- Schrödinger, C.; Oevermann, M.; Krüger, O.; Lacarelle, A.; Paschereit, C.O. CFD Modeling of the Influence of Fuel Staging on the Mixing Quality and Flame Characteristics in a Lean Premixed Combustor. Proc. ASME Turbo Expo 2010, 2, 777–789. [Google Scholar] [CrossRef]
- NTE INEN OIML R 117-1. Dynamic Measurement Systems for Liquids Other than Water. Part 1: Metrological and Technical Requirements. Available online: https://www.normalizacion.gob.ec/buzon/normas23/nte_inen-oiml_r_117-1.pdf (accessed on 19 February 2023).
- Backes, F.; Blochum, S.; Härtl, M.; Wachtmeister, G. Experimental Analysis of Gasoline Direct Injector Tip Wetting. SAE Int. J. Engines 2019, 13, 77–91. [Google Scholar] [CrossRef]
- Muro, X.; de Nava, M.L.; González R., M.E.; de Giménez, F.T.; Becerra, O.; de Moya, R.D.; Calzadilla, O.; Aranan, A.; de Osorio, L.S.; Quintero, C.R. Towards A Definition of The Quality of Research at the Libertador Experimental Pedagogical University. Investig. Postgrado 2003, 18, 23–35. Available online: http://ve.scielo.org/scielo.php?script=sci_arttext&pid=S1316-00872003000100005&lng=es&nrm=iso&tlng=es (accessed on 19 February 2023).
- Yu, X.; Zhao, Z.; Huang, Y.; Shi, W.; Guo, Z.; Li, Z.; Du, Y.; Jin, Z.; Li, D.; Wang, T.; et al. Experimental study on the effects of EGR on combustion and emission of an SI engine with gasoline port injection plus ethanol direct injection. Fuel 2021, 305, 121421. [Google Scholar] [CrossRef]
- Chincholkar, S.P.; Suryawanshi, J.G. Gasoline Direct Injection: An Efficient Technology. Energy Procedia 2016, 90, 666–672. [Google Scholar] [CrossRef]
- Payri, F.; Desantes, J.M. Motores de Combustión Interna Alternativos, 5th ed.; Reverté: Barcelona, Spain, 2011; Available online: www.reverte.com (accessed on 19 February 2023).
- Aguera Soriano, J. Termodinámica Lógica y Motores TérmicosSexta.; Ciencia 3. 1999. Available online: https://www.casadellibro.com/libro-termodinamica-logica-y-motores-termicos-6-ed/9788486204983/803637 (accessed on 19 February 2023).
- Payri, R.; García, A.; Domenech, V.; Durrett, R.; Plazas, A.H. An experimental study of gasoline effects on injection rate, momentum flux and spray characteristics using a common rail diesel injection system. Fuel 2012, 97, 390–399. [Google Scholar] [CrossRef]


Disclaimer/Publisher’s Note: The statements, opinions and data contained in all publications are solely those of the individual author(s) and contributor(s) and not of MDPI and/or the editor(s). MDPI and/or the editor(s) disclaim responsibility for any injury to people or property resulting from any ideas, methods, instructions or products referred to in the content. |
© 2023 by the authors. Licensee MDPI, Basel, Switzerland. This article is an open access article distributed under the terms and conditions of the Creative Commons Attribution (CC BY) license (https://creativecommons.org/licenses/by/4.0/).