Article

India’s Renewable Energy Portfolio: An Investigation of the Untapped Potential of RE, Policies, and Incentives Favoring Energy Security in the Country

Department of Electrical Engineering, Rajasthan Technical University, Rawatbhata Road, Kota 324010, India
*
Author to whom correspondence should be addressed.
Energies 2023, 16(14), 5491; https://doi.org/10.3390/en16145491
Submission received: 15 June 2023 / Revised: 11 July 2023 / Accepted: 17 July 2023 / Published: 20 July 2023
(This article belongs to the Section C: Energy Economics and Policy)

Abstract

:
Access to inexpensive, safe, consistent, and clean energy is a critical necessity for all to achieve the SDGs. India’s renewable energy (RE) currently accounts for more than a third of the 482 GW of installed capacity and more than 40 percent of power production (including large-scale hydropower). Reforms such as the establishment of a single national power grid have improved access to electricity for people, and the ambitious development of renewable energy, which is the world’s third-largest energy generator and third-largest electricity user, has helped in achieving these aims. As a result, the expansion of national targets signifies and reflects the country’s optimism and goal for the forthcoming generation. Standardization of the guidelines and development of the stable grid and transmission networks will only enable the country to achieve the ambitious target of 500 GW of green and clean energy by 2030. This paper highlights the important development in the power sector regarding the energy security of India. As well as specifically examining the initiative of NSMs for achieving the 2030 targets, the key challenges, and the way forward to increase the cumulative installed capacity, comprehensive studies of various policies and government initiatives are also discussed. Furthermore, the key challenges usually faced by the developers in the industry, along with the steep decline and rise in the tariffs of solar projects and the previous trends in capacity installation, are also pointed out. This research work also highlights the potential key challenges to achieving the targets, and will thus provide a focus for power developers, policy makers, researchers, and industry practitioners and help with their planning. In the current scenario, the supply of food and the clean energy nexus are required to meet the demands of people’s livelihoods.

1. Introduction

India has significant potential for clean and green energy opportunities in the form of wind, solar, biopower, and small hydro, among other resources. The government recognizes that harnessing these resources is vital for economic and climatic growth, and as a result, it has implemented several commercial and public policies that favor installations. India was the first nation to have a full-fledged ministry dedicated to the expansion of sustainable and alternate forms of energy. India is ranked fourth globally in terms of installed renewable energy capacity, fourth for solar and wind power, and fourth for major hydropower [1]. The MNRE estimates a renewable energy potential of around 1700.68 GW from abundantly available sources such as wind (695.51 GW at 120 m), small hydro (211.33 GW), bioenergy (44.85 GW), and solar energy (748.99 GW, assuming 3% wasteland). In addition, solar photovoltaic and solar thermal technologies can produce around 35 MW/km2 [2]. The current trend shows that India’s clean energy potential is mostly untapped. To maximize clean energy efficiency, the government set aggressive capacity addition goals for each year until 2022, including 100 GW of solar energy. India has a huge amount of solar irradiance, which can be used to power a large portion of the world, making solar energy an appealing investment opportunity for both power developers and financiers. The government has also launched several other initiatives and projects to encourage investment in the industry [3]. A total of 42.6% of the nation’s installed capacity is made up of generation using non-fossil fuels. Apart from achieving the 175 GW target by 2022, which consists of 5 GW of power from small hydro, 60 GW of power from wind energy, 100 GW of power from solar energy, and 10 GW of biomass power, the country is already on the path to achieving the mid-term goal of installing 265 GW by 2024–2025 [4]. Recently, in Glasgow, the Prime Minister of India announced a very aggressive target for the country, namely that the energy generation from renewable energy sources having capacity of 500 GW will meet 50% of the energy consumption demand, which will lead to a 45% reduction in GDP’s carbon intensity by 2030, and the projected date for net zero reduction is 2070 [5]. The Indian Government has already established its National Infrastructure Pipeline (NIP) Task Force for 2019–2025 to accomplish this goal and prepare the improved infrastructure.
The NIP is the first of its kind, i.e., a government-wide application aimed to provide outstanding facilities in the country and an excellent lifestyle for all citizens, with the goals of improving project plans and attracting investments in infrastructure (both domestic and foreign), and is critical to India becoming a USD 5 trillion economy by 2025. The NIP annual capital expenditure in infrastructure for renewable energy for FY (2020–2025) is INR 9, 29, 500 Cr. Table 1 clearly shows the breakdown of the total cost for the various categories, i.e., solar, wind, small hydro, and biopower, with the projected and achieved targets.
Environmentally friendly financing for waste-to-energy facilities, sustainable water management, transportation (including public transit), and renewable energy sources has been promoted. Funds raised by the offer of green debt securities can be used to pay for energy-efficient buildings, which will result in a 20% increase in the proportion of renewable energy used overall [6]. The NIP was created with great care by combining all the details provided in the harmonized master list of facilities by various stakeholders, including ministries, departmental governments, state governments, and the public sector. The bottom-up approach was used to create the NIP, to include each project amounting to more than INR 100 crores for each project (Greenfield or Brownfield, Under Execution or Conceptualization). The renewable energy capacities of 265 GW are targeted to be completed by 2024–2025, according to NIP’s program. However, various issues remain that must be overcome to achieve these capacity targets. In the existing literature [7], highlights the Indian circumstance and demonstrates that, in the long run, nations that do not strategically incorporate manufacturing into their objectives for expanding sources of renewable energy may find themselves dependent upon foreign technologies for renewable energy. A green labor division will inevitably become entrenched as a result of late development and an improper industrial strategy in the renewable energy sectors, with the majority of the Global South reliant on technologies developed in the United States, Europe, and East Asia. The projected signals indicate that fresh datasets for renewable energy will be used to model the technological and economic elements of a faster energy transition until 2050 [8]. The paper claims that energy optimization and renewable energy technologies are important elements of the change and their combined effects are also important. Favorable economic conditions, ample supply of resources, adaptable technology, and significant socioeconomic advantages support this transformation. Renewable energy sources can meet two-thirds of the world’s energy demand, which will enable the reduction in the production of greenhouse gases and reduction in average temperature of the surface below 2 °C from the present to 2050. The pattern of energy division in the global reform during 1982–2013 was previously explained [9], demonstrating that developing nations around the world have undertaken measures to improve the performance of their power sectors, and that a stable supply of energy is necessary for economic development. Energy statistics have been regarded as reports of a risk element in the financial sector [10]. The study explores the claim that decreased energy use and cost do not promote economic growth. In addition, [11] highlighted a number of proactive strategies to help India meet its goal of deploying solar power, as well as providing a general summary of the state of the Indian PV sector at the time. Additionally, it enables a rudimentary understanding of the difficulties, obstacles, and potential solutions that are associated with India’s development of solar PV. A study was conducted [12] with the main objective of evaluating various renewable energy programs, with an emphasis on electricity generation and concerns about climate change under different NAPCC components. Gaps in the implementation were found after a critical analysis of the plan’s initiatives. The current utilization of clean energy sources, such as hydro, bioenergy, solar, and wind, is discussed in light of the difficulties associated with technical advancement. The adoption of sources of clean energy by the nation necessitates efficient contributions to technological and resource development strategies. Along with addressing worries about climate change, the problems highlighted in the report have implications for the long-term economic prosperity of the nation [13]. This study demonstrates the best practices in India for making effective use of context-relevant RE policy enablers to meet the needs of other rising nations [14]. Researchers studied how the Electricity Act of 2003 and the Tariff Policy of 2006, as well as the adoption of feed-in tariffs and minimum caps on electricity generated from clean sources, affected the growth of grid-connected renewable energy capacity in nine Indian states between 2001 and 2009. The outcome indicates that the Tariff Policy of 2006, policies at the state level, quantity-based tools, and increasing private sector involvement have all had an impact. “Engagement” and “Disengagement” have been advocated as the two techniques employed by communal businesses in this context to gain government funding and policy support, and an inductive theory-building approach has been described to advance the current understanding of the boundaries of social entrepreneurship and policy [15]. The physical progress shown by the data is mentioned herewith [16]. The author outlined the numerous challenges faced by the renewable energy market [17]. The recommendations based on the review’s results can be useful to policy makers, entrepreneurs, patrons, industries, related stakeholders, departments, researchers, and scientists. This paper examines the untapped potential of RE; in particular, solar energy policies and incentives taken by government that favor energy security are summarized in this investigation, along with a way to achieve the solar energy goals of 2030. The Jawaharlal Nehru National Solar Mission’s benefits and strategies favoring installations, as well as the business models previously used by the key stakeholders, are also illuminated. The major milestones in the renewable field achieved to date, along with the key challenges, are highlighted at the end of the report, and the path forward provides an approach to tackle these problems to accelerate growth in the renewable energy sector for the achievement of the 500 GW target by 2070.

2. Mission Solar JNNSM

The Government NSM is the most important project aimed at advancing environmentally friendly development and resolving energy protection concerns. The NSM is one of the most important mission from the eight missions of NAPCC. The strategy paper elucidates a novel solution to reducing the burden of climate change by highlighting the poverty–growth connection. As reported in NAPCC, “India lies in a tropical region, where sunlight is possible for prolonged hrs every day with a greater intensity”, [18]. As a result, solar energy has a lot of promise as a possible energy clean source. Another benefit is that it enables distributed energy delivery. The Indian government established the NSM on 11 January 2010, with the objective of making India a global leader in solar energy by fostering its rapid acceptance worldwide. This was done in recognition of the capability of solar energy to contribute to India’s energy collateral [19]. According to the National Solar Mission (NSM), achieving 20 GW of solar PV grid-connected capacity and 2 GW of solar PV off-grid capacity by 2022 were the goals of “Solar India”. Three phases were deployed to implement the mission.
In order to generate a critical mass for the domestic solar sector, the mission’s regulatory framework aims to provide the ideal conditions for business and project developers to invest in solar power, generating research, manufacturing, and development. The mission’s immediate goal was to concentrate on creating a conducive atmosphere for solar PV technology diffusion in the region, both central and distributed. The first phase, which lasted from 2010 to 2013, concentrated on grabbing solar’s low-hanging fruit, pushing off-grid systems to help individuals without access to grid-based electricity, and slightly boosting the capacity of grid-based systems. The capability was significantly ramped up in the second phase after taking into consideration the experience of the early years to provide the framework for increased and effective solar energy penetration in the area. In its INDC, India promised to increase the intensity of the installed non-fossil fuel generator capacity sources to 40% by 2030 and lower the GDP’s emission intensity from 33% to 35% by the same year. In June 2015, the Indian government revised the National Solar Mission (NSM) goal for installing grid-connected solar power capabilities from 20,000 MW to 100,000 MW by 2022 in light of the aforementioned information. Solar rooftop projects totaling 40,000 MW and medium- and large-scale solar projects totaling 60,000 MW will be used to generate the expected capacity [18,19,20]. The INDC focuses on India’s policies and programs for encouraging the clean green energy from renewable sources of energy, improving energy productivity, developing a lower carbon intensity, encouraging the transition from waste to prosperity and resilient urban centers, developing harmless, smart, and justifiable green energy carriage networks, and reducing pollution [20]. The nation attempts to improve carbon reduction through the establishment of woodland and tree safeguards.
The INDC proposals are as follows:
  • Sustainability of way of life;
  • Economic growth that is cleaner;
  • Lowering the GDP emission intensity;
  • Raising the amount of electricity based on non-fossil fuels;
  • Improving forests as a carbon sink;
  • Adaptation;
  • Finance management;
  • Transfer of technology and capacity building.
The INDC included a list of the climate measures that would be implemented after 2020 as part of a new global accord. It was necessary to build a state-level structure exclusively committed to supporting solar power generation to effectively tap the solar energy and achieve the goals of the NSM. One way to do so was to concentrate on the construction of solar parks in various locations around the globe.
The goal of 20,000 MW under the JNNSM was the first official mission to tap into India’s solar potential. This was the first mission that resulted in a more robust policy structure for solar energy production. The mission also aimed to promote off-grid solar applications to establish favorable markets for domestic solar panel producers and accelerate utility-scale solar deployment.
As we covered the production and promotion in the RE sector above, we now focus on the achievements in the RE sector in the past ten years. Figure 1 shows that in the 2012–2013 fiscal years, a total capacity of 1.68 GW was commissioned. However, at the end of December 2022, the capacity was about 48.08 GW, representing a significant share of India’s clean energy market.
Several new projects have also been launched, including the 7500 MW Leh Kargil solar plant, which is the largest individual solar PV plant in the world, and the 4750 MW Gujarat Renewable Energy Park. A 150 MW floating solar PV park in Jharkhand and a 600 MW floating project in Madhya Pradesh are also among the government’s ambitions. Recently, the idea of round-the-clock renewable energy has gained traction as a means of supplying firm electricity to DISCOMs. Solar plants developed under the State Scheme are commonly chosen using a tariff-based open bidding and reverse auction mechanism, according to the successful bidding of solar projects under the NSM. The tender floated by GUVNL under the State Scheme marked the beginning of a new era for the solar business by lowering the cost from about 17.91 INR per kWh in December 2010 to 1.99 INR per kWh in December 2020. The average solar tariff bid rate was found through bidding and auctions, as seen in the graphs. The downward movement in solar PV power tariffs from 2010–11 to 2021–2022 is depicted in Figure 2.
A solar parks power generation and distribution systems guaranteed supply of space, and economies of scale, as well as other developments in the market, have provided the impetus for recent downward trends in solar tariffs; Figure 2 illustrates the lowest tariff of 1.99 INR/kWh in the year 2020–2021. Factors that led to lower tariffs and accelerated addition of RE capacity are the Renewable Purchase Obligation trajectory issued until 2021–2022; Standard Bidding Guidelines; Electricity Act 2003, Section 6; Payment Security with Demand Aggregation; bids by intermediary procurers (primarily SECI) on behalf of states; the waiver of inter-state transmission (ISTS) charges until June 2025; FIT, Accelerated Depreciation, GBI; central subsidy; Concessional Custom Duty; and lower GST. The common trend of the decline and increase in tariffs is covered more in the conclusion.

3. Innovative Schemes

3.1. Green Corridor for Energy

MNRE is supporting the expansion of the inter-state transmission system as part of the Green Energy Corridor project, which will make it easier to move over 20 GW of power from renewable energy-producing units to load centers. Efforts are also underway to improve the forecasting model to provide wind/solar power forecasting services in the nation by the NIWE. The five-year development of the gearbox systems will take place between the financial years of 2021–2022 and 2025–2026. The intra-state transmission fees will be partially offset by the Central Financial Assistance (CFA), which will assist in keeping the cost of electricity low. Therefore, government assistance will directly benefit the final users, i.e., the Indian population [22]. By lowering carbon footprints, the plan will also support the nation’s long-term energy security and encourage environmentally friendly growth. This has created numerous job openings in the power and other related sectors for both skilled and unskilled workers. To enable the distribution of renewable energy, the Scheme Green Energy Corridor, with a financial outlay of USD 463.26, is being established. The PGCIL has asked the Asian Development Bank (ADB) for a loan (help) of USD 1000 million, which is made up of a USD 500 million sovereign-guaranteed loan and a USD 500 million non-sovereign credit.

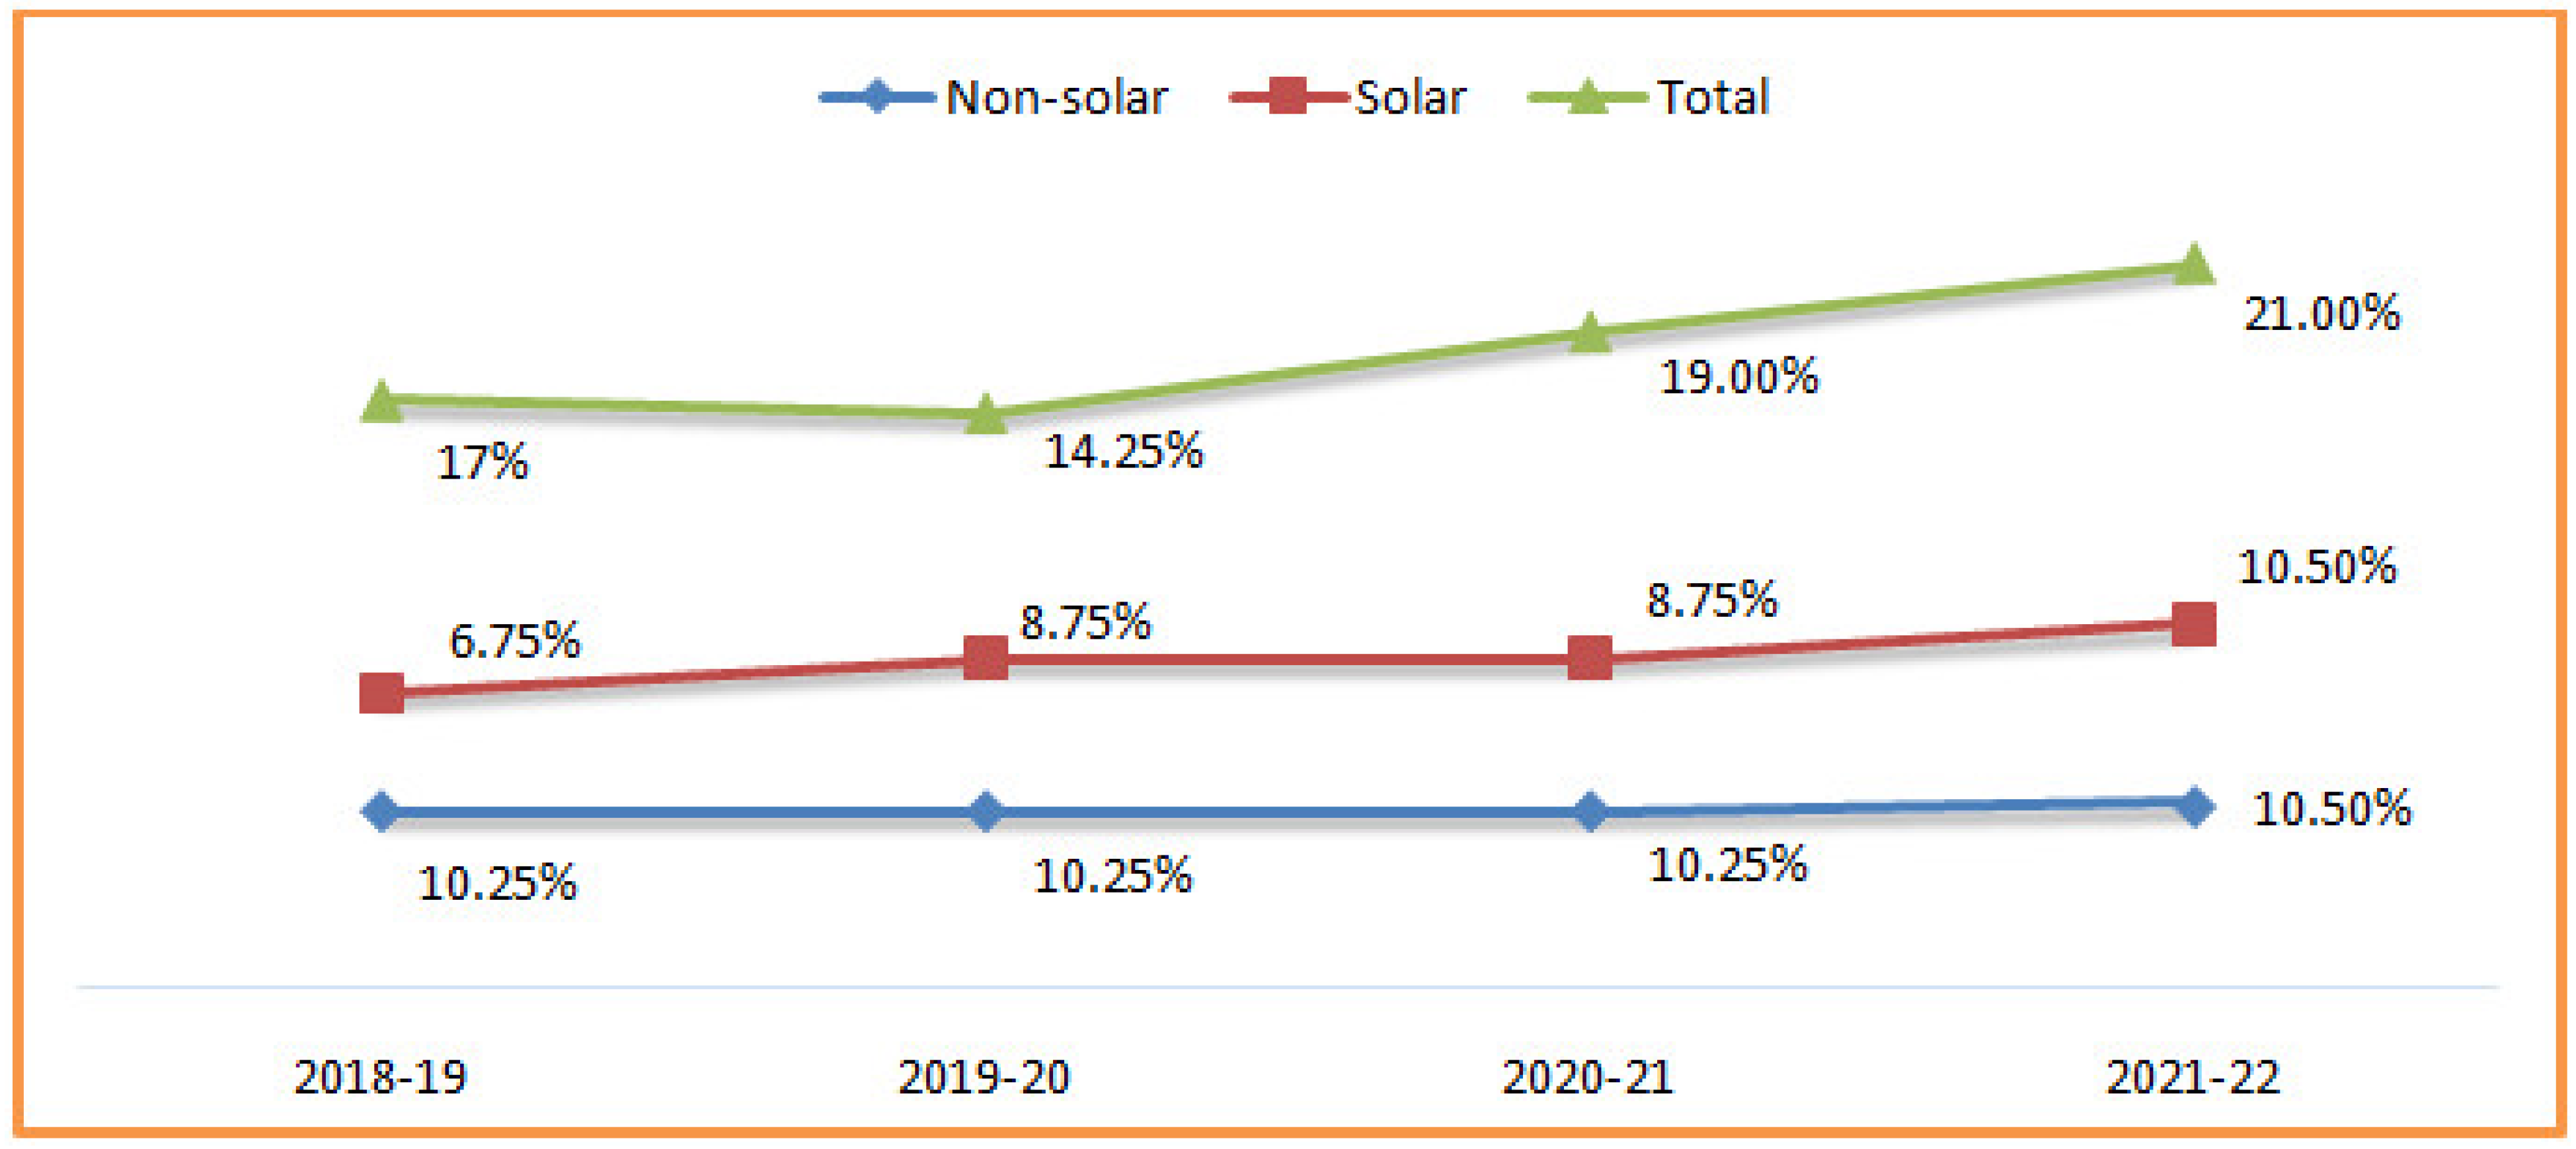
3.2. Renewable Purchase Obligation (RPO)

A minimum of 0.25 percent in 2012 and a maximum of 3 percent by 2022 were required for solar-specific RPOs under an amendment to the National Tariff Policy made in January 2011. For the purpose of boosting solar energy, the CERC and SERCs have created a number of laws, encompassing solar RPOs, tariffs, grid connectivity, REC frameworks, forecasting, etc. [23]. The Ministry of Power announced the long-term growth plan for RPOs in solar and non-solar energy until 2020 in response to the amended tariff policy. As per the RPO, in 2018–2019, the states achieved the RPO targets of 17%, which included 10.25% in the solar category and 6.75% in the non-solar category. Further, the yearly targets up to 2029–2030 were also calculated to achieve the target of 500 GW by 2030. POSOCO maintains the data related to RPO obligations [24].
If the states operate in a parallel active mode, the 500 GW RE power goals can be conveniently met by 2030 by meeting the RPO requirements and installing RE capacity in the states.
In the Figure 3, the annual RPO target set by the Ministry of Power is shown, as per the RPO; in 2018–2019, the states achieved the RPO targets of 17%, which included 10.25% in the solar category and 6.75% in the non-solar category. Further, the yearly targets up to 2029–2030 were also calculated to achieve the target of 500 GW by 2030. The figure also depicts India’s proposed combined solar and non-solar potential beyond 2022 by state.

3.3. Net Metering Policy and Virtual Net Metering

The ministry’s clear follow-up culminated in the receipt by the SERC of thirty-four states/UTs of notifications on the solar PV net-metering and feed-in-tariff to promote solar rooftop plants. To further achieve the 40 GW goal for rooftop grid-connected solar projects, the net-metering program has been executed in all UT and states. So far, around 20 states have issued policies endorsing grid-connected rooftop solar systems; however, the mandatory requirement of an accessible roof with a shadow-free area acts as a limitation. Due to the aforementioned restriction, “Virtual Net Metering” has evolved, with operational planning of where the total power produced by a solar PV project placed at a customer’s home or any other location within the same distribution licensee is pumped through a solar meter, and the exported power is adjusted in any one (or more) of the electricity service connections of contributing consumers located under the jurisdiction of same distribution licensee [25]. VNM is becoming increasingly popular across the nation’s states. In certain circumstances, a group of homes may install solar plants (either in CAPEX mode or RESCO mode) on any adjacent land or rooftop in accordance with Virtual Net Metering regulations. The following states and Union Territories (UTs) already have Virtual Net Metering provisions in place. Along with the private sector, all major industries are being pursued, including railways, airports, hospitals, and educational institutions, government buildings at the national and state levels, and PSUs. Using ISRO’s VEDAS Portal, the Ministry and ISRO have collaborated to “geotag all Rooftop plants”. Future construction plans include a policy for the rental of a rooftop.

3.4. Raising of Bonds

The Ministry of Finance authorized the issuance of INR 4000 Cr in green energy bonds via IREDA in 2016–2017. ReNew Power, Adani Green, and Greenko were among the major players who released bonds worth approximately USD 2500 million (based on the exchange rate as of that time).

3.5. International Solar Alliance

The ISA is a unique platform for the partnership of 121 sun-rich nations that are entirely or partially located between the Tropics of Cancer and Capricorn for the expansion and promotion of solar energy. The Foundation Stone was laid on 25 January 2016, in Gurgaon, Haryana (India), with the objective to aggregate demand for solar finance, technology, innovation, research and development, and capacity building in order to increase the efficiency of solar energy and lower the cost of solar power generation [26]. The ISA provides a platform for cooperation among solar-resource-rich countries to address their special energy needs. The worldwide Solar Alliance (ISA), a treaty-based worldwide intergovernmental organization, seeks to mobilize more than USD 1000 billion in investment required by 2030 for the extensive deployment of solar energy. Recent efforts have been made to raise USD 1 trillion by 2030 under the Solar Future Roadmap. Solar energy will be crucial to the goal of meeting global development and climate goals in the years from now to 2030. This road map offers recommendations for fairly accelerating and scaling up solar investment and implementation globally.

3.6. Solar Anti-Dumping

India has launched an investigation into the dumping of Chinese, Taiwanese, and Malaysian solar cells and modules. The inquiry pertains to both crystalline and thin-film technology, and it affects all imports, which account for more than 85% of overall cell and module sales in India. Dumping occurs when a commodity is exported at a lower price than the domestic price. It will not be difficult to claim “dumping” in the case of solar imports, as it is well established that Chinese manufacturers market modules in India at cheaper rates than in China [27]. Although the government should surely formulate policies to help increase the country’s manufacturing potential and boost the efficiency of the PV modules as part of its Made in India program, it should also strive to maintain the market attractiveness of solar power such that there is no increase in tariffs, as this is eventually borne by the end-user. The imposition of an additional charge of 12–15 cents per watt of construction expense would boost the solar power tariff by 0.80–1.30 INR per unit, bringing the total tariff to 3.50–4.00 INR per unit. Solar-generated electricity with tariffs above 3 INR per kWh is unlikely to be purchased by electricity distribution firms. The investigation of anti-dumping of imported solar cells requires careful consideration. Imported solar modules have a price that is equivalent to the international price set at the auction. The prices of solar cells and modules have been slowly declining around the world. Tariff reductions have also benefited from increased productivity. China is the clear leader, with 60% or more of the world’s total solar PV cell and PV module production potential [28]. However, with effect from 1 April 2022, the ministry imposed a 25% duty on solar cells and a 40% duty on solar module imports following the launch of the investigation [29].

4. Power from Renewables in India

In India, the total installed capacity from various sources is around 393 GW, with renewable energy, including large hydropower, accounting for around 38% of the total installed capacity, as of December 2022. Even though renewable energy only accounts for approximately 26% of generation, its share in installed capacity has already surpassed 40% (including nuclear and hydro). Figure 4 shows the distribution of the share of RE in the installed capacity of the power sector in India. In terms of energy from renewable sources, the solar market is one of the fastest expanding, accounting for 33 percent of total RE installations, second only to wind (26 percent) [30].
Figure 5 below depicts the present state of India’s clean energy market. Furthermore, the segment of renewables has increased from 14 percent in 2014–2015 to 38 percent in 2021–2022, as compared to thermal and other non-renewable sources [29].
The yearly share of renewables and the yearly cumulative capacity installed through various RE sources is shown in Figure 6.
The above achieved capacity shows the growth in the past years. The forecast data show that, provided the land is also accessible for such ultra-mega solar projects to be installed, our country has an enormous solar capacity of more than 750 GW [31]. Through a vigorous and ambitious National Solar Mission (NSM) and comparatively extended Renewable Purchase Obligation (RPO) compliance, India is increasing its installed solar power resources. India launched a big program in the shape of the NSM in 2010 to establish additional incentives and encourage environmentally sustainable infrastructure to solve the energy security problem. India’s enhanced 100 GW goals for 2015 will place the nation on the global solar list. Out of the 100 GW target, the total grid-linked solar power installed capacity was more than 48 GW at the end of December 2021, and another 60 GW solar power capacity is currently being installed or in the process of tendering. In contrast, at the end of December 2021, the total renewable grid-connected installed capacity was 151,391 MW, including 48,087 MW of solar installed capacity. Aside from these, the nation has a total capacity of 1460 MW of off-grid solar energy. With this, India will be able to reach more than 38% including hydropower, bringing it closer to meeting the COP21 commitment. India’s commitment to COP21 reflected its historical status as a developing nation. However, since 2015, India’s renewable energy sector has steadily grown from 42,216 MW to just over 151,391 MW by the end of December 2021. In accordance with the Prime Minister’s declaration at COP26, the Ministry of New and Renewable Energy is seeking to reach 500 GW of installed electricity capacity from non-fossil sources by 2030. As of 31 October 2022, 172.72 GW of capacity derived from non-fossil fuel sources had been deployed throughout the nation [32]. In comparison to the capacity of 11.9 GW added during the period of January to October 2021, a total of 14.21 GW of renewable energy (RE) capacity was added during the period of January to October 2022. From January to September 2022, 151.94 BU was produced from renewable energy sources, compared to 128.95 BU from January to September 2021 [33]. India is fourth in the world in terms of installed renewable energy capacity (including large hydro), wind power capacity, and solar power capacity [33]. This consists of 119.09 GW of renewable energy, 46.85 GW of large hydro, and 6.78 GW of nuclear power. As of 31 October 2022, this represented 42.26% of the nation’s total installed generation capacity, or 408.71 GW [32]. India presented the five major components (Panchamrit), listed below in Table 2, of India’s climate action at COP26.
The government’s positive policy decision and the availability of markets in India for developers and manufacturers are reflected in the growth rate. Recently, during COP26, the Indian government announced the next stage of goals of 500 GW of non-fossil capacities by 2030. These higher capability expectations necessitate a consistent approach for all internal and external companies that will assist in meeting the goal.

5. Incentives and Policies Favoring Installations

In recent years, India’s clean energy market has grown into a major participant in terms of grid-connected power production capability. It backs the policy of the government for long-term development, and it has thus been critical in helping the country fulfill its energy needs and is a key player in energy access. As a result, with RE’s increasing importance in the energy planning phase, it is being seen as one of the most significant methods to help us achieve our goal of energy sustainability.
In the last few years, national energy from renewable sources has changed dramatically, with rapid and aggressive efforts to expand solar energy’s contribution. Industry veterans now believe that clean energies will play a very significant part in the overall development of the national electricity infrastructure. As a result, expanding the reach of the NSM both indicates and captures our future hope and ambition. This transformation is probably the pinnacle of the mission’s operations over the last five years.
The government has undertaken many initiatives in the last five years, including the solar parks scheme; hosting RE–Invest, the global meeting for investors; the grid-connected solar PV rooftop program; the Green Energy Corridor; the Surya Mitra training Program; and the waiver of inter-state transmission costs and losses for solar and wind power. Such noteworthy programs include the introduction of the upgraded cookstove program, as well as the promotion of concerted R&D efforts in solar PV, thermal, and next-generation oil from hydrogen, biofuels, and fuel cells, among others.
The ministry has already taken many measures to promote sustainable energy use. India has embarked on the world’s biggest renewable capacity growth journey. The government wants to boost the use of sustainable energy by investing heavily in green energies. Energy security, electricity scarcity, energy access, among other things, and climate change, played a role in the creation and performance of energy from renewable resources in the nation, as follows:
  • Wind—695.51 GW (at 120 m hub height) and National Offshore, release of the Wind Energy Policy, preliminary evaluation at two locations (2000 MW), and investigation of the entire potential.
  • Solar power—748.99 GW (the ratio of 60 km × 60 km wasteland, assuming 3% of it is made available, could produce all the power used in India in 2012.).
  • Biomass power—44.85 GW (from surplus agro-biomass).
  • Small hydropower (SHP)—211.33 GW (for ≤25 MW and being revised upward).

6. Key Milestones in the Sector

6.1. Solar and Wind Hybrid Systems

The Wind and Solar Hybrid Policy was released by the ministry to promote the creation of brand-new hybrid projects and the hybridizing of the already-existing wind and solar projects. The strategy seeks to boost grid reliability by reducing fluctuations in renewable energy production. In India, a few states rank highly for solar and wind installations, as mentioned, including Andhra Pradesh, Gujarat, Karnataka, Maharashtra, and Tamil Nadu. All of the mentioned states can gain better stability of the grid and top CUF when they are transformed to hybrid systems instead of standalone solar–wind systems, and through better use of the transmission infrastructure. In May 2018, the Ministry of New and Renewable Energy unveiled the new solar and wind hybrid strategy, which encourages technological solutions for bottlenecks in the joint operation of solar–wind systems and offers a comprehensive perspective for its extension [32]. The SECI held India’s first significant auction for a solar–wind hybrid system in December 2018, awarding 840 MW of contracts to Adan and Soft Bank Energy at a low cost of 2.67 INR/kWh.

6.2. Decentralized Renewable Power Generation for Rural Electrification

A country’s growth is primarily determined by its energy use. Electricity is critical to a country’s economic development. As a result, the Government of India aspires to provide all citizens with secure, accessible, and clean power throughout the day for 24 h, and for seven days of the week. Contrary to popular belief, lack of grid access is not the predominant cause of rural households remaining without electricity.
Utility-scale projects discourage the contribution of smaller organizations and promote asset consolidation. Contrarily, decentralized plants encourage community involvement, increase jobs, and provide residents with access to energy. It becomes a necessity to implement a balanced policy strategy that supports both project configuration types [33]. Where there is an insufficient source of electricity or where the grid cannot access a place, microgrids are used. Private players build microgrids, which support a population of villages by connecting homes, schools, hospitals, agricultural fields, and even telecom towers, generating a steady stream of revenue for the developers. Microgrid tariffs are typically higher than conventional grid tariffs because delivering electricity within a region necessitates significant investment in transmission and distribution facilities.

6.3. Waiver of Inter-State Transmission Charges and Losses

The CERC amended the law for the allocation of ISTS charges and expenses for the sixth time. This amendment was beneficial to solar and wind energy producers. The amendment stated that for generations dependent on solar and wind energy, there would be no transmission charges or damages for use of the ISTS network. This will be valid for 25 years after the plant’s COD. The COD of Applicable Projects was set to be between February 2018 and June 2023. The government of India set a goal of 175 GW of installed capacity by 2022 but has only reached 92 GW so far. This amendment will help boost the installation of RE in the country as the majority of developers will try to achieve the targeted capacity within the stipulated time period. Now, this has been extended until June 2025.
In the present scenario, the waiver is now not only limited to solar and wind power projects, but also includes hydro projects. In March 2019, the government recognized hydropower projects as a renewable source of energy [34].
For hydro developments, the waiver of concessional charges as shown in Table 3 shall be applicable for a period of 18 years from the date of commissioning of the hydropower plants. Only inter-state transmission fees, and not losses, are subject to the waiver. This action is anticipated to promote the hydro sector, improve India’s water security, and aid the development of mountainous areas including North Eastern States and Uttarakhand.

6.4. Wind Power

In the region, comprehensive instructions for the development of onshore wind projects must be devised and published. The guides to implementing the “The policy for Establishing up of 1000 MW ISTS—linked Wind Energy Projects” have been published.
The grid-interactive wind power of the nation had an installed capacity of 40.08 GW as of 31 December 2021. During January to October 2022 [36], total additional capacity of 1761.28 MW was achieved.
  • Modifications to the “Guidelines for Tariff-Based Competitive Bidding Procedure for Purchase of Electricity from Grid Connected Wind Solar Hybrid Projects.”
    • As of the amendment dated 9 March 2022, the authorized representatives of clients may conduct the bidding procedure on their behalf.
    • The hybrid project commissioning timetable was extended from 18 to 24 months.
    • The amendment from 2 November 2022 rationalizes the obligation involving to a delay in commissioning due to a delay for LTA operationalization.
  • The Ministry of Finance notified that the CCDC for a number of wind turbine components has been extended until 31 March 2023.
On 5 August 2016, the Policy for Repowering of Wind Power Projects was released in an effort to encourage the most effective utilization of wind energy resources by developing a repowering procedure.

6.5. Solar Parks

Financial incentives promoted through policy reforms and subsidies offered at the federal and state levels support India’s solar capacity. Solar PV plants can be developed anywhere in the country; however, it is feared that this would result in a scattering of projects, raising the cost per MW of the plants and increasing technological losses. The country’s solar power is primarily made up of utility-scale grid-connected capacity and ultra-mega solar parks. The ministry approved 57 solar parks with a total capacity of 39.28 GW. However, most of these were delayed. Of the total number, nine solar parks have been successfully operationalized, and eight have been partially completed, with a total capacity of 10,117 MW of solar projects commissioned out of 39.38 GW [37]. However, the establishment of successful solar parks has been difficult due to the difficulty in procuring barrel land, timing discrepancies between solar installations and infrastructure for electricity distribution, and environmental and regulatory issues. The MNRE is regularly reviewing with stakeholders to address the challenges to shorten the time that is caused by the delay. Under the solar park program, the Ministry provides CFA up to INR 25 lakh per solar park for the development of the Detailed Project Report (DPR) [38]. Additionally, CFA up to INR 20.00 lakh per MW or 30% of the project cost, including the grid-connectivity cost, is paid upon fulfilling the milestones listed in the plan. All of the eight modes are floated to the selection of SPPD and eligibility for CFA.

6.6. Safeguard Duty

According to India’s Directorate General of Trade Remedies’ guidelines, India’s Ministry of Finance (Department of Revenue), a 25% safeguard tariff on solar cells (regardless of whether they are mounted in modules) was formally declared on 30 July 2018 on those products manufactured in China and Malaysia (DGTR). The valuation of the manufactured commodities decides the (amount of) duty to be levied, according to the Ministry of Finance. Concerns over the anti-dumping duty’s applicability due to the safeguard duty will be resolved by enforcing this duty at a pace that is smaller than that of the anti-dumping duty. India is currently the world’s second-largest market for PV modules [39]. Regarding exporting modules to India, duty-free and economically developing Southeast Asian countries such as Thailand and Vietnam have the most benefit, according to cost estimates (except for duty-imposed Malaysia). Since Chinese factories cannot sell modules at a loss, the next best choice is to buy cells in Thailand and Vietnam and install the modules in India. Manufacturers who want to set up production lines in the country will have to work faster this year to deal with the effect of the safeguard duty. From 29 January 2020 onwards, the obligation was planned to be cut by 10%.

6.7. PM-KUSUM

KUSUM solar pump distribution system was declared in the 2018–2019 Budget to provide farmers with relief from high-cost diesel-run water pump sets and intermittent power supplies. In areas where the grid is not accessible, 1.75 million solar pumps will be installed. The Centre aims to subsidize 30% of the bill; the state would do the same thing by issuing a loan for the percentage.
Additionally, the PM-KUSUM Scheme is being used to develop grid-connected solar power plants up to 2 MW, solarize existing agricultural pumps, and establish freestanding solar pumps. Two states—Rajasthan (12.50 MW) and Himachal Pradesh (12.75 MW)—have shown interest in the development under the Kushum total of 25.25 MW [21] the details of each component under Table 4 is discussed below.
  • Under Component A, on their uncultivated or barren lands, single farmers, cooperatives, panchayets, and farmer producer organizations (FPOs) will construct renewable power solar PV plants with a capacity that ranges from 500 KW to 2 MW. The DISCOMs will acquire the generated power at a rate set by the relevant SERC. The program will give rural landowners access to a reliable and ongoing source of revenue. The distribution company will receive performance-based incentives at a rate of 0.40 INR per unit purchased or 6.6 INR lakh per MW of installed capacity, whichever is less, for a period of five years starting on the Commercial Operation Date.
  • Under Component B, 7.5 HP standalone solar pumps are supported for installation by individual farmers.
  • Under Component C, individual farmers will receive funding from the program to solarize pumps with a maximum HP of 7.5, and solar power up to double the pump capability in kW is permitted. The energy created can be used by the farmer to power irrigation systems, and any extra energy left over can be sold to the distribution company. This will make it easier for the farmers to earn additional cash. States may also choose to solarize at the feeder level, where a single solar plant is erected using the RESCO and CAPEX modes to supply power to a single or multiple agriculture feeders.

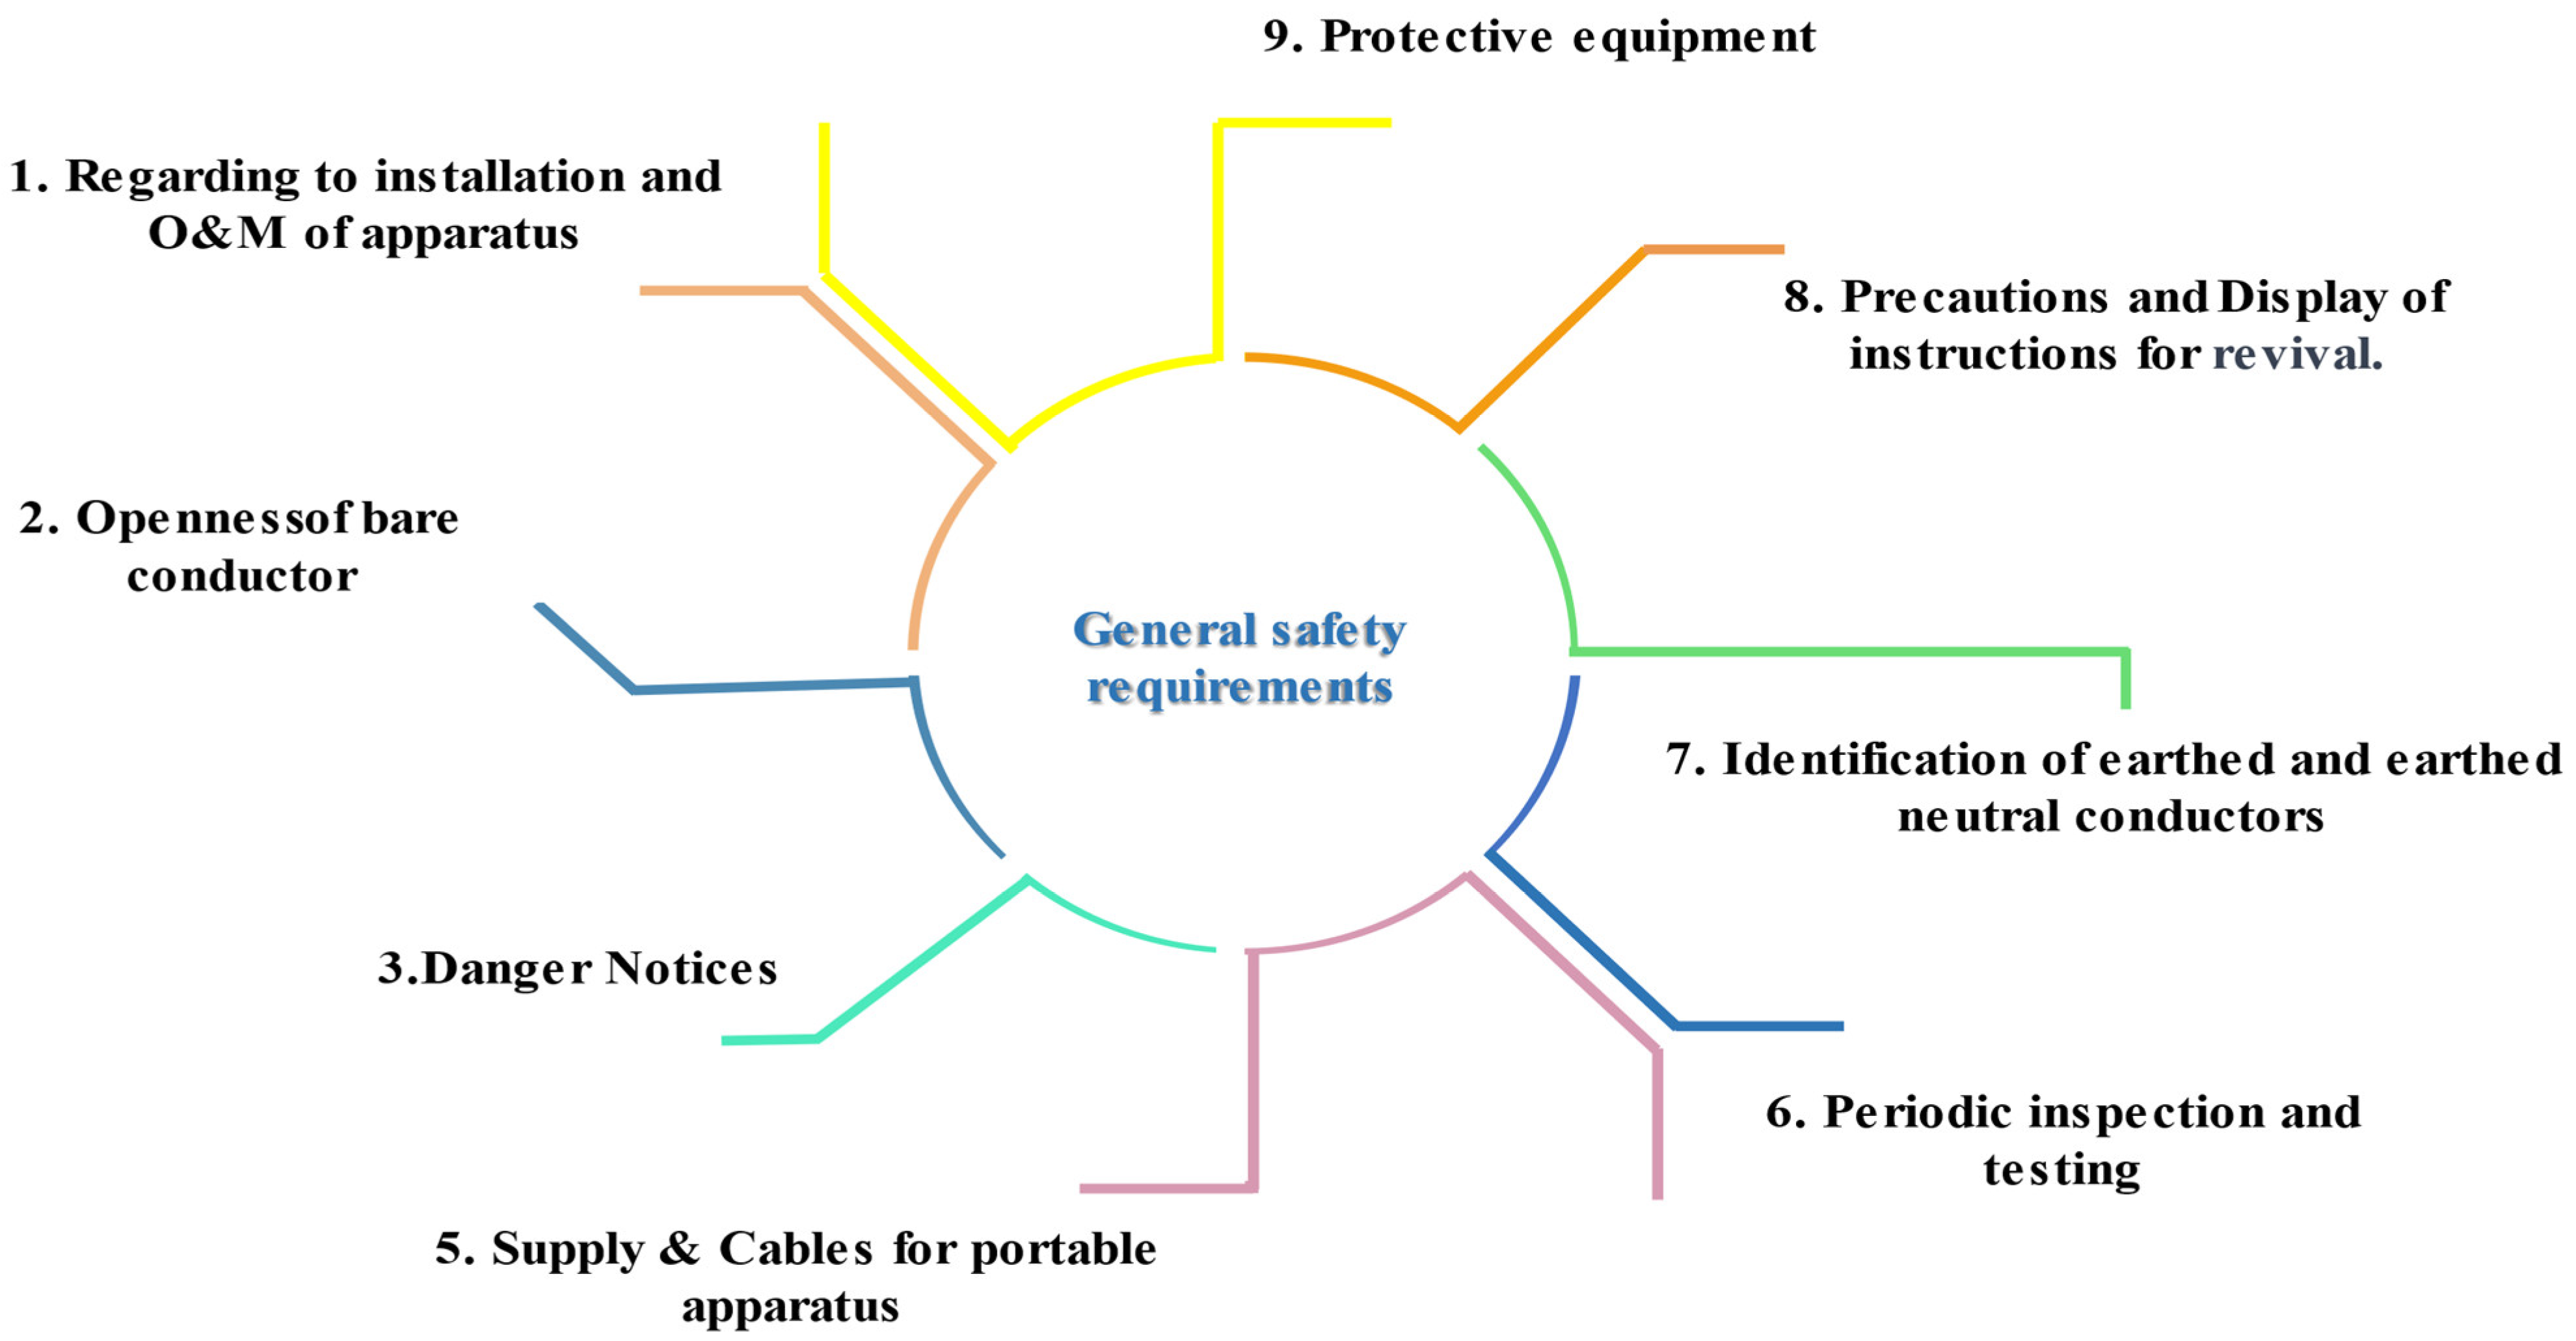
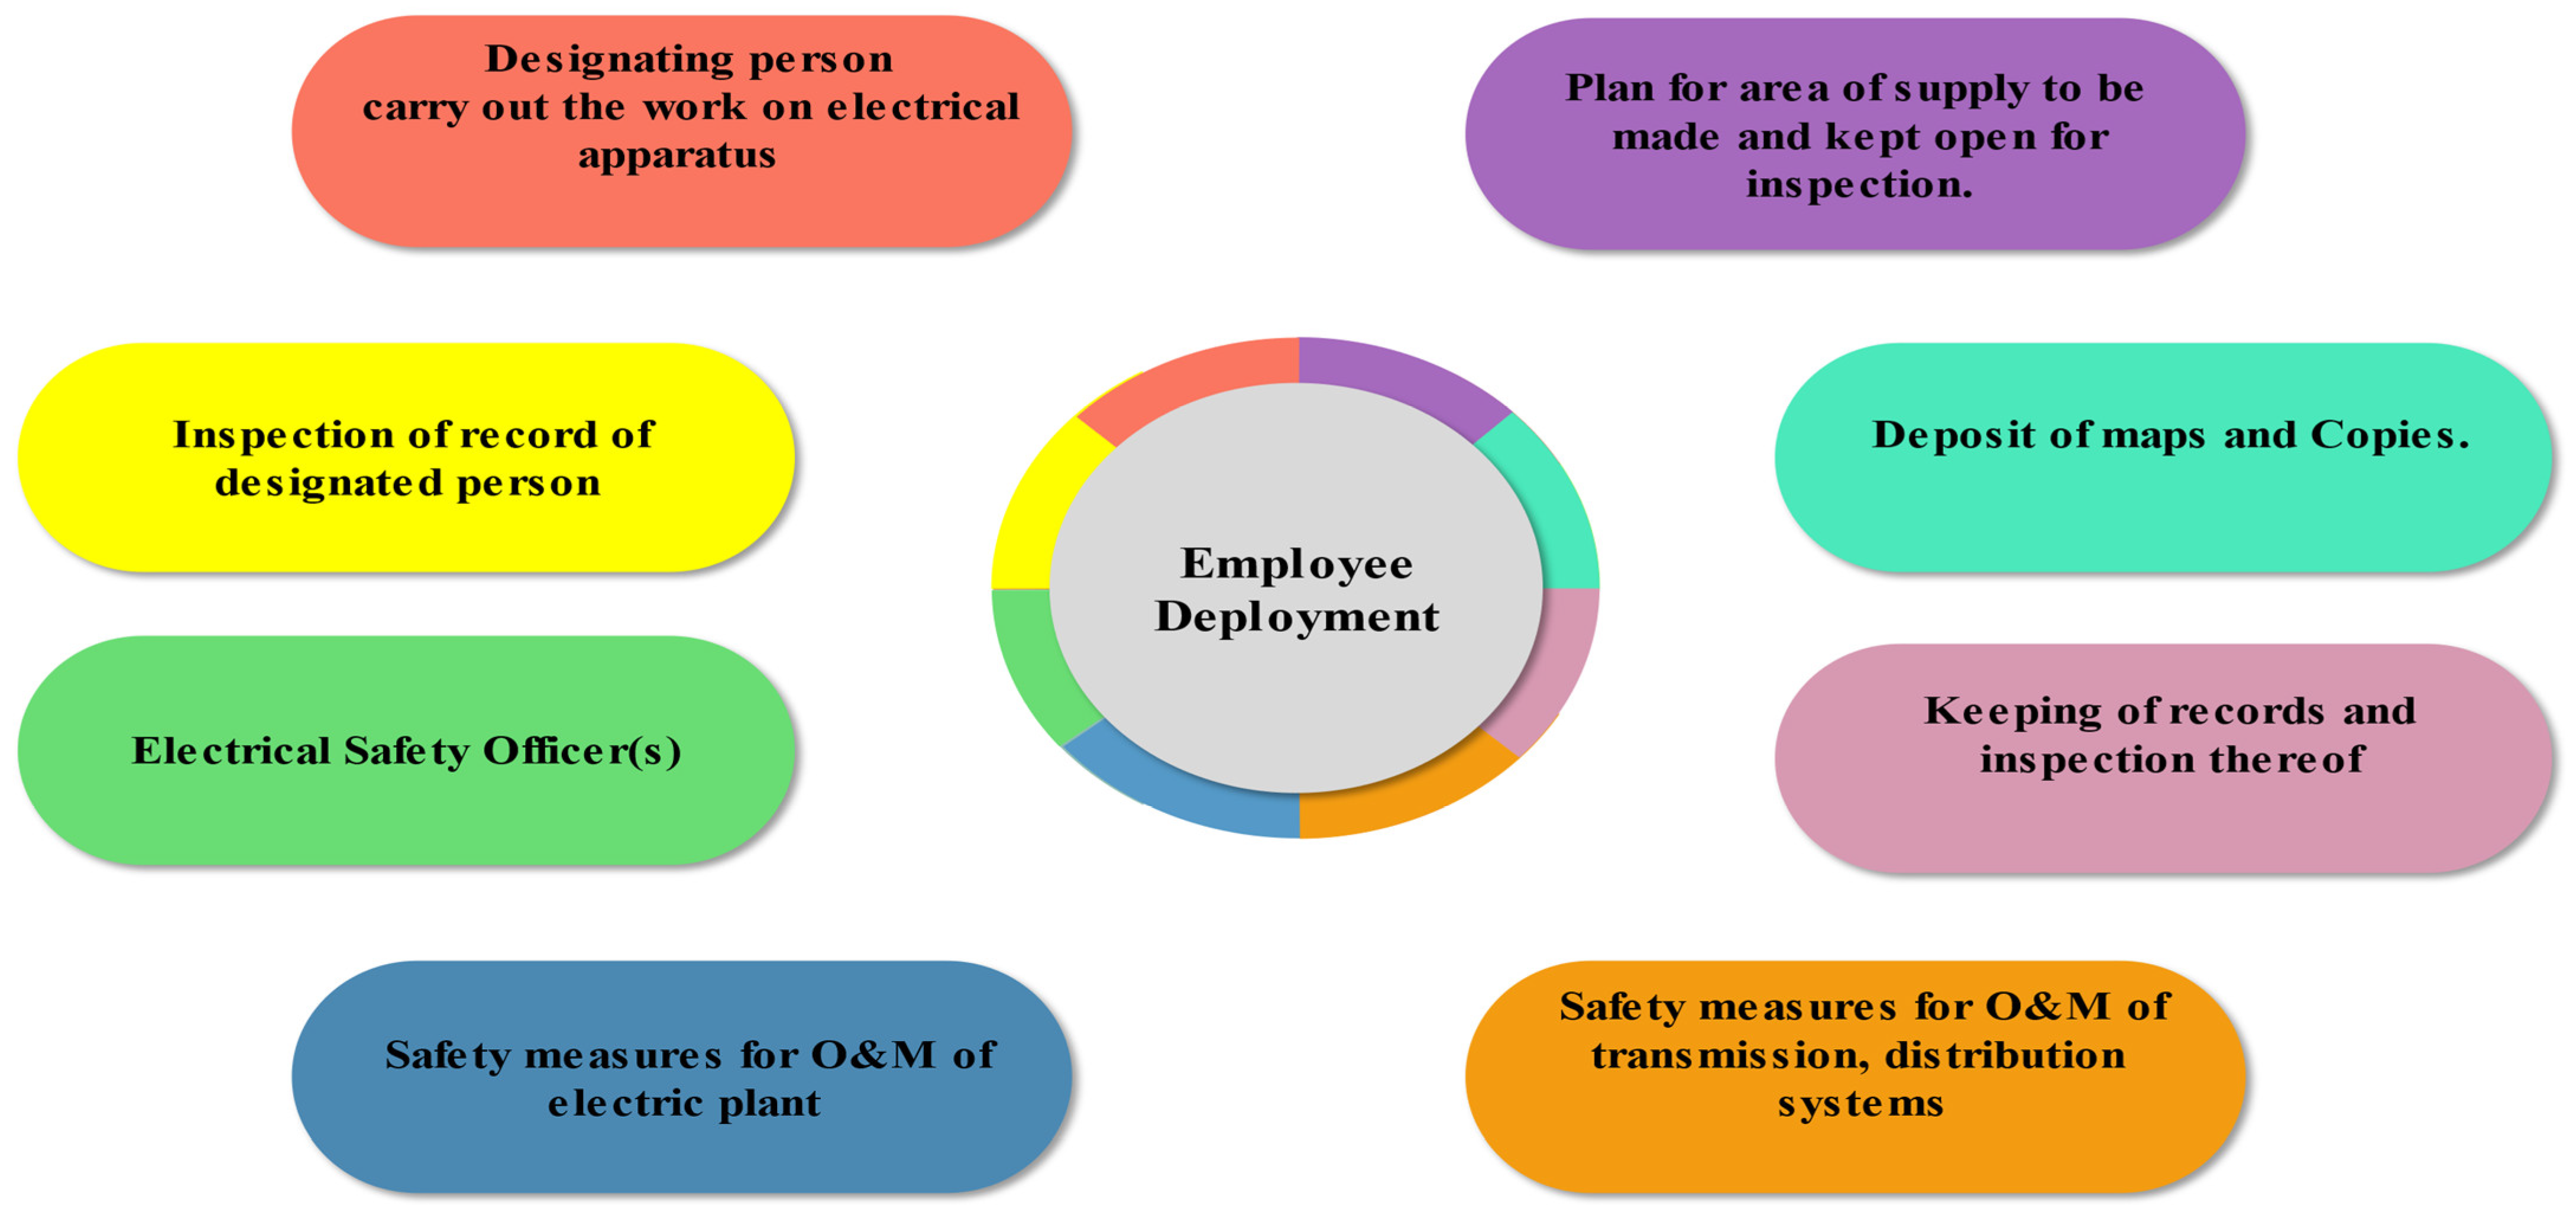
6.8. Organization Working for the Development of the Standards and Regulations

The technical standards and laws governing the nation’s power sector are being periodically standardized by CEA. The main organization in charge of standards for the security of the electric grid is CEA. CEA plays a very crucial role in the national electricity plan, specifying technical regulations and generation planning studies, etc. CEA amended the CEA (measures relating to safety and electric supply) Guidelines, 2010, to incorporate safety aspects with respect to the charging stations [40], and the Draft Guidelines for the Solar power Plant. Moreover, MoP/CEA implemented a plan, “Transmission System for Integration of over 500 GW RE Capacity by 2030”, which will help in the distribution of power generated from areas that have high solar and wind energy potential through the inter-state transmission system (ISTS) to the different load centers across the country. CEA published the “2019 Technical Standards for Distributed Generation Resources Connectivity”. The Central Electricity Regulatory Commission (Connectivity and General Network Access to the Inter-State Transmission System) Regulations, 2022 (hereinafter GNA Regulations) were already published and in effect now [41] and apply to all generating companies or persons owning distributed generation resources that are connected to or seeking connectivity with the electricity system. The pre-charging of the energy generating plant needs to obtain energization approval after a series of inspections. Periodic inspections after two years are also required. The relevance of the safety measures as per the 2010 regulations is shown in Figure 7.
Figure 8 highlights the general requirements for pre-charging and post-installation to be carried out as per the CEA standard. If any inadequate part is found, the series of points regarding compliance, as per the relevant regulation, needs to be fulfilled to achieve the issuance of the charging permission of any electrical equipment above 650 V.
The above figure illustrates the deployment of employees and workmen, as the safety and the monitoring is the most important part of the overall standards.

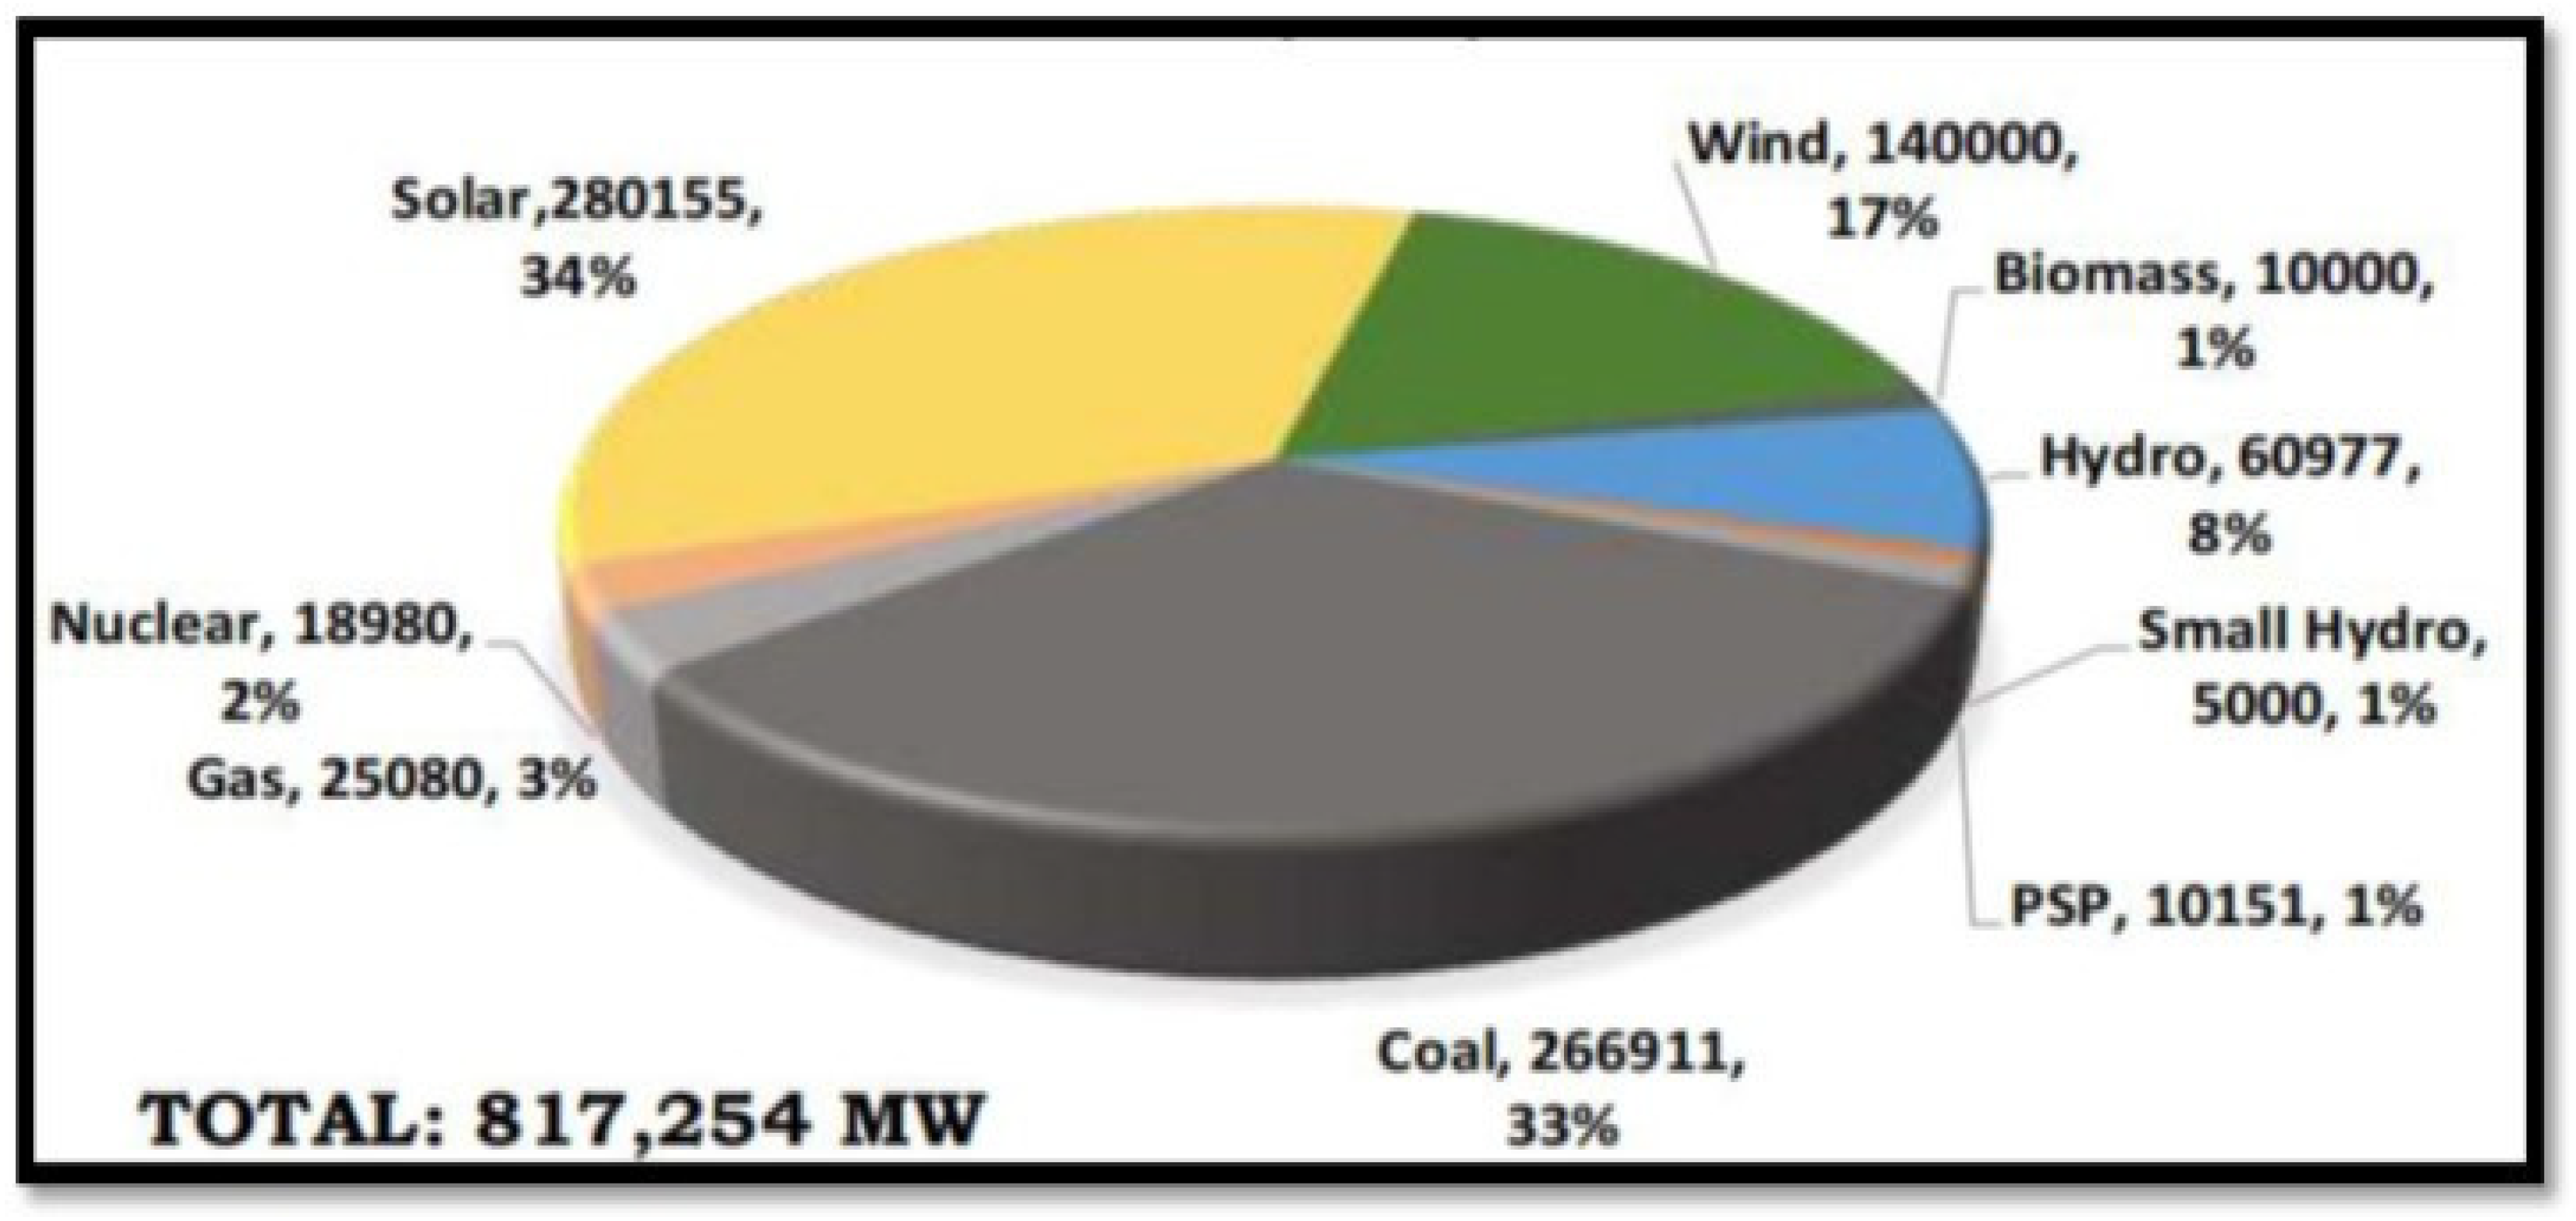
7. The Way Forward for the Target of 500 GW by 2030

A report released by CEA showed the optimal generation mix research for the years 2029–2030, which was determined by utilizing the most advanced computer generation expansion planning model, known as ORDENA, and the mid-term review of the National Electricity Plan (NEP), which was considered for the projected demand. As of 2029–2030, the total generating capacity of electricity connected with the national grid will be 817 GW. By the end of 2029–2030, the capacity of RES (solar + wind) connected to the grid is predicted to be around 420 GW (280 GW solar + 140 GW wind); this capacity will be more than 50% of the total installed capacity of 817 GW [42].
The proposed connected capacity by 2029–2030 is shown in Figure 9. The installed capacity based on non-fossil fuels (biomass, wind, solar, hydro, and nuclear) is expected to represent around 64% of the total installed capacity and provide about 44.7% of the gross power output in the years 2029–2030 [43].

8. Key Challenges in the Sector

8.1. Declining Wind Installations

India’s government has set a target of 500 GW of clean energy by 2030. Within the technology breakdown of this target, the energy from wind sources has the second-highest share, at 140 GW. India currently has around 40 GW of installed wind power. India has achieved more than 65% of its wind power goal. However, the current policy system stipulates that before commissioning a plant, the developer must first sign a PPA with the utilities. Wind technology has advanced to the point that it is now possible to harvest wind from previously unviable locations. Gujarat was the first state to adopt a strategy that allows wasteland to be leased or used for clean energy parks. Furthermore, policies that encourage the growth of the country’s renewable portfolio, such as the waiver of inter-state transmission charges on solar and wind power projects until June 2025, will encourage installations.

8.2. State and Central Subsidy on Solar Roof Top

The ministry set a target of 40 GW of rooftop solar power. The second phase of India’s grid-connected solar rooftop program was recently initiated by the Indian government. Just 5 GW of rooftop solar PV plants has been installed to date. Under phase II of the grid-connected rooftop solar program, the Indian government aims to cover the remaining 35 GW of rooftop solar energy, as well as provide financial assistance of up to INR 118.14 billion. This will be given in the form of a subsidy as well as viability gap financing, which would potentially aid in the country’s solar installation process.

8.3. Barrel Land Acquisition

The identification of clear land is a major issue for establishing green energy projects, especially large-scale solar parks, where the land requirement is enormous and the SPPDs are unable to locate such a large area of land. Although improvements should have been made more quickly, delays have been noted due to land clearances.

8.4. Transmission Challenges

The transmission challenges include the following: delay due to RoW issues; delay due to court cases; delay due to forest clearances; low/nil bid turnout; and contractors leaving work due to financial issues and impact of COVID-19.

8.5. Domestic Solar Panel Manufacturing

India imported 90% of its panels from China before the implementation of safeguard duties. To promote production in India, the Indian government levied a safeguard tax. India currently has a solar production capacity of around 10 GW per year. However, we still have a long way to go. The imposition of a safeguard obligation has hindered the country’s solar installation operation. The developers were not excited about tenders requiring production capacity. With an investment of INR 24,000 crore, the Indian government is implementing the Production Linked Incentive (PLI) Scheme for the National Programme on High-Efficiency Solar PV Modules. The scheme aims to increase the domestic production capacity of high-efficiency solar PV modules and solar PV cells to a gigawatt (GW) scale [44].

8.6. Discontinuation of Customs Duty Exemption (CCDC)

The Ministry of Finance notified that the benefit of the Concessional Customs Duty (CCDC) for products imported for the initial installation of the solar plant has been discontinued. Customs duty exemption started in early 2011 and was withdrawn on 2021; due to almost 10 years of these relaxations, the solar industry has been standardized and has also attracted investors. This withdrawal has imposed a huge burden on developers because of the dependency of utility-based projects on central inverters that are manufactured and tested in China, which has led to an increase in the inverter prices in the country of at least 10 percent. For wind power, the Ministry of Finance notified that the CCDC for a number of wind turbine components has been extended until 31 March 2023.

8.7. Supply Disruption and COVID-19 Impact

The pandemic’s immediate impact on the renewable energy industry was rather minimal. It was expected that construction of utility-scale projects would catch up significantly during 2021–2022, thanks to the relaxation of COVID-19 restrictions and the gradual opening up of the economy. The sector’s resurgence would be dependent on the economy starting up again. With an increase in their relative proportion of the total power mix, renewables emerged as a positive development. We estimate an 18–20% decline in rooftop and open-access installations occurred in 2020. Additionally, these markets were vulnerable to escalating policy uncertainty in 2021 and 2022. With the lessening of lockdowns and the reopening of amenities, demand has begun to increase. There are important reforms that, in our opinion, must be implemented in the power sector in order for it to move towards a durable and adaptable recovery as we enter the post-COVID-19 period [45]. Finally, crucial lessons have been learnt by grid management regarding how to deal with growing volatility in electrical demand and supply. The ministry recently ordered an extension of time due to the under-implementation of wind and solar hybrid power projects. The previous date of the bid submission was 9th March 2021; however, considering the COVID-19 supply chain disruption, an extension for projects to March 2024 was granted. The trust level and the consideration of the demand of the developer is well understood by policy makers.

8.8. Grid Integration Challenges

Due to the two severe power outages in 2012, Grid India has been very cautious and planned for the integration of any generating unit and its scheduling. As is well-known, a continuous grid disturbance took place on the two days of 30 July and 31 July 2012, and six states, namely Himachal Pradesh, Punjab, Uttar Pradesh, Rajasthan, Haryana, and Jammu and Kashmir, were impacted by the north grid failure [46].
However, at that point in time, the electrical system was inadequate. In 2001, the electrical system in the north region had previously failed. In 2012, approximately 27% of the energy produced was destroyed in transmission or stolen, while the average difference between peak supply and demand was 9%. At that time, the country frequently experienced power outages that lasted up to 10 h, and 25% of the populace, or roughly 300 million people, had no access to electricity at all. The three-member committee constituted for the investigation of the same outage issued its report on 16 August 2012. They concluded that four important factors were responsible for the two days of blackout:
  • Weak inter-regional electricity transmission lines as a result of several ongoing outages (both planned and unplanned);
  • High loading on the 400 kV Bina–Gwalior–Agra link;
  • Inadequate response by State Load Dispatch Centers (SLDCs) to the instructions of Regional Load Dispatch Centers (RLDCs) to reduce over-withdrawal by the Northern Region utilities and under-withdrawal/excess generation by the Western Region utilities;
  • Loss of the 400 kV Bina–Gwalior link due to mis-operation of its protection system.
This huge loss was addressed to create awareness of the system studies, in which grid protection and prediction of the faults are monitored. Most recently, the CEA issued the report of the working group on the data submission process and checked for compliance with the standards for granting connectivity to the grid by RE generators. This comprises the modeling of the power generating plants and their responses at the level of the generating unit, such as the inverter and WTG, is understood before granting the connectivity. The study proposed that the demand of the reactive power should also be met via capacitor bank, STATCOM, or additional inverter capacity.

8.9. Demand of the Large-Scale Energy Storage Systems

Renewable energy sources such as solar and wind cause significant disturbances to the grid. Furthermore, because of the uncertainty due to the dependency on factors such as irradiation and wind velocity for generation, the transmission system is unused during non-solar hours, thereby creating a large number of drawbacks. Thus, the government proposed RTC (round-the-clock) generation by the plants by the means of making them hybrid or providing additional sources of generation, along with storage. However, this again led to the reversal of the tariff due to the high cost of the battery banks.

8.10. Solar Project Study on Dynamic and Static Modeling Report

As per the recent nomination on the Working Committee Group Modeling and Benchmarking report, all the solar plant model is to be developed and need to be run on PSCAD before FTC approval. The industry has not yet learned that a period of months is always required to develop and run the model successfully.
In case any changes may need to be addressed for compliance after charging, all points should be addressed in the as-built drawing for further submission.

8.11. High Reactive Power Demand Due to PPC Malfunctioning

In the case of 50 MW solar-based plants, there have been many cases in which the cause of maximum demand (KVA) substantially higher than the contracted load was due to the flow of the reactive load on either side of the grid. In many cases, the flow of reactive power to the grid was seen due to overcompensation by the capacitor bank installed by consumers at the generator premises. Even when reactive power is on the export side (toward the grid), the energy meter registers it with a KVA import due to the lag+lead logic that is built into it. Hence, the billing was done as per the prevailing tariff order; this cost was imposed on the developer in crore of the value in the billing cycle instead of lakhs, as per the auxiliary load demand during the night-time period.

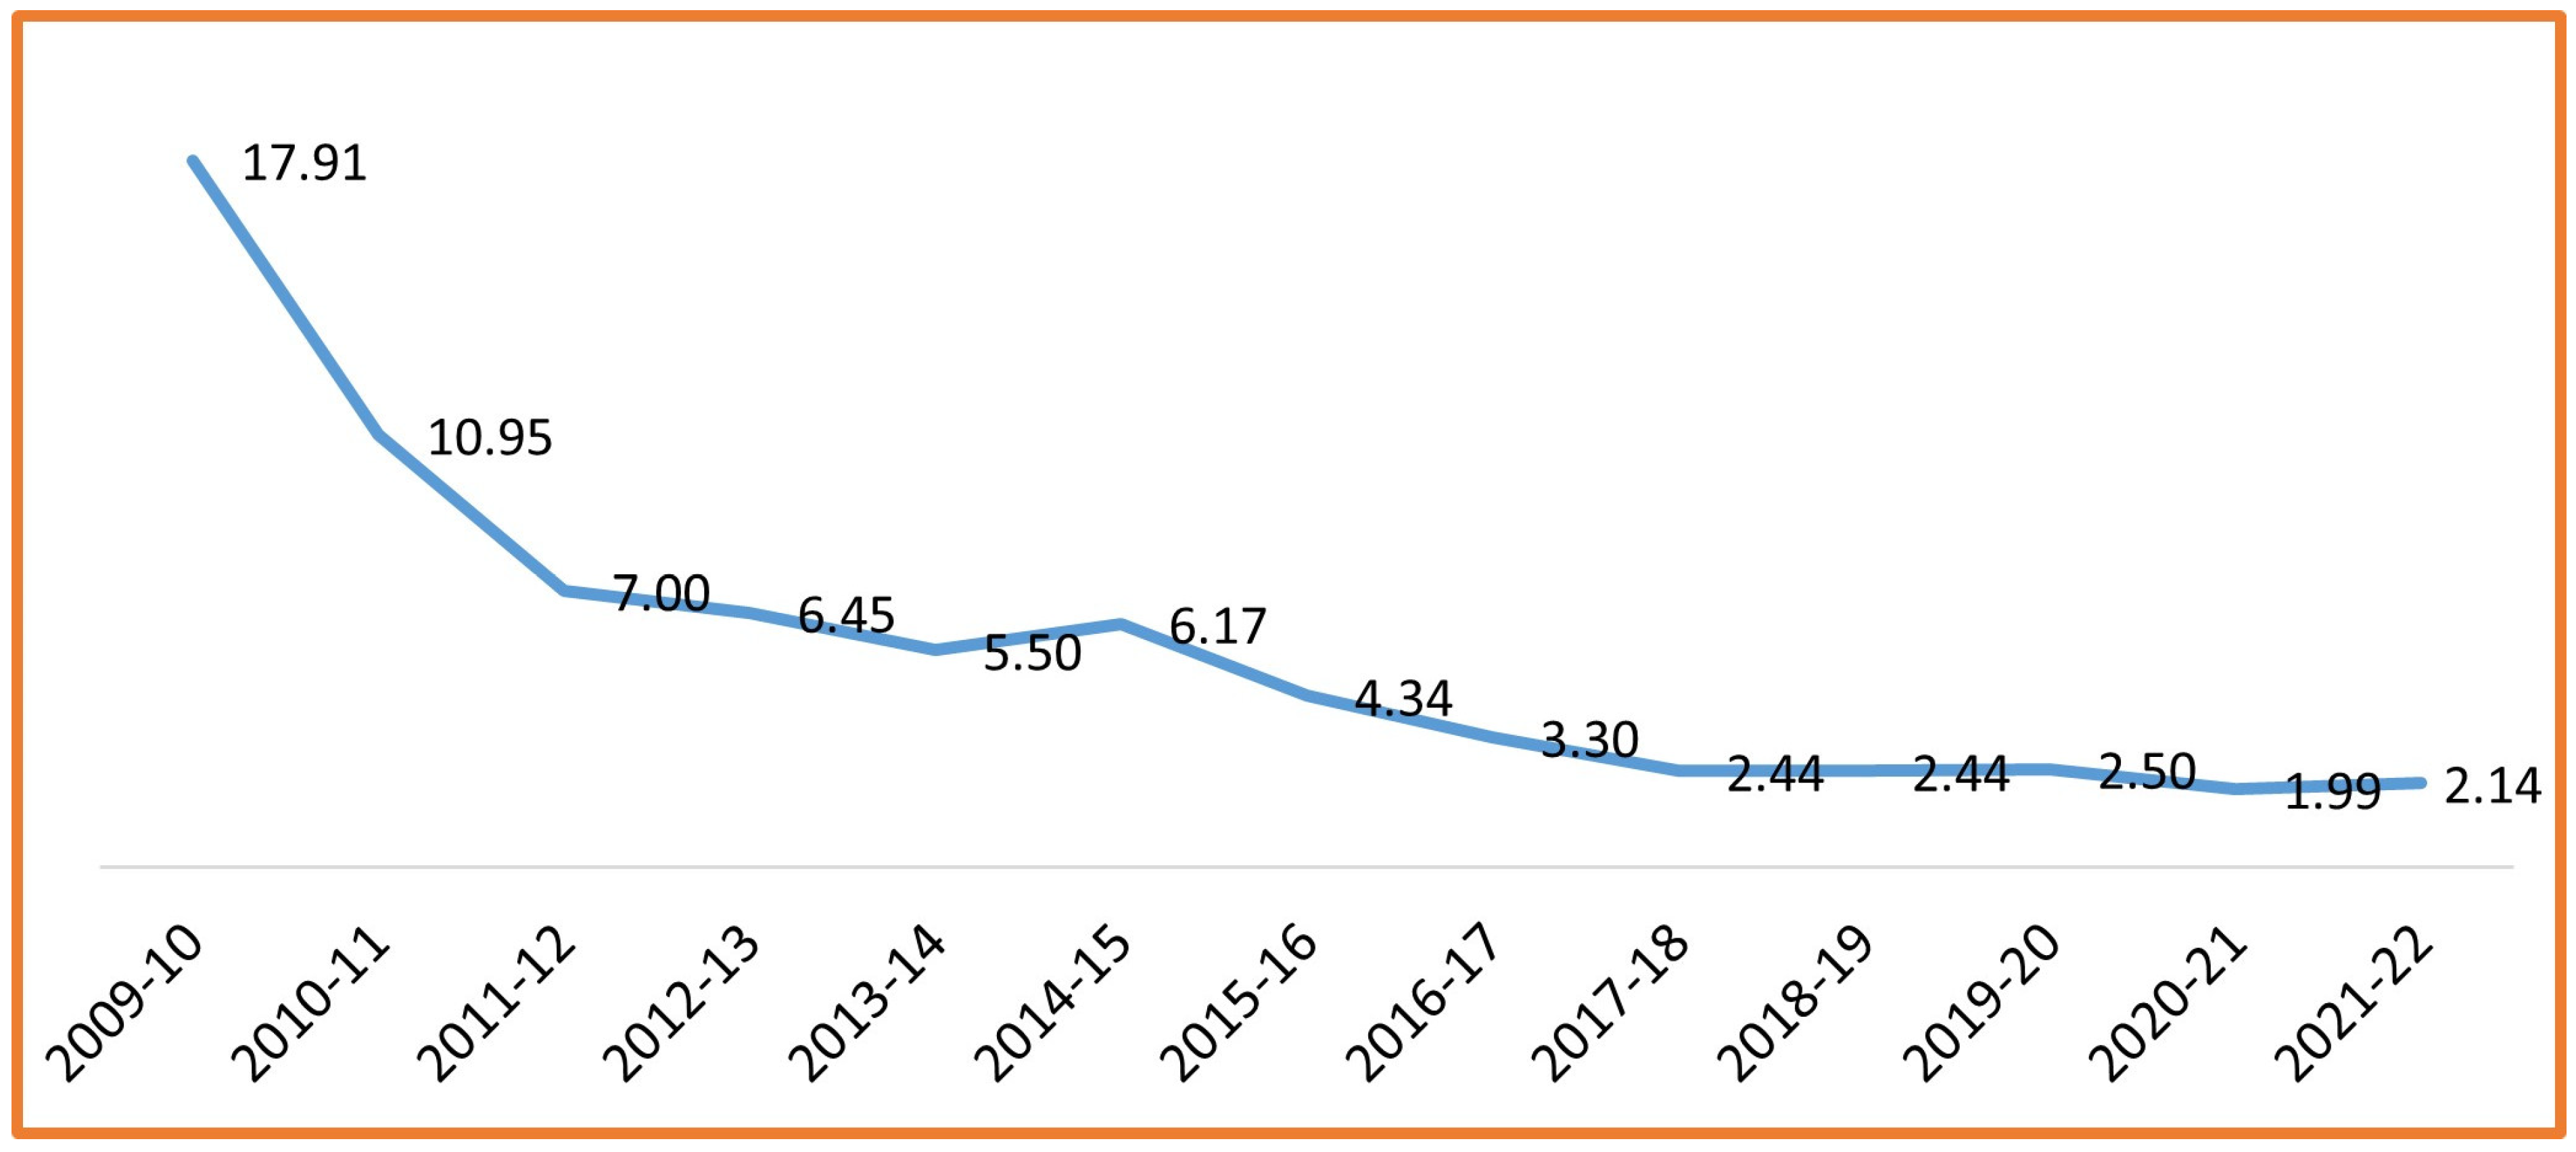
8.12. Tariffs Steep Fall and Exponential Rise

Recent years have seen a significant increase in solar power capacity, to 12 W in FY 2017 compared to 3 GW in FY 2015. Solar energy is currently more affordable than thermal or variable power. The minimum rates decreased throughout the period from 12.16 INR/kWh in 2010 to 2.44 INR/kWh in 2017 (Figure 10), representing a 73% decrease [47].
The lowest solar price ever, 2.44 INR per unit, was offered in May 2017 under the bid for a 500 MW project at Bhadla, Rajasthan, marking a turning point in the downward trend. The average bid for the reverse auctions held in April 2017 was about 3.15 INR/kWh. In contrast, NTPC’s coal rate for the same time period was close to 3.20 INR/kWh, indicating that P-V power had been about 18% less expensive than coal. The adoption of inexpensive P-V panels from China, cheaper borrowing costs, and other factors have all been cited as contributing to the decline in prices, in addition to the introduction of solar parks, competitive auctions, and the entry of big electricity firms [47].
The Table 5 data very clearly show the steep fall and rise in the tariff; that of the agriculture feeder is on the higher side due to the subsidy of 50 paise from central government.

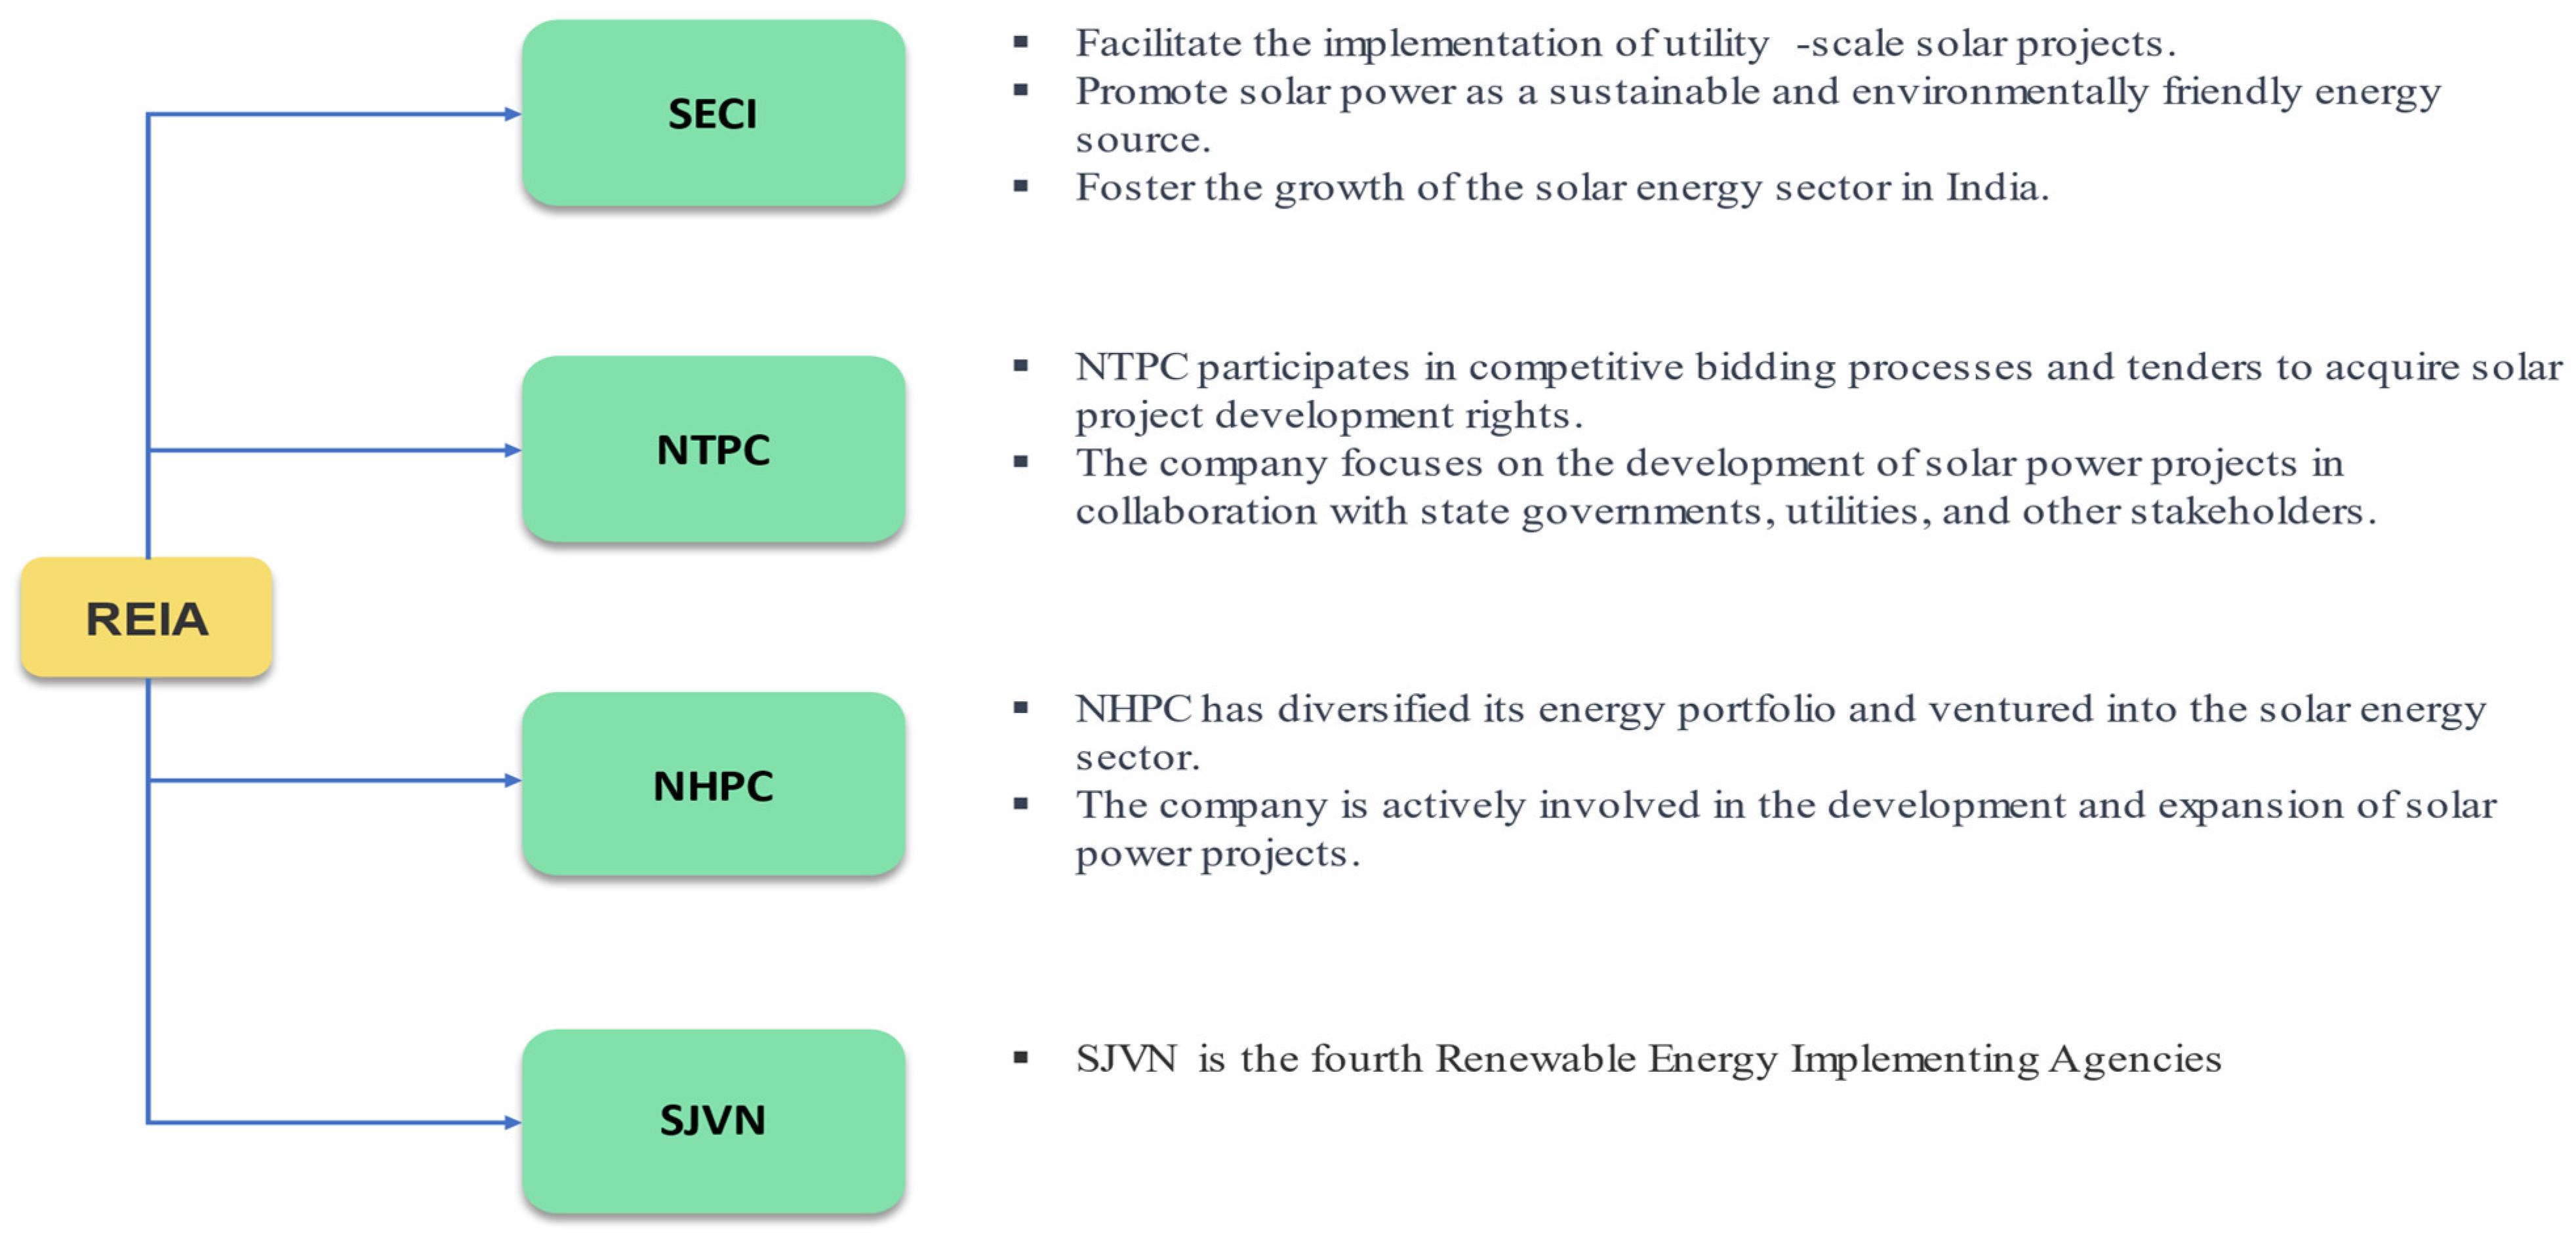
9. Institutions Supporting the MNRE and Key Roles

The independent body cannot achieve the ambitious target of 500 GW by 2030; hence, the MNRE developed multiple arms to provide support and help with implementation of the set targets. These subordinate bodies work under the Ministry of Power and the Ministry of New and Renewable Energy. The main organization is listed under Table 6 along with their key role.
The bodies listed in Figure 11 play a vital role, either directly or indirectly, in the implementation of the policies, and this enhances the targets and the demand to be certainly fulfilled by the authorities of the country.
The Renewable Energy Implementing Agency (REIA) is the body formed for floating the bids and opening the tenders to avoid concurrent bids. As shown in Figure 12, it is associated with multiple agencies, and the projects are allocated according to the targets that need to be fulfilled. These bodies are heavily involved in the bidding process for the projects in the RE sector. The MNRE has issued the bidding calendar for FY 23–24, in which the projected target of 15 GW was set for the first two quarters and 10 GW for the next two quarters. The total target is 50 GW, comprising 40 GW from solar and 10 GW from wind [48].

10. Conclusions

This paper discussed the achievements in the RE sector and the long way forward to achieve the target set by the government of 500 GW by 2030. This target seems to be achievable with the favorable policies and preplanning for the key challenges in the RE sector. Moreover, we highlight all of the institutional bodies as the single stopping point for providing the solutions to the specific concerns, and thus a plan for a successful journey. However, this study mainly focuses on solar energy, and researchers can focus on other sources of RE, such as wind, biomass, and small hydro, which can also be reviewed with their targets and achievements. The following conclusions were drawn:
  • The main focus is on clean and green energy, free from carbon emissions, which requires a centralized space or portal for policy planning, and its implementation should be updated from time to time.
  • The provision for the earning by the renewable energy plants needs to be a priority. Via good initiatives, such as PM-KUSUM yojana, the government should infuse the funds or provide subsides or loans for the development of solar PV plants. The agriculture tariff also can be subsided for the development of the plant.
  • Hazards to power systems can be caused by individuals, the surroundings, technological equipment, or the programming. These dangers occasionally have disastrous impacts that can cause the disruption of power and cause grid failures and blackouts. To manage and reduce the possibility of such occurrences, there is a critical need for emergency management across the power sector.
  • The investment for modernization and to ensure grid security needs to be actively pursued to ensure the security of the data, because data communication is the most important part of the scheduling and forecasting of the generating plant. This investment will create jobs for researching the data and system security.
  • The Indian government has appropriately recognized private sector involvement as a key tool for enhancing the power sector.
  • The emphasis on regulatory improvements and project efficiencies must be prioritized. On the efficiency front, there is a continuing need to concentrate on improving efficiencies throughout the repowering method, supply chain management, design, manpower handling, fuel and transportation costs, power purchase costs, and the efficiency of power-producing businesses. The government has improved tariff designs, which will surely reflect market growth and provide flexibility in subsidy provision, as funding of the viability gap in early RE projects is required on the regulatory side.
  • Presenting an outlook for the future and the path for the nation’s manufacturing plan will ease the dependency on the import of PV panels, inverters, and WTGs. This will also create a big market for Asia as a manufacturing hub of RE-based technologies and will create job opportunities for the new generation.
  • Repowering. Repowering refers to the ability to generate more power from the same plant, utilizing the same land and distribution infrastructure. Repowering using solar can be termed as the method of exchanging aging equipment or generating material used in solar PV panels with modern ones. These changes can have a bigger nameplate power or increase efficiency, resulting in an increase in net power production. Because of the space constraints, repowering of the RE projects, especially solar plants having MW capacity, will require the government to make policies for tracing and technically implementing the suggestions. This will enhance the productivity of the RE plants with the same resources.
  • Transmission via CTUs and STUs is a stem and DISCOMs are the branch of the system for the rooted power plants that need to be ranked by the ministry. This will definitely expand from private to public DISCOMs, and the ranking will create the competition for the collection of the revenue for the DISCOMs’ management company of the state, and also enable CTUs and STUs to enhance their network.
  • The acquisition of barren land for solar projects is currently a key challenge faced by the SPPDs because a huge quantum of land will be required for the solar plants. To help overcome this challenge, the central government introduced the solar park scheme, wherein the land and connectivity infrastructure is provided by the government on the payment of a fixed lease amount.
  • Subsidy for residential rooftop plants at a fixed benchmark cost; the central government provides 40% and some state governments also contribute over this ratio. This initiative, to be taken by all state governments, will attract more users, which will directly contribute to the achievement of the target of 500 GW.
  • Right of way (RoW) approval before charging of the plants, the delay in consent to this is a very serious issue, and this approval requires many permissions from forest owners, the national highway authority, and operators of telecommunication, defense, and railway services. The permissions required from all concerned departments are applicable to each case, and the development of a centralized portal that includes the interventions for all departments at the same time as the application will smooth the process.
  • Import duty benefits: The country is still dependent on the import of the latest technology for centralized inverters and string inverters. Until the infrastructure for the manufacturing and testing of these units, PLC, communication, and protection relays are developed, the government should give import duty exemption. This will attract foreign investors and achieve the large quantum scale needed for connection to the grid on time.
  • High reactive power demand due to PPC malfunctioning: The government should not impose heavy duties and surcharges due to reactive power demand, as this concern occurs entirely due to the failure of PPC (a power plant controller). Case-by-case relaxations should be provided by DISCOMs in support of RE developers.
  • It can be seen in the graphs that all of the above factors cause a rise in the tariffs after the corona effect. Relaxations should be provided by the key stakeholders in favor of developers for promoting renewable energy.
  • The majority of the compliances need to be fulfilled before the charging and commissioning of the RE plants, and are mostly associated with the government authorities of the concerned departments, as listed above. It is recommended to develop and promote a single-window monitoring portal for all applications, with intervention by the most senior authorities in case of any delay in the process. The portal should be regularly monitored for any due compliance, if any; then, appropriate action can be taken, even for the developer, and also in the form of a penalty.
  • Finally the solar PV plants with complete installed fulfilling all the compliances for charging should not be curtailed for their power generation and injection to grid. Ultimately, a generation loss is a big loss to the nation, and a committee should be formed to examine if the matter is subject to legal oversight or caused by any irrelevant issues. In these cases, the Commercial Operation of the Plant (COD) should not be awarded for the project until the issue is resolved.

Author Contributions

Methodology, B.D.; Formal analysis, B.D.; Investigation, B.D.; Writing—original draft, B.D.; Supervision, S.A. and A.K.S. All authors have read and agreed to the published version of the manuscript.

Funding

This research received no external funding.

Data Availability Statement

Data sharing is not applicable to this article.

Conflicts of Interest

The authors declare no conflict of interest.

Nomenclature

NSMJawaharlal Nehru National Solar Mission
MNREMinistry of New and Renewable Energy, Government of India
MoPMinistry of Power, Government of India
CEACentral Electricity Authority
CUFCapacity Utilization Factor
RERenewable Energy
RECRenewable Energy Certificate
RPORenewable Purchase Obligation
SDGSustainable Development Goals
PMKUSUMPradhan Mantri Kisan Urja Suraksha Evam Utthaan Mahabhiyan
GWGigawatt
MWMegawatt
NIPNational Infrastructure Pipeline
FYFinancial Year
COPConference of Parties
NTPNational Tariff Policy
NEPNational Electricity Policy
INDCIntended Nationally Determined Contributions
DISCOMsElectricity Distribution Companies
GUVNLGujarat Urja Vikash Nigam Limited
CTUCentral Transmission Utility
STUState Transmission Utility
POWERGRIDPower Grid Corporation of India Limited
ADBAsian Development Bank
WBWorld Bank
HVDCHigh Voltage Direct Current
CERCCentral Electricity Regulatory Commission
SERCState Electricity Regulatory Commissions
IREDAIndian Renewable Energy Development Agency
IPGCLIndraprastha Power Generation Company Limited
POSOCOPower System Operation Corporation Limited
GECGreen Energy Corridor
IPPIndependent Power Producer

References

  1. Available online: https://pib.gov.in/PressReleasePage.aspx?PRID=1885147#:~:text=as%20on%2031.10.-,2022.,the%20period%20Jan%20to%20Oct (accessed on 29 June 2023).
  2. Urhekar, S.; Sharma, M.; Sharma, S.D.; Meena, R.S. Yield enhancement analysis of installed solar power projects in the country: An assessment for productive utilization of the power through Repowering. BioGecko 2023, 12, 76–794. Available online: https://biogecko.co.nz/admin/uploads/11593_Biogeckoajournalfornewzealandherpetology_02-08-45.pdf (accessed on 14 June 2023).
  3. Available online: https://pib.gov.in/PressReleaseIframePage.aspx?PRID=1882145 (accessed on 29 June 2023).
  4. MNRE: Year End Review-2020. Available online: https://pib.gov.in/PressReleseDetail.aspx?PRID=1685046 (accessed on 14 June 2023).
  5. Press Information Bureau. Available online: https://pib.gov.in/PressReleasePage.aspx?PRID=1768712 (accessed on 19 July 2023).
  6. National Infra Structure Pipeline, (NIP/Vol2). Available online: https://dea.gov.in/sites/default/files/Report%20of%20the%20Task%20Force%20National%20Infrastructure%20Pipeline%20%28NIP%29%20-%20volume-ii_1.pdf (accessed on 14 June 2023).
  7. Behuria, P. The politics of late development in renewable energy sectors: Dependency and contradictory tensions in India’s National Solar Mission. World Dev. 2020, 126, 104726. [Google Scholar] [CrossRef]
  8. Gielen, D.; Boshell, F.; Saygin, D.; Bazilian, M.D.; Wagner, N.; Gorini, R. The role of renewable energy in the global energy transformation. Energy Strategy Rev. 2019, 24, 38–50. [Google Scholar] [CrossRef]
  9. Urpelainen, J.; Yang, J. Global patterns of power sector reform, 1982–2013. Energy Strategy Rev. 2019, 23, 152–162. [Google Scholar] [CrossRef]
  10. Adom, P.K. Energy indices: A risk factor or not in the financial sector. Energy Strategy Rev. 2019, 24, 14–26. [Google Scholar] [CrossRef]
  11. Raina, G.; Sinha, S. Outlook on the Indian scenario of solar energy strategies: Policies and challenges. Energy Strategy Rev. 2019, 24, 331–341. [Google Scholar] [CrossRef]
  12. Chandel, S.; Shrivastva, R.; Sharma, V.; Ramasamy, P. Overview of the initiatives in renewable energy sector under the national action plan on climate change in India. Renew. Sustain. Energy Rev. 2016, 54, 866–873. [Google Scholar] [CrossRef]
  13. Thapar, S.; Sharma, S.; Verma, A. Economic and environmental effectiveness of renewable energy policy instruments: Best practices from India. Renew. Sustain. Energy Rev. 2016, 66, 487–498. [Google Scholar] [CrossRef]
  14. Schmid, G. The development of renewable energy power in India: Which policies have been effective? Energy Policy 2012, 45, 317–326. [Google Scholar] [CrossRef]
  15. Plutshack, V. New and renewable energy social enterprises accessing government support: Findings from India. Energy Policy 2019, 132, 367–378. [Google Scholar] [CrossRef]
  16. MNRE, Physical Progress. Available online: https://mnre.gov.in/the-ministry/physical-progress (accessed on 14 June 2023).
  17. Kumar, J.C.R.; Majid, M.A. Renewable energy for sustainable development in India: Current status, future prospects, challenges, employment, and investment opportunities. Energy Sustain. Soc. 2020, 10, 2. [Google Scholar] [CrossRef]
  18. PIB. Published on 1 December 2021. Available online: https://static.pib.gov.in/WriteReadData/specificdocs/documents/2021/dec/doc202112101.pdf (accessed on 14 June 2023).
  19. SECI, Uploads. Available online: https://www.seci.co.in/upload/static/files/mission_document_JNNSM(1).pdf (accessed on 14 June 2023).
  20. PIB. Published on 2 October 2015. Available online: https://pib.gov.in/newsite/printrelease.aspx?relid=128403 (accessed on 14 June 2023).
  21. MNRE, Annual Report 21-2022. Available online: https://mnre.gov.in/img/documents/uploads/file_f-1671012052530.pdf (accessed on 14 June 2023).
  22. PIB. Published on 6 January 2022. Available online: https://pib.gov.in/PressReleaseIframePage.aspx?PRID=1788011 (accessed on 14 June 2023).
  23. MNRE. Available online: https://mnre.gov.in/solar/rpo/ (accessed on 14 June 2023).
  24. MOP. Available online: https://powermin.gov.in/sites/default/files/Renewable_Purchase_Obligation_and_Energy_Storage_Obligation_Trajectory_till_2029_30.pdf (accessed on 14 June 2023).
  25. MNRE. Available online: https://mnre.gov.in/img/documents/uploads/file_f-1664883789129.pdf (accessed on 14 June 2023).
  26. MNRE. Available online: https://mnre.gov.in/isa/ (accessed on 14 June 2023).
  27. Available online: https://www.pv-magazine-india.com/2022/11/14/india-terminates-solar-cell-anti-dumping-probe/ (accessed on 29 June 2023).
  28. Available online: https://www.iea.org/reports/solar-pv-global-supply-chains/executive-summary (accessed on 29 June 2023).
  29. The Economic Times, Published 13 November 2022. Available online: https://economictimes.indiatimes.com/industry/renewables/india-terminates-anti-dumping-probe-into-solar-cell-imports-from-china-thailanlandvietnam/articleshow/95484210.cms?utm_source=contentofinterest&utm_medium=text&utm_campaign=cppst (accessed on 14 June 2023).
  30. ISA. Available online: https://isolaralliance.org/uploads/docs/e90583619e442a2b277b445050eeac.pdf (accessed on 14 June 2023).
  31. Available online: https://timesofindia.indiatimes.com/readersblog/pracin-jain-academy/india-has-immense-potential-of-solar-energy-29567/ (accessed on 29 June 2023).
  32. MNRE. Available online: https://mnre.gov.in/sites/default/files/webform/notices/National-Wind-Solar-Hybrid-Policy.pdf (accessed on 14 June 2023).
  33. Thapar, S. Centralized vs. decentralized solar: A comparison study (India). Renew. Energy 2022, 194, 687–704. [Google Scholar] [CrossRef]
  34. The Economic Times, Publised 2 December 2022. Available online: https://economictimes.indiatimes.com/industry/energy/power/power-ministry-waives-inter-state-transmission-system-charges-for-new-hydro-power-projects/articleshow/95944110.cms (accessed on 14 June 2023).
  35. Available online: https://pib.gov.in/PressReleaseIframePage.aspx?PRID=1880517 (accessed on 29 June 2023).
  36. GOI. Available online: https://pib.gov.in/PressReleseDetail.aspx?PRID=1885147 (accessed on 14 June 2023).
  37. SolarQuarter. Available online: https://solarquarter.com/2023/03/18/india-approves-57-solar-parks-with-39-28-gw-capacity-but-many-delayed/ (accessed on 14 March 2023).
  38. MNRE. Available online: https://mnre.gov.in/solar/schemes (accessed on 14 June 2023).
  39. Available online: https://economictimes.indiatimes.com/small-biz/sme-sector/to-impose-or-not-to-impose-anti-dumping-duty-budgets-retrospective-amendment-may-impact-domestic-industry/articleshow/98292184.cms?from=mdr (accessed on 29 June 2023).
  40. CEA (Measures Relating to Safety and Electric Supply) Regulations, 2010 Amendment-Safety Aspects with Respect to the Charging Stations. Available online: https://cea.nic.in/regulations-category/measures-relating-to-safety-and-electric-supply/?lang=en (accessed on 14 June 2023).
  41. CEA. “Technical Standards for Connectivity of Distributed Generation Resources 2019” Regulation. Available online: https://cea.nic.in/regulations-category/connectivity-of-distributed-generation-resources/?lang=en (accessed on 14 June 2023).
  42. Mukhopadhyay, S.; Batra, P.; Sharma, S.; Gupta, P.; Arya, B.K.; Rajput, A.K.; Menghani, V. Long Term Planning for Indian Power Sector with Integration of Renewable Energy Sources. In Proceedings of the 2020 IEEE International Conference, Dublin, Ireland, 7–11 June 2020. [Google Scholar]
  43. Central Electricity Authority, Report on Optimal Generation Capacity Mix for 2029-30. Available online: https://cea.nic.in/wpcontent/uploads/notification/2023/05/Optimal_mix_report__2029_30_Version_2.0__For_Uploading.pdf (accessed on 14 June 2023).
  44. Available online: https://pib.gov.in/PressReleasePage.aspx?PRID=1897774 (accessed on 14 June 2023).
  45. Deshwal, D.; Sangwan, P.; Dahiya, N. How will COVID-19 impact renewable energy in India? Exploring challenges, lessons and emerging opportunities. Energy Res. Soc. Sci. 2021, 77, 102097. [Google Scholar] [CrossRef] [PubMed]
  46. Available online: https://www.businesstoday.in/industry/energy/story/power-failure-in-north-india-affects-7-states-33717-2012-07-30 (accessed on 14 June 2023).
  47. Available online: https://mercomindia.com/mercom-exclusive-solar-tariffs-indiafallen-73-percent-since-2010/ (accessed on 14 June 2023).
  48. Available online: https://mnre.gov.in/img/documents/uploads/file_f-1682405289970.pdf (accessed on 14 June 2023).
Figure 1. Yearly cumulative capacity installed in the solar sector of India; data from the Ministry of New and Renewable Energy (website) and [21].
Energies 16 05491 g001
Figure 2. Yearly solar tariff in INR/kWh; data from Ministry of New and Renewable Energy website and [21].
Energies 16 05491 g002
Figure 3. Yearly Renewable Purchase Obligation (RPO) trajectory; data from Ministry of Power website and [23].
Energies 16 05491 g003
Figure 4. Contribution from renewable energy in the power sector (as of 31 December 2022; source: Ministry of Power [30]).
Energies 16 05491 g004
Figure 5. Yearly progress in cumulative RE capacity (as on 31 December 2022; data from Ministry of New and Renewable Energy website and [21].
Energies 16 05491 g005
Figure 6. Year-wise share of RE in installed capacity (%) (Source: MNRE/MoP [29,30]).
Energies 16 05491 g006
Figure 7. Basic information about the safety requirement of the new unit.
Energies 16 05491 g007
Figure 8. Deployment of the manpower with relevance to safety.
Energies 16 05491 g008
Figure 9. Projected installed capacity by 2029–2030.
Energies 16 05491 g009
Figure 10. Steep fall in solar tariffs in the last eight years (source [47]).
Energies 16 05491 g010
Figure 11. The supporting arms of the MNRE.
Energies 16 05491 g011
Figure 12. Agencies supporting REIA.
Energies 16 05491 g012
Table 1. The table shows the yearly breakdown of the total capital expenditure and the achievements until October 2019 for the various categories; data from National Infrastructure Pipeline Vol 2 [6].
CategoryTarget by December 25 (in GW)Actual Achievement until October 19 (in GW)Capacity to Be Added by FYCapex over FY20-23 (Rs Cr)
Solar power149.731.4118472,000
Wind power96.9937.0959.90419,300
Small hydropower74.652.3523,500
Biopower12.049.942.1014,700
Total265.7383.38182.35929,500
Capital expenditure over FY20 to FY25
INR croreFY20FY22FY23FY24FY25Total
Capital Expenditure30,500151,000144,000170,000217,000929,500
Table 2. Summary of the five Panchamrits.
PanchamritIndia’s Commitment to Climate Action
Panch 1 of 5Reach 500GW energy from non-fossil fuels by 2030
Panch 2 of 5By 2030, renewable energy will provide 50% of India’s energy needs
Panch 3 of 5Between now and 2030, the anticipated global carbon emissions must be reduced by one billion tonnes
Panch 4 of 5By 2030, the economy’s intensity of carbon will have decreased by 45% from 2005 levels
Table 3. Schedule for hydropower plants; source [35].
Sr. No.PPA SignedApplicable ISTS ChargesRemark
1On or before 30 June 2025NilPPA signed and construction work is awarded
21 July 2025 to 30 June 202625%
31 July 2026 to 30 June 202750%
41 July 2027 to 30 June 202875%
51 July 2028100% ISTS fees will be charged
Table 4. Breakdown of the components.
SR. NO.ComponentCapacityNumbers AchievedTarget
1A. Solar Power PlantDecentralized ground-mounted solar power plants with grid connectivity25.25 MW10,000 MW
2B. Solar PumpStandalone solar-powered agriculture pumps75,00020 Lakh
3C. Solar PumpSolarization of currently installed grid-connected solar-powered agriculture pumps100015 Lakh
Table 5. The tariffs discovered are summarized with highest and lowest bids.
S. No.Bidding Agency/LocationSchemeE-Reverse Auction (Year and Month)Capacity Offer (MW)Highest Bid (INR/KWh)Lowest Bid (INR/KWh)
Tariff discovered in the year 2017 under various schemes/projects
1RUMSL—Madhya PradeshState Scheme2017-February7502.9792.97
2NTPC—Andhra PradeshBundling Scheme2017-April2503.153.15
3SECI—Rajasthan-Bhadla Ph IV Solar ParkVGF Scheme2017-May2502.632.62
4SECI—Rajasthan—Bhadla Ph III Solar ParkVGF Scheme2017-May5002.452.44
5TANGEDCO—Tamil NaduState Scheme2017-July15003.973.47
6GUNL—GujaratState Scheme2017-August5002.672.65
8SECI—Rajasthan—Bhadla Ph IV Solar ParkVGF Scheme2017-December2502.492.48
9SECI—Rajasthan—Bhadla Ph III Solar ParkVGF Scheme2017-December5002.482.47
Tariff discovered in the year 2018 under various schemes/projects
1SECI—GujaratState Scheme2018-March5003.062.98
2KREDL—Karnataka—Pavagda Solar ParkState Scheme2018-March5502.932.91
3MSEDCL—Maharashtra State Scheme2018-May10002.722.71
4APDCL—AssamState Scheme2018-June853.73.17
5SECI—Uttar Pradesh—Solar ParkVGF Scheme2018-June1253.383.32
6SECI—Andhra Pradesh-Kadapa Solar ParkVGF Scheme2018-July7502.712.7
7UPNEDA—Uttar PradeshState Scheme2018-July10003.553.48
8SECI—Anywhere in IndiaISTS-I Scheme2018-July20002.542.44
9SECI—Anywhere in IndiaISTS-II Scheme2018-July30002.712.44
10KREDL—Karnataka—Pavagada Solar ParkState Scheme2018-July5002.852.85
11SECI—Odisha State Scheme2018-July2003.22.79
12NTPC—Anywhere in IndiaISTS Scheme2018-August20002.62.59
13GUVNL—Gujarat State Scheme2018-September5002.452.44
14KREDL—KarnatakaState Scheme2018-October1502.922.92
15UPNEDA—Uttar PradeshState Scheme2018-October5003.233.13
16SECI—Floating in Uttar PradeshState Scheme2018-November1503.293.29
17UPNEDA—Uttar PradeshState Scheme2018-December5503.083.02
Tariff discovered in the year 2019 under various schemes/projects
1GUVNL—Gujarat State Scheme2019-February5002.682.55
2MSEDCL—MaharashtraState Scheme2019-February10002.752.74
3GUVNL—Gujarat State Scheme2019-February7002.892.84
4SECI—Anywhere in IndiaISTS—III Bidding2019-February12002.612.55
5SECI—Rajasthan Non-Solar ParkState Scheme2019-March7502.492.48
6SECI—Dondaicha Solar Park MaharashtraState Scheme2019-May2502.912.87
7GUVNL—Gujarat—Raghanesda Solar ParkState Scheme2019-May5002.72.65
8GUVNL—Gujarat State Scheme GUVNL Ph V2019-May2502.752.75
9SECI—Anywhere in IndiaISTS-IV Bidding2019-June12002.552.54
10UPNEDA—Uttar PradeshState Scheme2019-June5003.053.02
11SECI—Rajasthan State Scheme Tranche II2019-June7502.52.5
12SECI—Anywhere in India ISTS-V Bidding2019-August12002.652.53
13HPPC—HaryanaState Scheme2019-August3002.992.82
14SECI—Anywhere in India ISTS-VI Bidding2019-October12002.722.71
15GUVNL—Gujarat State Scheme GUVNL Ph VI2019-October2002.652.65
16GUVNL—Gujarat State Scheme GUVNL Ph VII2019-October7502.752.75
17MSEDCL—MaharashtraState Scheme MSEDCL Ph IV2019-December5002.92.89
Tariff discovered in the year 2020 under various schemes/projects
1UPNEDA—Uttar PradeshState Scheme2020-Jan5003.183.17
2SECI—Anywhere in India ISTS-VIII Bidding2020-Feb12002.512.5
3GUVNL—Gujarat State Scheme GUVNL Ph VIII2020-Mar7502.642.61
4MSEDCL—MaharashtraState Scheme MSEDCL Ph V2020-Mar5002.92.9
5MSEDCL—MaharashtraState Scheme MSEDCL Saur Krishi Vahini2020-Mar13503.33.28
6NHPC—Anywhere in IndiaISTS Bidding2020-Apr20002.612.55
7SECI—Anywhere in India ISTS-IX Bidding2020-Jun20002.382.36
8GUVNL—Gujarat State Scheme GUVNL Ph IX2020-August7002.812.78
9GUVNL—Gujarat State Scheme GUVNL Ph X2020-October1002.732.73
10KSEB—KeralaState Scheme2020-Nov2002.972.97
11SECI—RajasthanState Scheme Tranche III2020-Nov10702.012
12ISTS—Hybrid Anywhere in IndiaISTS-Hybrid Bidding Tr III2020-December12002.422.41
13GUVNL—Gujarat State Scheme GUVNL Ph XI2020-December5001.991.99
Tariff discovered in the year 2021 under various schemes/projects
1GUVNL—Gujarat State Scheme GUVNL Ph XII2021-Mar5002.212.2
2NTPC—RajasthanNokh Solar Park2021-Mar1902.252.25
3UPNEDA—Uttar Pradesh Solar ParkState Scheme2021-Mar2002.692.68
4MSEDCL—MaharashtraState Scheme—Hybrid2021-Jul5002.622.62
5MSEDCL—MaharashtraState Scheme MSEDCL Ph V2021-Jul5002.432.43
6RUMSL—Madhya PradeshState Scheme2021-Jul5502.452.44
7RUMSL—Madhya PradeshState Scheme2021-Jul4502.332.35
8RUMSL—Madhya PradeshState Scheme2021-August5002.152.14
9BREDA—BiharState Scheme2021-August2503.123.11
10SECI—Rajasthan State Scheme Tranche IV202-December17852.182.17
Tariff discovered in the year 2022 under various schemes/projects
1UPNEDA—Uttar PradeshState Scheme2022-January2002.982.98
2MSEDCL—MaharashtraKusum Scheme2022-January4443.13.1
3MSEDCL—MaharashtraAgriculture feeder Scheme2022-January12503.13.05
4SECI—KarnatakaState Scheme Tranche X 2022-February2002.372.35
5SECI—Himachal PradeshState Scheme Floating solar2022-February153.263.26
6GUVNL—GujratState Scheme Tranche XIII2022-March5002.292.29
7MSEDCL—MaharashtraAgriculture Feeder Scheme2022-May8653.13.1
8SECI Pan India 2022-May12002.542.53
9MSEDCL—MaharashtraKusum Scheme2022-June4453.13.05
10GUVNL—GujratState Scheme Tranche XIV2022-July5002.312.3
11MSEDCL—MaharashtraKusum Scheme2022-August4313.12.3
12MSEDCL—MaharashtraState Scheme Tranche VII2022-September5002.912.9
13MSEDCL—Maharashtra 2022-September5002.832.82
14GUVNL—GujratState Scheme Tranche XVI2022-September7502.662.49
15RUMSL—Madhya PradeshState Scheme Floating Tranche II2022-October7503.043.03
16MSPGCL—MaharashtraState Scheme Floating 2022-November1053.933.93
17MSEDCL—MaharashtraState Scheme Tranche IX2022-December5002.972.9
18MSEDCL—Maharashtra 2022-December25099
Tariff discovered in the year 2023 under various schemes/projects
1GUVNL—Gujrat 2023-January5002.522.51
2RECDCL Pan India 2023-April2502.562.55
3RECDCL Pan India 2023-April5002.72.69
4SECI Pan India 2023-April12004.734.64
5MSEDCL—MaharashtraState Scheme Tranche X2023-April5002.882.87
6GUVNL—GujratState Scheme Tranche XIX2023-April5002.752.71
Table 6. List of the supporting arms of the MNRE.
Sr. No.OrganizationRole in the Growth of Renewable Energy
1MNRE Ministry of New and Renewable EnergyThe ministry’s overarching goal is to create and implement new, renewable energy sources to support the nation’s energy needs.
2NISENational institute of Solar EnergyNISE is an autonomous R&D Institute in the field of solar energy and undertakes activities related to research and development, testing, and certification of other associated technologies.
3 NIWE National Institute of Wind Energy The National Institute of Wind Energy is under the Ministry of New and Renewable Energy for the development of wind power in the country. It offers services in the wind energy sector in R&D, wind resource assessment (onshore and offshore), development of standards, testing, certification, and skill development.
4 IREDA Indian Renewable Energy Development Agency IREDA is a public limited government company established as a non-banking financial institution in 1987 to support the promotion, development, and extension of financial assistance for setting up projects relating to new and renewable sources of energy.
5 SECI Solar Energy Corporation of India Limited SECI is a not-for-profit company under the Ministry of New and Renewable Energy. It was established in 2011 to help the solar energy sector. It is the only central public sector undertaking dedicated to the solar energy sector. SECI is the premier trader of renewable energy in the country.
SECI Business area:
Implementation of govt. scheme/tenders;
Own projects;
Project management consultancy;
Power trading.
It is the power procurement intermediary for projects being set up through its tenders, procuring power from developers and selling to DISCOMs though long-term PPAs/PSAs
6SNAState Nodal AgencyThe State Nodal Agency for Energy Development (SNAED) is a body established by Indian state governments to encourage the growth of renewable energy sources and energy-saving technologies in each of its individual states. These organizations are in charge of putting into action various plans and programs for renewable energy sources such as solar, wind, biomass, and small hydropower. In order to hasten the adoption of renewable energy sources in their respective states, they also offer technical help, capacity building, and financial support to a variety of stakeholders, including project developers, customers, and government agencies. These organizations give approval for setting up the solar energy plants (tenders and commissioning of solar on ground, on rooftops, or floating. This agency varies by state; for example, Urja Vikas Nigam Limited, Bhopal (Madhya Pradesh),
Uttar Pradesh New and Renewable Energy Development Agency,
Haryana Renewable Energy Development Agency,
and Rajasthan Renewable Energy Corporation Ltd.
7 ISTN Inter-State Transmission Network This network is used to convey electricity via the main transmission line from the territory of one state to another state,
and the transmission of electricity within the territory of a state on a system that is built, owned, operated, maintained, or controlled by the CTU.
8 POSOCO Power System Operation Corporation Limited POSOCO is owned by the Government of India under the Ministry of Power.
It was previously a subsidiary of the Power Grid Corporation of India Limited.
It was formed in March 2009 to handle the power management functions of PGCIL.
It is responsible for ensuring the integrated operation of the grid.
It consists of five Regional Load Dispatch Centers and a National Load Dispatch Centre (NLDC)
9RLDCs Regional Load Dispatch Centers These are important links between generation and transmission that coordinate the power requirements of the consumers of electricity. There are five regional load dispatch centers across India:
North regional load dispatch center;
East regional load dispatch center;
Northeast regional load dispatch center;
West regional load dispatch center;
South regional load dispatch center.
10 CEA Central Electricity Authority The Central Electricity Authority, established under Section 3 of the Electricity (Supply) Act, 1948,
formulates plans for the development of electricity systems. It gives approvals as per CEA Regulation 2010.
Disclaimer/Publisher’s Note: The statements, opinions and data contained in all publications are solely those of the individual author(s) and contributor(s) and not of MDPI and/or the editor(s). MDPI and/or the editor(s) disclaim responsibility for any injury to people or property resulting from any ideas, methods, instructions or products referred to in the content.

