1. Introduction
Power light emitting diodes (LEDs) are commonly used in automotive and lighting techniques [
1,
2]. Usually, LEDs are supplied with a direct current [
3,
4,
5]. However, more and more often, special circuits for LED lamp supplies are used. These circuits produce the rectangular pulse trains of the current of the regulated duty cycle [
3,
4]. Such a way of supplying circuits makes it possible to increase the efficiency of the supply circuits and regulate the emitted luminous flux [
6,
7,
8].
Typically used power LEDs are phosphor-converted white light sources. The properties of phosphor used in such devices have been analyzed, e.g., in [
9,
10,
11].
Paper [
9] presents a modification of the phosphor used in laser semiconductor light sources, the modification of which allows an increase in the efficiency of the conversion of the supplied electric energy into the emitted light by as much as 11% compared with traditional semiconductor light sources. The described modification consists of using a sapphire substrate with a thickness of 80 µm. Laser light sources emitting white light achieve a luminous efficiency of 249.1 lm/W and an output power of 3.15 W.
Paper [
10] presents a modification of the phosphor layer converting the blue laser light to the white light by applying several layers of glass foil deposited on a sapphire substrate. Such a modification allows the increase in the efficiency of heat dissipation through the sapphire substrate to the bottom part of the case of the high-efficiency laser light source.
Paper [
11] presents a modified solder paste to which copper (Cu) nanoparticles were added, which have a high thermal conductivity. The influence of the soldering process temperature on the electrical and thermal parameters of the soldering paste used was analyzed. Based on the experimental studies, a low value of electrical resistivity of only 5.1 µΩ·cm and a high thermal conductivity of 142.37 W/(m·K) were obtained.
In paper [
12], the supplying system of the power LED using the pulse width modulation (PWM) signal is presented. This system controls the gate of the MOSFET connected in series with the considered power LED and regulates the mean value of its current. Such supply systems are commonly used to control the light emitted by power LEDs [
12,
13]. An advantage of such systems is the possibility of regulating the frequency of the control signal and the value of the duty cycle over a wide range of changes of the mentioned parameters of the supplying current [
7,
14].
In paper [
15], three cases of supplying power LEDs with the current in the form of a sequence of rectangular current pulses were discussed. The first of them concerns operating at a low frequency and allows obtaining light pulses. The second allows adjusting the brightness using the PWM modulation. The third case is for the DC power supply with a ripple. In each of these cases, an over-current may occur, resulting in a shortened lifetime of the LEDs under consideration. The cited paper indicates that the maximum switching frequency can reach even 100 MHz.
As it was shown, among others, in papers [
6,
7,
8], the value of the supplying current visibly influences the current-voltage characteristics as well as optical and thermal parameters of the considered class of semiconductor devices. However, in the literature there is no information about the influence of frequency, amplitude and the duty cycle of the current supplying the LED on its exploitation parameters.
In the literature [
5,
13,
16], many models of power LEDs of different accuracies are described. Nevertheless, in many papers devoted to modeling power LEDs, the influence of the electrical inertia of these devices and the properties of semiconductor light sources containing power LEDs is omitted.
Papers [
17,
18,
19,
20] describe techniques and systems using full-bridge power converters with soft switching techniques as control systems for single power LEDs or LED modules in order to improve the power quality characterized by the total harmonic distortion (THD) of the supply current. These systems are prepared to be supplied from the power grid or from photovoltaic systems with the use of the dedicated DC energy accumulators, for off-grid operation when supplying highways lighting lamps.
Papers [
21,
22] present the control systems for power LEDs supplied from the power grid. The PWM technique is used to control the lighting emitted by the LEDs. The used control systems allow for the simultaneous measurement of the individual harmonics of the current taken from the power grid and active control of the supplying current in order to improve the power factor.
Papers [
23,
24,
25,
26] present a review of the techniques of controlling power LEDs using the rectangular PWM signal controlling the gate of the power transistor, full-bridge and half-bridge systems. The operating characteristics of the current and voltage stabilizer systems with the use of a series resistor to limit the current flowing through the power LED and a classical voltage divider are also mentioned and shown.
Papers [
27,
28] present the systems for stabilizing the optical parameters such as luminous flux and the correlated color temperature (CCT) by adjusting the supply current of power LEDs in large-format display systems. Paper [
29] presents the results of experimental studies on the impact of the frequency value and the shape of the current taken from the power grid on the operating parameters of sodium lamps, still used in street lighting systems.
Despite the fact that LED producers provide a vast amount of information on their properties, this mainly refers to the operation of these diodes when supplied by the direct current. Yet, there is a lack of dependences describing an influence of frequency and the duty cycle on the electrical and optical parameters of the considered semiconductor devices.
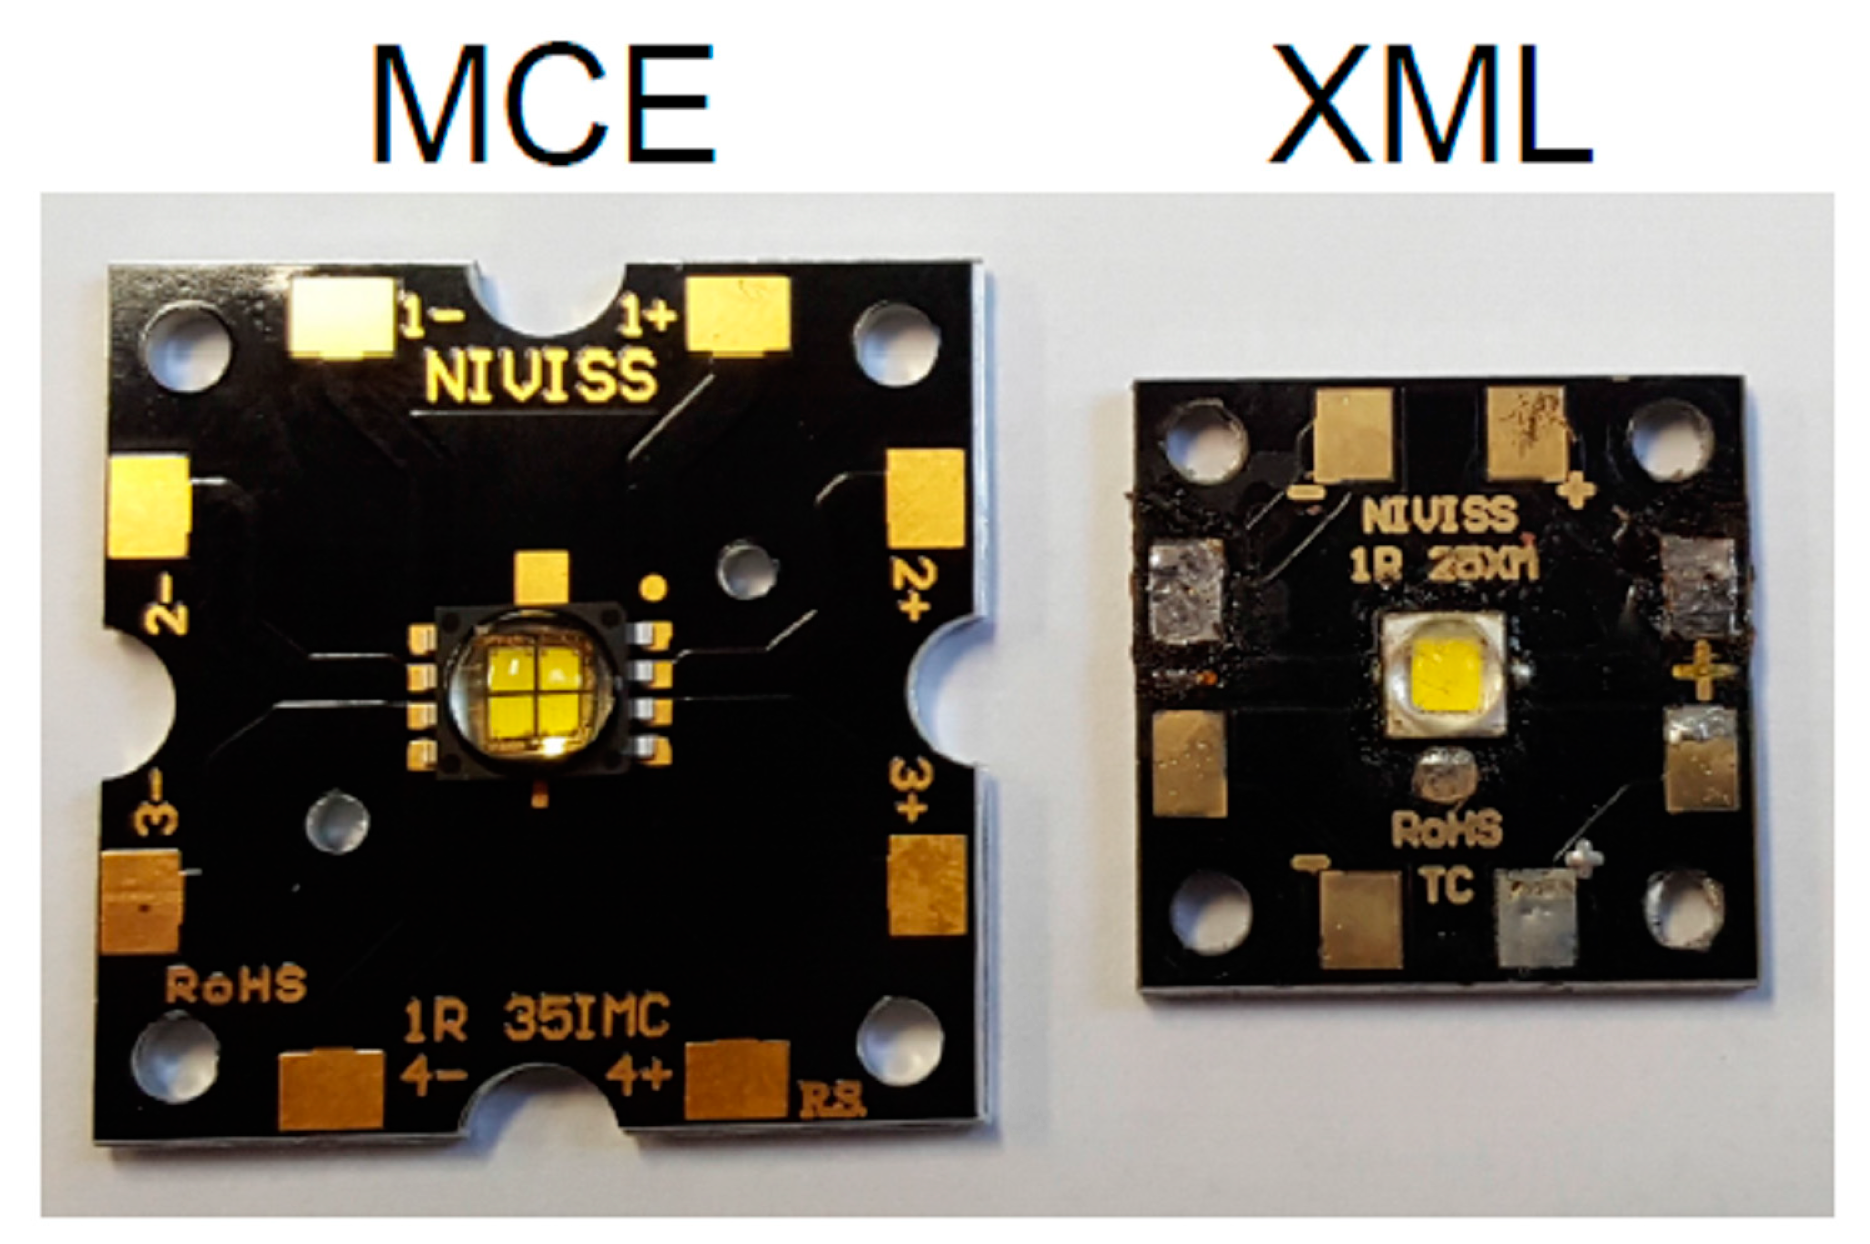
The aim of this paper is to examine the influence of the selected parameters of the waveforms of the supplying current on the properties of a selected power LED. Electrical, optical and thermal quantities of the considered LEDs are measured at selected values of frequency, amplitude and the duty cycle of the waveform of the supplying voltage in the network, containing also the tested device and the resistor connected in a series. On the basis of the obtained results of the measurements, the influence of the considered parameters of the supplying voltage and the average (AVG) value of the supplying current on the properties of solid state light sources is discussed. The investigations were performed for two types of power LEDs emitting white light. It was shown that internal capacitance of the tested devices causes visible changes in the waveforms of the supply current at changes in frequency values. The influence of frequency on the junction temperature, illuminance, irradiance of the emitted light and optical efficiency was also analyzed.
In
Section 2, the basic information about the examined power LED is given. In
Section 3, the measuring set-up used to make it possible to supply the investigated power LED with the current of the shape of the rectangular pulse train of the regulated value of frequency and the duty cycle is presented. In turn, in
Section 4 the results of the measurements illustrating electrical, optical and thermal properties of the investigated diode are shown.
4. Results and Discussion
During the measurements carried out with the use of the set-up described in
Section 3, the values of electrical, thermal and optical parameters of the tested power LEDs were recorded. The results of these measurements are shown in the further part of this section.
Figure 3 shows the measured current-voltage characteristics of the tested power LEDs mounted on a heat sink and those diodes operating without a heat sink and supplied with a direct current.
As can be seen, the cooling conditions of the tested LEDs significantly affect the course of their i–v characteristics. In particular, it can be seen that as a result of self-heating for the LEDs operating without a heat sink, much lower (even by 0.2 V) forward voltage values are obtained at the fixed current value. Such an influence of self-heating phenomena on the considered i–v characteristics proves that the series resistance of the tested diode has a low value and the voltage drop corresponding to this resistance is much smaller than a voltage drop on the p–n junction. For the XML diode, it can be seen that as a result of self-heating, the maximum value of the forward current of this LED operating without a heat sink is limited, because the junction temperature of this device is approaching the maximum allowable value. For the diode MCE, such a phenomenon is not observed. For this diode operating at both the types of the considered cooling conditions, the maximum allowable value of the forward current is not achieved due to a much lower value of thermal resistance.
In the investigations, the results of which are shown in a further part of this section, the value of frequency and the duty cycle correspond to the signal controlling the gate of the transistor switch. The amplitude of the supply current is regulated in order to obtain the constant average value of this current IAVG. This value is obtained using the measurements performed by the oscilloscope. Of course, the supply current is not the ideal rectangular pulse train, especially at the highest value of the considered frequency, due to parasitic capacitances of the tested devices and the components of the measurement set-up.
In
Figure 4 the dependence of the rms value of the supply current on the average value of this current for the tested diodes is shown. The presented results were obtained at selected values of frequency and the constant value of the current maximum value equal to I
zasMCE = 1.7 A for the diode MCE and I
zasXML = 3.08 A for the XML diode. Each point on the considered characteristics corresponds to a different value of the duty cycle d.
As is visible, for both the diodes and each considered value of frequency, the dependence IRMS(IAVG) is a monotonically increasing function. These dependences are non-linear due to the fact that the waveform of the supply current is different to the rectangular pulse train. This non-linearity is more visible at higher values of frequency. It is worth noting that the rms value of the supply current at the fixed value of IAVG decreases with an increase in frequency.
Figure 5 illustrates the effect of the frequency of the supply current on the dependence of illuminance E, measured along the axis of the tested diodes on the average value of the current supplying these LEDs. The tests were carried out with a DC power supply and a sequence of rectangular pulses controlling the gate of the transistor with a frequency of 100 Hz and 200 kHz and a duty cycle d = 0.5. For the diode MCE, the average value of the forward current exceeds the maximum allowable value given by the manufacturer, but for this device, the maximum allowable value of the junction temperature is not exceeded.
It can be seen that the highest illuminance value was obtained when the LEDs were powered with the direct current. All the presented E(I
AVG) dependences are monotonically increasing functions. An increase in the frequency causes a decrease in the value of E. This phenomenon is associated with the phenomenon of self-heating and a decrease in the illuminance value with an increase in the junction temperature of the LED [
19]. For the MCE series LED, at f = 200 kHz and I
AVG = 0.7 A, the illuminance has 5% lower values compared with the values measured with the DC power supply. In the case of the XML series LED, the increase in the E value is 10% for the same parameters of the power supply. The observed influence of the frequency on the values of illuminance is connected with a delay between the electrical and optical processes in the tested LEDs.
It is worth emphasizing that the presented results corresponding to different values of frequency are obtained for the same values of the average values of the supply current. Therefore, the average value of illuminance does not change when the frequency is changed. The dependence of the irradiance Φ
E on current I
AVG was also measured and the shape similar to that shown in
Figure 5, for the dependence E(I
AVG) was obtained.
Figure 6 illustrates the effect of the control signal of the duty cycle d on the value of irradiance at the selected frequency values. The measurements were performed at a fixed average value of the supply current denoted as I
zasMCE and I
zasXML for the considered devices.
It can be seen that with an increase in the value of the duty cycle of the control signal, the value of irradiance Φ
E increases for all the tested power LEDs. As the frequency increases, the value of Φ
E decreases. For the XML diode, the maximum value of Φ
E decreased by 10.6%, and for the MCE diode by 5.3%, at the maximum value d and a frequency change from 100 Hz to 200 kHz. The dependence of illuminance E on the duty cycle d was also measured, and a shape similar as shown in
Figure 6 for the dependence Φ
E(d) was obtained.
Figure 7a presents the results of
TSP solder point temperature measurements of the tested power LEDs as a function of the duty cycle d. These measurements were made at the ambient temperature T
a = 20 °C. The obtained characteristics show that in all the cases a higher temperature was obtained for frequency f = 100 Hz. The highest temperature was recorded for the XML diode and it was
TSP = 71.4 °C. This result was obtained with the effective value of I
RMS current = 2.94 A. For the second of the tested LEDs, the maximum temperature of the soldering point was about
TSP = 65 °C. For the XML diode, a much higher increase in temperature
TSP with increasing d can be observed than for the MCE diode.
Figure 7b shows the dependence of the junction temperature of the tested diode
Tj on the duty cycle d. Temperature
Tj is calculated from the following formula:
where
TSP is the temperature of the soldering point of the tested diode,
Pe is the power taken from the power source, and
Rthj-s is the thermal resistance junction—a soldering point of this diode given by the manufacturer.
In general, in Equation (1) the transient thermal impedance should be used to calculate the value of the device junction temperature. However, the considered dependences of temperatures
TSP and
Tj on the supply current correspond to the mean values of these temperatures at the steady state. As was proved in [
32], in such a case the mean value of such a temperature can be calculated using Equation (1) without a visible loss in the calculation accuracy.
As can be seen in
Figure 7b, for each value of frequency, temperatures
TSP and
Tj are increasing functions of the coefficient d. The highest junction temperature is obtained for the XML diode, which reaches as much as 154.7 °C at f = 100 Hz and d = 95%. In the case of this diode, the maximum allowable junction temperature of 150 °C was exceeded, but this did not damage the tested semiconductor device.
Comparing the calculation results presented in
Figure 7b with the characteristics presented in
Figure 7a, it can be seen that for the MCE diode, at the comparable solder point, temperature
TSP = 65 °C, different values of temperature
Tj of the tested diodes are obtained. They are equal to 80 °C for the MCE diode and 150 °C for the XML diode, respectively. The big differences in the value of this temperature are a result of big (over triple) differences in thermal resistance
Rthj-s.
Figure 8 shows the calculated dependences of the luminous efficiency η
L on the duty cycle d. The value η
L is determined by the definition as the quotient of the luminous flux by the power taken from the power source.
As can be seen, the considered dependences have a maximum. For the relationship ηL(d), it occurs for d equal to about 30% at frequency f = 100 Hz and for d in the range from 5% to 15% at f = 200 kHz. It can be seen that an increase in frequency and the duty cycle causes a decrease in the considered parameter by up to 40%. It can also be observed that for the diode XML, the maximum obtained value of ηL is much higher than for the diode MCE. This proves that the conversion of electric energy into light is more efficient in the XML diode.
Figure 9 shows the dependence of the average value of voltage V
AVG on the tested diodes (
Figure 9a) and the average value of their forward current I
AVG (
Figure 9b) on the average value P
AVG of the power taken by them from the power source.
As can be seen, the average value IAVG of the current at the fixed value PAVG of the power practically does not change as a function of frequency. The influence of the frequency on the average value of voltage is much stronger, and VAVG changes with the frequency reaching 0.2 V.
Figure 10 illustrates the influence of the average value of the supply power (
Figure 10a), the duty cycle d (
Figure 10b) and frequency (
Figure 10c) on the illuminance coming from the tested diodes.
As can be seen in
Figure 10a, for the same average value of the power taken from the supply voltage source, a significant effect of the frequency on illuminance E is obtained. The value of E is the highest when supplying from the DC power supply, whereas a change of frequency from 100 Hz to 200 kHz causes a small change in the value of E not exceeding 10%. In turn,
Figure 10b illustrates the effect of the duty factor d on the illuminance value at selected frequency values. As expected, an increase in d causes an increase in the illuminance. As the frequency of f increases, a decrease in the value of E is observed at the fixed value of d, but this decrease is much more pronounced for the XML diode. The E(f) relationships presented in
Figure 10c show that an increase in frequency causes a decrease in the value of E. This decrease is particularly noticeable at a low value of d = 15% and frequency of f > 10 kHz. For the XML diode, it even reaches 50%. This relationship results from the internal capacitances of the tested power LEDs, which caused a decrease in the average value of the supply current at an increase in frequency. The presented dependences E(f) prove that it is not justifiable to operate power LEDs at a frequency of a supply current higher than 10 kHz.
The other measurements performed by the authors show that the influence of the average value of the power, the duty factor and frequency on irradiance is the same as on illuminance.
As can be seen, the influence of the average value of the power, the duty factor and frequency on the optical power is the same as on illuminance.
Figure 12 illustrates the effect of the average value of the power (
Figure 12a), the duty factor (
Figure 12b) and frequency (
Figure 12c) on optical efficiency. The value η
opt is calculated as the quotient of the optical power of the emitted light to the electric power supplying the LEDs.
As can be seen, the optical efficiency is a decreasing function of the average value of the power and the duty cycle. In turn, an increase in frequency causes an increase in the optical efficiency. It is also worth noting that the optical efficiency values obtained for the XML diode are even twice as high as for the MCE diode. For the relationship ηopt(d), a maximum occurs for d in a range from 15% to 30% at a frequency f = 100 Hz and for d in a range from 5% to 15% at f = 200 kHz. The XML LED typically has a higher luminous efficiency and optical efficiency. Their maximum values for this diode are even 40% higher than for the MCE diode. The dependence ηopt(f) has higher (even twice) values at lower values of the duty cycle. This means that a high value of optical efficiency and a high value of the power of emitted light cannot be obtained simultaneously.
Figure 13 illustrates the effect of frequency on the junction temperature of the tested diodes.
Due to the higher value of the thermal resistance of the XML diode, the junction temperature of this diode is even 80 °C higher than for the MCE diode. The dependence Tj(f) shows the maximum at f = 10 kHz for the XML diode, while for the MCE diode it is a monotonically decreasing dependence. In the considered frequency range, changes in temperature Tj exceed even 25 °C. In the range of high frequency values, an increase in frequency of the supply voltage causes a decrease in the junction temperature. Of course, at a higher value of the duty cycle, the value of the junction temperature is higher due to the higher average value of the dissipated power.
Figure 14 illustrates the effect of frequency on the solder point temperature
TSP of the tested diodes.
As can be seen, the shape of the dependences
TSP(f) is identical to the shape of the dependences
Tj(f) shown in
Figure 13. The value of the junction temperature of the XML diode is even 70 °C higher than
TSP temperature. For the MCE diode, this difference only reaches 10 °C. The given differences result from the difference in the thermal resistance values between the junction and the soldering point of the considered diodes.
Figure 15 presents the measured waveforms of the current of the tested diodes measured at d = 75% and selected frequency values. In this figure, the waveform of the control voltage V
GS of the transistor switching the current supplying the tested diodes is marked in green.
It can be seen that due to the electrical inertia of the tested diodes (junction capacitance and diffusion capacitance), the current ID is delayed in relation to the control voltage VGS. This delay is more pronounced when the frequency is higher. At f = 100 Hz, this delay is practically invisible, and at f = 200 kHz it even reaches 4 μs. Thus, at a high frequency, the power supply current waveforms cannot be considered as rectangular pulse trains. As a result, the average value of the current is not equal to the product of its maximum value and the duty cycle, but is lower than them. As a result, when changing the frequency value, both the values of the optical parameters and the average value of the power change, followed by a change in the temperature values of the soldering point and the junction temperature of the diodes under consideration.
The presented waveforms illustrate that power LEDs do not belong to the fast switching devices and they should not operate at high values of frequency of the supply current. For both the tested power LEDs the junction capacitance was measured. At a voltage equal to 0 V, this capacitance is equal to 2.1 nF for the MCE diode and 3.42 pF for the XML diode. Such values of this capacitance justify the long switching-on time of the tested devices, observed in
Figure 15.
The instruments used in our investigations do not make it possible to measure flicker. Typically, at a frequency f > 100 Hz, such flickers are not observed by people, but it could be interesting to observe a delay of the emitted light in comparison with a step of the supply current. Such investigations will be performed by the authors in the future.


