1. Introduction
Today’s society and environment are bound together in a very close-knit and complex relationship. Basically, the health and wellbeing of a society depend on natural resources, and the quality of the environment is dependent on human actions. More specifically, this relationship involves two essential aspects: physical exploitation and ethical attitude [
1]. Physical exploitation refers to the development of efficient technologies that sustain human needs as well as the understanding of the environment and the manner in which its exploitation affects ecosystems and human beings. In terms of ethical attitude, a proper understanding of such various normative concepts as “human needs” and “ecosystem health” is important in achieving sustainability in society’s relationship with the environment. When discussing these concepts, Vucetich and Nelson [
1] make a clear distinction between two types of sustainability: vulgar sustainability, which refers to the idea of “exploiting as much as desired without infringing on future ability to exploit as much as desired”, and virtuous sustainability, with a focus on “exploiting as little as necessary to maintain a meaningful life”.
Since the early 1970s, the environment and its quality have become highly important in the context of societal developments as the
Limits to Growth report stressed the results of a computer simulation on the consequences of exploiting natural resources in the process of attaining high levels of economic growth. It was observed that excessive use of resources could generate exponential levels of pollution in the future [
2]. Over time, various international conferences have been including the issue of environmental degradation into the global agenda of organizations (e.g., governments, NGOs, companies), aiming to raise awareness of its seriousness and to identify potential solutions. Thus, a series of key guidelines regarding air emissions were adopted at different international conferences. In this sense, special attention should be drawn to the Kyoto Protocol (KP) that comprises two commitment periods: 2008–2012 (adopted in Kyoto, Japan, in 1997; abbreviated KP1) and 2013–2020 (adopted in Doha, Qatar, in 2012; abbreviated KP2). For both periods, the signing parties committed to cutting air emissions by 8% and 20%, respectively, compared with the level in 1990.
Environmental degradation refers to the deterioration of the quality of the environment and the pollution of ecosystems. Although the industrial revolution brought many advantages to socio-economic development (e.g., more advanced technology, higher living standards, improved health services), it also generated huge amounts of air pollutant emissions, mainly due to unsustainable economic activities. According to the European Environmental Agency [
3], air pollution is a major cause of premature mortality and diseases, bringing high risks to the environmental health of Europe. Moreover, air pollution through greenhouse gases and other pollutants is generally acknowledged as the main factor determining global warming, which is a serious environmental challenge [
4], damaging significantly natural ecosystems [
5,
6], and being detrimental to public health and wellbeing [
7] and to socio-economic development [
6].
Due to the further recent worsening in the quality of the environment, there has been global common interest in designing studies to analyse the determinants of this deterioration. Most scholars agree that economic growth is the main factor affecting air pollution through GHG emissions [
4,
8,
9,
10,
11,
12,
13].
Taking into consideration the negative effects of economic growth on environmental degradation, researchers and activists have been advocating for the need to separate the two variables through decoupling (or eco-economic decoupling). In economics and environmentalism, decoupling happens when an economy is able to grow without causing more environmental pressure or damage. The idea of decoupling comes in the broader context of delinking economic growth from increasing environmental problems as presented in the Environmental Kuznets Curve (EKC) framework [
14]. According to this framework, economic growth in the first stages of economic development is achieved on the basis of high levels of environmental degradation, but as development continues due to investments in technology development and economic efficiency, the pressure on the environment decreases. Moreover, the decoupling process is highly important in the context of sustainable development because, in the absence of it, the continuous increase in economic growth will determine the increase in the pressures on the environment, unavoidably affecting ecosystems and societies around the world [
15].
This study aims to analyse the degree of decoupling of economic growth from environmental degradation, represented by greenhouse gas (GHG) emissions, in each of the EU27 countries between 2008 and 2020. The analysis will be conducted at the national level and according to economic activities. The results obtained at the national level will provide a general picture regarding the levels of GHG emissions in each EU27 country. However, in order to identify the sources generating the GHG emissions and, in this way, to be able to draw some policy recommendations for the stakeholders, a detailed analysis focusing on the economic activities is needed. To provide a complete and detailed picture of air pollutant emissions in an economy, the European Parliament created a statistical information system called “Air Emissions Accounts” for the European Union (EU). It aims to record data on greenhouse gas emissions and on classical pollutants, presenting them separately for each emitting economic activity included in the NACE Rev. 2 classification [
16,
17].
To achieve the aim of the study, the following objectives were established: (1) to identify GHGs with the largest amounts of emissions resulting from economic activities in the EU27 countries; (2) for the identified GHGs, to highlight the economic activities generating the largest amounts of emissions in the EU27 countries; (3) to analyse the degree of decoupling at the national level of the EU countries; (4) to analyse the degree of decoupling with regard to the economic activities in the EU27 countries; and (5) to identify patterns in the evolution of decoupling in the EU27 countries.
Most earlier studies analysing the decoupling of economic growth from environmental degradation may be classified into three categories: (1) studies conducted only at a national level comprising a large number of countries (e.g., [
7,
18,
19]); (2) studies carried out only by country or by economic activity (e.g., [
20,
21]); (3) studies concentrated on specific air pollutants (mainly GHG emissions such as carbon dioxide (CO
2) and nitrous oxide (N
2O)). To the authors’ knowledge, only a few studies comprised several countries, but none included all of the EU countries, and none focused on the stage of decoupling in different sectors of activity in the EU countries. Giving that in the EU area, a series of policies were implemented that were meant to limit GHG emissions, the authors consider it relevant to analyse in what state the EU27 countries are in terms of decoupling economic growth from these emissions while highlighting, at the same time, the effects of their respective policies.
On the one hand, the present study contributes to knowledge by looking into the decoupling of economic growth from GHG emissions in several representative economic sectors with the highest air emissions in the EU27 countries. On the other hand, the analysed period comprises the time intervals when KP1 and KP2 commitments were implemented. This way, it may be possible to discover whether the effects of the targets imposed in each KP were reflected in the evolution of decoupling both at the national level and by economic activity. Finally, another contribution lies in the fact that among the analysed GHG emissions, hydrofluorocarbons (HFCs) have also been included. HFCs are the second most dangerous GHG after CO
2 in terms of their potential impact on global warming [
22]. HFCs have recently become dominant in economic activities due to the growing use of industrial air conditioning and refrigeration, mobile air conditioning, and foam agents [
23].
The findings of the present study could be useful to policy makers in order to implement strong environmental policies and to producers who could use environment-friendly technologies, both of which are stakeholders who are able to significantly reduce air emissions and encourage the decoupling process.
The article is divided into six sections. After the introductory section, section two contains the main lines of research found in the literature on the debates around the relationship between economic growth and environmental degradation and also on the issue of decoupling of these two variables. The data and methodology used are described in the third section, while the most important findings are presented and discussed in sections four and five. The final section presents the conclusions and discusses policy implications.
2. Literature Review
In light of the current environmental threats on society (e.g., global warming caused by high GHG emissions, air pollution affecting human health, extreme weather conditions), the relationship between economic growth and environmental degradation has become an essential issue debated both in academia as well as in world politics. Different academic studies (e.g., [
24,
25,
26,
27,
28,
29,
30]) often use the Environmental Kuznets Curve (EKC) to describe this relationship. The EKC framework reflects the evolution of environmental degradation in the context of continuous and increasing economic growth and describes this as a U-inverted shape. It states that both variables increase due to the necessity of meeting the basic consumption needs of the society in the early stages of development. When a certain level of development is achieved, society begins to consider the need for an equilibrium between consumption and environmental quality, and the environmental degradation begins to grow at a lower rate until reaching a certain point (usually called turning point) when it starts to decrease. The trend of decreasing environmental damage appears when a society prefers improvements in environmental quality over further consumption. Apart from the behavioural changes in society, the U-inverted shape of the EKC can be explained by technological progress: in the beginning, companies seek to expand their production as fast as possible and ignore the manner in which this affects the environment. However, as technology develops, production processes become cleaner and more efficient, diminishing the pressure exerted on the environment.
It is essential to recognise that an economy characterised by low levels of air emissions may appear only upon the premise of a stable economic growth [
9,
31]. In other words, if the reduction of GHG emissions involves hindering economic growth, then the costs in the society may increase due to economic stagnation, and it would make it difficult to maintain the low levels of such costs. In fact, the traditional growth model implies that economic growth inevitably entails GHG emissions [
32,
33]. Thus, a reshaping of the economic and social system from the bottom up [
31,
34] is needed, together with significant changes in energy and industry, in order to consistently and efficiently reduce the level of GHG emissions.
However, some studies proved that the relationship between economic growth and environmental degradation, measured by the quantity of GHG emissions, has declined, mainly in the developed countries (e.g., [
35,
36,
37]). Also, the International Energy Agency emphasises that since 2010, while GDP has been increasing, the general trend of GHG emissions has been stagnating or decreasing [
38]. All these results conclude that the two variables are compatible, and there is wide interest for sustaining economic growth as well as for its decoupling from GHG emissions.
The concept of decoupling was suggested by the Organization for Economic Co-operation and Development (OECD) in the report entitled
Indicators to measure decoupling of environmental pressure from economic growth published in 2002. Since then, it has been used in several studies that underline the degree to which economies have succeeded in breaking the link between environmental pressure, mainly expressed in terms of GHG emissions, and the driving force, mainly expressed in terms of economic growth. Decoupling occurs when the growth rate of the latter exceeds the growth rate of the former over a given period. The decoupling can be either absolute, characterizing the case in which the variable measuring the environmental degradation is stable or decreasing while the economic variable is increasing, or relative, when both variables are increasing but the environmental one has a lower rate of increase than the economic one [
39]. Decoupling plays a significant role in the path of each economy towards sustainable development goals. Therefore, decoupling is also used as a way of monitoring the evolution of EU economies in achieving sustainable development [
40].
Based on the methodology proposed by the OECD [
39], follow-up studies mainly focus on two categories. One group of studies is analysing the decoupling trends of large groups of countries only at the national level and researching at the global scale a limited number of pollutants [
7,
41] or concentrating on developed countries [
19,
42]; another group of studies is making comparative analyses between developed and developing countries [
18,
43]. At a global level, Shuai et al. [
7], for instance, investigated the decoupling link between economic growth and total carbon emissions, carbon emissions per capita, and carbon intensity of more than 100 countries during 2000–2014; they found that the higher income-level group included a larger proportion of countries having reached a decoupling status. Along the same lines, Brinkely’s [
41] analysis of CO
2 emissions in relation to GDP per capita in 242 countries during 1970–2008 proposed that some of the European countries (e.g., Denmark, the Netherlands, and Belgium) had undergone a “steady, consecutive downward trend” in decoupling due to some important changes in their economic activities (e.g., substitution of coal and oil with natural gas in Denmark and the Netherlands, higher energy imports in Belgium). From a deep analysis of the decoupling trend in developed countries, Wang et al. [
42] and Knight and Schor [
19] emphasised that some of these countries achieved more stable decoupling levels and that the countries with consumption-based emissions showed less evidence of decoupling than those having production-based emissions. Finally, the comparative studies of developed and developing countries conducted by Wu et al. [
18] and Raupach et al. [
43] reported that decoupling was better in developed than in developing countries.
Therea are also studies that concentrated on decoupling by country or by the type of economic activity. Such studies mainly looked into such activities as energy [
4,
44,
45,
46], transportation [
14,
47,
48], industry [
49], and agriculture [
21].
Chovancová and Tej [
44] concluded that among the V4 countries (i.e., Czech Republic, Hungary, Poland, and Slovakia) during 1995–2016, there prevails a strong decoupling of economic growth from GHG emissions in the energy sector, mainly due to the high number of reforms implemented in the energy sectors of these countries. Also, Chen et al. [
4] observed that in the OECD countries between 2001 and 2015, energy intensity and GDP per capita were among the determinants that affected the CO
2 emission, with the former being the main cause for a decrease in emissions, while the latter generated more emissions. As for the results of decoupling, the authors indicated a weak negative decoupling in the case of energy intensity and a strong decoupling for GDP per capita. In the case of Thailand’s thermal power sector, Muangthai et al. [
45] analysed the degree of decoupling between energy consumption and CO
2 emissions and observed that the variables were coupled during 2000–2005 but not coupled between 2006 and 2011, which means that energy consumption began to be more efficient at generating lower levels of CO
2 emissions. Similarly, Wang et al. [
46] found that energy-related CO
2 emissions were significantly decoupled during 1996–2004 in the Guangdong province of China, although no comparable trends were found for the period between 2005 and 2011. For the transportation sector, Tapio [
14] brought evidence of relative decoupling in the relationship between GDP growth and traffic CO
2 emissions during 1970–2001. Also, for the same relationship, the author compared the EU15 countries and found highly mixed decoupling trends across these countries. In a follow-up study, Finel and Tapio [
48] extended the analysis to 137 countries and found similarly mixed degrees of decoupling for transport-related CO
2 emissions. The results of Sorrell et al. [
47] emphasised that the UK during 1989–2004 had a more successful path towards decoupling the road freight transportation from GDP than most of the EU countries due to the contribution of the reductions in the average payload weight and fuel use per vehicle kilometre. Focusing on the relationship between Taiwan’s industrial growth and CO
2 emissions, Wang et al. [
49] identified negative decoupling for the period between 2007 and 2009 but a positive decoupling for 2009–2013. For the agricultural sector, Han et al. [
21] reported that there were significant differences in the degree of decoupling among Chinese provinces between 1997 and 2015, i.e., the central region provinces (e.g., Beijing, Zhejiang, Fujian, and Guangdong) had high levels of decoupling, while low levels were found in the western region provinces (e.g., Qinghai, Gansu, and Xinjian).
As mentioned earlier, most current studies on decoupling economic growth from GHG emissions comprise a large number of countries. These refer mainly to the national level and include a limited number of pollution variables (mainly GHG emissions such as CO
2 emissions), or just a specific country or economic activity. Thus, only a few studies analyse the state of decoupling for a number of countries both at the national and sectorial level and take into consideration more than one variable measuring air pollution. For instance, using a complex database containing eighteen of the EU countries, six economic sectors (electricity, manufacturing, agriculture, transport, services, and others), and six pollution indicators (energy, CO
2, SOX, NOX, NH3, and PM10), Naqvi and Zwicki [
11] reported several results on the decoupling of production-based emissions from GDP growth for the periods between 1995–2001 and 2001–2008. The authors identified highly divergent results regarding the patterns of the evolution of the considered sectors for the pollution indicators considered. The results referring to the electricity sector showed Sweden as having an absolute decoupling in energy use for both periods, while Poland switched from absolute to relative decoupling and the UK from relative to absolute decoupling. In the case of the manufacturing sector, Italy switched from relative to negative decoupling in terms of CO
2 emissions, while Germany improved from negative coupling to absolute decoupling with respect to CO
2 emissions. However, over the entire period (i.e., 1995–2008), in the agricultural sector, absolute decoupling is strongly linked to specific countries and across all pollutants.
Along the same lines as Naqvi and Zwicki [
11], Wang et al. [
20] conducted a comparative study of the provinces of Beijing and Shanghai in China in terms of the decoupling of sectoral (agriculture, industry, construction, transport, trade and others) economic output from CO
2 emissions during 2000–2015. Beijing changed from an expansive negative decoupling to a strong decoupling in agricultural activities due to a reduction in energy intensity and optimization of the energy structure, while Shanghai went from strong decoupling to strong negative decoupling due to an increase in energy intensity. Another significant difference was observed for the industry sector, where Beijing showed strong decoupling, while Shanghai registered weak decoupling during most of the period analysed. Contrary to industry, in the case of transport, Beijing showed weak and Shanghai strong decoupling. As for trade, both provinces behaved similarly, switching from expansive negative decoupling to weak or even strong decoupling.
Summing up the findings identified in the literature, it can be concluded that the decoupling analyses in the case of one variable may cause misrepresentation of the general environmental performance of a country. This study intends to close this gap by conducting an analysis of decoupling that comprises multiple countries, economic activities, and air emissions.
Taking into consideration the ideas presented above and available in the academic literature, in this paper, the following research hypotheses will be verified:
H1: The amount of CO2 emissions at the national level in the EU27 countries differs significantly in the 2013–2020 period compared with the 2008–2012 period.
H2: The amount of HFCs emissions at the national level in the EU27 countries differs significantly in the 2013–2020 period compared with the 2008–2012 period.
H3: Among the economic activities considered in the EU27 countries, electricity, gas, steam, and air conditioning supply activities register the most significant improvements regarding the decoupling from CO2 emissions in the 2013–2020 period compared with the 2008–2012 period.
H4: Among the economic activities considered in the EU27 countries, wholesale and retail trade activities register the most significant improvements regarding the decoupling from HFCs emissions in the 2013–2020 period compared with the 2008–2012 period.
3. Data and Methods
The aim of this study is to analyse the decoupling of economic growth based on environmental degradation (measured through specific air emissions per capita) in the EU27 countries between 2008 and 2020 at the national level and by economic activities.
To quantify the amounts of air emissions at the EU level, the European Parliament developed a statistical information system named “Air Emissions Accounts”. This system collects extensive data regarding all air emissions available at the national level of each EU country, as well as data on each economic activity generating the emissions. The economic activities are structured according to the NACE Rev. 2 classification as follows [
17]: agriculture, forestry, and fishing (A); mining and quarrying (B); manufacturing (C); electricity, gas, steam, and air conditioning supply (D); water supply, sewerage, and waste management and remediation activities (E); construction (F); wholesale and retail trade and repair of motor vehicles and motorcycles (G); transportation and storage (H); accommodation and food service activities (I); information and communication (J); financial and insurance activities (K); real-estate activities (L); professional, scientific, and technical activities (M); administrative and support service activities (N); public administration and defense and compulsory social security (O); education (P); human health and social work activities (Q); arts, entertainment, and recreation (R); other service activities (S); activities of households as employers and undifferentiated goods- and service-producing activities of households for their own use (T); and activities of extraterritorial organisations and bodies (U).
In “Air Emissions Accounts”, the air emissions are grouped into three categories [
17]: greenhouse gas emissions, air pollutants, and particulate matters. In the category of greenhouse gases are included 3 non-fluorinated gases—carbon dioxide (CO
2), methane (CH4) and nitrous oxide (N
2O)—and 4 fluorinated gases—hydrofluorocarbons (HFCs), perfluorocarbons (PFCs), sulphur hexafluoride (SF6), and nitrogen trifluoride (NF3). The category of air pollutants comprises nitrogen oxides (NOx), carbon monoxide (CO), non-methane volatile organic compounds (NMVOC), sulphur oxides (SOx), and ammonia (NH3). Lastly, particulate matters refer to particulate matter < 10 μm (PM10) and particulate matter < 2.5 μm (PM 2.5).
Using the classification of air emissions and considering all NACE Rev. 2 activities, the percentages for the quantities of air emissions generated in the EU27 were determined in the analysed period.
It was noted that CO
2 emissions accounted for the highest value of 95.37%. This was followed by 2.58% for HFCs emissions, while other air emissions showed lower levels (below 0.5%). However, only the first two air emissions will be considered. Both CO
2 and HFCs are dangerous for human health and the ecosystem wellbeing due to their effects on global warming. CO
2 represents the Earth’s most important greenhouse gas because it has the role of absorbing and radiating the heat from the sun. Without CO
2, Earth’s natural greenhouse effect would be too weak to maintain the average global surface temperature above freezing. However, the natural greenhouse effect supercharges and determines the global temperature increase when more CO
2 is released into the atmosphere. HFCs are also called “super greenhouse gases” due to their high potential for global warming, and it has been estimated that they are hundreds to thousands of times more dangerous than CO
2 [
23,
24,
50]. Thus, if left unchecked, the emissions of CO
2 and HFCs would account for significant damage to the global temperature. To avoid potential negative effects in this context, several targets were imposed on the level of greenhouse gases during the two commitments periods of Kyoto Protocol (i.e., 2008–2012 and 2013–2020). Also, considering that economic growth had been viewed as the main factor affecting air emissions, each country had to manage the challenge of performing economic activities that less affected the economic growth in order to reduce the pressure on the environment.
Taking into account that the regulations imposed by the Kyoto Protocol focus only on the reduction of greenhouse gas emissions, this has been an additional reason for selecting the above-mentioned air emissions. This way, it will be possible to observe whether the targets established in this protocol for the periods 2008–2012 and 2013–2020, respectively, had an effect in lowering the pressure regarding the quality of the environment, and therefore on the decoupling process.
To conduct this study, it was also important to identify the main economic activities that generated CO2 and HFCs emissions in the EU27 countries during the period of this study.
Figure 1 shows the top 5 economic activities with the highest values (the percentage out of total emissions) for each of the two GHG emissions, with other economic activities with very low percentages being included under the category “Others”.
As it can be noted, electricity, gas, steam and air conditioning supply are the primary sources of CO2 emissions, and wholesale and retail trade are the primary sources of HFCs emissions, accounting for 37.10% and 36.32% of emissions, respectively. Second and third places are identical for both GHG emissions: manufacturing (30.64% for CO2 and 33.67% for HFCs) and transport and storage (15.53% for CO2 and 7.09% for HFCs). Moving on to the fourth position, agriculture, forestry, and fishing account for 3.74% of the CO2 emissions; while water supply, sewerage, and waste management and remediation activities account for 5.52% of the HFCs emissions. Finally, the fifth place is occupied by wholesale and retail trade and the construction sector, accounting for 2.66% and 3.11% of the total CO2 and HFCs emissions, respectively.
The indicators considered in the analysis were collected from the Eurostat database, being grouped as follows: main variables used in order to capture the decoupling process (CO
2, HFCs and GDP) and variables emphasizing the EU27 countries’ context regarding air emissions (share of each country generating CO
2 and HFCs for all the EU27 countries). The data was available for all the years included in the 2008–2020 period with a yearly frequency.
Table 1 presents the description of the variables and their use: for all EU27 countries, for each individual country, and for the top 5 economic activities responsible for generating the highest quantities of a specific air emission.
The study was performed for the two periods, 2008–2012 and 2013–2020, to emphasise the effects of the targets established in the two Kyoto Protocol commitments on the decoupling process, both at the total level of EU27 countries and by each country and economic activity.
When making comparisons between countries, their specifics must also be taken into consideration. Each country’s contribution to the total quantity of the EU’s air emissions may be relevant given that the amounts generated are related to the level of economic development.
Considering the evolutions of economic growth and air emissions over the mentioned period, some degrees of decoupling may be identified. In line with the methodology developed by the OECD [
39], there are two types of decoupling—absolute and relative decoupling. The first type appears when the growth rate of an air emission is negative while the economic growth rate is positive. The second type occurs when both growth rates are positive, but the air emission growth rate is lower than the economic growth rate, so they are in a relative decoupling stage. Based on this methodology, some follow-up studies suggested other types of decoupling. For instance, Tapio [
14] used a comprehensive framework of different aspects of decoupling and defined eight types: strong decoupling (equivalent to absolute decoupling), weak decoupling (equivalent to relative decoupling), expansive decoupling, expansive negative decoupling, strong negative decoupling, weak negative decoupling, receiving decoupling, and recessive decoupling. In a more simplified view, Naqvi and Zwicki [
11] used the following five types of decoupling: absolute decoupling, relative decoupling, coupling, negative decoupling, and negative coupling. The latter framework (
Figure 2) will be used in this study.
Graphically, the economic growth rate is represented on the OX, while air emission growth rate is on the OY. Each region corresponds to a specific type of decoupling. For instance, when both growth rates are negative, it may be observed as a negative coupling, but if both are positive, it is either a coupling or a relative decoupling, depending on the ratio between the two growth rates.
The growth rate for each variable was determined as in Equation 1 [
11,
51]:
where
W represents the growth rate of the variable analysed (i.e., GDP, CO
2 or HFCs),
is the value of the variable analysed in the year
t, and
represents the value of the respective variable in the reference year. For instance, in the period 2008–2012,
represents the value of the variable from 2012, while
represents the one from 2008.
As mentioned previously, the decoupling process was studied in each of the EU27 countries for the 2008–2012 and 2013–2020 periods, both at the national level and in terms of the main economic activities generating CO2 and HFCs. This way, the study regarding the evolution of the relationship between economic growth and air emissions is developed with reference to whether the two sets of targets established in the Kyoto Protocol (KP1 and KP2) implemented were efficient. In addition to graphical comparisons between the decoupling stages of each country for the studied periods, statistical tests were also applied to check the significance of the differences.
The application of tests used to verify the differences between the 2 periods involves carrying out a preliminary analysis of the variable distribution. The results will be further useful for choosing the most appropriate test. To check if the distributions of the considered variable are normal, the Shapiro–Wilk test was used. The test was chosen due to its increased efficiency in the case of small samples, typically less than 50 observations, and because it represents generally the best method for assessing normality [
52,
53,
54]. The Shapiro–Wilk test statistic takes values in the [0, 1] interval and measures how well the ordered and standardised sample quantiles fit standard normal quantiles. A value near 1 signifies that there is a perfect match between the sample’s quantiles and the normal ones. The null hypothesis of normality is rejected when the
p-value is less than or equal to the significance level. If the distributions of a certain air emission are normal in both periods, then a Paired Student’s
t-test is suitable to be applied, otherwise, a 2-sample Wilcoxon signed-rank test is appropriate [
55]. In both tests, if the
p-value is higher than the significance level, then the null hypothesis, stating that there are no significant differences, is not rejected.
The following diagram (
Figure 3) illustrates the stages followed in order to achieve the objectives established in the present study.
In the first stage, as could be seen previously, the main GHG emissions at the EU27 level and the top 5 economic activities generating them were identified. In the next stage, the decoupling analysis was performed. The findings obtained will be presented in the Results section alongside the ones from the last stage (i.e., the pattern analysis).
4. Results
As mentioned above, CO2 and HFCs were the main air emissions in the EU27 during 2008–2020, with a share of 95.37% and 2.58%, respectively. These two greenhouse gases are mainly generated by human activities.
According to the data available for the studied period, in the EU27 countries, electricity, gas, steam, and air conditioning supply and manufacturing activities accounted for approximately 68% of the CO
2 emissions. Such a high percentage can be explained by the fact that the production of electricity and goods from raw materials is based on burning fossil fuels, mostly of coal and natural gas, which are very pollutant. Significant amounts of CO
2 emissions (around 19%) were identified also in transportation and storage activities, as well as in agriculture, forestry, and fishing. In these economic activities, petroleum-based burning fossil fuels (e.g., gasoline, diesel) used for automobiles, trucks, ships, trains, and airplanes, on one hand, and various management practices on agricultural soils (e.g., application of synthetic and organic fertilisers, the drainage of organic soils, and irrigation practices), on the other hand, could lead to high rates of CO
2 emissions [
56].
HFCs are powerful man-made greenhouse gases. Wholesale and retail trade, manufacturing and transport and storage were the top three economic activities responsible for generating approximately 77% of the HFCs emissions in the EU27 countries during the period analysed. These air emissions are mainly produced for use in refrigeration, air-conditioning, insulating foams, and aerosol propellants. HFCs are mainly found in equipment, thus the emissions result from the wearing, malfunctioning maintenance, or leakage at the end of a product’s lifetime [
23].
Furthermore, for each of the EU27 countries, the decoupling process of economic growth from CO2 and HFCs emissions was studied both at the national level and according to the main economic activities generating such air emissions. The carried-out analysis shows graphically the features of the EU27 countries by the stages of their decoupling. Also, statistical tests were applied to check whether the emissions of CO2 and HFCs were significantly different from one period to another.
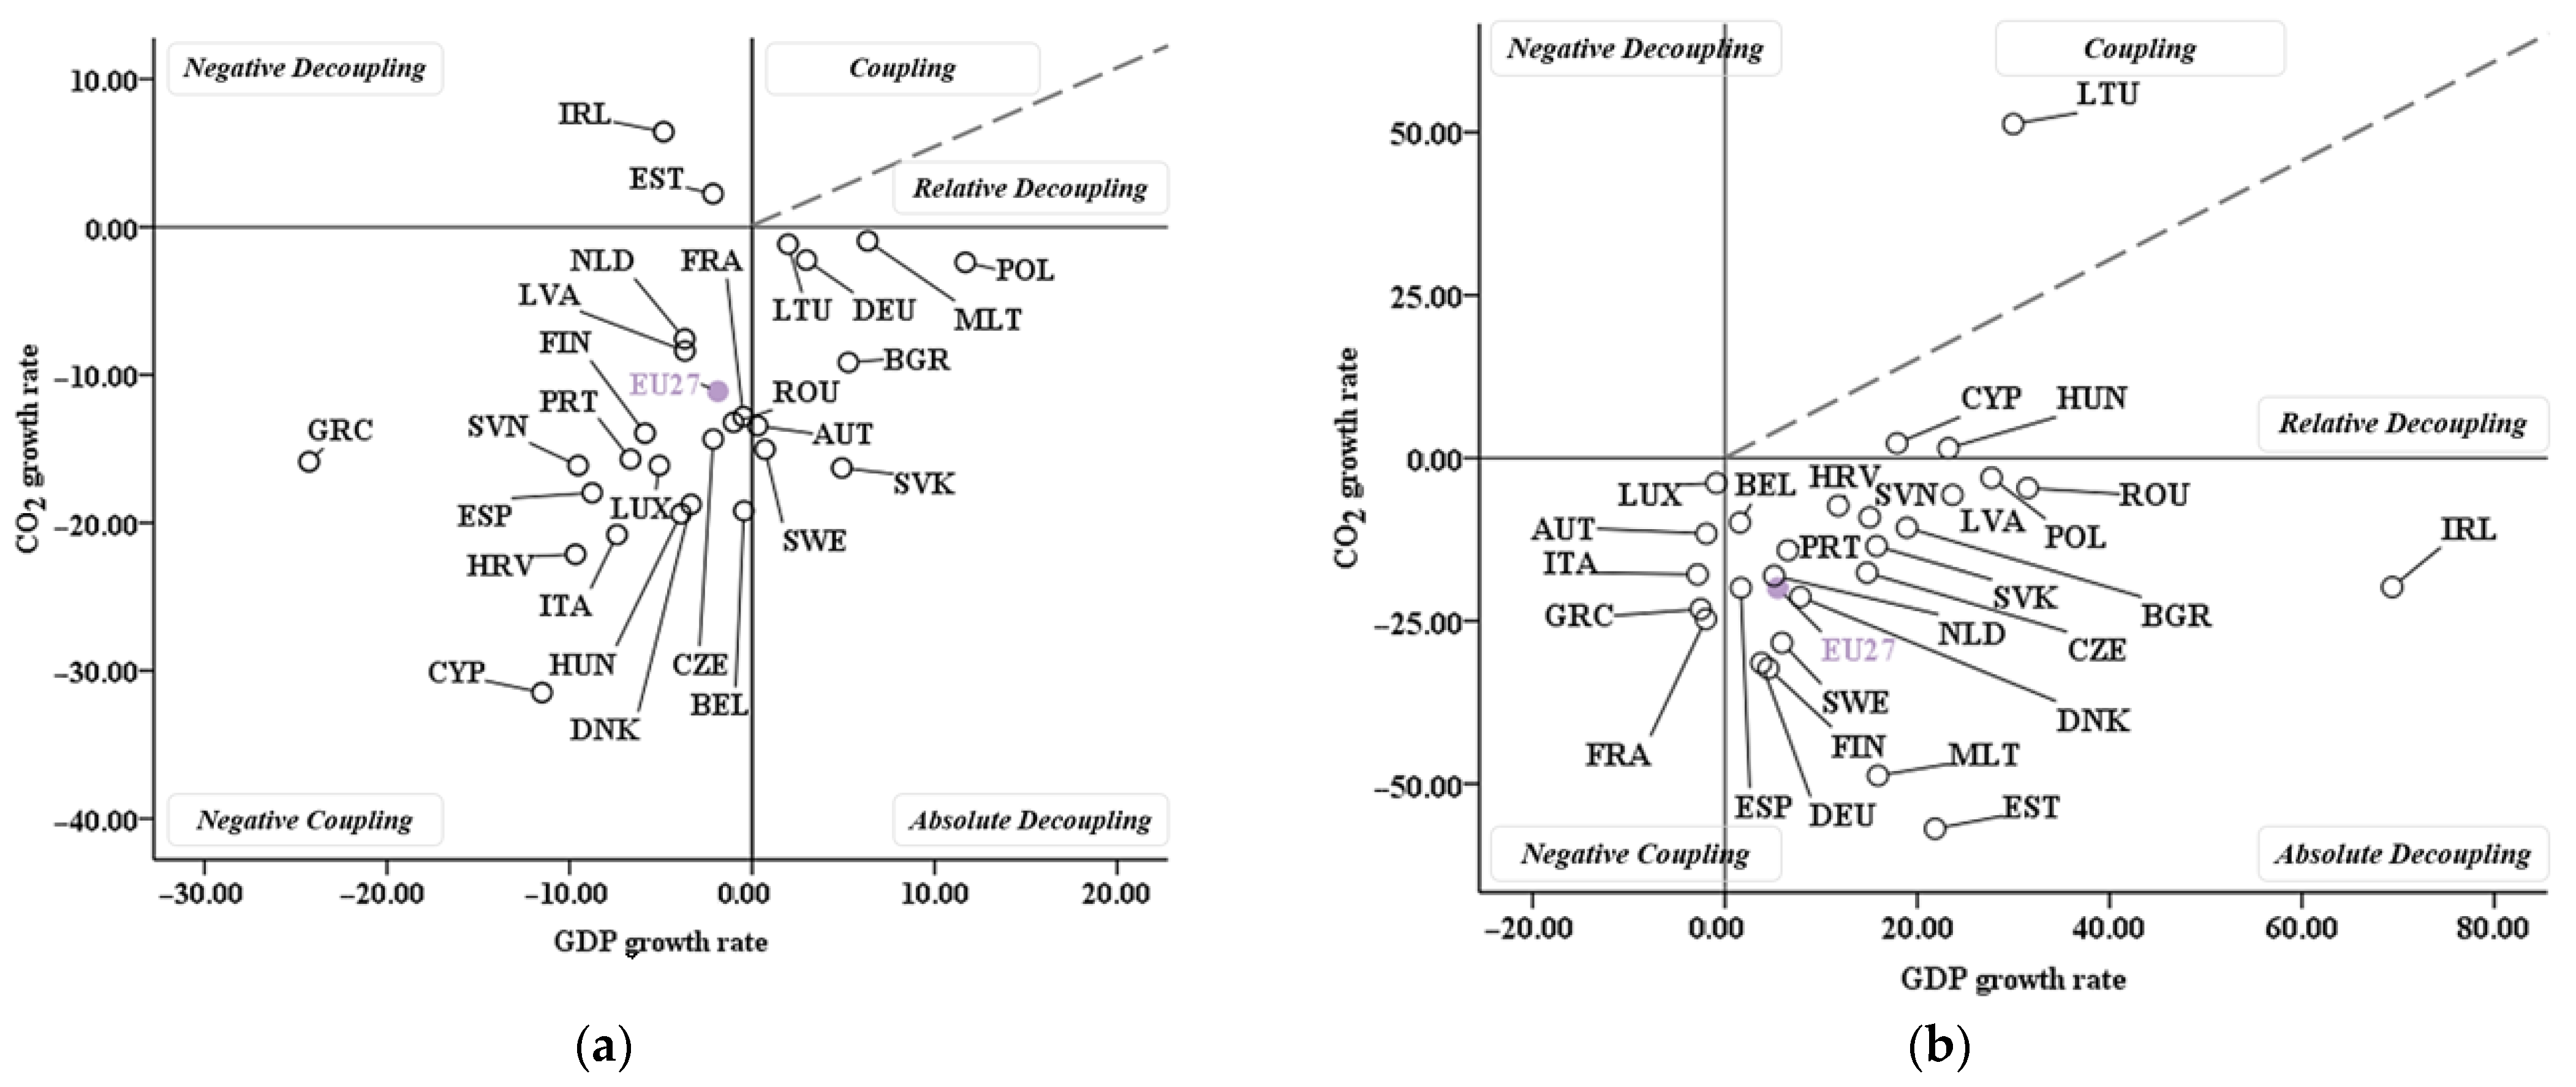
Figure 4 shows the degree of decoupling of economic growth from CO
2 for each EU27 country during 2008–2012 (a) and 2013–2020 (b) at the national level.
During 2008–2012, the EU27 countries had to face the challenge of sustaining their economies in the context of the global economic crisis. As shown in
Figure 4a, most countries had negative rates of economic growth, with values situated around −10% or lower. In contrast, such countries as Sweden, Germany, and Poland reached positive rates of economic growth. As for CO
2 emissions,
Figure 4a shows that all the EU27 countries, except Estonia and Ireland, had negative growth rates, situated mostly between −10 and −30%. In terms of decoupling, only a few countries with positive economic growth rates reached the stage of absolute decoupling, while most countries were characterised by negative economic growth, reaching a negative coupling stage. In the next period, 2013–2020, the evolution of the decoupling process is visible in most of the EU27 countries (
Figure 4b). A general finding shows that, while in the first period, most of the countries and economic activities were part of a negative coupling stage, characterised by negative values for both variables, they made a transition in the second period to relative or absolute decoupling, where the economic growth rates had positive values, with CO
2 emission growth rates being either positive or negative. These results partially support Hypothesis 1 (H1).
HFCs emissions showed a different trend of evolution compared with CO
2 emissions in the period 2008–2012.
Figure 5a emphasises that economic growth rates were generally negative in most of the countries, while the growth rates of the HFCs emissions were positive, attaining a negative decoupling at the national level. Despite most of the EU27 countries being included in the negative decoupling stage, Denmark, Finland, and Spain reached the negative coupling stage, having negative growth rates for both variables. On the other hand, Sweden had a negative growth rate for HFCs emissions and a positive economic growth rate, placing it in the absolute decoupling stage. Negative decoupling was common among the following countries: Belgium, Cyprus, Estonia, France, Greece, Ireland, Luxembourg, the Netherlands, and Romania. In these countries, the growth rates of the HFCs emissions were significantly positive also at the national level, with values situated between 10 and 50% (
Figure 5a). In other countries, the quantities of HFCs emissions were negative mostly in manufacturing (Czech Republic, Germany, Finland, Latvia, Slovenia, and Sweden) and construction (Austria, Croatia, Czech Republic, Denmark, Italy, Malta, Portugal, Slovenia, and Sweden). In the next period, 2013–2020, the evolution of HFCs emission changed in approximately half of the EU27 countries.
Figure 5b shows that some of the countries (Denmark, Finland, Spain, and Sweden) managed to keep the negative evolution of the HFCs emissions in a positive economic context, thus being included in the absolute decoupling stage. Also, some other countries joined this stage: Belgium, Estonia, Germany, Ireland, Latvia, the Netherlands, and Poland. In contrast, in other EU27 countries, mostly in the Central and Eastern European region, despite positive economic growth rates, growth rates of HFCs emissions continued to be positive (Bulgaria and Lithuania) or started to be positive (Croatia, Cyprus, Czech Republic, Hungary, Malta, Romania, Slovakia, and Slovenia). These results lead to the partial validation of Hypothesis 2 (H2).
Next,
Figure 6 emphasises the results obtained for the decoupling process with regard to CO
2 emissions in the two periods considered for the specific economic activities generating them.
After analysing in detail each country’s decoupling process, it was found that the economic activities generating CO
2 emissions mainly reached the negative coupling stage, which means that most countries were not prepared to attain positive growth rates in terms of economic growth, and due to the decreasing economic production of goods, quantities of CO
2 emissions also went down (
Figure 6a). However, CO
2 emissions were positive in countries such as Spain, the Netherlands, Portugal, and Romania in agricultural, forestry, and fishing economic activities, despite an unfavourable economic context, therefore placing them in the negative decoupling stage. In the case of countries with a positive economic growth rate, manufacturing and transportation and storage generated mainly negative growth rates of CO
2 emissions, including in such countries as Austria, Bulgaria, Malta, Slovakia, and Spain, which reached the absolute decoupling stage.
During 2013–2020, after recovering from the effects of the economic crisis, most of the countries registered positive economic growth rates (
Figure 6b). However, countries such as Austria, France, Greece, and Italy had negative values for this variable, although these were close to 0. Regarding the CO
2 emissions growth rate (
Figure 6b), the levels were mainly negative, as in the previous period, but between 0 and −25%. Few countries, for instance, Estonia, Finland, Germany, and Sweden, managed to obtain values lower than −25% due to significant improvements in the main economic activities generating CO
2 emissions.
Figure 6b shows that electricity, gas, steam, and air conditioning supply, manufacturing, and transport and storage were the main economic activities determining negative growth rates of CO
2 emissions in most countries. Thus, Hypothesis 3 (H3) is confirmed. In contrast, agriculture, forestry, and fishing and wholesale and retail trade accounted for the positive growth rates of CO
2 emissions. Denmark, Estonia, Finland, Germany, the Netherlands, and Sweden managed to control and diminish CO
2 emissions in all the five main economic activities included in this study and also had positive economic growth rates; they were thus placed in the most desired stage, namely, the absolute decoupling stage. At the other end, Austria and France, among others, were situated in the negative coupling stage, with negative values for both variables, regardless of the economic activity.
During 2008–2012, as in the national level case, HFCs emissions showed a different trend of evolution compared with CO
2 emissions.
Figure 7a emphasises that the economic growth rates were generally negative in most of the countries, while the growth rates of the HFCs emissions were positive, identifying a negative decoupling in the following five economic activities: wholesale and retail trade, manufacturing, transportation and storage, water supply, sewerage, waste management and remediation activities, and construction. In the next period (
Figure 7b), the situation improved, with most of the economic activities being positioned on the right side of the graph, being found such in stages as coupling, relative, or absolute decoupling. In the coupling stage, economic activities occurred mostly in water supply, sewerage, and waste management and remediation activities, with growth rates of the variables being positive and with HFCs emissions exceeding economic growth. Construction activities mostly reached the coupling and relative decoupling stages, the latter being characterised by a lower growth rate of HFCs emissions compared with economic growth. Finally, the top three economic activities responsible for the lowest levels of HFCs emissions in the EU27 countries comprised wholesale and retail trade, manufacturing, and transport and storage. Thus, Hypothesis 4 (H4) is validated. So, it may be concluded that there is a high awareness concerning the dangers of HFCs emissions for human health and the ecosystem wellbeing and that the improvements made in the economies of the EU27 countries focused on the most polluting economic activities.
Also, statistical tests were run to check whether the growth rate of the CO
2 and HFCs emissions in the case of the EU27 countries between the two periods was significant, both at the national level, and by economic activities.
Table 2 includes the results of the Shapiro–Wilk test used to check if the variables measuring CO
2 and HFCs emissions in the two periods were normally distributed. Then, if both variables were normally distributed, the Paired Student’s parametric t-test was used. Otherwise, the 2-sample Wilcoxon rank non-parametric test was applied.
In the case of CO2 emissions, no significant differences were found overall for the group of EU27 countries, but the results by economic activity were quite diverse. Thus, there were found significant differences between the quantities of CO2 emissions for both periods in the case of agriculture, forestry and fishing, manufacturing, and electricity, gas, steam and air conditioning supply, and no significant differences for the other two considered economic activities (i.e., wholesale and retail trade and transportation and storage). In addition, among the significant differences identified, the lowest value of the Sig was registered for electricity, gas steam and air conditioning supply, implying that the differences were more significant in this kind of economic activity, with more improvements made towards reducing the amount of CO2 emissions. These results contribute to the validation of Hypotheses 1 and 2 (H1 and H2).
In detail, the results of the 2-sample Wilcoxon rank test, the so-called “before–after test”, indicated that there are both negative and positive differences in CO2 emissions from one period to another. Most of the EU27 countries displayed positive differences due to increasing quantities of CO2 emissions compared with those during 2008–2012 and 2013–2020 in agriculture, forestry and fishing as well as in manufacturing, and negative differences in such activities as electricity, gas, steam, and air conditioning supply, with decreasing quantities of CO2 emissions.
Regarding HFCs emissions, in terms of economic activities in the water supply, sewerage, waste management and remediation activities, and wholesale and retail trade, given that both results of the Shapiro–Wilk test indicated the normality of the distributions, the Paired Student’s t-test was applied to verify the differences between the means of the variables in the two periods. The results emphasised that only in case of the HFCs emissions generated by wholesale and retail trade were there significant differences. For other economic activities (i.e., manufacturing, construction, and transport and storage) and at the national level, the 2-sample Wilcoxon rank test was applied. Except for construction, the test indicated the existence of significant differences in the evolution of the HFCs emissions in the two periods for all other economic activities and at the national level. Moreover, in the case of wholesale and retail trade, the lowest value of Sig was identified, indicating the existence of more significant differences from one period to another compared with other economic activities. The results obtained in this stage support Hypotheses 3 and 4 (H3 and H4). In line with the results above, it may be noted also that the negative differences were more preponderant due to decreasing quantities of HFCs emissions at the national level, which occurred mainly in manufacturing, wholesale and retail trade, and transport and storage.
To show better the magnitude of the changes in the evolution of CO2 and HFCs emissions from 2008–2012 to 2013–2020, the peculiarities of the EU27 countries should be analysed. First, it is important to identify if there were significant differences in the share of CO2 and HFCs emissions from one period to another in the EU27 group. This way, it will be possible to find out which countries managed to lower their national air emissions, and which ones were generators of higher quantities of air emissions.
Table 3 shows the share of CO
2 and HFCs emissions in each country for the two periods. Also, the proportions were used to make a ranking of the top polluting countries, from the most to least polluting countries.
In terms of CO2 emissions, the top five most polluting countries during 2008–2012 were Denmark (7.43%), Luxembourg (7.41%), Estonia (6.78%), Finland (5.30%), and the Netherlands (4.88%). In the next period, Denmark was the third with 6.95%, ahead it being Luxembourg and Estonia with 7.50% and 7.25%, respectively. On the other hand, the five least polluting countries between 2008 and 2020 were France (2.15%), Romania (2.10%), Lithuania (2.06%), Croatia (1.96%), and Latvia (1.94%). During 2013–2020, France, Romania, and Croatia held the last three positions with 2.09%, 2.04%, and 1.89%, respectively, ahead of them being Sweden (2.21%) and Latvia (2.14%). In general, significant increases in CO2 emissions were identified for Lithuania (from 2.05% to 2.75%), by 8 positions and Ireland (from 3.68% to 4.63%), by 4 positions; and significant decreases were observed for Malta (from 3.32% to 2.48%), by 7 positions, and Cyprus (from 4.30% to 3.83%), by 4 positions.
Moving on to HFCs emissions, during 2008–2012, the top five most polluting countries were Greece (9.43%), Spain (8.54%), Malta (7.79%), Belgium (7.05%), and Finland (5.80%). In the next period, Greece, Malta, and Belgium held the highest positions with 10.54%, 9.44%, and 6.88%, respectively, followed by Italy (5.23%) and the Czech Republic (4.34%). The bottom five positions during 2008–2012 were held by Lithuania (1.78%), Slovenia (1.67%), Bulgaria (1.64%), Luxembourg (1.08%), and Romania (0.85%). Only the last two countries were still present in the final part of the top with 1.02% and 1.28%, before them being Sweden, Denmark, and the Netherlands with 1.84%, 1.75%, and 1.57%, respectively. The highest increases in HFCs emissions were observed for Croatia (from 2.24% to 3.90%), Lithuania (from 1.78% to 3.39%), Bulgaria (from 1.64% to 2.95%), and the Czech Republic (from 3.45% to 4.34%). At the opposite end, the highest decreases in HFCs emissions were in Denmark (from 3.71% to 1.75%), Poland (from 3.82% to 3.21%), and Sweden (from 2.34% to 1.84%).
6. Conclusions
This study focused on the joint evolution of economic growth and two of the main air emissions, CO2 and HFCs, generated by economic activities in the EU27 countries during 2008–2012 and 2013–2020. The importance of analysing the relationship between these variables lies in the fact that the unsustainable manner in which economic activities are put into place affects both the amount of air emissions and the quality of human health. Researchers and activists have urgently advocated for solutions to be found that are aimed at lowering the intensity of the relationship between economic growth and environmental degradation. Moreover, international environmental organizations have imposed several targets regarding the levels of air emissions to maintain or to limit over time. An important set of targets was established by the Kyoto Protocol that aims to limit key air emissions to a level close to that of 1990. These targets had to be implemented by each country within two commitment periods: 2008–2012 and 2013–2020. This study compared the levels of environmental variables for the two periods to check whether the imposed targets contributed to limiting the level of air emissions.
In this context, the OECD (2002) developed the concept of decoupling, which describes the degree to which an economy is able to grow without causing more environmental pressure or damage. According to the OECD, the main stages of decoupling are the relative and the absolute stages. A relative decoupling stage appears when the rates of economic growth and environmental degradation are positive, with the former exceeding the latter. An absolute decoupling stage is the most desirable as it means that the economic growth rate is positive, and the environmental degradation rate is negative. The academic literature defined several intermediate stages in addition to these two stages. This study also included the following decoupling stages: coupling (positive rates of economic growth and environmental degradation, the rate of the first variable being lower than that of the second one); negative decoupling (negative economic growth rate and positive environmental degradation rate); and negative coupling (negative rates of economic growth and environmental degradation).
To analyse the evolution of the degree of decoupling of economic growth from air emissions in the two periods, both visual aids and statistical tests were used. The decoupling was studied for each of the EU27 countries at the national level but also in terms of the top five economic activities generating CO2 and HFCs. In the first period, most of the EU27 countries had negative growth rates for the variables considered, placing them in a negative coupling stage. In the second period, the evolution of the decoupling process was visible in all the EU27 countries; thus, they made a transition to relative or absolute decoupling stages, where the GDP growth rates had positive values while the CO2 or HFCs emissions rates were either positive or negative. At the national level, it could be found that in the second period, both GHG emissions were at lower levels in most of the EU27 countries, this fact being observed in the graphical representations and confirmed by the results of the empirical analysis. This observation proved that the targets established in the EU area regarding reducing the GHG emissions were efficient and produced significant effects on the manner in which economic activities were performed to be more responsible in relation to environmental degradation. In the case of the economic activities, it could be observed that for CO2 emissions, most of the EU27 countries registered improvements in electricity, gas, steam, and air conditioning supply. It could be argued that this is due to the increasing interest in recent years in investing in renewable sources of energy: solar, wind, geothermal, etc. In regard to HFCs emissions, the economic activities of wholesale and retail trade made significant steps towards sustainable consumption due to the use of less carbon-intensive fuels like natural gas, wood, and biofuels. All the results discussed above validate the research hypotheses defined in the present study.
Overall, there could be identified three directions of evolution, namely, decreasing, constant, or increasing evolution. As could be seen, some countries had difficulties in moving to a better stage of decoupling due to faced economic challenges. However, among the EU27 countries, the Nordic countries (i.e., Sweden, Denmark, and Finland), which are known as significant promoters of green growth, saw substantial improvements over time. These countries implemented two types of environmental policy instruments: on the one hand, “command and control” instruments regulated by the government with the role of imposing standards on technology used in production and on the output resulting from this process; on the other hand, the economic instruments, which are mainly market-based and focused on policies aimed at changing the behaviour of consumers and firms towards reducing air emissions. In particular, policies such as the green certificate system for electricity production, improved energy efficiency, and substitution towards less carbon-intensive fuels had a significant impact towards reducing the amounts of GHG emissions in changing the way in which economic activities are conducted.
One of the limitations of this paper is represented by the low availability of the data compassing the current period to reflect the decoupling which took place during 2021 and 2022 for the analysed countries. However, the results on the evolution of decoupling in each EU27 country, both at the national level and in terms of economic activities, may be a solid background for further studies on decoupling. For instance, econometric models could be applied to describe even further the impact of economic growth on environmental degradation. In this context, the Environmental Kuznets Curve (EKC) could represent an important analytical tool that addresses the question of the effectiveness of the actions implemented in each country in decreasing the pressure of economic activities on the environmental quality. The use of GDP per capita as a proxy for economic growth could lead to some bias to the extent that some of the results could be interpreted by economic activity. Other indicators meant to emphasise the output obtained in each economic activity could be relevant for verifying the robustness of the results. Further research may investigate the influence of emissions on human health in EU27 countries, broken down into homogeneous subgroups by the level of their decoupling. In this sense, the use of Healthy Life Years as a representative indicator for measuring the health status of the population in the EU would be appropriate because, unlike other indicators that measure the “quantity” of life, this one reflects the “quality” of life spent in a healthy state.


