Article

An Alternative Regulation of Compensation Mechanisms for Electric Energy Transgressions of Service Quality Limits in Dispersed and Seasonal Areas

by
Julio A. de Bitencourt
1,2,*,
Daniel P. Bernardon
1,2,
Henrique S. Eichkoff
1,2,
Vinicius J. Garcia
1,2,
Daiana W. Silva
3,
Lucas M. Chiara
3,
Renan L. B. Gomes
3,
Sebastian A. Butto
4,
Solange M. K. Barbosa
4 and
Alejandre C. A. Pose
4
1
Centro de Excelência em Energia e Sistemas de Potência, Universidade Federal de Santa Maria, Avenida Roraima, 1000, Santa Maria 97105-340, Brazil
2
Instituto de Engenharia de Sistemas e Computadores Tecnologia e Ciência-Pesquisa e Desenvolvimento-Brazil (Inesc P&D Brasil), Rua José Caballero, 15, Santos 11055-300, Brazil
3
CPFL Energia, Rodovia Engenheiro Miguel Noel Nascentes Burnier, 1755, Campinas 13088-900, Brazil
4
Siglasul Consultoria Ltda., Rua México, 51, Rio de Janeiro 20031-144, Brazil
*
Author to whom correspondence should be addressed.
Energies 2023, 16(15), 5588; https://doi.org/10.3390/en16155588
Submission received: 29 March 2023 / Revised: 30 May 2023 / Accepted: 13 June 2023 / Published: 25 July 2023
(This article belongs to the Section F: Electrical Engineering)

Abstract

:
The evaluation of the quality of electric power distribution services in Brazil is regulated and monitored by the National Electric Energy Agency ANEEL, which uses metrics related to the duration frequency of power interruptions that occur in the power utilities’ networks. The methodology applied by the agency to establish financial compensation due to violations of the quality standards does not take into consideration the consumers’ production industry when establishing compensation for the transgression of service quality indicators. This study will analyze a case study of a group of industrial consumers linked to agribusiness in the southern region of Brazil, which have strongly seasonal use of distribution networks and are scattered in large, dispersed areas. Based on the evaluation of the impact of service quality indicators on financial compensation, a regulatory mechanism is proposed in the form of an interruptible tariff duly quantified in the form of a non-linear programming problem to find a discount range for uninterruptible tariffs. The results obtained with the real data for the group of irrigating consumers demonstrate the feasibility regarding the application of the proposed approach, whether due to the discounts offered or even the repercussions of the calculated financial amounts.

1. Introduction

Service quality is associated with the continuity of supply, which relates to interruptions in the electrical systems, either caused by failures in the electrical system or by scheduled maintenance activities. The quality of energy distribution services in Brazil is evaluated according to the reliability of energy supply, which is measured by collective and individual continuity indicators that evaluate the duration and frequency of interruptions in energy supply. The National Electric Energy Agency (ANEEL), the regulatory and supervisory body of electric energy services in Brazil, establishes a methodology [1] that regulates (i) the method of calculating continuity indicators that measure the times and frequencies of interruptions perceived by consumers and (ii) the method of calculating financial compensation to reimburse consumers for violations of established continuity standards.
The proposal of this study is to introduce an alternative mechanism for violations found in the service quality indicators of the utilities. This mechanism is based on offering a discount on the usage tariff given by the utilities to consumers, and in this study, this type of mechanism will be called the interruption tariff (IT), since it is applied when there is an interruption in the supply of electricity due to unscheduled outages that exceed the limits of the regulatory standard.

1.1. Literature Review

Approaches based on energy cost discounts are employed in European Union member countries to guarantee consumers their rights to quality of service [2] and are due to contingencies in the network infrastructure that cause interruptions in energy supply.
Price incentives duly included in a demand response program, or price-based demand response (PBDR), can lead consumers to adapt their consumption at predetermined times, complying with events determined by the concessionaire and providing a pattern of demand compatible with the determined planning [3]. Recently, consumer flexibility to demand response programs has been strongly highlighted with respect to capabilities and limitations [4], as well as the technical and regulatory barriers involved in giving demand response approaches the necessary/desired implementation. Considering the case of China, Guo et al. [5] describe the impact of a demand response system to increase reliability and integrate renewable sources and peak shaving from inducing consumer behavior in response to price signals and restrictions from the distribution system. Still in this context, several contributions describe the development of special tariffs that aim to adapt consumer behavior to induce desired demand profiles when considering distributed energy resources [6,7,8,9].
In addition to PBDR, there are also incentive-based demand response (IBDR) [10] in which the interruption in the power supply is voluntary, mandatory, or even for market clearing purposes [11,12]. As an example of IBDR, the application of interruptible tariffs is an effective way to offer energy without selling capacity, where participating consumers (usually large industries) agree to allow the power utility to cut or reduce their supply for a certain period, and participating consumers can choose the frequency and duration of the interruption [13,14]. Regarding the reliability assessment of IBDR and PBDR, Nikzad and Mozafari [15] discuss the penalties for customers who do not respond to load reduction and incentives for those who adequately respond to the request to reduce their loads.
In the Portuguese electricity sector, until the year 2011, compensation motivated by interruptions to clients of which values were less than €0.5 in Continental Portugal, €2.5 (LV consumers), and €5.0 (MV consumers) in the autonomous regions [16] were reversed through a compensation mechanism for the formation of an investment fund for distribution network improvements rather than being credited to consumers. As of 2016, according to the Energy Services Regulatory Authority (ERSE) [17], the regulatory agency for the energy sector in Portugal, these values were set at €0.5 for all classes.
In California’s electricity sector, Southern California Edison [18,19] applies the concept of an interruptible tariff exclusively to irrigating consumers with the option to be interruptible. This tariff modality allows the concessionaire to make power cuts or restrictions in the energy supply, and consumers must be notified in advance. In case of unplanned interruptions and if energy is not restored within 24 h, consumers must be compensated by the power utility in a fixed amount of $30.
The research references indicate that the concept of interruptible tariff is applied in penalties when interruptions exceed the agreed-upon time limits, especially during instances of necessary power supply cuts. The contribution of this study is to propose a mechanism of financial compensation motivated by breaches in quality indicators that not only compensates consumers for the failure to meet regulatory quality standards but also enables the power utility to establish an investment fund for specific actions aimed at improving the service quality for consumers.

1.2. Novel Contribution

This paper focuses on the constitution of a regulatory mechanism that later enables the planning of actions to improve the distribution system, thus favoring the improvement of service quality.
This regulatory mechanism is based on the consequences that interruptions cause in the quality of service, represented as financial compensation. The concept of interruptible tariff is applied in penalties when interruptions exceed the agreed-upon time limits, especially during instances of necessary power supply cuts.
The contribution of this study is to present a new approach in proposing a mechanism of financial compensation motivated by breaches in quality indicators that not only compensates consumers for the failure to meet regulatory quality standards but also enables the utility to establish an investment fund for specific actions aimed at improving the service quality for consumers.
The main contributions of this work are summarized as follows:
  • The vicious cycle promoted by financial compensation for irrigating consumers.
  • The parameters for modifying quality indicator thresholds.
  • The proposed regulatory mechanism, defined as an interruptible tariff, to guide and limit the scope of financial compensation caused by interruptions in the power supply.
  • The composition of an investment fund, obtained as a result of the appropriation of part of the financial compensation.
The actual case study was carried out with a group of agribusiness medium voltage (MV) customers in the concession area of a power utility in southern Brazil (RGE Sul), herein referred to as irrigating consumers.

2. Theoretical Regulatory Framework and Motivation

In the following section, the theoretical framework used as the foundation for the study’s development will be presented, as well as the motivation behind the proposal for a compensation mechanism for violations of quality as seen in quality indicators.

2.1. Regulatory Theoretical Framework

The regulatory theoretical framework is a crucial aspect for understanding the context in which the proposed compensation mechanism for breaches in quality indicators operates. This framework consists of the regulations and guidelines established by regulatory ANEEL bodies in the energy sector.
In terms of individual indicators, ANEEL establishes the metrics for the evaluation of the limits and the procedures related to the registration of the continuity and service indicators, defining the standards and compensation to be paid for violations of the established regulatory limits. The continuity indicators of the electric power distribution service are established as to the duration and frequency of interruptions, determined monthly and individually for each consumer, using the following expressions.
D I C = i = 1 n t ( i )
F I C = n
D M I C = t i m a x
where
  • DIC: individual interruption duration.
  • FIC: individual interruption frequency.
  • DMIC: maximum duration of continuous interruption.
  • n: number of interruptions for the individual consumer.
  • t(i): duration time of interruption (i) for the individual consumer, in hours.
  • t(i)max: time of the maximum duration of continuous interruption (i), in hours.
The individual indicators are the basis for the calculation of the collective indicators DEC (equivalent duration of interruption per consumer) and FEC (equivalent frequency of interruption per consumer), which represent the collective (group).
The DEC indicates the number of hours, on average, that a consumer was without electricity during monthly, quarterly, and annual periods, and the FEC indicates how many times, on average, there were interruptions for the consumer during the periods considered, using the following expressions.
D E C = i = 1 C c D I C ( i ) C c
F E C = i = 1 C c F I C ( i ) C c
where
  • DEC: equivalent duration of interruption per consumer.
  • FEC: equivalent frequency of interruption per consumer.
  • i: index of billed consumer units in the set.
  • Cc: total number of billed consumer units in the set for the calculation period (monthly, quarterly, or annually), served at low voltage or medium voltage.
The DEC and FEC indicators calculated in Brazil correspond to the System Average Interruption Duration Index (SAIDI) and System Average Interruption Frequency Index (SAIFI) indicators, according to the terms and definitions of the international standard IEEE 1366 [20], as presented in Table 1.
In the case of a violation of the individual continuity limits of DIC, DMIC, and FIC indicators, financial compensation amounts are established and calculated by expressions (6), (7), and (8), respectively, according to Module 8 of PRODIST [1]:
C o m p D I C = D I C V · E U S D B 730 · k e i 1
C o m p D M I C = D M I C V · E U S D B 730 · k e i 1
C o m p F I C = F I C V F I C p · D I C p · E U S D B 730 · k e i 1
where
  • DICV: verified interruption duration.
  • DICp: continuity limit for the interruption duration indicator.
  • DMICV: verified maximum duration of continuous interruption.
  • FICV: verified interruption frequency.
  • FICp: continuity limit for the interruption frequency indicator.
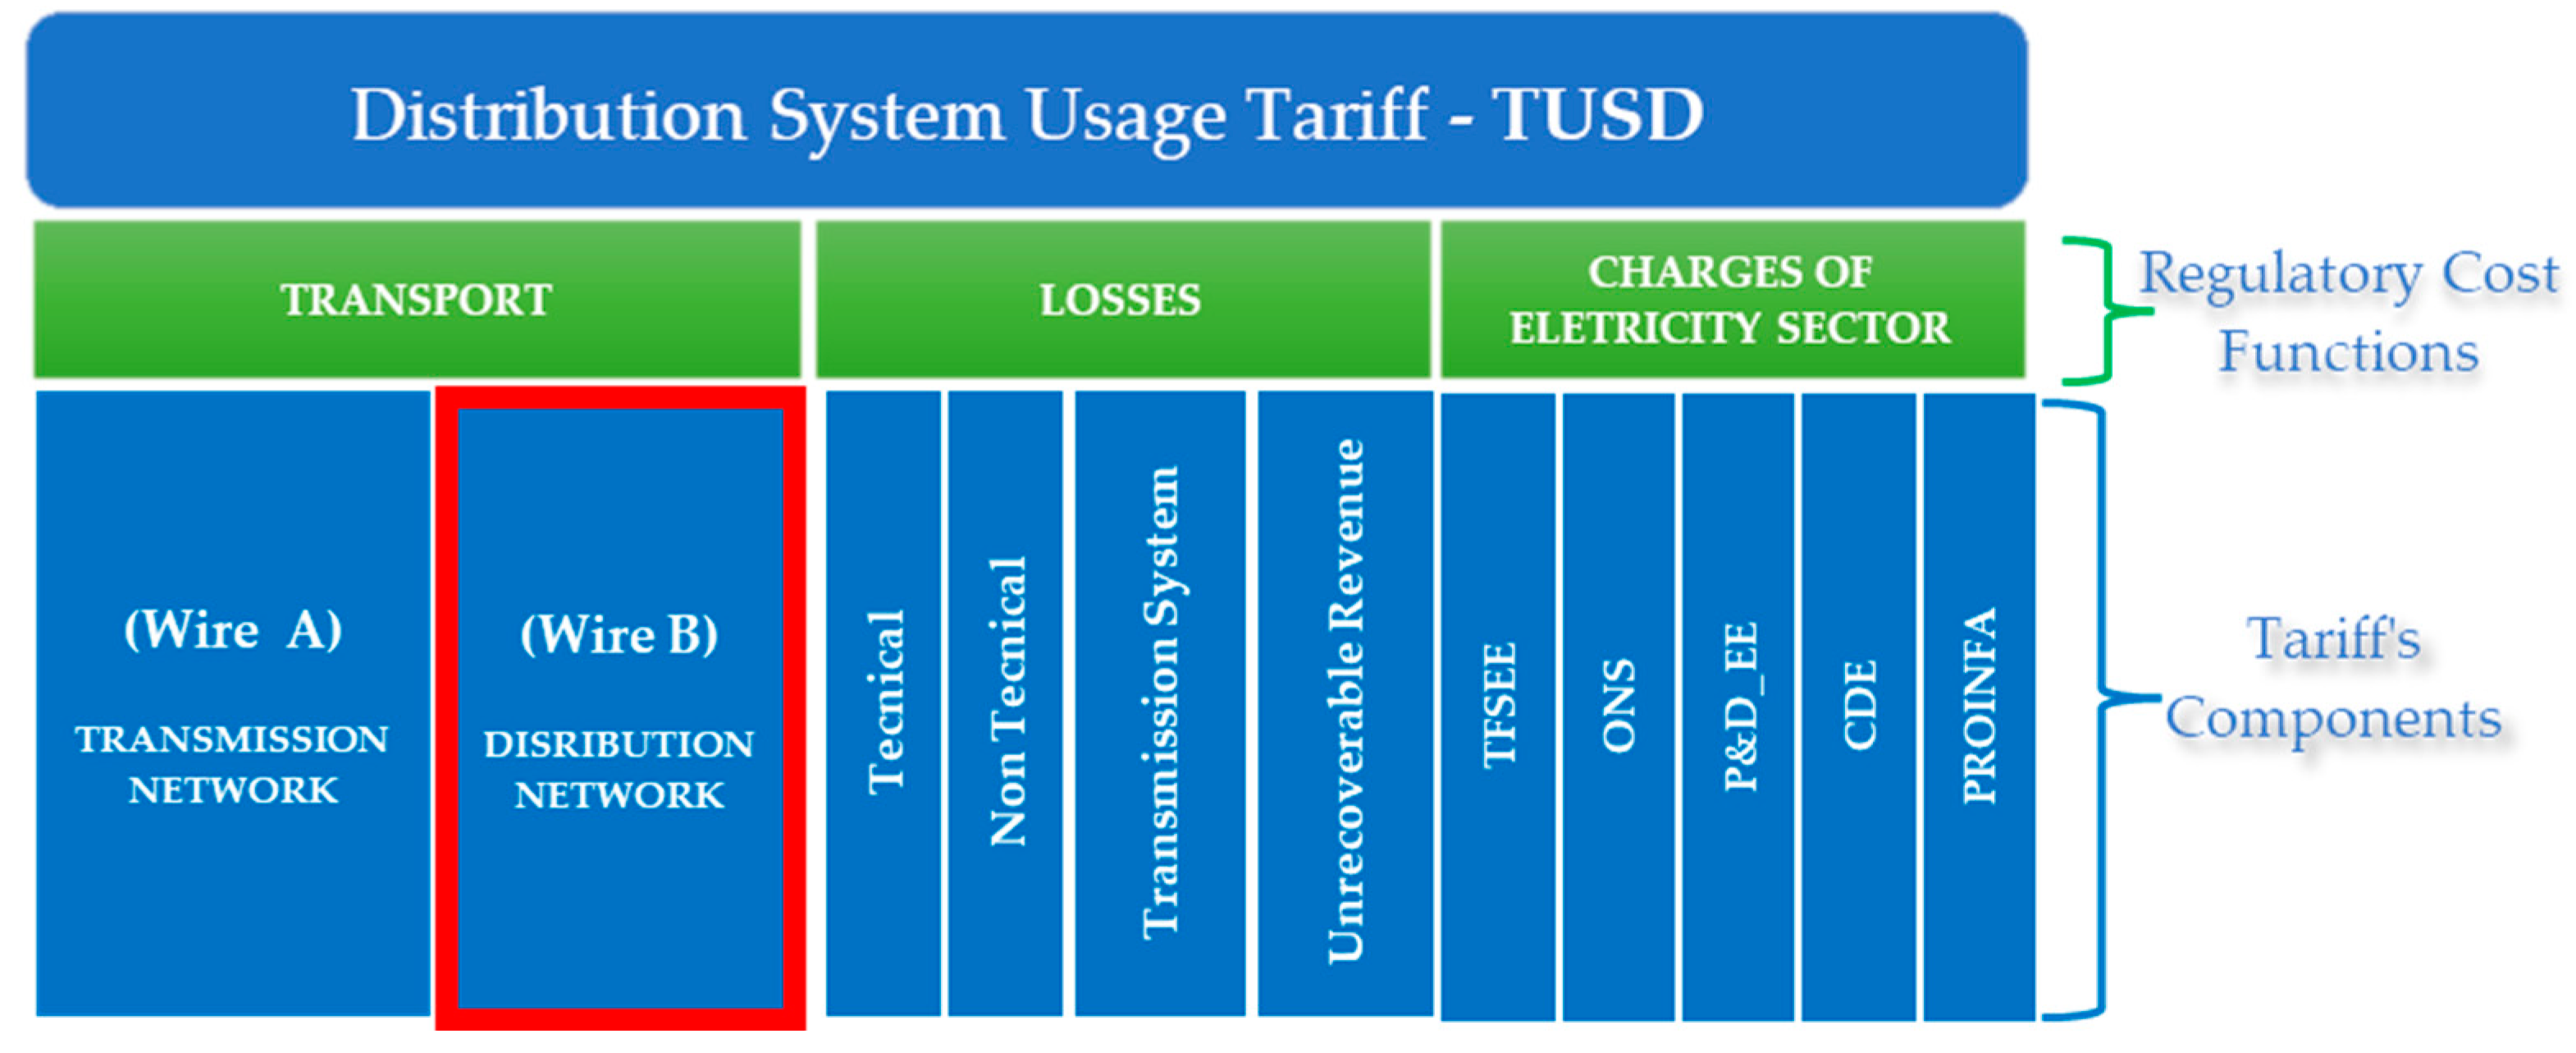
  • EUSDB: base monetary value in the compensation calculation, which corresponds to the Distribution System’s Charge Use related to the Wire Regulatory Component portion.
  • 730: average number of hours in a month.
  • k e i 1 : weighting Factor—34 for low voltage consumer units; 40 for medium voltage consumer units, and 108 for high voltage consumer units.
The Distribution System Use Tariff (TUSD) is the unitary monetary value established by ANEEL, through the Tariff Structure Process [21], in R$/MWh or R$/kW, used for the monthly billing of users for the use of the electricity distribution system. The TUSD is composed of tariff components, illustrated in Figure 1, which have regulatory cost functions. It is important to note that the TUSD Wire B (highlighted in the red frame) is intended to cover the regulatory costs due to the use of the distribution networks belonging to the power utility.
According to the definition in [22], the Distribution System Use Charge Wire B (EUSDB) is the value, in Brazilian currency, related to the use of distribution facilities and calculated by multiplying the portion of the usage tariff related to distribution service costs (TUSD Wire B) by the respective Distribution System Usage Amounts (Montante de Uso do Sistema de Distribuição (MUSD) in Portuguese) and energy contracted or verified energy amounts.
Table 2 shows an example of the items contained in the energy bill of a rural irrigating consumer, tariffed in subgroup A4 in the green modality (green hourly tariff modality [23]: applied to consumer units in group A, characterized by differentiated tariffs for electricity consumption, according to the hours of use during the day, as well as a single power demand tariff), indicating items 2, 3, 4, 5, and 6 highlighted in red, which total R$ 13,526.56 for EUSDB, representing the base monetary value in the calculation of financial compensation due to violations of individual quality indicators.
The Energy Tariff (Tarifa de Energia (TE) in Portuguese) corresponds to the monetary value established by ANEEL [23], in R$/MWh, used to charge consumers for their energy consumption, registered in hourly periods.

2.2. Motivation

The motivation behind the alternative proposal for a compensation mechanism for transgression is based on the consumer’s perception of satisfaction and the effectiveness of the financial compensation that is awarded. When a financial compensation is established, it is credited (deducted) from the consumer’s bill, which does not truly translate into a satisfactory experience for them due to the loss of production caused by the unavailability of energy during a certain period.
It can be inferred that the regulatory signal indicated by the payment of compensation is not aligned with the same direction of incentivizing improvements in the quality of service provided by the concessionaire. Consider the following sequence of events:
  • Upon occurrence of interruptions, consumers perceive a deficient service provision.
  • These interruptions signal for an increase in regulatory requirements by the regulatory agency (ANEEL), imposing more stringent limits. Consequently, these requirements resulting in an increase in the amount of financial compensation to be paid to the users by the power utility.
  • Thus, they lead the power utility to an economic situation of unbalance between revenue (EUSDB) and expense (Financial Compensation).
  • This imbalance leads the power utility to a loss of economic power to make investments.
  • Not making investments in service quality implies a reduction in the quality level and closes the cycle.
This sequence configures a vicious cycle that feeds on itself, as illustrated in Figure 2.
One way to break this vicious cycle is to enable the concessionaire to raise funds that should be invested in specific actions to reduce interruptions in power supply, promoting the improvement of the quality of service to consumers.
The development of this methodology will be presented in the following section, focusing on a compensation mechanism that not only remunerates consumers for the transgressions of the quality indicators but also allows the power utility to raise funds. It is important to emphasize that in Brazil, the regulatory agency (ANEEL) is the one that will establish the rules for controlling and supervising the result of the proposed compensation mechanism, since the resources that the concessionaire will earn for not paying the full amount of the regulatory financial compensation belong to the consumers.

3. Proposal for Compensation Mechanism Methodology: Interruptible Tariff

The proposed compensation mechanism presented in this study consists of establishing a percentage discount in the Distribution System Usage Tariffs—TUSD Wire B [23]—applied to consumers who had their individual continuity indicators DIC, FIC, or DMIC violated in the monthly period. The application of this discount to consumers who opt for this compensation methodology replaces the financial compensation regulated by ANEEL [1], i.e., it is a “trade-off” for the consumer when choosing between the tariff discount or the compensation calculated according to the current regulatory rules in effect.
The calculation of the interruptible tariff to be applied in the TUSD Wire B, as a discount proposal to be offered to the consumer whose quality indicator was violated, will be formulated based on the information about individual quality violations, calculated monthly, using an optimization technique to find an optimal discount percentage to be applied in the TUSD Wire B tariff that maximizes the revenue/reimbursement ratio.
The interruptible tariff calculation process will be based on the violations of the continuity indicators that exceed the regulatory standard, i.e., the excess portion of standard indicators and not the current regulatory form presented in expressions (4), (5), or (6). In this formulation, ANEEL determines that the value of the violated indicators to be considered for reimbursement will be the full value for the violation, that is, the standard value plus the excess.
The premise considered in the proposal discussed in this study is that the tariff discount calculated for the consumer should be compared with the compensation related to the portion of the indicator violation without adding the portion related to standard indicators. The standard indicators, theoretically, according to what is established by the regulatory agency, represent the ideal level of quality balance between the costs incurred by the power utility for the service quality level and the cost of production losses for consumers due to interruptions.
The granting of discounts in the tariffs consequently reduces the revenue level of the power utility but on the other hand reduces expenses by not granting the reimbursement calculated for violations of individual indicators.
The solution to the problem is to find a discount percentage that maintains the balance between the revenue obtained from billing with the discount to be granted and the reimbursement for the indicator violations. To find the discount level, an equation is proposed that seeks to optimize the balance between revenue from billing through the EUSDB and the expense generated by the financial compensation calculated due to the violation of quality indicators.
Figure 3 illustrates the balance between the revenue (EUSDB) and expense (financial compensation) of the variables involved in the optimization process.
The mathematical problem to be solved, formulated in Equation (9), of which the objective is to maximize the difference between revenue and expenses, is solved by finding the decision variables x 1 and x 2 , which represent, respectively, (i) the percentage discount to be applied to the EUSDB and (ii) the level of the financial compensation violation that is equivalent to the discount on the EUSDB.
M a x       E U S D B · 1 x 1 E U S D B · 1 x 1 · I A I P x 2 · k e i 1 730
Subject to the following constraints:
x 2 · E U S D B · 1 x 1 · k e i 1 730 C o m p
x 1 · E U S D B = x 2 · E U S D B · 1 x 1 · k e i 1 730
x 2 I A I P
0 x 1 P max %
where
  • EUSDB: Distribution System Use Charge for Wire B tariff.
  • IA: actual indicator value.
  • IP: indicator standard value.
  • Comp: value of financial compensation for violation of the standard indicator.
  • k e i 1 : weighting factor equal to 40 for medium voltage consumers.
  • 730: total monthly average hours.
  • Pmax (%): maximum percentage discount limit [0–100%].
In constraint (9a), it is established that the residual financial compensation calculated from variable x2, with the new real monetary base of EUSDB calculated with the application of discount x1, cannot exceed the value of the financial compensation relative to the violation of the standard indicator.
Constraint (9b) establishes the equilibrium that must be maintained between revenue and expenses, which means that the amount of the discount granted in the EUSDB must be equal to the residual financial compensation.
Constraint (9c) ensures that the value of the number of hours x2, equivalent to the discount in the EUSDB, cannot exceed the difference between the value of the actual indicator I A and the standard indicator I p .
Finally, constraint (9d) defines the discount interval of x1, allowing an upper limit P m a x % to be set, as long as it is less than 100%.
Figure 4 illustrates the optimization modeling to calculate the discount ( x 1 ) and the number of hours ( x 2 ) equivalent to the discount on the EUSDB, demonstrating the relationship between the EUSD Wire B and the level of compensation applied by the continuity indicators: measured, standard, and violated.
The proposed methodology begins with the calculation of financial compensation for each consumer unit that had its indicators violated, calculated according to the following expressions:
C o m p D I C = D I C V D I C p · E U S D B 730 · k e i 1
C o m p D M I C = D M I C V D M I C p · E U S D B 730 · k e i 1
C o m p F I C = F I C V F I C p D I C p · E U S D B 730 · k e i 1
where
  • DICV: duration of interruption verified.
  • DICp: continuity limit for interruption duration indicator.
  • DMICV: maximum duration of continuous interruption verified.
  • FICV: interruption frequency verified.
  • FICp: continuity limit for interruption frequency indicator.
  • EUSDB: base monetary value in the compensation calculation, corresponding to the Distribution System Use Charge related to the TUSD Wire B component.
  • 730: average number of hours in a month.
  • k e i 1 : weighting factor of 40 for consumers in medium voltage.
The financial compensation amounts calculated through Equations (10)–(12) differ from Equations (6)–(8) in terms of the values of the continuity indicator violations. In the methodology proposed in this study, only the values of the violations above the standard limits are considered and not the total values reported as established by the current rules set by ANEEL [1].
The reason for not considering the total values according to ANEEL’s current methodology is that the regulatory standard limits theoretically represent the optimal quality level (OQL), which is the balance point between the consumers’ costs and the company’s costs to maintain the established regulatory quality level.
The concept of OQL is illustrated in Figure 5, which corresponds to the minimum of the total cost curve, which is the sum of the power utility’s cost curve and the consumer’s cost curve. It can be observed that as the power utility does not maintain an investment level compatible with the OQL, the consumer perceives an increase in its costs and, consequently, a worsening in the quality level. Conversely, if the concessionaire makes investments, it improves the quality level, and the consumer perceives a reduction in production costs.
The solution to the optimization problem proposed is to find the discount percentage ( x 1 , %) in the EUSDB and the interruption duration ( x 2 , hours) that equals the compensation with the EUSDB discount, as described in the optimization modeling Equations (9). To solve the problem, a Python programming algorithm was developed using the Pyomo framework (Pyomo is a Python-based open-source software package that supports a diverse set of optimization capabilities for formulating, solving, and analyzing optimization models) and the Scipampl solver for nonlinear programming problem solving.
The continuity indicator records that will compose the problem variables are
  • The monetary value of the Distribution System Use Charge—EUSDB—related to the application of the Distribution System Use Tariff—TUSD Wire B. This monetary base is the result of the consumer’s billing, calculated from the peak demand volume [kW] and multiplied by the TUSD Wire B tariff (R$/kW), as presented in Table 2.
  • Violations of continuity indicators during the period: DIC, FIC, or DMIC.
  • The standard indicators: DIC, FIC, and DMIC regulatory limits.
Taking expressions (10)–(12), which formulate the calculation of the initial financial compensation regarding violations exceeding the standard indicator values, and rearranging them as presented in the equations below, the ratio 730/ k e i 1 can be interpreted as a base value of hours of the relationship between financial compensation and E U S D B .
C o m p _ I n i = V I V B · E U S D B
V I = I A I P
V B = 730 k e i 1
where
  • VI: violation of indicators.
  • Comp_Ini: initial financial compensation.
  • VB: base violation.
  • IA: measured indicator.
  • IP: standard indicator (target), regulatory limit.
  • 730: average number of hours per month.
The parameter k e i 1 is a weighting factor arbitrarily established by ANEEL [1], and in this case study, as the consumers served at medium voltage (MV) are being analyzed, this factor is equal to 40. Therefore, the base value of the VB violation is equal to 18.25 h.
When the violation values of the indicators V I are greater than the base violation VB, this implies compensation values greater than EUSDB, which represents an expense higher than the revenue, and when V I is less than V B , this implies a reimbursement level lower than EUSDB.
After the optimization process, which found the solution variables x1 and x2 of the optimization problem, the discounts (x1) are applied to the TUSD Wire B, interruptible tariff (16), to recalculate the EUSDB.
I n t e r r u p t i b l e   T a r i f f = T U S D · 1 x 1
The resulting difference between the financial compensation and the EUSDB represents a gain (unrealized expense) and can constitute the investment fund for the power utility to apply towards service quality improvements. When the value of the violation of the indicators V I is greater than V B , normally when the value of the financial compensation is greater than the EUSDB, there will be a residual financial compensation, which can also contribute to the investment fund. The investment fund resulting from these gains and residual compensation calculations becomes a regulatory commitment by the power utility with the regulatory agency for the specific investment in service quality improvements.
The steps of the methodology proposed in this study are presented below, based on the violation records of the respective quality indicators, from which the discount ( x 1 %) and the violation ( x 2 h) will be calculated to equate the compensation to the discount applied to the EUSDB:
  • Initially, calculate the initial financial compensation ( C o m p _ I n i c i a l ) according to expressions (10)–(12).
  • Perform the optimization process based on the objective function in expression 9 and the respective constraints (9a)–(9d).
  • With the values of x1 and x2 obtained from the optimization process, calculate the discount on the EUSDB by applying the interruptible tariff according to the following expression (17):
    D i s c o u n t _ E U S D B = E U S D B · x 1
  • Check for residual compensation in cases where V B   > V I , using the following expression (18):
    C o m p _ R e s = I A I P x 2 · E U S D B · 1 x 1 · k e i 1 730
  • Finally, calculate the gain, which represents the difference between the initial compensation with the discount values in the EUSDB and the residual compensation, according to expression (19)
    G a i n = C o m p _ I n i D i s c o u n t _ E U S D B C o m p _ R e s
  • Form an investment fund for quality improvement applications formed by the gain and the residual compensation.
The flowchart in Figure 6 illustrates the systematic solution of the optimization problem with indications of discounts granted to the EUSDB and the proposal formation of the investment fund for application in service quality improvements.

4. Case Study

In the southern region of Brazil, in the concession area of the RGE Sul power utility, highlighted in red in Figure 7, there is a group of about 1362 consumers focused on the cultivation of irrigated rice in the agricultural sector [25,26]. These consumers use the distribution networks to supply their loads for the irrigation of this crop during the period between October and March.

4.1. Energy Consumption Characteristics

These consumers have a strong seasonal consumption characteristic, imposing a high demand on energy grids during the planting period and remaining practical during the other months of the year, as observed in the energy consumption recorded in 2020, shown in the graph in Figure 8.
Another predominant characteristic of these consumers is that the vast majority of them are charged by the Seasonal Green Time-of-Use Tariff (THS Verde) and have a strong hourly peak modulation, as illustrated in the typical load curve of Figure 9.

4.2. Process of Rice Cultivation

Irrigated rice cultivation in southern Brazil is characterized mainly by the need for water pumping systems for crop irrigation. This type of crop depends fundamentally on maintaining a water layer over the crops from the beginning of planting until a few weeks before harvest. This process of water pumping (hydraulic lifting) over the crops is carried out by means of electric motors. According to [27], irrigating consumers in RGE Sul’s concession area use three-phase induction motors with typical power ratings between 50 and 300 hp, with practically continuous operation, and most consumers are concerned with avoiding peak hours due to higher energy tariffs.
According to technical research recommendations for southern Brazil [28], to meet the water needs for rice irrigation, an average water volume of 6,000–12,000 cubic meters per hectare (flow rate of 0.70 to 1.75 L/s.ha) is estimated for an average irrigation period of 80 to 100 days. Considering this average flow rate, it is estimated that a constant flow rate of 19 to 21 h per day is required, which implies the need to keep the water pumping system operating for at least this daily time period. This demonstrates the usage profile of distribution networks by irrigating consumers who apply their load modulation (demand reduction) in the contracted peak periods for 3 h per day and keep their equipment (motors) running to maintain the water flow necessary for cultivation for the rest of the time, as observed in the profile presented in Figure 9.
Another striking characteristic of these rural consumers is that they have subsidized tariff incentives for their pumping installations to operate at special hours (interval between 21:30 and 6:00), with discount percentages ranging from 70% to 90% of the values of the Energy Tariff (TE) and the Distribution System Usage Tariff (TUSD) for the green modality [24].

4.3. Characteristics of Energy Supply Networks

The location of these consumers is in a region that recorded high monthly strong wind frequencies from 1991 to 2012 [29], as illustrated in the graph in Figure 10. This graph shows a high incidence of winds during the rice crop planting period, from October to March.
Furthermore, these consumers are supplied by overhead medium voltage (23 kV) distribution networks, totaling approximately 25,000 km in length, highlighted in blue in Figure 11, subject to weather conditions and adverse conditions, and distributed in an area around 46,000 km2. Consequently, this exposure of the networks to weather adversities and the characteristic location of these consumers in dispersed areas require a service structure on the part of the power utility in the execution of network interruption occurrences that meets the standard goals of the continuity indicators.

4.4. Quality of Service

Regarding the quality of services with regard to continuity of energy supply for this group of consumers, 6173 occurrences were recorded that resulted in violations of the DIC, FIC, and DMIC continuity indicators in the period from 2018 to 2021, as illustrated in the graphs presented in Figure 12.
This number of registered violations in this period for this set of irrigating consumers resulted in a total amount of financial compensation, illustrated in Figure 13, calculated by expressions (10)–(12), according to the respective violated indicator, considering only the value of the limit of the established regulatory standard indicator.

5. Application of the Proposed Methodology in the Case Study

The compensation mechanism methodology proposed in Section 2 of this study was applied, and the calculations of the optimization problem were performed based on the continuity indicator records for the set of irrigating consumers in the case study.
The application of the methodology will be presented below for a sample of consumers who had indicator transgressions registered in January 2019, which was the period with the highest volume of indicator transgressions and financial compensation paid to consumers, as illustrated in Figure 12 and Figure 13, respectively.
The methodology results will be analyzed for two indicator violation situations:
  • Indicator violation less than the base violation: V I < V B ;
  • Indicator violation greater than or equal to the base violation: V I V B .

5.1. Indicator Violation Less Than the Base Violation (VI < VB)

Table 3 presents the indicator records for a sample of 30 consumers, informing (i) the classification of transgressions by the type of continuity indicators violated as the DIC, FIC, or DMIC; (ii) the intensity measured in hours of the calculated indicators; (iii) the DIC, FIC, and DMIC standard limit values; and (iv) the EUSDB monetary base. These parameters are basic information used in the application of the proposed methodology to determine the discount percentage for each consumer who had their continuity indicators violated.
Following the flowchart shown in Figure 6,
  • (i): First, calculate the value of the financial compensation according to expressions (10), (11), or (12).
  • (ii): Then, solve the optimization problem to calculate the decision variables x 1 and x 2 .
  • (iii): Then, calculate the EUSDB discount.
  • (iv): Finally, calculate the gain.
The results calculated for the consumer violation records contained in Table 3 are presented in Table 4.
Note that the values calculated for x 2 are equal to the value of the standard indicator violation, indicating that all financial compensation was made with the discount granted in the EUSDB, and there is no calculation of residual compensation. This mechanism translates into a trade-off between the financial compensation due and the discount granted in the EUSDB.
When analyzing the correlation between the variables x 1 and x 2 , a non-linear correlation is observed, as demonstrated in the graph of Figure 14, defined by a third-degree polynomial function with a correlation of R = 0.9999.

5.2. Indicators Violation Greater or Equal to the Base Violation (VI ≥ VB)

Table 5 presents information about indicator records for a sample of 15 consumers and contains indicator violations greater than or equal to the base violation VB equal to 18.25 h.
Table 6 presents the results of the methodology applied to consumers with indicator violations greater than or equal to the base violation V B .
In the results presented in Table 6, it is observed that x 2 was limited to 18.25 h, the same as VB, because this limit condition is due to the premise established in the constraints of the optimization problem, which considers that the discount value in the EUSDB must be equivalent to the financial compensation value.
The VB relation is the constraint that defines the solution space, where it is established that the discount to be granted in the EUSDB must be, at most, equal to the level of the financial compensation. In this case, where VI > VB, the value of the EUSDB (revenue) is lower than the value of the financial compensation (expense), configuring a situation of financial imbalance. Thus, the discount x 1 is limited to 50%, and, in this case, there will be a calculation of residual compensation that is proposed to compose the investment fund.
The 50% limiting percentage is derived from constraint (9b):
x 1 · E · U S D B = x 2 · E U S D B · 1 x 1 · 40 730
Making X 2 equal to V B and simplifying this equation, we arrive at the following relationship:
x 1 = 730 40 · 1 x 1 · 40 730
Simplifying this expression, we get x1 = (1 − x1); therefore, x1 = 0.5 or 50%.
The optimization model applied in the proposed methodology allows changing the discount limit parameter to percentage values lower than 50%. Thus, it is possible to establish another discount limit percentage that has different assumptions than those established by the problem constraints.
For example, a maximum percentage (Pmax) could be defined as the ratio between (i) the sum of the monetary value that would be paid if the compensation was calculated exactly by the regulatory limit value and (ii) the sum of the EUSDB of the irrigating consumers in the case study period from 2018 to 2021, according to the expression (20) below.
P m a x   ( % ) = j = 1 , n i = 1 , U C E U S D B i , j I p i , j k e i 1 730 j = n i = 1 , U C E U S D B ( i , j )
where
  • i: irrigating consumers who had violated indicators.
  • UC: number of consumers who had violated indicators in the period.
  • j: years of the previous Tariff Review cycle.
  • n: period from 2018 to 2021.
  • EUSDB: Distribution System Use Charge related to TUSD Wire B.
  • Ip: standard indicator (regulatory limit).
  • k e i 1 : increase coefficient (DIC, FIC, and DMIC), which is 40. for the MT consumer unit.
  • 730: hours per month.
This relationship calculated for the historical base for the case study period 2018 to 2021 results in an average percentage value around 24%, as shown in Table 7, where
P m a x   % = 14,634,866 11,796,505 = 24.06 %
The values of financial compensation termed “Violated Indicators” are calculated considering only the excess of the standard indicators, while the values of compensation termed “Target” are calculated considering the limit values of the standard indicators. The premise considered in this proposal for the compensation mechanism for violations is based on the idea that the discount to be granted is related to the level of financial compensation over the values of indicators that exceed the standard indicators. It is understood that the standard indicators are the quality levels established by regulatory agencies and, therefore, theoretically represent the balance between the costs to the power utility and maintaining acceptable levels for consumers. The application of the proposed methodology with continuity indicator violation records for users presented in Section 4.1 and Section 4.2, considering Pmax = 24%, resulted in discount values ( x 1 %) and ( x 2 hours), as shown in Table 8.
When applying a discount limit lower than 50%, in the example case of 24%, the base value of VB decreases from 18.25 to 5.76 h. For this lower percentage level, there is a reduction in the EUSDB discount, but on the other hand, there is an increase in Residual Compensations and in the value of the Quality Investment Fund. Table 9 presents a summary of these values considering the two consumer discount limit scenarios.
Extending to all 6134 quality indicator violation records in the case study, registered from 2018 to 2021, for 1362 irrigating consumers, the application of the proposed methodology results in the following EUSDB discount and investment fund formation values, presented in Table 10.
The application of the proposed interruptible tariff compensation mechanism in the case of consumers who experienced violations in their quality indicators due to unplanned interruptions would result in the compensation of R$ 3,517,743.12 through discounts on the EUSDB. The difference between the financial compensation due to violations of quality indicators and the EUSDB discount would form an investment fund, which the power utility would commit to using for specific investments to improve the quality of service for these consumers.

6. Conclusions

The traditional approach to compensation for service quality requirement violations applied by the regulatory agency ANEEL is not always effective when applied to consumers in dispersed areas with high seasonal consumption, as the costs associated with repair and restoration of service can be significantly higher than those for consumers in urban areas. In addition, the economic impact on the power utilities is very significant due to the dependence on seasonal activities and serving dispersed areas, which is the specific case for irrigating consumers and which can make system recovery difficult during long periods without energy.
The alternative approach presented in this study is a more flexible compensation mechanism that takes into account the characteristic circumstances of dealing with interruptions in dispersed areas with high seasonal consumption. Furthermore, this methodology proposes the formation of a supply quality investment fund, rather than relying solely on financial compensation, providing the power utility with the ability to invest in infrastructure to better serve dispersed areas with seasonal consumption, which are vulnerable to violations of service quality indicators.
The proposed methodology for compensating violations of quality indicators is based on a trade-off between financial compensation for violations of standard quality indicators and EUSDB discounts. The difference between financial compensation and EUSDB discounts, as well as residual compensation, would form an investment fund to promote improved quality of service. This methodology presents an alternative way to reimburse consumers for violations of quality indicators due to unplanned interruptions and encourage the formation of an investment fund that promotes improvement in the quality of energy supply for their productive activities.
The financial compensation credited to consumers on their monthly energy consumption bills does not reflect a real perception of dissatisfaction with the quality of service. It is difficult to measure whether these compensation amounts effectively recover production costs arising from power interruptions. On the other hand, specific investments by the power utility to improve quality are likely to reduce the duration of interruptions and, consequently, improve consumer productivity. Therefore, this compensation mechanism provides a regulatory signal that incentivizes the power utility to improve the quality of service provided.

Author Contributions

Conceptualization, J.A.d.B., D.P.B., V.J.G., S.A.B., S.M.K.B. and A.C.A.P.; supervision, D.P.B. and V.J.G.; methodology, J.A.d.B., V.J.G., H.S.E., D.W.S., L.M.C., R.L.B.G. and A.C.A.P.; software, J.A.d.B.; validation, J.A.d.B., S.A.B., S.M.K.B. and A.C.A.P.; formal analysis, J.A.d.B.; investigation, J.A.d.B.; resources, J.A.d.B.; data curation, J.A.d.B.; writing—original draft preparation, J.A.d.B.; writing—review and editing, J.A.d.B. and H.S.E.; visualization, D.P.B., V.J.G., H.S.E., D.W.S., L.M.C., R.L.B.G. and A.C.A.P.; project administration, L.M.C.; funding acquisition, D.P.B. and V.J.G. All authors have read and agreed to the published version of the manuscript.

Funding

This research was funded by CPFL Energia, through the project “PA3077—Study and proposal of alternative methodology on tariff mechanisms and electric energy compensation for transgression of service quality limits in dispersed and seasonal areas”, developed under the ANEEL RD Program PD-00396-3077/2021 and financed in part by the Coordenação de Aperfeiçoa-mento de Pessoal de Nível Superior–Brazil (CAPES)–Finance Code 001.

Data Availability Statement

Not applicable.

Acknowledgments

The authors are grateful for the technical and financial support of CPFL Energia in the project “PA3077—Study and proposal of alternative methodology on tariff mechanisms and electric energy compensation for transgression of service quality limits in dispersed and seasonal areas.”, a Research & Development Project ANEEL (Agência Nacional de Energia Elétrica). The authors would also like to thank Coordenação de Aperfeiçoamento de Pessoal de Nível Superior –Brazil (CAPES) and Instituto de Engenharia de Sistemas e Computadores Tecnologia e Ciência—Pesquisa e Desenvolvimento—Brazil (INESC P&D Brasil) for partial funding and to Siglasul Regulatory Consulting for technical support.

Conflicts of Interest

The authors declare no conflict of interest.

Abbreviations

The following abbreviations and nomenclatures are used in this manuscript:
ANEELAgência Nacional de Energia Elétrica
CcTotal number of billed consumer units in the set for the calculation period
CDEConta de Desenvolvimento Energético
CPFLCompanhia Paulista de Força e Luz
DECDuração Equivalente de Interrupção por consumidor
DICDuração de Interrupção Individual
DICpContinuity limit for the interruption duration indicator;
DICVVerified interruption duration
DMICDuração Máxima de Interrupção Contínua
ERSEEntidade Reguladora dos Serviços Energéticos
EUSDEncargo de Uso do Sistema de Distribuição
EUSDBEncargo de Uso do Sistema de Distribuição—Fio B
FECFrequencia Equivalente de Interrupção por consumidor
FICFrequencia de Interrupção Individual
FICpContinuity limit for the interruption frequency indicator
FICVVerified interruption frequency
IBDRIncentive-based demand response
iIndex of billed consumer units in the set
I A Measured indicator, in hours
I P Standard indicator, in hours
k e i 1 Weighting factor
kWhkilowatt-hour
kWkilowatt
MUSDMontante de Uso do Sistema de Distribuição
LVLow voltage
MVMedium voltage
nNumber of interruptions for the individual consumer
ONSOperador Nacional dos Sistema Elétrico Brasileiro
OQLOptimal quality level
PBDRPrice-based Demand Response
Pmax (%)Maximum percentage discount limit
P&D_EEPesquisa e Desenvolvimento e Eficiência Energética
PROINFAPrograma de Incentivo às Fontes Alternativas de Energia Elétrica
PRODISTProcedimentos de Distribuição de Energia Elétrica no Sistema Elétrico Nacional
PRORETProcedimentos de Regulação Tarifária Elétrica no Sistema Elétrico Nacional
R$Real, Brasilian monetary unit
RGE SulRio Grande Energia Sul
TETarifa de Energia
THS VerdeGreen Seasonal Time-of-Use Tariff
t(i)Duration time of interruption (i) for the individual consumer, in hours
t(i)maxTime of the maximum duration of continuous interruption (i), in hours
SAIDISystem Average Interruption Duration Index
SAIFISystem Average Interruption Frequency Index
SINSistema Interligado Nacional
TFSEETaxa de Fiscalização de Serviços de Energia Elétrica
TUSDTarifa de Uso do Sistema de Distribuição
VBViolation base
VIViolation of indicators
x 1 Discount to be applied on EUSDB, in percent
x 2 Violation of financial compensation that equals the discount on EUSDB, in hours

References

  1. ANEEL: PRODIST Módulo 8-Qualidade do Fornecimento de Energia Elétrica. Available online: https://www2.aneel.gov.br/cedoc/aren2021956_2_7.pdf (accessed on 24 September 2022).
  2. Białkowski, M.; Szetela, B. Discount as an Example of a Guarantee Instrument in the Field of the Consumer’s Right to Energy of an Adequate Quality. Energies 2023, 16, 1559. [Google Scholar] [CrossRef]
  3. Ellman, D.; Xiao, Y. Incentives to Manipulate Demand Response Baselines with Uncertain Event Schedules. IEEE Trans. Smart Grid 2021, 12, 1358–1369. [Google Scholar] [CrossRef]
  4. Schmitt, K.; Bhatta, R.; Chamana, M.; Murshed, M.; Osman, I.; Bayne, S.; Canha, L. A Review on Active Customers Participation in Smart Grids. J. Mod. Power Syst. Clean Energy 2023, 11, 3–16. [Google Scholar] [CrossRef]
  5. Inês, C.; Guilherme, P.L.; Esther, M.G.; Swantje, G.; Stephen, H.; Lars, H. Regulatory Challenges and Opportunities for Collective Renewable Energy Prosumers in the EU. Energy Policy 2020, 138, 111212. [Google Scholar] [CrossRef]
  6. Scheller, F.; Krone, J.; Kühne, S.; Bruckner, T. Provoking Residential Demand Response Through Variable Electricity Tariffs–A Model-Based Assessment for Municipal Energy Utilities. Technol. Econ. Smart Grids Sustain. Energy 2018, 3, 7. [Google Scholar] [CrossRef] [Green Version]
  7. Venizelou, V.; Philippou, N.; Hadjipanayi, M.; Makrides, G.; Efthymiou, V.; Georghiou, G.E. Development of a Novel Time-of-Use Tariff Algorithm for Residential Prosumer Price-Based Demand Side Management. Energy 2018, 142, 633–646. [Google Scholar] [CrossRef]
  8. Fraija, A.; Agbossou, K.; Henao, N.; Kelouwani, S.; Fournier, M.; Hosseini, S.S. A Discount-Based Time-of-Use Electricity Pricing Strategy for Demand Response with Minimum Information Using Reinforcement Learning. IEEE Access 2022, 10, 54018–54028. [Google Scholar] [CrossRef]
  9. Xue, W.; Zhao, X.; Li, Y.; Mu, Y.; Tan, H.; Jia, Y.; Wang, X.; Zhao, H.; Zhao, Y. Research on the Optimal Design of Seasonal Time-of-Use Tariff Based on the Price Elasticity of Electricity Demand. Energies 2023, 16, 1625. [Google Scholar] [CrossRef]
  10. Pandey, V.C.; Gupta, N.; Niazi, K.R.; Swarnkar, A.; Thokar, R.A. An Adaptive Demand Response Framework Using Price Elasticity Model in Distribution Networks. Electr. Power Syst. Res. 2022, 202, 107597. [Google Scholar] [CrossRef]
  11. Aalami, H.A.; Moghaddam, M.P.; Yousefi, G.R. Modeling and Prioritizing Demand Response Programs in Power Markets. Electr. Power Syst. Res. 2010, 80, 426–435. [Google Scholar] [CrossRef]
  12. Moghaddam, M.P.; Abdollahi, A.; Rashidinejad, M. Flexible Demand Response Programs Modeling in Competitive Electricity Markets. Appl. Energy 2011, 88, 3257–3269. [Google Scholar] [CrossRef]
  13. Gellings, C.W.; Chamberlin, J.H. Demand-Side Management: Concepts and Methods; PennWell Publishing Company: Tulsa, OK, USA, 1993. [Google Scholar]
  14. Sharifi, R.; Fathi, S.H.; Vahidinasab, V. A review on Demand-side tools in electricity market, Renew. Sustain. Energy Rev. 2017, 72, 565–572. [Google Scholar] [CrossRef]
  15. Nikzad, M.; Mozafari, B. Reliability Assessment of Incentive- and Priced-Based Demand Response Programs in Restructured Power Systems. Int. J. Electr. Power Energy Syst. 2014, 56, 83–96. [Google Scholar] [CrossRef]
  16. ERSE: Relatório Da Qualidade De Serviço Do Setor Elétrico. Available online: https://www.erse.pt/media/lgepvosb/relatorio_rqs-se-2016.pdf (accessed on 25 November 2022).
  17. ERSE: Atualização da Tarifa de Energia do Setor Elétrico. Available online: https://www.erse.pt/media/re4l30ps/atualiza%C3%A7%C3%A3o-tenergia-se-2022-t4.pdf (accessed on 25 November 2022).
  18. SCE: Agricultural and Pumping Interruptible Program (AP-I). Available online: https://www.sce.com/sites/default/files/2019-07/AP-I%20Fact%20Sheet%200519%20r4_WCAG%20final_2.pdf (accessed on 26 January 2023).
  19. SCE: Rate Schedule Tou-Pa-3 for Agricultural & Paumping Service Customers. Available online: https://www.sce.com/sites/default/files/inline-files/TOU-PA-3%20Rate%20Fact%20Sheet_WCAG.pdf (accessed on 26 January 2023).
  20. IEEE Std. 1366-2012; IEEE Guide for Electric Power Distribution Reliability Indices. (Revision of IEEE Std. 1366-2003). IEEE Press: New York, NY, USA, 2012; pp. 1–43. [CrossRef]
  21. ANEEL: PRORET Módulo 7–Estrutura Tarifária das Concessionárias de Distribuição (Submódulo 7.2: Tarifas de Referência). Available online: https://www2.aneel.gov.br/cedoc/aren20231060_2_2.pdf (accessed on 15 November 2022).
  22. ANEEL: PRODIST Módulo 1–Glossário de Termos Técnicos do PRODIST. Available online: https://www2.aneel.gov.br/cedoc/aren2021956_2.pdf (accessed on 15 November 2022).
  23. ANEEL: PRORET Módulo 7–Estrutura Tarifária das Concessionárias de Distribuição (Submódulo 7.1: Procedimentos Gerais). Available online: https://www2.aneel.gov.br/cedoc/aren20231060_2_1.pdf (accessed on 15 November 2022).
  24. ANEEL: Resolução Normativa Nº 1000/2021–Regras de Prestação do Serviço Público de Distribuição de Energia Elétrica. Available online: https://www2.aneel.gov.br/cedoc/ren20211000.pdf (accessed on 15 November 2022).
  25. Paiva, E.M.C.D.; Heatwole, C.D.; Paiva, J.B.D.; Paiva, R.C.D.; Beling, F.A. Trends in Streamflow in the Ibicuí River Basin, Brazil: Influence of Rice Crop Irrigation. Trans. ASABE 2013, 56, 1371–1375. [Google Scholar]
  26. Pinto, V.M.; de Borja Reis, A.F.; de Melo, M.L.A.; Reichardt, K.; Santos, D.; de Jong van Lier, Q. Sustainable Irrigation Management in Tropical Lowland Rice in Brazil. Agric. Water Manag. 2023, 284, 108345. [Google Scholar] [CrossRef]
  27. Uberti, V.A. Lógica Fuzzy para Avaliação de Eficiência Energética em Sistemas de Irrigação de Lavouras de Arroz. Master’s Thesis, Universidade Federal de Santa Maria, Santa Maria, Brazil, 24 March 2017. [Google Scholar]
  28. SOSBAI: Arroz Irrigado–Recomendações Técnicas da Pesquisa para o Sul do Brasil. Available online: https://www.sosbai.com.br/uploads/documentos/recomendacoes-tecnicas-da-pesquisa-para-o-sul-do-brasil_906.pdf (accessed on 16 December 2021).
  29. CEPED UFSC: Atlas Brasileiro de Desastres Naturais 1991 a 2012. Available online: https://sosgisbr.files.wordpress.com/2018/02/brasil.pdf (accessed on 16 December 2021).
Figure 1. Cost Functions and Tariff Components of TUSD.
Energies 16 05588 g001
Figure 2. The vicious cycle promoted by financial compensation.
Energies 16 05588 g002
Figure 3. Balance between Revenue (EUSDB) and Expenses due to Financial Compensation.
Energies 16 05588 g003
Figure 4. Objective Function Modeling.
Energies 16 05588 g004
Figure 5. Optimal Level of Quality—Consumer Cost Curve versus Company Cost Curve.
Energies 16 05588 g005
Figure 6. Flowchart of Proposed Methodology.
Energies 16 05588 g006
Figure 7. RGE Sul’s concession area, highlighting irrigating consumers.
Energies 16 05588 g007
Figure 8. Seasonal Consumption of Rural Irrigators.
Energies 16 05588 g008
Figure 9. Typical Load Shape of Rural Irrigation Consumers.
Energies 16 05588 g009
Figure 10. Monthly frequency of records of windstorms in the state of Rio Grande do Sul, from 1991 to 2012.
Energies 16 05588 g010
Figure 11. Medium voltage (MV) networks in RGE Sul’s concession area, with networks that serve irrigating consumers highlighted in blue.
Energies 16 05588 g011
Figure 12. Transgressions of Continuity Indicators for Rural Irrigation Consumers, period from 2018 to 2021, for indicators (a) DIC, (b) FIC, and (c) DMIC.
Energies 16 05588 g012
Figure 13. Amount of Financial Compensation for Violations of the DIC, FIC, and DMIC Continuity Indicators.
Energies 16 05588 g013
Figure 14. Correlation between discount x 1   (%) with x 2   (hours) for VI < VB. Note that for values greater than VB, which is equal to 18.25 h, the calculated discount x 1 saturates at 50%. This situation will be presented below for the consumers who experienced violations of the indicators greater than or equal to VB.
Energies 16 05588 g014
Table 1. Correspondence between Brazilian and International Indices.
Indicators
Brazilian Indices
Indicators
IEEE Std 1366 (2003)
Equation
DECSAIDI S A I D I = r i . N i N T
FECSAIFI S A I F I = N i N T
where i:denotes an interruption event. ri: restoration time for each interruption event. Ni: number of interrupted customers for each sustained interruption event during the reporting period. NT: total number of customers served for the areas. SAIDI and SAIFI are defined in the international standard IEEE 1366.
Table 2. Irrigation Consumer’s Energy Bill—A4 Green Horosazonal Tariff.
Energy Demand and
Consumption
Quantity
Registered
Non-Tax TariffDiscountsDiscounted Revenue
TUSD
(R$/kW)
TUSD
(R$/MWh)
TE
(R$/MWh)
1. Contracted Demand (kW)190.00-----
2. Billed Demand (kW)194.0022.87--6.00%R$4084.59
3. Demand Exceeded (kW)4.4045.47--6.00%R$189.18
4. Energy consumption for peak TUSD (kWh)6236.00-907.62-6.00%R$5302.32
5. Energy consumption for off-peak TUSD (kWh)39,588.00-85.77-6.00%R$3191.73
6. Energy consumption for reserved hourly interval TUSD (kWh)28,788.00-85.77-70.00%R$740.74
7. Energy consumption for peak TE (kWh)6236.00--435.596.00%R$2533.36
8. Energy consumption for off-peak TE (kWh)39,588.00--259.966.00%R$9673.82
9. Energy consumption for reserved hourly interval TE (kWh)28,788.00--259.9670.00%R$2245.12
Total—Irrigation Consumer’s Energy BillR$27,998.86
It is noteworthy that irrigating consumers belong to the rural class and the rural agricultural subclass (water pumping service intended for irrigation activity), and because they are included in these two categories, these customers can receive two discount schemes (benefits) in their tariffs [24].
Table 3. Records of violated indicators: VI < VB.
ConsumerViolated
Indicator
EUSDB
[R$]
Accurate
Indicator
(IA)
[h]
DIC
Limit
(DICP)
[h]
FIC
Limit
(FICP)
DMIC
Limit
(DMICP)
[h]
UC545DMIC1695.6711.9913.05.010.0
UC2DIC829.4928.2219.05.014.0
UC3DIC1020.3433.3019.05.014.0
UC546DIC425.0631.0828.07.020.0
UC1066DMIC1758.7828.1828.07.020.0
UC1068DMIC1202.4528.1828.07.020.0
UC10DIC3429.1133.8328.07.020.0
UC1310DMIC1968.5628.8628.07.020.0
UC1311DMIC305.9528.8628.07.020.0
UC1337DMIC2681.2828.8628.07.020.0
UC1070DMIC1792.8628.1828.07.020.0
UC749DMIC4055.8532.1128.07.020.0
UC757DMIC658.7424.3528.07.020.0
UC761DMIC1348.1924.3528.07.020.0
UC762DMIC223.1124.3528.07.020.0
UC763DMIC4935.0524.3528.07.020.0
UC18DMIC332.5726.6828.07.020.0
UC19DMIC760.6226.6828.07.020.0
UC20DMIC324.3826.6828.07.020.0
UC21DMIC377.1320.7228.07.020.0
UC34DMIC1728.2120.7228.07.020.0
UC37DIC5578.9837.1319.05.014.0
UC566DMIC16.4823.2028.07.020.0
UC41DIC15,291.4528.6319.05.014.0
UC48DIC1362.9540.7828.07.020.0
UC49DIC1375.6040.7828.07.020.0
UC50DIC1831.4640.7828.07.020.0
UC66DIC497.6043.3128.07.020.0
UC781DMIC3021.9626.1528.07.020.0
UC785DMIC1547.2632.1128.07.020.0
Table 4. Results of the Proposed Methodology: VI < VB.
ConsumerInitial
Compensation
(Comp_Ini)
[R$]
x1
[%]
x2
[h]
Violation of the
Standard
Indicator
(VI)
[h]
Residual
Compensation
(Comp_Res)
[R$]
Quality
Investment
Fund
(Gain)
[R$]
Discount
on
EUSDB
[R$]
UC545184.909.8%1.991.990.0018.18166.72
UC2419.0633.6%9.229.220.00140.65278.41
UC3799.5043.9%14.3014.300.00351.24448.26
UC54671.7414.4%3.083.080.0010.3661.38
UC1066788.3230.9%8.188.180.00243.98544.34
UC1068538.9630.9%8.188.180.00166.81372.15
UC101095.4424.2%5.835.830.00265.22830.22
UC1310955.7032.7%8.868.860.00312.34643.36
UC1311148.5332.7%8.868.860.0048.5499.99
UC13371301.7032.7%8.868.860.00425.42876.29
UC1070803.5930.9%8.188.180.00248.71554.88
UC7492691.3139.9%12.1112.110.001073.511617.80
UC757157.0219.2%4.354.350.0030.22126.79
UC761321.3519.2%4.354.350.0061.85259.50
UC76253.1819.2%4.354.350.0010.2442.94
UC7631176.3019.2%4.354.350.00226.41949.89
UC18121.7326.8%6.686.680.0032.6289.11
UC19278.4126.8%6.686.680.0074.60203.81
UC20118.7326.8%6.686.680.0031.8186.92
UC2114.883.8%0.720.720.000.5614.31
UC3468.183.8%0.720.720.002.5965.59
UC375542.2949.8%18.1318.130.002762.012780.29
UC5662.8914.9%3.203.200.000.432.46
UC418068.8634.5%9.639.630.002787.065281.80
UC48954.4441.2%12.7812.780.00393.09561.34
UC49963.2941.2%12.7812.780.00396.74566.55
UC501282.5241.2%12.7812.780.00528.22754.30
UC66417.4445.6%15.3115.310.00190.44227.00
UC7811018.3625.2%6.156.150.00256.68761.68
UC7851026.7039.9%12.1112.110.00409.53617.17
Table 5. Records of violated indicators: VIVB.
ConsumerViolated
Indicator
EUSDB
[R$]
Accurate
Indicator
(IA)
[h]
DIC
Limit
(DICP)
[h]
FIC
Limit
(FICP)
DMIC
Limit
(DMICP)
[h]
UC1DMIC204.0937.9413.05.010.0
UC1064DIC1428.6054.8419.05.014.0
UC740DIC1413.16103.8719.05.014.0
UC13DIC4294.1059.0828.07.020.0
UC25DIC576.9062.6719.05.014.0
UC557DIC1665.1460.5528.07.020.0
UC562DIC2093.6060.5528.07.020.0
UC766DIC1318.4060.5528.07.020.0
UC1071DIC893.2183.8328.07.020.0
UC42DIC3623.8097.9028.07.020.0
UC567DIC5544.81194.9828.07.020.0
UC775DIC704.5770.7124.05.018.0
UC569DIC5836.5760.5528.07.020.0
UC54DIC234.2365.7224.05.018.0
UC60DMIC2437.3655.6428.07.020.0
Table 6. Results of the Proposed Methodology: VIVB.
ConsumerEUSDB [R$]Initial
Compensation
(Comp_Ini)
[R$]
x1
[%]
x2
[h]
Violation of the
Standard
Indicator
(VI)
[h]
Residual Compensation
(Comp_Res)
[R$]
Quality
Investment
Fund
(Gain)
[R$]
Discount
on
EUSDB
(Discount_EUSDB)
[R$]
UC1204.09312.4650.0%18.2527.9454.18156.23102.05
UC10641428.602805.5450.0%18.2535.84688.471402.77714.30
UC7401413.166571.7750.0%18.2584.872579.303285.88706.58
UC134294.107312.9150.0%18.2531.081509.413656.462147.05
UC25576.901380.4550.0%18.2543.67401.78690.23288.45
UC5571665.142969.8850.0%18.2532.55652.371484.94832.57
UC5622093.603734.0750.0%18.2532.55820.231867.041046.80
UC7661318.402351.4550.0%18.2532.55516.521175.73659.20
UC1071893.212732.4950.0%18.2555.83919.641366.24446.61
UC423623.8013,879.6350.0%18.2569.905127.926939.821811.90
UC5675544.8150,732.6950.0%18.25166.9822,593.9425,366.352772.40
UC775704.571803.3250.0%18.2546.71549.37901.66352.29
UC5695836.5710,409.8850.0%18.2532.552286.665204.942918.29
UC54234.23535.4550.0%18.2541.72150.61267.73117.11
UC602437.364759.8750.0%18.2535.641161.252379.941218.68
Table 7. Average discount percentage in the period 2018 to 2021.
YearFinancial Compensation (R$)EUSDB
(R$)
Target/
EUSDB
(%)
Violated IndicatorsTarget—Standard Indicators
DICFICDMICTotalDICFICDMICTotal
20181,134,43336,071361,4351,531,9401,682,270117,475838,9362,638,6811,983,37533.0%
20192,170,65154,802936,9453,162,3982,455,176206,6071,215,9273,877,7103,083,10725.8%
20201,377,83565,679733,0932,176,6062,288,012196,1171,453,5173,937,6453,372,93216.7%
20211,672,80886,620396,3432,155,7712,760,616350,2551,069,9584,180,8303,357,09024.5%
Total6,355,728243,1722,427,8169,026,7159,186,074870,4554,578,33814,634,86611,796,50524.06%
Table 8. Results of Proposed Methodology in Case Study, with discount limited to 24%.
Consumerx1
[%]
x2
[h]
Violation of the
Standard
Indicator
(VI)
[h]
Residual Compensation
(Comp_Res)
[R$]
Quality
Investment
Fund
(Gain)
[R$]
Discount on
EUSDB
(Discount_EUSDB)
[R$]
UC5459.8%1.991.990.0018.18166.72
UC224.0%5.769.22119.41100.58199.08
UC324.0%5.7614.30362.74191.88244.88
UC54614.4%3.083.080.0010.3661.38
UC106624.0%5.768.18177.02189.20422.11
UC106824.0%5.768.18121.02129.35288.59
UC1024.0%5.765.839.55262.90822.99
UC131024.0%5.768.86253.87229.37472.46
UC131124.0%5.768.8639.4635.6573.43
UC133724.0%5.768.86345.79312.41643.51
UC107024.0%5.768.18180.44192.86430.29
UC74924.0%5.7612.111071.99645.91973.40
UC75719.2%4.354.350.0030.22126.79
UC76119.2%4.354.350.0061.85259.50
UC76219.2%4.354.350.0010.2442.94
UC124.0%5.7627.94188.4974.9948.98
UC106424.0%5.7635.841789.35673.33342.86
UC74024.0%5.7684.874655.391577.22339.16
UC1324.0%5.7631.084527.231755.101030.58
UC2524.0%5.7643.67910.69331.31138.46
UC55724.0%5.7632.551857.47712.77399.63
UC56224.0%5.7632.552335.43896.18502.47
UC76624.0%5.7632.551470.69564.35316.42
UC107124.0%5.7655.831862.32655.80214.37
UC4224.0%5.7669.909678.813331.11869.71
UC56724.0%5.76166.9837,226.0912,175.851330.75
UC77524.0%5.7646.711201.43432.80169.10
UC56924.0%5.7632.556510.732498.371400.78
UC5424.0%5.7641.72350.73128.5156.21
UC6024.0%5.7635.643032.531142.37584.97
Table 9. Results of the Proposed Methodology in the Case Study, with discount limited to 24% and 50%.
Discount
Limit
EUSDB (R$)Financial
Compensation
(R$)
Residual
Financial
Compensation
(R$)
Quality
Investment
Fund
(R$)
Discount on
EUSDB
(R$)
50.0%135,634.54266,950.3981,153.83129,282.5856,513.97
24.0%135,634.54266,950.39171,509.5263,936.8331,504.04
Table 10. Results of the Methodology Proposed in the Case Study.
YearEUSDB
(R$)
Financial
Compensation (R$)
Residual
Compensation
(R$)
Quality
Investment
Fund
(R$)
Discount on
EUSDB
(R$)
20181,983,375.211,531,939.96251,759.37677,878.88602,301.72
20193,083,107.193,162,397.88698,209.141,454,722.001,009,466.74
20203,372,932.342,176,606.08246,475.95927,773.881,002,356.24
20213,357,090.472,155,771.07322,926.66929,225.99903,618.42
Total11,796,505.209,026,714.991,519,371.123,989,600.753,517,743.12
Disclaimer/Publisher’s Note: The statements, opinions and data contained in all publications are solely those of the individual author(s) and contributor(s) and not of MDPI and/or the editor(s). MDPI and/or the editor(s) disclaim responsibility for any injury to people or property resulting from any ideas, methods, instructions or products referred to in the content.

