Abstract
Climate change has highlighted the need to promote renewable energies. The offshore wind industry is growing exponentially because of some political strategies supported by various organizations, such as the European Union. The implementation of these strategies is commonly associated with significant investments, public acceptance, or achieving better installations and greater cumulative capacities. To ensure that offshore renewable energy projects could reach their ambitious targets, this study promotes the implementation of political strategies or planning decisions using data mining techniques and analytical tools. Strategic decisions based on real data analysis could help to achieve more suitable and optimal infrastructures. The scour phenomenon jeopardizes the operability of offshore wind farms, making it necessary to study its evolution over the years. In this work, extensive research on the scour phenomenon in offshore wind farms using real data (from the Lynn and Inner Dowsing offshore wind farms located in the UK) was performed, which revealed an evident lack of consideration of this phenomenon for data-driven decision-making processes. As a novelty, this research develops a detailed geospatial analysis of data, studying the possible autocorrelation of scour data measured from each turbine between 2011 and 2015. The conclusions obtained could be used to improve future planning tasks in offshore wind farms.
1. Introduction
Climate change is an unavoidable reality that requires actions to mitigate its impact in the short, medium, and long term [1]. In this sense, investing in renewable energies allows not only to reduce pollution, but also to take advantage of inexhaustible resources such as the sun, the wind, or the tides. Currently, the European Union (EU) aims to reach the European Green Deal energy and climate goals in an attempt to speed up the green transition and increase the application of renewable energies [2]. Aiming to achieve the ambitious climate and energy targets for 2030 and 2050, the Commission announced a dedicated EU strategy for offshore renewable energy [3] on 19 November 2020. The objectives to be achieved will include an installation capacity of at least 160 GW of offshore wind and 1 GW of ocean energy by 2030, and 300 GW of offshore wind and 40 GW of ocean energy by 2050. According to statistics published by the association WindEurope [4], the offshore installed capacity in Europe is about 28.4 GW up to now.
There are different studies focused on how the effects of climate change can affect maritime works or offshore wind farms, making it necessary to enhance the processes and the design of new structures [5]. To promote the innovation and the application of these emergent technologies, the use of data mining techniques has started to become common [6]. An example of this is the initiatives of some EU members, such as the Spanish government which created The Ministry of Economic Affairs and Digital Transformation (MINECO). It was created in 2020 as the public organ responsible for digital transformation and the development and promotion of artificial intelligence [7].
The automatization of multiple processes and data-driven decision-making are based on data analysis [8]. Some studies have performed literature reviews to assess the utilization of data for decision-making related to offshore wind farms. Examples of these are [9,10], which described the techniques from the field of big data analytics, and the implementation of data-driven decision-making oriented toward planning and maintenance processes. The authors of [11] proposed a data-driven, multi-objective predictive control-based system to increase power production and reduce fatigue loads.
Given the critical significance of the scour phenomenon in maintaining the stability and functionality of offshore wind farms, a thorough literature review focusing on decision-making related to this subject was conducted. However, no publication about the scour phenomenon and the design of scour protections, considering data-driven decision-making and/or data analytics, were found. Only a small group of publications, described below, consider the scour phenomenon as an important aspect to be considered; however, no research studied or analyzed this phenomenon and its implications. For example, the end-of-life decision-making for offshore wind turbines was studied by [12], and a multi-criteria decision-making framework for site selection of offshore wind farms was developed by [13].
Recognizing the significance of conducting an in-depth analysis of the scour phenomenon through a data-driven decision-making lens, this paper suggests an innovative data analysis method utilizing geospatial information.
The geospatial analysis considers the location of data. It should be noted that when a phenomenon is studied over time in the context of a particular location, it could be better understood why it happens, where, and when it does. Data mining and machine learning (ML) techniques allow us to obtain knowledge and useful information based on data analysis. For this, it is important to promote studies through the application of these techniques in order to make decisions or predict an outcome.
1.1. Data-Driven Decision-Making in Offshore Wind Farms
A total of six main areas of investigation were identified when considering the application of artificial intelligence (AI) for data-driven decision-making in offshore wind farms: (1) allision risk assessment, (2) adequacy studies, (3) predictive maintenance, (4) wind energy and output power forecasting, (5) wind turbine flow field prediction, and (6) water area path planning.
Conducting an intensive literature review about the use of artificial intelligence techniques and analytical tools, numerous studies published in the last decade were detected. A review with a detailed evaluation of investment, regulation, and skills development required to support the adoption of robotics and artificial intelligence in offshore wind farms was presented in [14]. Similarly, a review of the most remarkable artificial intelligence techniques employed in wind turbine monitoring systems was introduced by [15]. Other studies like [16] proposed the application of a method of multiple criteria decision-making (MCDM) for designing cable routes of a floating wind farm.
A geographical information system (GIS) and multi-criteria decision analysis (MCDA) application were developed by [17] to determine the suitable areas for offshore wind farms in Hong Kong. Similarly, an analytic hierarchy process (AHP) was proposed by [18] for the same application in the Baltic Sea.
An increase in the utilization of artificial intelligence for wind energy prediction has also been observed. A hybrid forecasting model to assess and predict wind speed was introduced by [19]. In this particular case, the model comprised a generalized regression neural network (GRNN) and the whale optimization algorithm (WOA). A deep neural-based predictive control approach consisting of a hybrid long short-term memory (LSTM)–convolutional neural network (CNN) model was explored by [20]. The aim of this model predictive control (MPC) was to maximize the wind farm power generation while minimizing the usage of the control commands. The random forest regressor algorithm for predicting the output power of the wind turbines was analyzed by [21]. Auto-regressive integrated moving average (ARIMA), support vector machine (SVM), and gradient boosting machine (GBM). Machine learning was also applied for wind turbine flow field prediction and it was investigated by [22]. Artificial neural networks, Gaussian process, radial basis function, random forest, and support vector regression as approximation models were utilized by [23].
Allision risk of vessels is another area of investigation within the offshore wind farm domain where the application of AI is prevalent. For example, a Bayesian learning approach to model the ship navigation behavior near offshore wind farms was employed by [24]. AI was also applied to adequacy studies. Data-driven proxy models to learn complex relations between free-flow wind information and the resulting aggregated output power of wind farms were analyzed by [25]. With regard to predictive maintenance, a method for wind turbine failure prediction through the utilization of a SCADA-based condition monitoring system was proposed by [26]. The model consisted of a normal behavior estimator module, an expected time to failure (ETTF) module, and of an anomaly detection module.
Deep reinforcement learning has also been introduced within the offshore wind farm domain. For instance, an optimal control model of reactive power flow was proposed by [27] to enhance the voltage stability of wind farms through the consideration of the system power loss. Reinforcement learning was also applied in tandem with the A* algorithm (a search algorithm widely utilized in pathfinding problems) for water area path planning [28]. Analogously, AI has been applied for map generation. Specifically, maps of offshore wind power at turbine hub height from spaceborne SAR data have been generated [29].
1.2. Analysis of Scour Phenomenon in Offshore Wind Farms
The scour phenomenon compromises the operability of offshore wind farms [30]. Over the years, this phenomenon has been widely studied by different authors under different physical and hydraulic conditions [31]. The first studies were associated with investigations carried out on bridge piers where the scour effect occurs only under the action of continuous steady current conditions [32]. In a complementary way, the study of this phenomenon under hydraulic conditions typical of the marine environment (currents, waves, and tides) has been and continues to be analyzed in depth by different authors [33,34,35]. Faced with this phenomenon and, to maintain the operability of offshore structures, two types of strategy can be considered: designing these structures by predicting the extent of erosion that may occur or designing protections against scour to avert any adverse consequences. In most cases, the second option is the most common and advisable, as shown by the numerous studies that have been carried out to date highlighting the importance of designing adequate protections [36,37,38,39]).
Certain studies, as evident in publications such as [40] or [41], have shown the importance of optimizing the design of scour protection systems for climate change adaptation. Both studies were carried out in the context of remarkable European projects such as the ORACLE project and HYDRALAB-PLUS PROTEUS project funded by the European Fund for Regional Development (FEDER), respectively.
1.3. Geospatial Analysis of Data in Offshore Wind Farms
As previously stated, some authors utilized geospatial datasets in geographic information systems (GISs) with the aim of implementing data-driven decision-making methods in the management or in the planning phases. Through an intensive review, it was detected that many of the published studies relate to the analysis of bridges, pipelines or beach breakwaters [42]. Only a few studies have been applied to offshore wind farms. Ref. [43] developed a multi-criteria decision-making method for flood hazard indexing, considering geomorphological, meteorological, and hydrological data, based on openly available geospatial datasets in GISs. Ref. [44] discussed different terrain analysis methods based on GIS mapping tools and 3D visualization to enhance both pipeline planning and design. However, a small number of geospatial studies have been focused on the analysis of the scour phenomenon in offshore wind farms. Only specific publications like [45] or [46] developed a geospatial field measurement of sediment transport in support of site assessment for offshore wind farm developments. Consequently, it was revealed that there is a current lack of knowledge in the application of geospatial analysis in the study of this phenomenon in offshore wind farms.
Understanding the significance of examining the scour effect in offshore wind farms with regard to geospatial impacts, this research introduces a unique aspect through the spatial reliance study of this behavior based on an actual case study. Through the use of actual data on the extension and the depth of scour in an offshore wind farm, different conclusions were obtained to characterize this phenomenon in that farm.
This research focused on the geospatial analysis of scour improvement via data-driven decision-making processes where the installation of a new turbine, the maintenance operations or decommissioning tasks of a specific zone of scour affection are the key issues.
2. Materials and Methods
2.1. Data and Sources
This research was conducted using field data from the Lynn and Inner Dowsing offshore wind farms (see Figure 1) located in the southern North Sea, approximately 5 km off the coast of Lincolnshire near Skegness (UK). The dataset was extracted from a post-construction geophysical survey report published in 2016 with data from 2011 to 2015 [47]. EGS International Ltd. (EGSi) was contracted by Centrica Renewable Energy Limited (CREL) to undertake the 2015 post-construction hydrographic and geophysical survey of the L&ID (Lynn and Inner Dowsing) offshore wind farms. These works were conducted as part of a wider post-construction monitoring operation [48], providing data between 2011 and 2015. The variables considered are maximum scour extension, maximum scours depth, and location of turbines (latitude and longitude). Due to the characteristics of these data, their pre-processing was not required. The data utilized in this study are obtained from the reports available in [49].
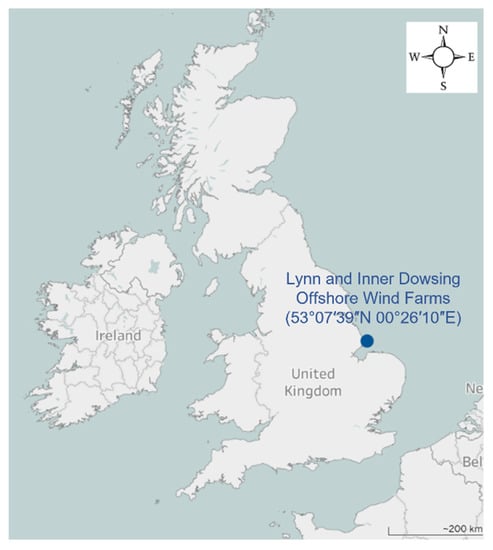
Figure 1.
Location of the Lynn and Inner Dowsing offshore wind farms [50].
The dataset consists of 13 different variables (turbine id, maximum scour extension, maximum scour depth between 2011 and 2015, longitude and latitude) of 54 different turbines.
Figure 2 shows the turbines considered in the study of Lynn (LN) and Inner Dowsing (ID) offshore wind farms together.
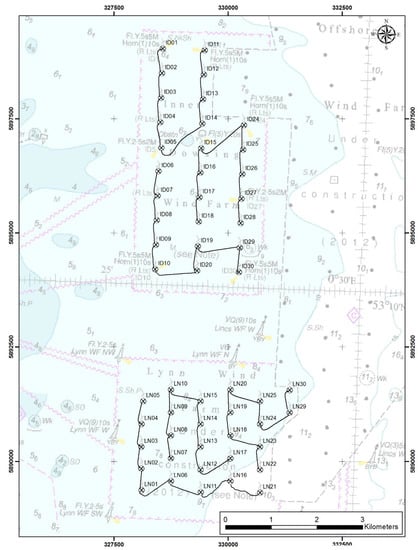
Figure 2.
Turbines of the Lynn (LN) and Inner Dowsing (ID) offshore wind farms studied [47].
Turbines presented in this study were selected considering the available data. The UTM (universal transverse mercator) coordinate system was used.
2.2. Exploratory Spatial Data Analysis
The analysis of data was conducted using the R programming language. The integrated development environment (IDE) used was RStudio, selected due to its open-source nature, and because it is an IDE dedicated to statistical computing and graphics.
To start with, dataset was loaded, and a spatial point data frame was generated with the coordinates of each turbine of the offshore wind farms. Then, an exploratory spatial analysis of the scour data was carried out by year and main directions (maximum scour extension and maximum scour depth). To compare the scour data measured over the years, a graphical representation of the data was performed in the main directions. Aiming to obtain a geographic visualization of data, it was plotted in a raster format as a complementary analysis.
2.3. Spatial Dependence Analysis of Scour Data: Moran Index
Spatial dependence is the degree of association or correlation between observations that are close to each other. It determines the existence of a relationship at one point in space and what happens in another place. Therefore, the value of a variable depends on and is affected by the value of its neighbors.
When studying the spatial dependence in a dataset, it is interesting to carry out an exploratory spatial analysis. Exploratory spatial analysis allows to inspect if there is any spatial dependency and of what is its type. To do this, firstly, an analysis of the closest neighbors of each point is conducted and is visually presented in a graph.
One of the existing methods to study whether there is spatial dependence is through the Moran plot and the Moran index [51]. The Moran plot shows the points that have no spatial dependence close to zero, and the furthest points are those that do have some spatial dependence. The Moran plot is a representation of the relationship between the values of the chosen variable (y) at each location and the average value of the same variable at neighboring locations. In this plot, the horizontal axis represents the values of the observations (y), the vertical axis (Wy) is based on the weighted average or spatial lag of the corresponding observation on the horizontal X axis, and the regression line of the Moran plot is Moran’s I coefficient (see Figure 3).
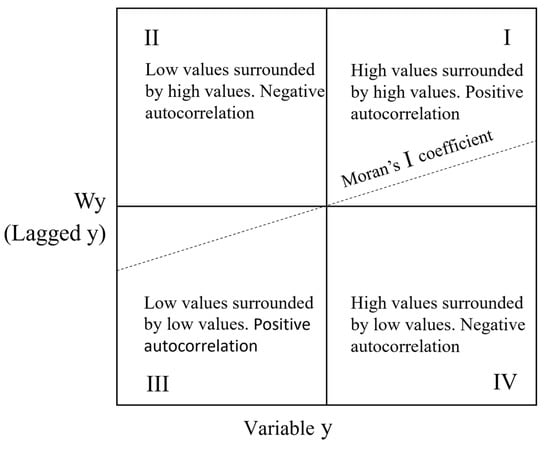
Figure 3.
Moran plot. Own research.
Moran index is a measure of spatial autocorrelation developed by Patrick Alfred Pierce Moran [51]. Moran’s I is defined as:
where N is the number of spatial units indexed by i and j; X is the variable of interest in a region i; is the mean of X and wij is the spatial weights matrix.
Being aware of the importance of studying the scour phenomenon in offshore wind farms, this research develops a spatial dependence analysis of this phenomenon.
Spatial dependence is the degree of association or correlation between data that are close to each other. This dependence entails the existence of a relationship at one point in space and what happens in another nearby place. In this way, the value of a variable will depend on the value of its neighbors and therefore if there is a positive spatial autocorrelation, the coincidence of low or high values may occur in one place.
To analyze whether there is spatial dependence, this study was carried out using the Moran plot and the Moran test in detail. The target variables in this analysis were the maximum scour extension and the maximum scour depth studied over a period of five years.
3. Results
The outcomes of the present study, centered on the geospatial assessment of scour in offshore wind farms, are detailed in this segment. Available data about scour extension and scour depth in the Lynn and Inner Dowsing offshore wind farms enabled to understand the evolution of the scour phenomenon over the studied period. Firstly, the results of a complete exploratory spatial analysis of scour data are presented. Then, with the aim to understand the results obtained by the presented data, a detailed study of the spatial dependence analysis of this phenomenon considering the location of turbines is obtained through Moran statistics. Two main dimensions of scour were considered during the study, the scour extension (horizontal) and the scour depth (vertical).
3.1. Scour Extension Data Analysis
Figure 4 shows the maximum scour extension (m) in Lynn offshore wind farm between 2011 and 2015. As observed, there is a growing trend over the years, highlighting an abrupt increment in scour extension between 2014 and 2015 in most of the cases. Although, as is observed, the scour extension can diminish over the years due to a deposition phenomenon associated with flow dynamics.
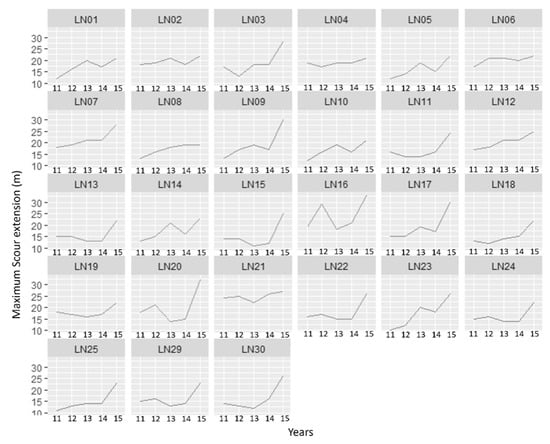
Figure 4.
Maximum scour extension (turbines between LN01-LN30) in Lynn offshore wind farm.
Figure 5 shows the maximum scour extension in Inner Dowsing offshore wind farm between 2011 and 2015. Similar to the data analysis of Lynn offshore wind farm, the scour extension (meters) shows an increasing trend over the years.
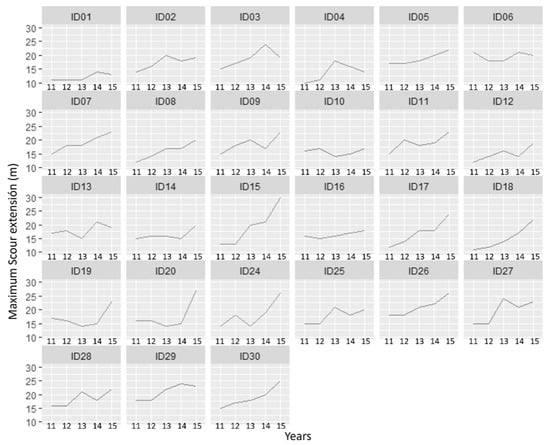
Figure 5.
Maximum scour extension (turbines between ID01 and ID30) in Inner Dowsing offshore wind farm.
Aiming to detect any possible pattern in data considering its location, a raster representation of the maximum scour extension (meters) in the turbines of the Lynn and Inner Dowsing offshore wind farms was proposed by year (see Figure 6, Figure 7, Figure 8, Figure 9 and Figure 10).
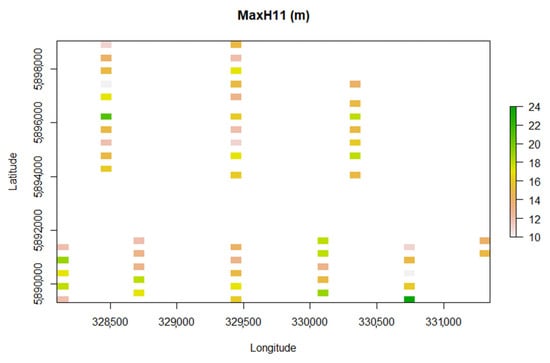
Figure 6.
Maximum scour extension in the turbines of the Lynn and Inner Dowsing offshore wind farms in 2011.
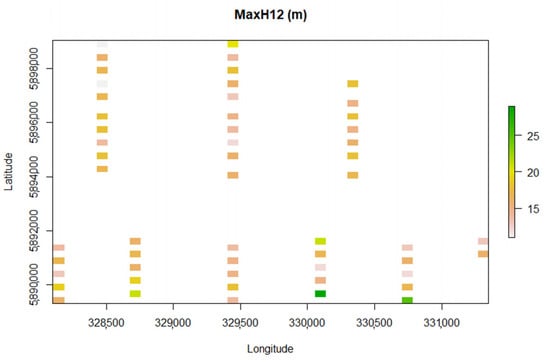
Figure 7.
Maximum scour extension in the turbines of the Lynn and Inner Dowsing offshore wind farms in 2012.
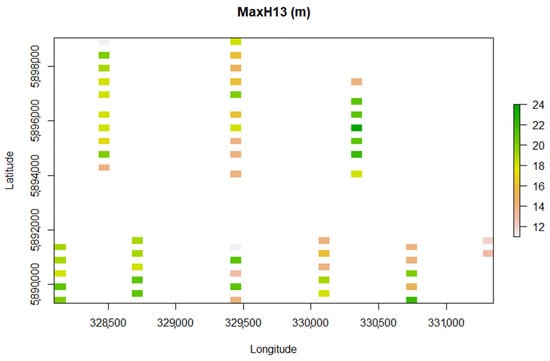
Figure 8.
Maximum scour extension in the turbines of the Lynn and Inner Dowsing offshore wind farms in 2013.
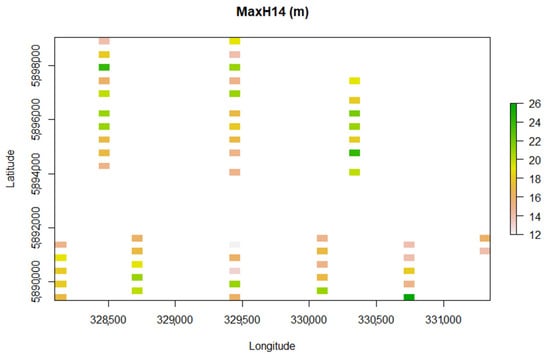
Figure 9.
Maximum scour extension in the turbines of the Lynn and Inner Dowsing offshore wind farms in 2014.
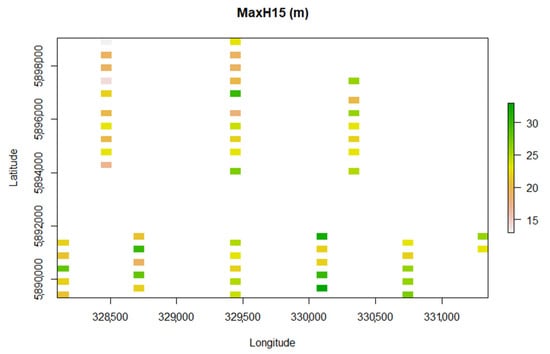
Figure 10.
Maximum scour extension in the turbines of the Lynn and Inner Dowsing offshore wind farms in 2015.
A rasterized plot of maximum scour extension of each turbine indicated a possible autocorrelation of data in some zones, but this assumption could be calculated only through an analysis considering the Moran plot and the Moran test.
Figure 11, Figure 12, Figure 13, Figure 14 and Figure 15 show the Moran plots for maximum scour extensions from each turbine of the Lynn and Inner Dowsing offshore wind farms by year.
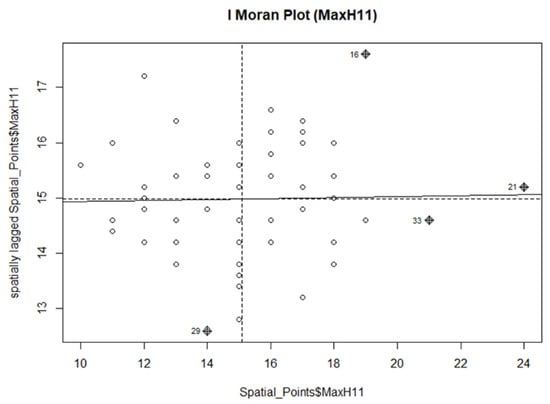
Figure 11.
Moran plot for maximum scour extensions in each turbine of the Lynn and Inner Dowsing offshore wind farms in 2011.
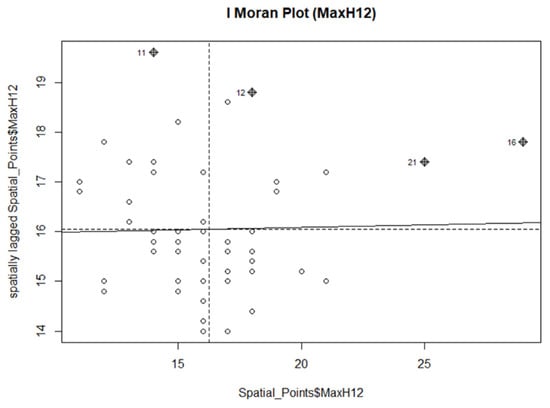
Figure 12.
Moran plot for maximum scour extensions in each turbine of the Lynn and Inner Dowsing offshore wind farms in 2012.
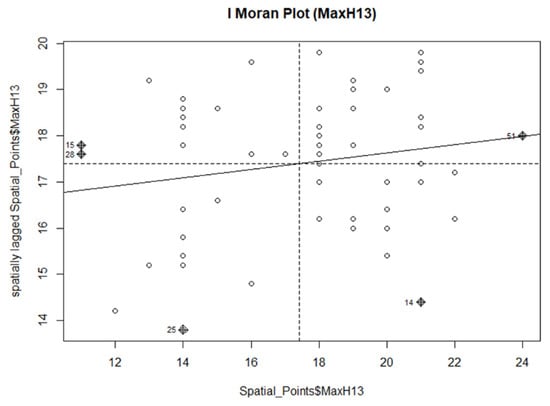
Figure 13.
Moran plot for maximum scour extensions in each turbine of the Lynn and Inner Dowsing offshore wind farms in 2013.
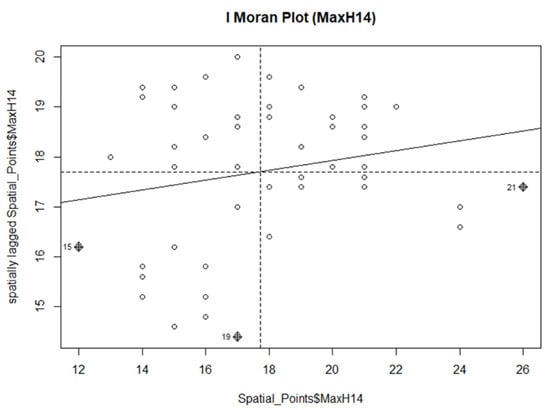
Figure 14.
Moran plot for maximum scour extensions in each turbine of the Lynn and Inner Dowsing offshore wind farms in 2014.
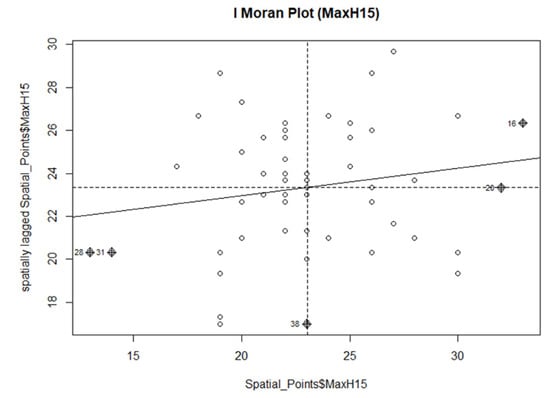
Figure 15.
Moran plot for maximum scour extensions in each turbine of the Lynn and Inner Dowsing offshore wind farms in 2015.
Table 1 summarizes the results on Moran index in the study of maximum scour extension in the Lynn and Inner Dowsing offshore wind farms.

Table 1.
Moran test results for maximum scour extensions between 2011 and 2015.
3.2. Scour Depth Data Analysis
Figure 16 shows the maximum scour depth in Lynn offshore wind farm between 2011 and 2015. As observed, there is a smooth growing trend over years.
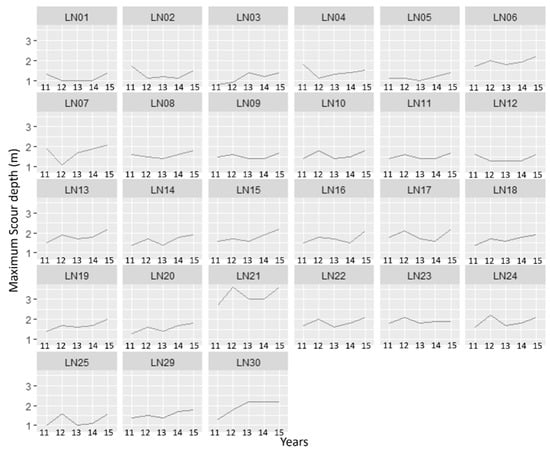
Figure 16.
Maximum scour depth (turbines between LN01 and LN30) in Lynn offshore wind farm between 2011 and 2015.
Figure 17 shows the maximum scour depth in Inner Dowsing offshore wind farm between 2011 and 2015. Similar to the data analysis of Lynn offshore wind farm, the scour depth represented shows a smooth growing trend over years.
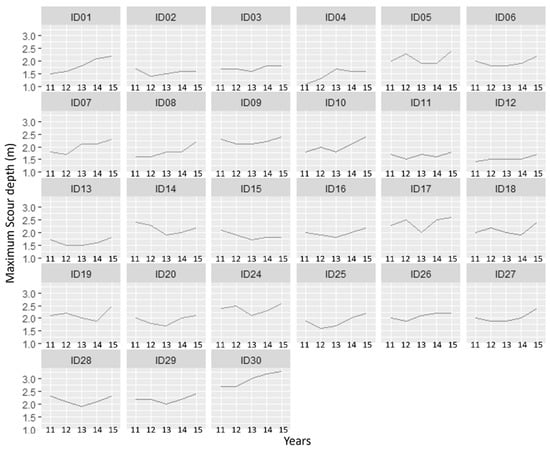
Figure 17.
Maximum scour depth (turbines between ID01 and ID30) in Inner Dowsing offshore wind farm between 2011 and 2015.
Aiming to detect any possible pattern in data considering its location, a raster representation of the maximum scour depth in the turbines of the Lynn and Inner Dowsing offshore wind farms was proposed by year (see Figure 18, Figure 19, Figure 20, Figure 21 and Figure 22).
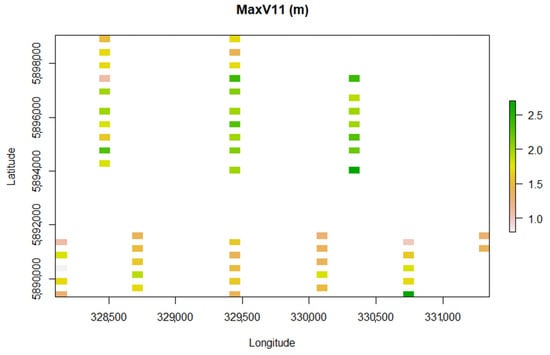
Figure 18.
Maximum scour depth in the turbines of the Lynn and Inner Dowsing offshore wind farms in 2011.
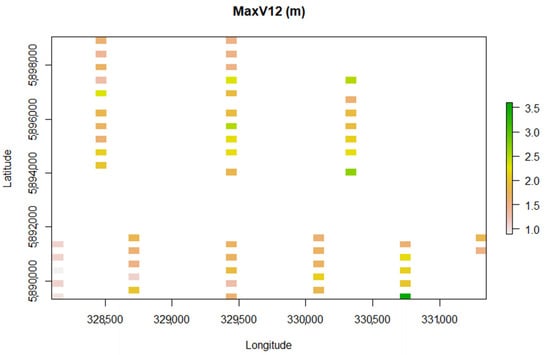
Figure 19.
Maximum scour depth in the turbines of the Lynn and Inner Dowsing offshore wind farms in 2012.
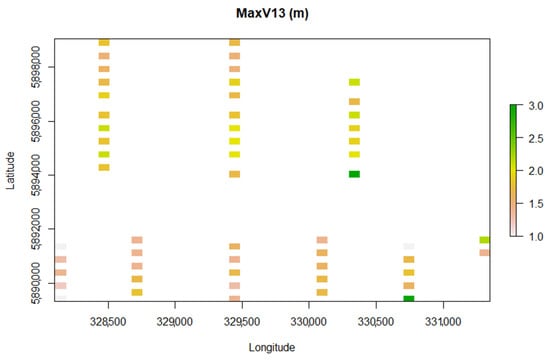
Figure 20.
Maximum scour depth in the turbines of the Lynn and Inner Dowsing offshore wind farms in 2013.
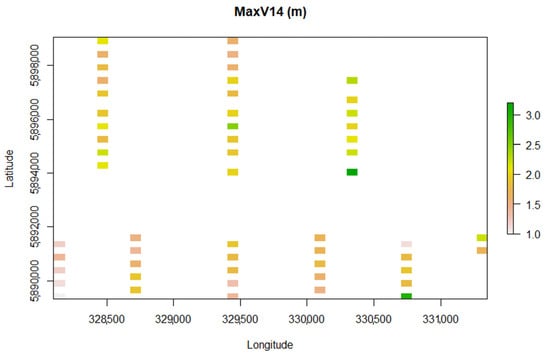
Figure 21.
Maximum scour depth in the turbines of the Lynn and Inner Dowsing offshore wind farms in 2014.
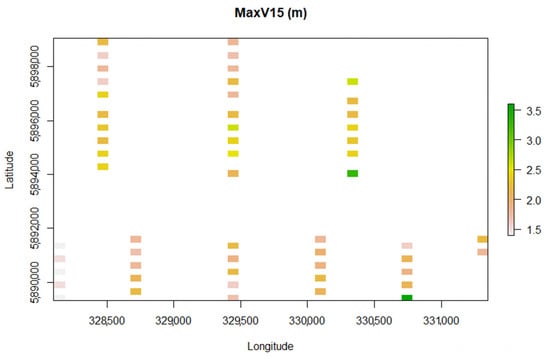
Figure 22.
Maximum scour depth in the turbines of the Lynn and Inner Dowsing offshore wind farms in 2015.
As previously indicated, the spatial dependence was studied using the Moran plot and the Moran test. Although a rasterized plot of maximum scour depth of each turbine indicated a possible autocorrelation of data in some zones, this assumption could be calculated only through an analysis considering the Moran plot and the Moran test.
Figure 23, Figure 24, Figure 25, Figure 26 and Figure 27 show the Moran plots for maximum scour depths in each turbine of the Lynn and Inner Dowsing offshore wind farms by year.
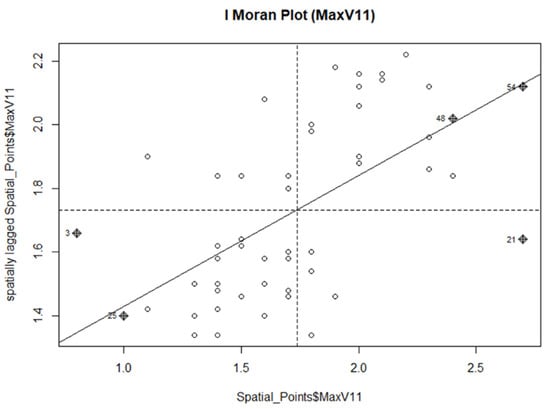
Figure 23.
Moran plot for maximum scour depth in each turbine of the Lynn and Inner Dowsing offshore wind farms in 2011.
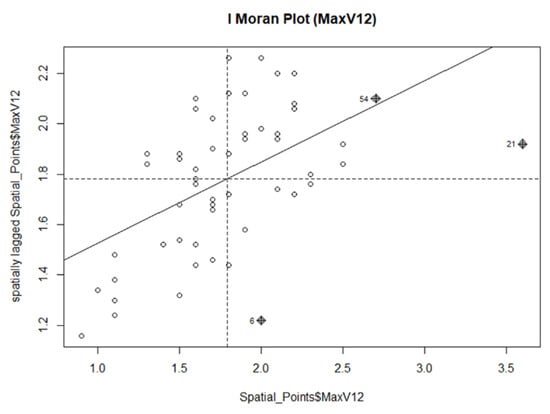
Figure 24.
Moran plot for maximum scour depth in each turbine of the Lynn and Inner Dowsing offshore wind farms in 2012.
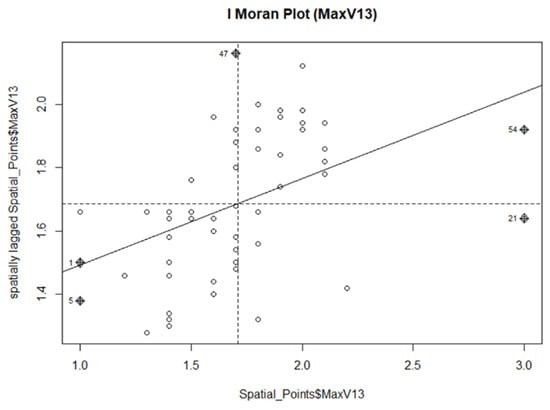
Figure 25.
Moran plot for maximum scour depth in each turbine of the Lynn and Inner Dowsing offshore wind farms in 2013.
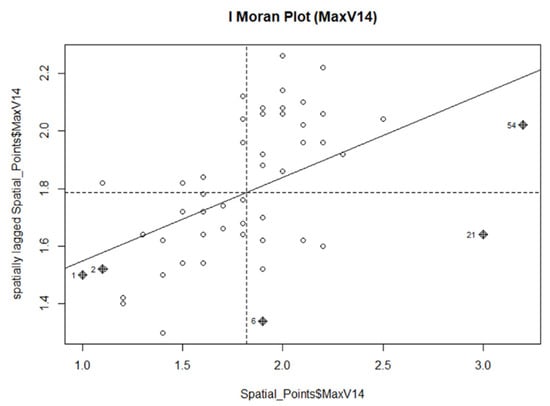
Figure 26.
Moran plot for maximum scour depth in each turbine of the Lynn and Inner Dowsing offshore wind farms in 2014.
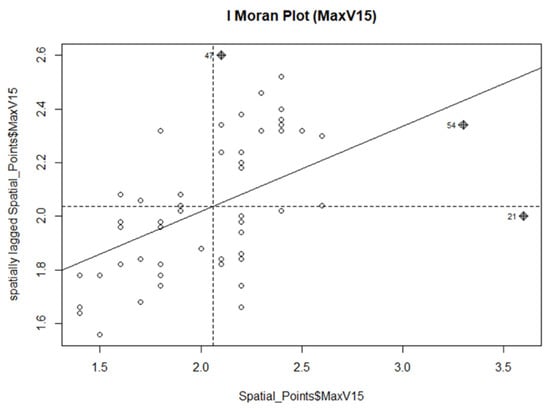
Figure 27.
Moran plot for maximum scour depth in each turbine of the Lynn and Inner Dowsing offshore wind farms in 2015.
Table 2 summarizes the results of the Moran index in the study for maximum scour depth in the Lynn and Inner Dowsing offshore wind farms.
Table 2.
Moran test results for maximum scour depths between 2011 and 2015.
4. Discussion
In this section, the results obtained in the Moran tests are discussed and a statistical validation is provided. Additionally, the analysis particularly highlights two main dimensions of the scour, namely, scour extension and scour depth.
4.1. Discussion of Scour Extension Data Analysis
As it could be observed in the figures (see Figure 11, Figure 12, Figure 13, Figure 14 and Figure 15), the slope of the solid lines representing the Moran’s I index tends to zero. Additionally, as is summarized in Table 1, p-values > 0.05 are not statistically significant in the Moran test, indicating that the null hypothesis could not be rejected. It is possible that the spatial distribution of data is the result of a random spatial process.
According to the results, year after year, the study showed no spatial dependence in the maximum scour extension recorded in the turbines at the Lynn and Inner offshore wind farms.
4.2. Discussion of Scour Depth Data Analysis
As it could be observed in the figures (see Figure 23, Figure 24, Figure 25, Figure 26 and Figure 27), the slope of the solid lines representing Moran’s I index is clearly positive. Additionally, as it is summarized in Table 2, p-values < 0.05 are statistically significant in the Moran test, indicating that the null hypothesis could be rejected. The spatial distribution of high values and/or low values in the dataset is more spatially clustered than would be expected if some spatial processes were random.
The findings consistently show a clear spatial dependency in the maximum scour depth recorded annually at the turbines of the Lynn and Inner offshore wind farms.
5. Conclusions
The current development of the offshore wind farm industry must include new improvements and the implementation of data-driven decision-making processes. There are numerous aspects influencing the planning and design of these structures, like terrain properties, wind turbine generator, or metocean characteristics, that make the structural design very complex. This research centered on the scour phenomenon, given its threat to the functionality of offshore wind farms.
An intensive review of the literature focusing on data-centered decision-making on the subject was conducted. Consequently, it was established that there exist no particular publications dealing with the phenomena of scour and the design of scour protections that consider data-driven decision-making or data analytics.
This research identified a significant gap in understanding when it comes to applying geospatial data analysis in the study of scour phenomenon in offshore wind farms. Geospatial data analysis, a detailed and comprehensive study of data implications, has enormous potential for providing insights into this area.
Being aware of the importance of studying the scour phenomenon in offshore wind farms considering the geospatial implications, this paper proposed, as a novelty, the study of this phenomenon for data-driven decision-making processes. The aim of this investigation was to use advanced data analysis techniques for the study of autocorrelation of scour data in online offshore wind farms. Different conclusions were obtained characterizing this phenomenon in online offshore wind farms. These can be summarized as follows.
- -
- Scour extension and scour depth have an increasing trend, which are necessary to carry out inspection and maintenance work of such installations over the years;
- -
- This study revealed that there is no spatial dependency on the maximum scour extension measured in the turbines of the Lynn and Inner offshore wind farms;
- -
- It was demonstrated that there exists a spatial dependence in the maximum scour depth measured in the turbines of the Lynn and Inner offshore wind farms.
The increase in the scour depth is more crucial than the increase in scour extension in an offshore foundation installed. This is due to the implications and consequences associated with a possible great loss of turbine stability.
In future designs of the Lynn and Inner Dowsing offshore wind farms, the detection of autocorrelation in the scour depth of turbines may prove valuable during important decision-making processes linked to the project’s planning strategy.
Author Contributions
All the authors contributed toward choosing data, discussion, methodology, figures and references to provide an accurate paper. Conceptualization, C.M.M.; Investigation, C.M.M., C.V.-G., N.P.-J. and V.N.V.; Methodology, C.M.M., C.V.-G., N.P.-J. and N.C.-M.; Writing—original draft, C.M.M.; Writing—review and editing, C.M.M., C.V.-G., N.P.-J., V.N.V. and N.C.-M. All authors have read and agreed to the published version of the manuscript.
Funding
This research received no external funding.
Data Availability Statement
Data are publicly archived in the Marine Data Exchange, which is a world-leading collection of offshore marine industry data and evidence. All data used in the study are available online on www.marinedataexchange.co.uk/ (accessed on 11 May 2023).
Conflicts of Interest
The authors declare no conflict of interest.
References
- Juan, N.P.; Valdecantos, V.N.; del Campo, J.M. Analysis of Monthly Recorded Climate Extreme Events and Their Implications on the Spanish Mediterranean Coast. Water 2022, 14, 3453. [Google Scholar] [CrossRef]
- European Commission. Energy. Directorate-General for Energy. 2022. Available online: www.energy.ec.europa.eu/index_en (accessed on 11 May 2023).
- EUR-Lex. Online Gateway to EU Law. Available online: https://eur-lex.europa.eu/legal-content/EN/TXT/?uri=COM%3A2020%3A741%3AFIN (accessed on 11 May 2023).
- WindEurope. Offshore Wind Energy 2022 Mid-Year Statistics. Available online: https://windeurope.org/intelligence-platform/product/offshore-wind-energy-2022-mid-year-statistics/ (accessed on 11 May 2023).
- Suh, K.-D.; Kim, S.-W.; Kim, S.; Cheon, S. Effects of climate change on stability of caisson breakwaters in different water depths. Ocean Eng. 2013, 71, 103–112. [Google Scholar] [CrossRef]
- Altuntas, F.; Gok, M.S. A data-driven analysis of renewable energy management: A case study of wind energy technology. Clust. Comput. 2023, 1, 1–20. [Google Scholar] [CrossRef]
- Ministerio de Asuntos Económicos y Transformación Digital. Gobierno de España. Available online: https://portal.mineco.gob.es/ (accessed on 11 May 2023).
- Polykarpou, M.; Karathanasi, F.; Soukissian, T.; Loukaidi, V.; Kyriakides, I. A Novel Data-Driven Tool Based on Non-Linear Optimization for Offshore Wind Farm Siting. Energies 2023, 16, 2235. [Google Scholar] [CrossRef]
- Nabati, E.G.; Thoben, K.-D. Data Driven Decision Making in Planning the Maintenance Activities of Off-shore Wind Energy. Procedia CIRP 2017, 59, 160–165. [Google Scholar] [CrossRef]
- Pandit, R.K.; Kolios, A.; Infield, D. Data-driven weather forecasting models performance comparison for improving offshore wind turbine availability and maintenance. IET Renew. Power Gener. 2020, 14, 2386–2394. [Google Scholar] [CrossRef]
- Yin, X.; Zhang, W.; Jiang, Z.; Pan, L. Data-driven multi-objective predictive control of offshore wind farm based on evolutionary optimization. Renew. Energy 2020, 160, 974–986. [Google Scholar] [CrossRef]
- Boyd, D.; Karimirad, M.; Sivakumar, V.; Jalilvand, S.; Desmond, C. A Review of End-of-Life Decision Making for Offshore Wind Turbines. In Proceedings of the En International Conference on Offshore Mechanics and Arctic Engineering. American Society of Mechanical Engineers, Hamburg, Germany, 5–10 June 2022; p. V008T09A015. [Google Scholar] [CrossRef]
- Salvador, C.B.; Arzaghi, E.; Yazdi, M.; Jahromi, H.A.; Abbassi, R. A multi-criteria decision-making framework for site selection of offshore wind farms in Australia. Ocean Coast. Manag. 2022, 224, 106196. [Google Scholar] [CrossRef]
- Mitchell, D.; Blanche, J.; Harper, S.; Lim, T.; Gupta, R.; Zaki, O.; Tang, W.; Robu, V.; Watson, S.; Flynn, D. A review: Challenges and opportunities for artificial intelligence and robotics in the offshore wind sector. Energy AI 2022, 8, 100146. [Google Scholar] [CrossRef]
- Márquez, F.P.G.; Gonzalo, A.P. A Comprehensive Review of Artificial Intelligence and Wind Energy. Arch. Comput. Methods Eng. 2021, 29, 2935–2958. [Google Scholar] [CrossRef]
- Díaz, H.; Soares, C.G. Multicriteria Decision Approach to the Design of Floating Wind Farm Export Cables. Energies 2022, 15, 6593. [Google Scholar] [CrossRef]
- Gavériaux, L.; Laverrière, G.; Wang, T.; Maslov, N.; Claramunt, C. GIS-based multi-criteria analysis for offshore wind turbine deployment in Hong Kong. Ann. GIS 2019, 25, 207–218. [Google Scholar] [CrossRef]
- Chaouachi, A.; Covrig, C.F.; Ardelean, M. Multi-criteria selection of offshore wind farms: Case study for the Baltic States. Energy Policy 2017, 103, 179–192. [Google Scholar] [CrossRef]
- Nezhad, M.M.; Heydari, A.; Pirshayan, E.; Groppi, D.; Garcia, D.A. A novel forecasting model for wind speed assessment using sentinel family satellites images and machine learning method. Renew. Energy 2021, 179, 2198–2211. [Google Scholar] [CrossRef]
- Yin, X.; Zhao, X. Deep Neural Learning Based Distributed Predictive Control for Offshore Wind Farm Using High-Fidelity LES Data. IEEE Trans. Ind. Electron. 2021, 68, 3251–3261. [Google Scholar] [CrossRef]
- Rashid, H.; Haider, W.; Batunlu, C. Forecasting of Wind Turbine Output Power Using Machine learning. In Proceedings of the 2020 10th International Conference on Advanced Computer Information Technologies (ACIT), Deggendorf, Germany, 16–18 September 2020; pp. 396–399. [Google Scholar] [CrossRef]
- Bankefa, T.; Biswas, A.K.; Ranganathan, P. Hybrid Machine Learning Models for Accurate Onshore/Offshore Wind Farm Forecasts. In Proceedings of the IEEE International Conference on Electro Information Technology (eIT), Mankato, MN, USA, 19–21 May 2022; pp. 335–341. [Google Scholar] [CrossRef]
- Richmond, M.; Sobey, A.; Pandit, R.; Kolios, A. Stochastic assessment of aerodynamics within offshore wind farms based on machine-learning. Renew. Energy 2020, 161, 650–661. [Google Scholar] [CrossRef]
- Yu, Q.; Liu, K. An AIS Data-Based Framework for Ship Allision Risk Assessment Near the Offshore Wind Farm. In Proceedings of the 6th International Conference on Transportation Information and Safety, Wuhan, China, 22–24 October 2021; pp. 10–15. [Google Scholar] [CrossRef]
- Nguyen, T.-H.; Toubeau, J.-F.; De Jaeger, E.; Vallee, F. Machine Learning Proxies Integrating Wake Effects in Offshore Wind Generation for Adequacy Studies. In Proceedings of the 2021 IEEE International Conference on Environment and Electrical Engineering and 2021 IEEE Industrial and Commercial Power Systems Europe (EEEIC/I&CPS Europe), Bari, Italy, 7–10 September 2021; pp. 1–6. [Google Scholar] [CrossRef]
- Alzawaideh, B.; Baboli, P.T.; Babazadeh, D.; Horodyvskyy, S.; Koprek, I.; Lehnhoff, S. Wind Turbine Failure Prediction Model using SCADA-based Condition Monitoring System. IEEE Madrid PowerTech 2021, 1–6. [Google Scholar] [CrossRef]
- Tan, H.; Li, H.; Xie, X.; Yang, T.; Zheng, J.; Yang, W. Reactive-Voltage Coordinated Control of Offshore Wind Farm Based on Deep Reinforcement Learning. In Proceedings of the 2021 3rd Asia Energy and Electrical Engineering Symposium (AEEES), Chengdu, China, 26–29 March 2021; pp. 407–412. [Google Scholar] [CrossRef]
- Zha, T.; Xie, L.; Chang, J. Wind farm water area path planning algorithm based on A* and reinforcement learning. In Proceedings of the 5th International Conference on Transportation Information and Safety (ICTIS), Liverpool, UK, 14–17 July 2019; pp. 1314–1318. [Google Scholar] [CrossRef]
- de Montera, L.; Berger, H.; Husson, R.; Appelghem, P.; Guerlou, L.; Fragoso, M. SAR Surface Wind Estimation and Extrapolation at Turbine Hub Height with Machine Learning for Offshore Wind Farm Siting. In Proceedings of the 2021 IEEE International Geoscience and Remote Sensing Symposium IGARSS, Brussels, Belgium, 11–16 July 2021; pp. 691–694. [Google Scholar] [CrossRef]
- Li, J.; Guo, Y.; Lian, J.; Wang, H. Scour effects on the bearing capacity of multi-bucket jacket foundation for offshore wind turbines. Ocean Eng. 2022, 259, 111848. [Google Scholar] [CrossRef]
- Matutano, C.; Negro, V.; López-Gutiérrez, J.-S.; Esteban, M.D. Scour prediction and scour protections in offshore wind farms. Renew. Energy 2013, 57, 358–365. [Google Scholar] [CrossRef]
- Breusers, H.N.C.; Nicollet, G.; Shen, H. Local Scour Around Cylindrical Piers. J. Hydraul. Res. 1977, 15, 211–252. [Google Scholar] [CrossRef]
- Whitehouse, R.J.S. Scour at Marine Structures: A Manual for Practical Applications; Thomas Telford: London, UK, 1998. [Google Scholar]
- Matutano, C.; Negro, V.; López-Gutiérrez, J.-S.; Esteban, M.D. Hydrodynamic Regimes in Offshore Wind Farms. J. Coast. Res. 2016, 75, 892–896. [Google Scholar] [CrossRef]
- Sumer, B.M.; Kirca, V.S.O. Scour and liquefaction issues for anchors and other subsea structures in floating offshore wind farms: A review. Water Sci. Eng. 2021, 15, 3–14. [Google Scholar] [CrossRef]
- Whitehouse, R.J.S.; Harris, J.M.; Sutherland, J.; Rees, J. The nature of scour development and scour protection at offshore windfarm foundations. Mar. Pollut. Bull. 2011, 62, 73–88. [Google Scholar] [CrossRef] [PubMed]
- Matutano, C.; Negro, V.; López-Gutiérrez, J.-S.; Esteban, M.D.; Del Campo, J.M. Dimensionless wave height parameter for preliminary design of scour protection in offshore wind farms. J. Coast. Res. 2013, 165, 1633–1638. [Google Scholar] [CrossRef]
- Matutano, C.; Negro, V.; López-Gutiérrez, J.-S.; Esteban, M.D.; Hernández, A. The effect of scour protections in offshore wind farms. J. Coast. Res. 2014, 70, 12–17. [Google Scholar] [CrossRef]
- Tang, Z.-H.; Melville, B.; Singhal, N.; Shamseldin, A.; Zheng, J.-H.; Guan, D.-W.; Cheng, L. Countermeasures for local scour at offshore wind turbine monopile foundations: A review. Water Sci. Eng. 2022, 15, 15–28. [Google Scholar] [CrossRef]
- Chavez, C.E.A.; Stratigaki, V.; Wu, M.; Troch, P.; Schendel, A.; Welzel, M.; Villanueva, R.; Schlurmann, T.; De Vos, L.; Kisacik, D.; et al. Large-Scale Experiments to Improve Monopile Scour Protection Design Adapted to Climate Change—The PROTEUS Project. Energies 2019, 12, 1709. [Google Scholar] [CrossRef]
- Fazeres-Ferradosa, T.; Taveira-Pinto, F.; Rosa-Santos, P.; Chambel, J. A review of reliability analysis of offshore scour protections. Proc. Inst. Civ. Eng. Marit. Eng. 2019, 172, 104–117. [Google Scholar] [CrossRef]
- Khan-Mozahedy, A.; Muñoz-Perez, J.J.; Neves, M.G.; Sancho, F.; Cavique, R. Mechanics of the scouring and sinking of submerged structures in a mobile bed: A physical model study. Coast. Eng. 2016, 110, 50–63. [Google Scholar] [CrossRef]
- Loli, M.; Kefalas, G.; Dafis, S.; Mitoulis, S.A.; Schmidt, F. Bridge-specific flood risk assessment of transport networks using GIS and remotely sensed data. Sci. Total. Environ. 2022, 850, 157976. [Google Scholar] [CrossRef]
- Cosford, J.; Van Zeyl, D.; Penner, L. Terrain analysis for pipeline design, construction, and operation. J. Pipeline Eng. 2014, 13, 149–165. [Google Scholar]
- Black, K. Geospatial Field Measurement of Sediment Transport In Support of Site Assessment for Offshore Windfarm Developments. Coasts, marine structures and breakwaters: Adapting to change. In Proceedings of the 9th International Conference Organised by the Institution of Civil Engineers and Held in Edinburgh on 16 to 18 September 2009; Thomas Telford Ltd.: London, UK, 2010; pp. 704–707. [Google Scholar] [CrossRef]
- Tajalli Bakhsh, T.; Simpson, K.; LaPierre, T.; Monim, M.; Dahl, J.; Spaulding, M.; O’Connell, D. Potential Geo-Hazards to Floating Offshore Wind Farms in the US Pacific. In Proceedings of the International Conference on Offshore Mechanics and Arctic Engineering 2021, Virtual, Online, 16–17 February 2021; Volume 84768, p. V001T01A014. [Google Scholar]
- EGS International Ltd. Lynn and Inner Dowsing Offshore Wind Farms, Post Construction Geophysical Survey, Hampshire; EGS International Ltd.: Bordon, UK, 2016. [Google Scholar]
- MEDIN portal. Marine Environmental Data and Information Network. The National Oceanography Centre. Available online: https://portal.medin.org.uk/ (accessed on 11 May 2023).
- Marine Data Exchange. world-Leading Collection off Offshore Marine Industry Data and Evidence. The Crown Estate, a St Jame’s Market, London. 2022. Available online: www.marinedataexchange.co.uk/ (accessed on 11 May 2023).
- European Offshore Wind Farms Map Public. Available online: https://windeurope.org/intelligence-platform/product/european-offshore-wind-farms-map-public/ (accessed on 11 May 2023).
- Moran, P.A.P. Notes on Continuous Stochastic Phenomena. Biometrika 1950, 37, 17–23. [Google Scholar] [CrossRef] [PubMed]


Disclaimer/Publisher’s Note: The statements, opinions and data contained in all publications are solely those of the individual author(s) and contributor(s) and not of MDPI and/or the editor(s). MDPI and/or the editor(s) disclaim responsibility for any injury to people or property resulting from any ideas, methods, instructions or products referred to in the content. |
© 2023 by the authors. Licensee MDPI, Basel, Switzerland. This article is an open access article distributed under the terms and conditions of the Creative Commons Attribution (CC BY) license (https://creativecommons.org/licenses/by/4.0/).