Article

Experimental Investigation of Gas Transmission Pipeline Blockage Detection Based on Dynamic Pressure Method

1
SINOPEC Research Institute of Safety Engineering Co., Ltd., Qingdao 266071, China
2
State Key Laboratory of Safety and Control for Chemicals, Qingdao 266071, China
3
School of Energy and Power Engineering, Dalian University of Technology, Dalian 116024, China
4
Major Infrastructure Construction Technology Innovation Center, Ningbo Institute of Dalian University of Technology, No. 26 Yucai Road, Jiangbei District, Ningbo 315016, China
*
Author to whom correspondence should be addressed.
Energies 2023, 16(15), 5620; https://doi.org/10.3390/en16155620
Submission received: 10 June 2023 / Revised: 16 July 2023 / Accepted: 24 July 2023 / Published: 26 July 2023
(This article belongs to the Section B: Energy and Environment)

Abstract

:
The blockage of natural gas pipelines caused by solid deposits such as hydrates is one of the major safety risks to transmission pipeline systems. The key to effective blockage relief or removal is to determine the location and severity of the blockage. In recent years, the pressure pulse wave method has been considered as a practical detection method due to its fast response time, simplicity of operation, and extended detection distance. Nevertheless, the current implementation of this method in pipelines indicates that the accuracy in detecting blockages is very low. To improve the accuracy of the pressure wave blockage detection technique in our experiments, a series of experiments were carried out to detect and locate hydrate blockages in natural gas pipelines based on the pressure wave method using a separate pipeline system of 22 mm diameter and 106 m length. The experimental results show that the accuracy of the blockage location prediction based on the pressure pulse wave method is within 5%. Still, the blockage’s cross-sectional shape can significantly affect the intensity of the reflected wave, with a maximum prediction error of 35%.

1. Introduction

The main safety risk to gas pipeline systems is caused by blockages in pipelines caused by solid deposits such as hydrates [1,2]. In addition, most of the pipeline exists under high-pressure and low-temperature conditions, which can easily lead to the formation of solid depositions such as hydrates [3,4]. The continuous accumulation of the hydrate solid deposition may lead to fire explosion, pollution, or other ecocatastrophes if not removed in time [5]. Determining the pipeline blockage information is the focal point to solving the blockage efficiently. At present, several investigations into most suitable method for detecting gas pipe blockages have been carried out in the literature. Application of back pressure technique to roughly predict blockages was proposed by Scott et al., and they attempted to quantify the deviation by introducing blockage coefficients for “rough” and “smooth” pipes based on the definition of pipe friction coefficients, but it does not provide accurate predictions [6]. Mazzotti et al. conducted a simulation using back pressure and flow rate, and by minimizing the function that represents the difference between the measured data in the field and the numerical simulation data through a genetic algorithm, blockages can be identified [7]. However, the positioning error is above 5%. This is too large an error relative to other methods. Koyama et al. applied acoustic technology to blockage detection [8], experimenting only in a 4.113 m pipe. The method is specifically to detect the response acoustic signal of the acoustic pulse signal generated by the acoustic pulse wave transmitter in the pipeline through the acoustic sensors arranged on the pipeline and to detect whether there is any blockage and leakage in the pipeline by comparing the difference between the measured response signal and the normal signal in the pipeline under the absence of any abnormal conditions. Signal immunity and propagation ability are the main limits to the use of this method. Pratap et al. based the idea of differential damping rates (high sediment locations attenuate sound waves at a higher rate than low sediment duct locations) for tracheal blockage detection [9]. However, due to the dispersion effect of acoustic waves, it is difficult to perform blockage detection in long-distance transmission pipelines via acoustic detection. A methodology for simulating the identification of blockages in pipe networks using acoustic finite element modal analysis is presented by Bello et al. [10]. This was accomplished by starting with the analysis of a straight fluid-filled pipe without any defects and calculating the intrinsic frequencies of the acoustic modes of the fluid in the pipe. Subsequently, different degrees of blockage are introduced at different locations along the length of the pipe, and the corresponding intrinsic frequencies of the acoustic modes of the fluid in the pipe are calculated again by using finite element techniques; finally, based on the above results, the modal characteristics of a partially blocked pipe are established and compared with the simulation results of a fluid-filled pipe without any defects in order to identify the location and size of the defects. However, the method requires historical acoustic modal data of the pipe, and for actual pipes, the method is not well-applicable to in-service pipes because different pipes have different intrinsic properties of their own; therefore, the measured data of a newly cast pipe cannot be used to replace the properties of an in-service pipe. Some scholars have proposed a frequency domain response method for the detection of blockages in transmission pipelines, using frequency domain analysis of pressure signals in the pipeline to locate blockages. The resultant analysis can detect the location by the mode and the number of peaks in the peak pressure frequency response, and the size of the local blockage can be determined via the average peak pressure fluctuation. However, due to the difference in physical properties between liquids and gases, there are currently no gas pipeline inspection experiments for this method [11,12,13]. Pipeline leak detection based on transient reflection method using leakage induced reflection information was undertaken by Zhang et al., but it is currently only used in the numerical simulation stage [14]. At the same time, the frequency response method and the transient damping method need to inject a number of continuous pressure waves into the pipeline, which has a certain impact on the stable operation of the pipeline.
At present, the pressure wave method is considered as an early local blockage detection method with practical value because of its advantages of fast response, less invasiveness, economy, and high precision [15,16,17,18]. The method involves injecting pressure pulses into pipes. When there is any sudden change in the cross-sectional of the pipeline—for example, blockage, branch pipe, or valve—the pressure incident wave will be partially reflected and transmitted at the interface of these characteristics. Meanwhile, sensors installed along the pipeline are used to detect signal changes when pressure waves propagate in the pipeline. Afterwards, the blocking position and area are calculated according to the time difference and amplitude difference between incident wave and reflected wave. Adewumi et al. put forward a model to describe the propagation of pressure waves through blocked gas pipelines [19]. The specific approach is to use a one-dimensional isothermal non-component single-phase Eulerian model to describe the propagation of pressure pulse waves in multi-clogged pipes, and at the same time, the inlet pressure changes caused by the propagation transient reflections are monitored and analyzed, and the detection of multi-point blockages in the pipe is achieved on this basis. In addition, numerical simulations were carried out to demonstrate the feasibility of this method. Adeleke et al. introduced gas viscosity effects into the mathematical model proposed by Adewumi for optimization. The numerical calculation results show that the method has high calculation accuracy because it relies on less simplification, but similarly, due to the high computational complexity, there are the same problems of increased computation and unguaranteed accuracy in the actual pipeline. No experimental verification has been carried out [20]. Stewart et al. proposed a method for detecting pipeline blockages using pressure waves by using a rapidly opening and closing the valve to generate pressure waves and connecting a high-speed data recording and acquisition device to the pipeline to record the pressure waves propagating and reflecting along the pipeline. Experimental studies and case studies have shown that this method enables various types of blockage detection in real pipelines and can be used for both flowing and non-flowing pipelines in all fluids, both onshore and offshore. It provides a basis for blockage detection experiments using the pressure pulse wave method [21]. However, the experimental data of this research are not enough; the lack of complex conditions of pressure wave propagation characteristics in the research and the different types of blockages are more in line with the actual situation of pressure wave reflection law research. A series of experimental studies were carried out in order to test the feasibility of the pressure wave method in gas pipe blockage detection and to improve the accuracy of the pulse pressure wave in detecting the location and percentage of blockage.
In this study, A number of experiments were carried out with an experimental pipe diameter of 22 mm and a length of 106 m. The results prove the feasibility of using pressure waves to accurately detect blockage information.

2. Materials and Methods

In order to carry out experimental research on the detection of natural gas pipeline blockage via the pressure wave method, we established an experimental apparatus.
The gas injection system, pressure wave generator, main pipeline section, partially blocked pipeline section, and data acquisition systems make up the six components of this experimental system, as shown in Figure 1. The gas booster system consists of an air compressor that pressurizes the air and injects it into the experimental system. The pressure wave generator comprises a fast-acting valve that causes a short-term leak by opening and closing the valve to generate a pulsating negative pressure wave. The main pipeline section consists of 106 m of PPR pipe with a diameter of 22 mm. Since hydrate generation in pipes has two main characteristics, namely, film growth on the pipe wall and deposition of hydrate particles formed in entrained droplets [3], metal rings of different diameters and gate valves were chosen as partially blocked pipeline sections to simulate hydrate blockage. The data acquisition system consists of a dynamic pressure transducer for transient dynamic pressure signals and a static pressure transducer for static pressure signals. The pipe outlet is connected to air and is limited by the shut-off valve. The wave signal of every sensor was displayed simultaneously in LabVIEW ® (a data acquisition program). A gate valve and a pressure-reducing valve are present at the front of the pipeline in Figure 1. The purpose of the pressure-reducing valve is to control the injection pressure of the air compressor to prevent damage caused by excessive pressure injection into the pipeline. The function of the gate valve is to close completely when the air injection is finished as a blind pipe to eliminate the interference of the air compressor section to the pulse pressure wave signal. The gate valve at the end of the pipeline is mainly used as a safeguard to prevent the safety hazard caused by the rapid discharge of gas in the pipeline in case of solenoid valve failure.
Before the blockage detection experiment, partial blockage section is replaced and installed. First, according to the experimental needs, the type, installation position, and blockage degree of the blockage module are selected, and the appropriate pipeline or valve is installed at its appropriate position to simulate the blockage. Lastly, we inject the air into the main pipeline and add a certain pressure to check the tightness of the pipeline. After testing, we close the gate valve and solenoid valve at the outlet and open the pressure-reducing valve and gate valve at the inlet for gas injection. When the pipeline pressure reaches the experimental pressure, we close the pressure-reducing valve, start the data measurement, and turn on the acquisition unit. Then, the pressure wave is generated by opening the quick-open valve. The pressure wave propagates continuously along the pipeline until the amplitude attenuates such that is becomes difficult to identify, and the experiment is completed. For a more detailed introduction of the experimental system and experimental steps, see the previous relevant research of the author [22,23].

3. Results

3.1. Theory and Calculation

To carry out experimental research on the detection of natural gas pipeline blockage via the pressure wave method, a number of investigations were carried out on the facilities shown in Figure 1.
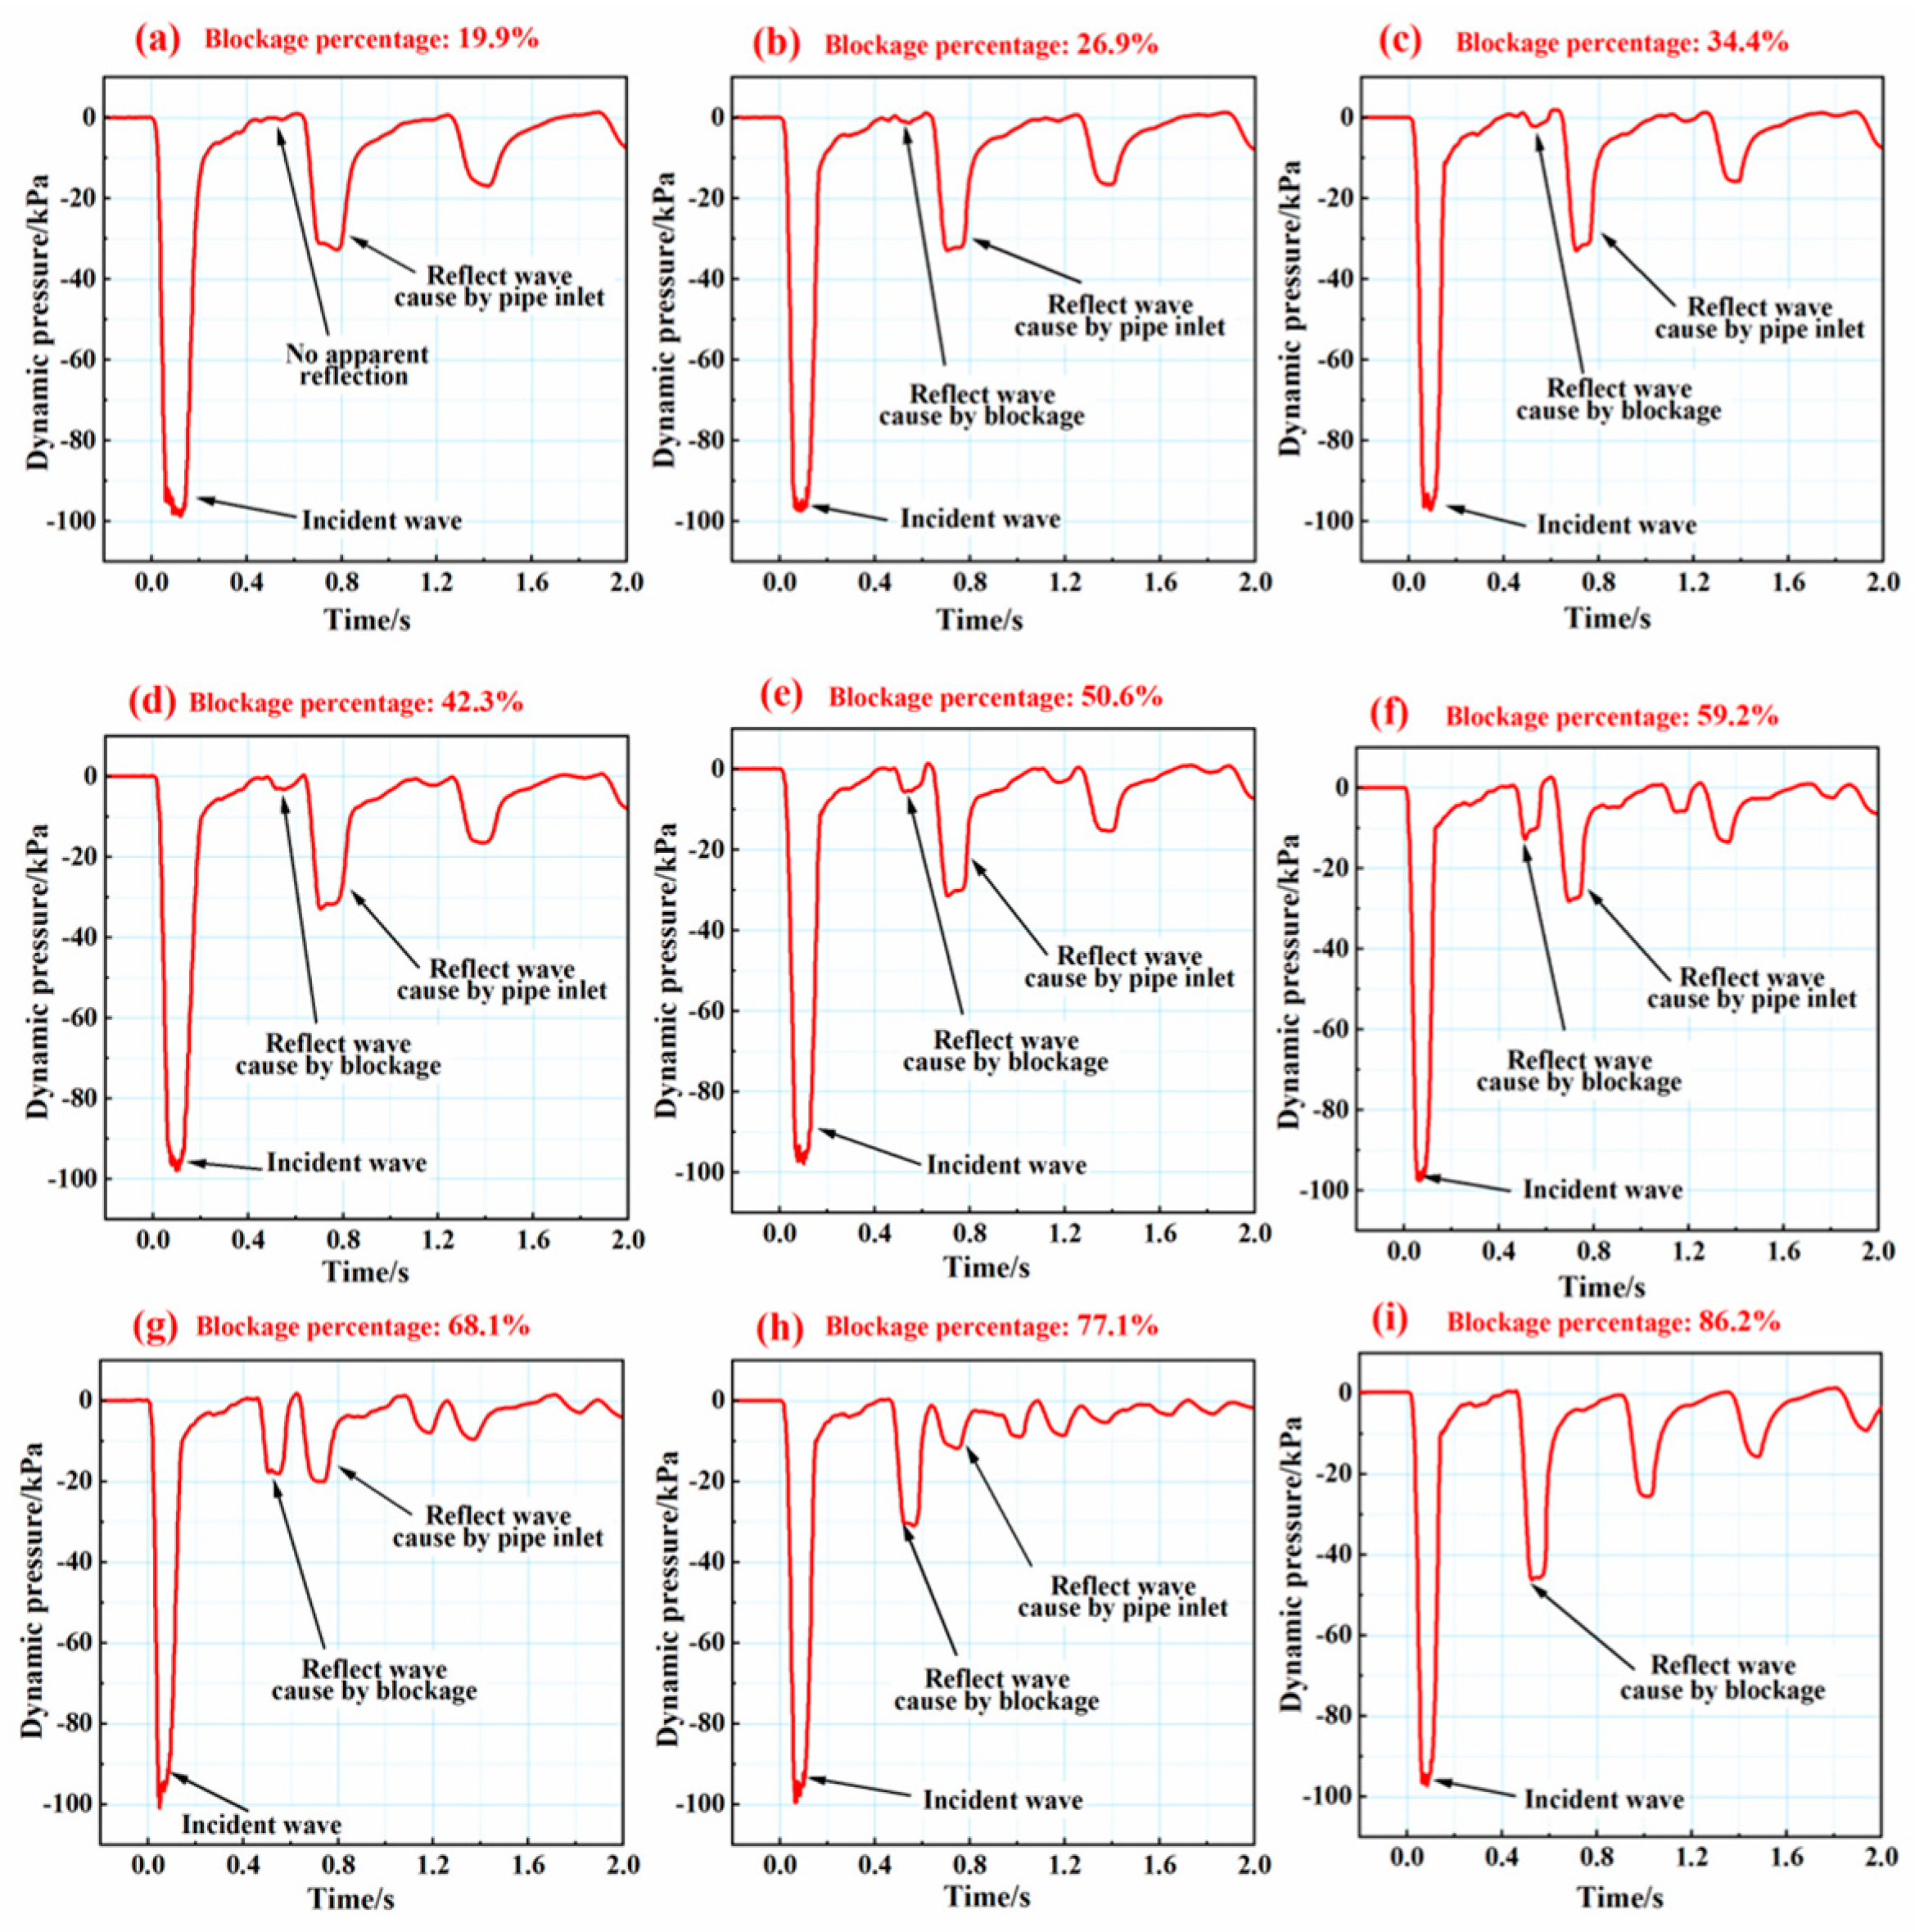
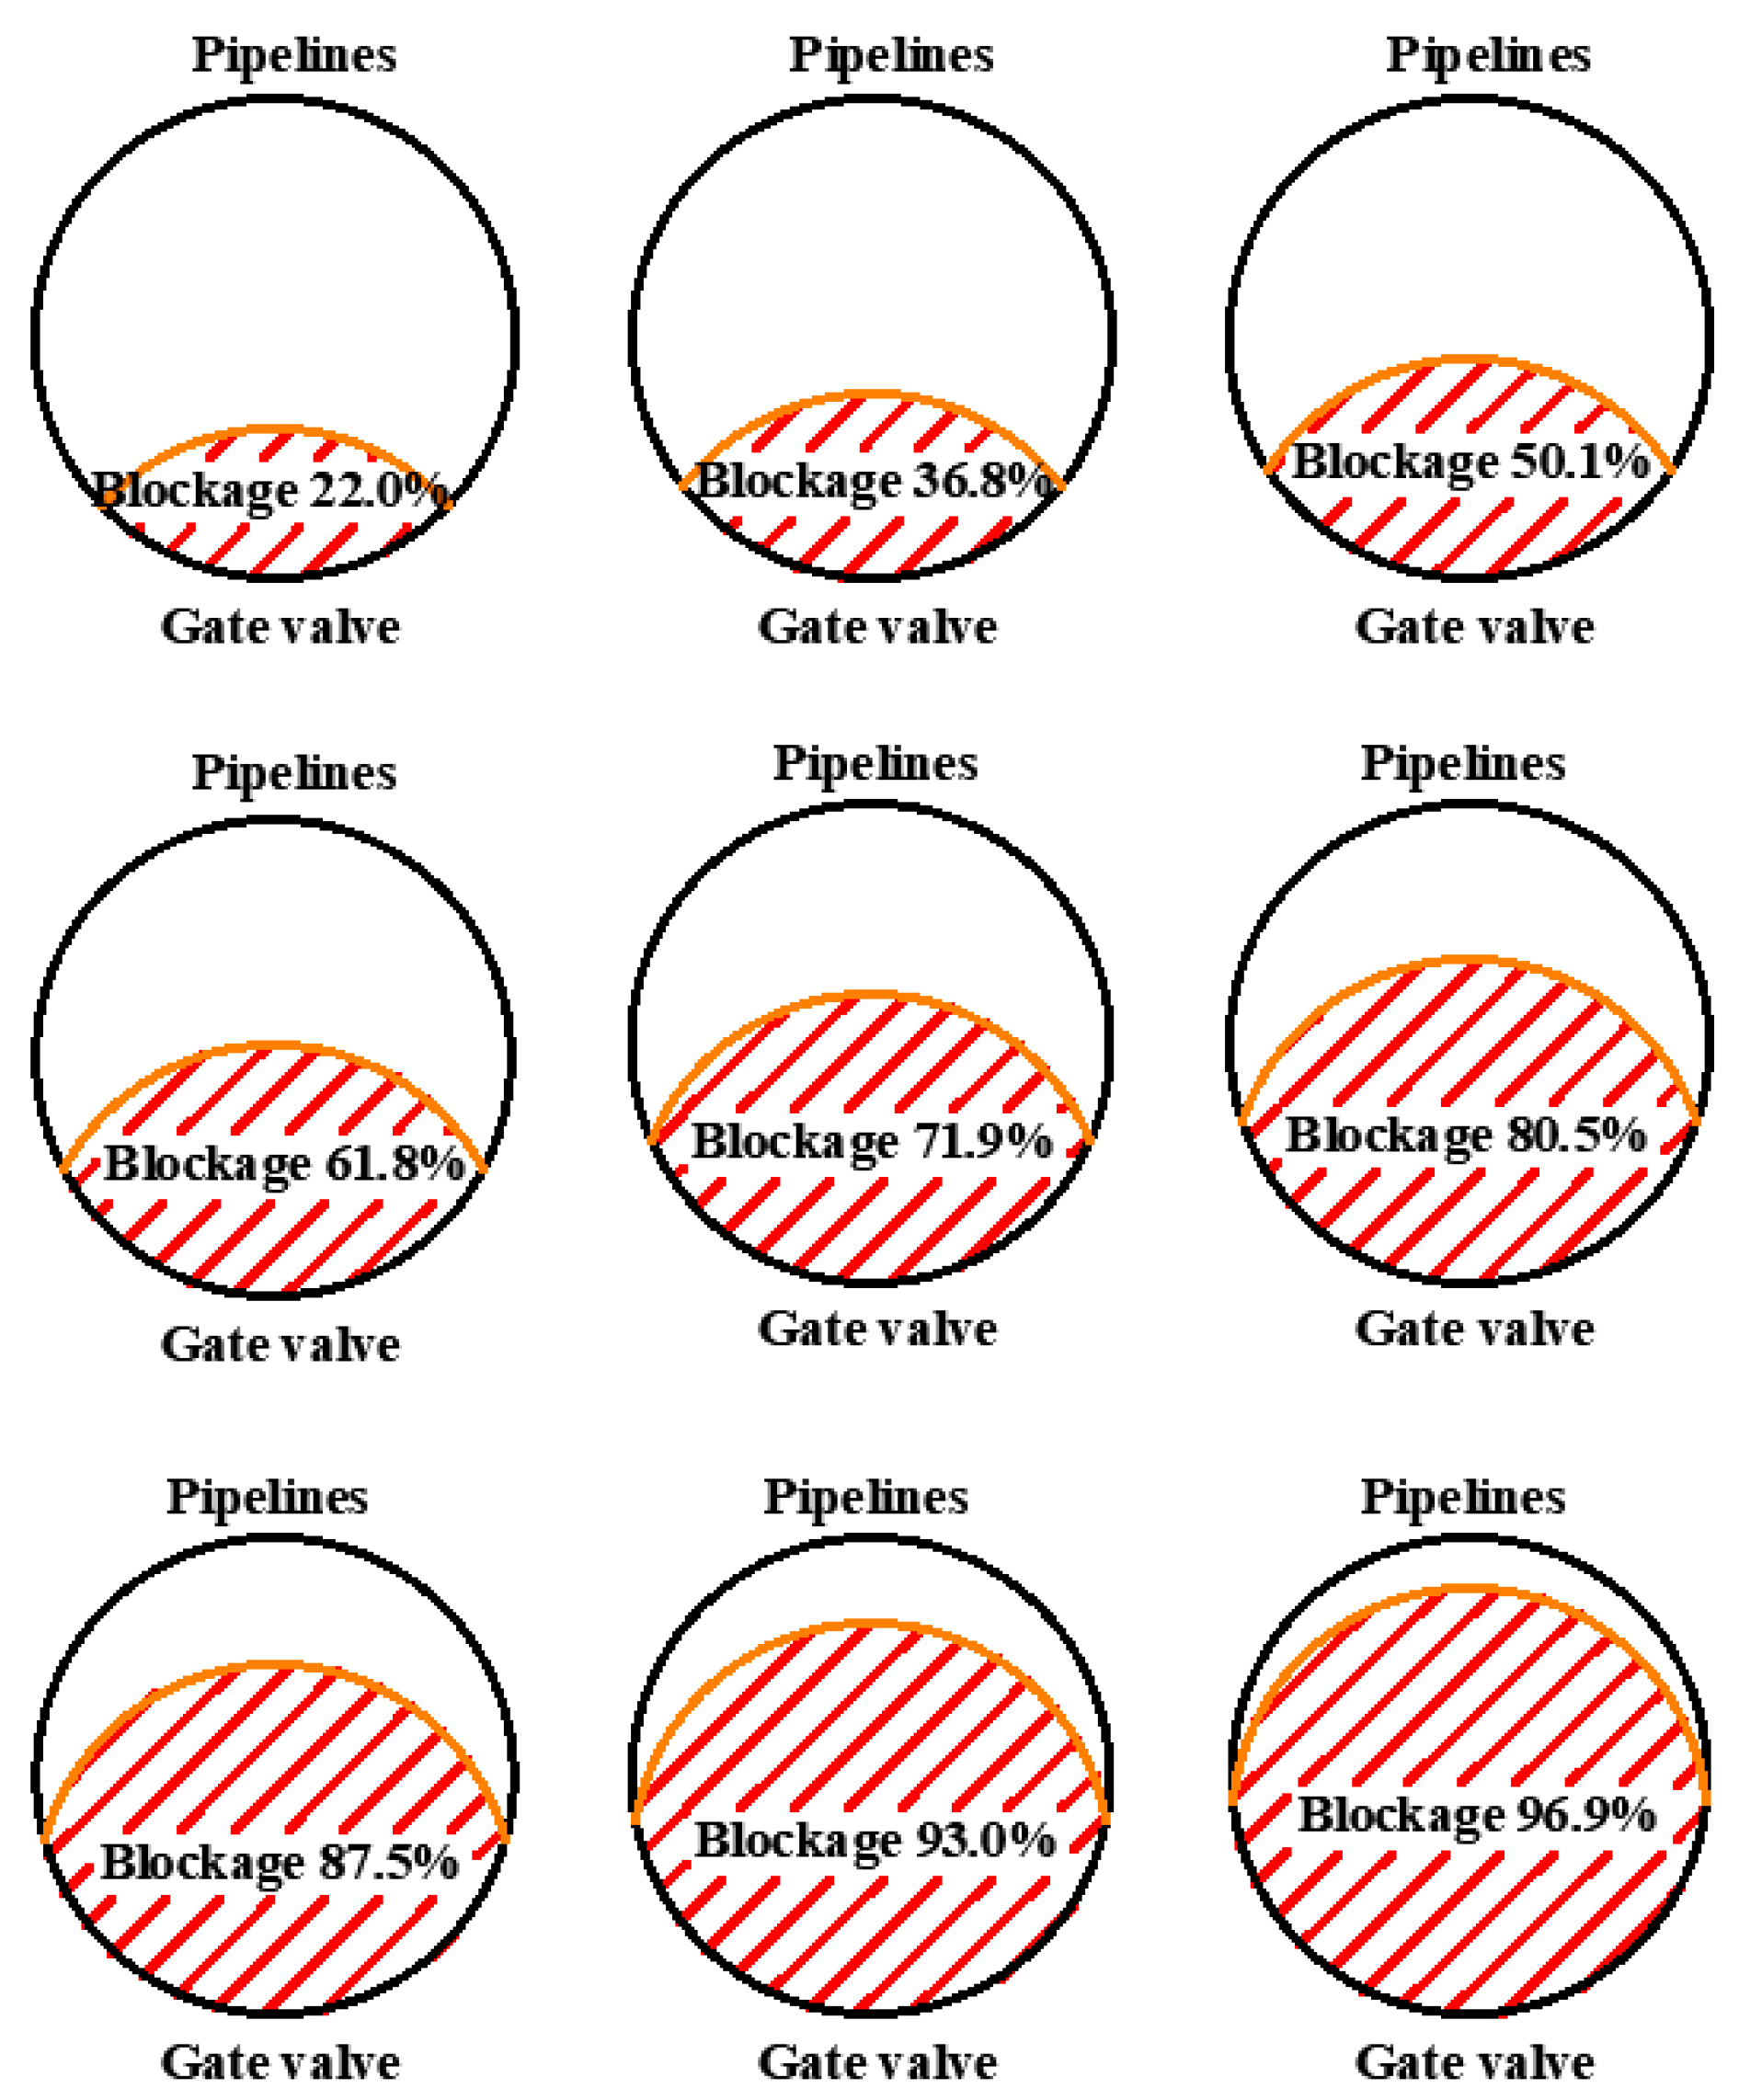
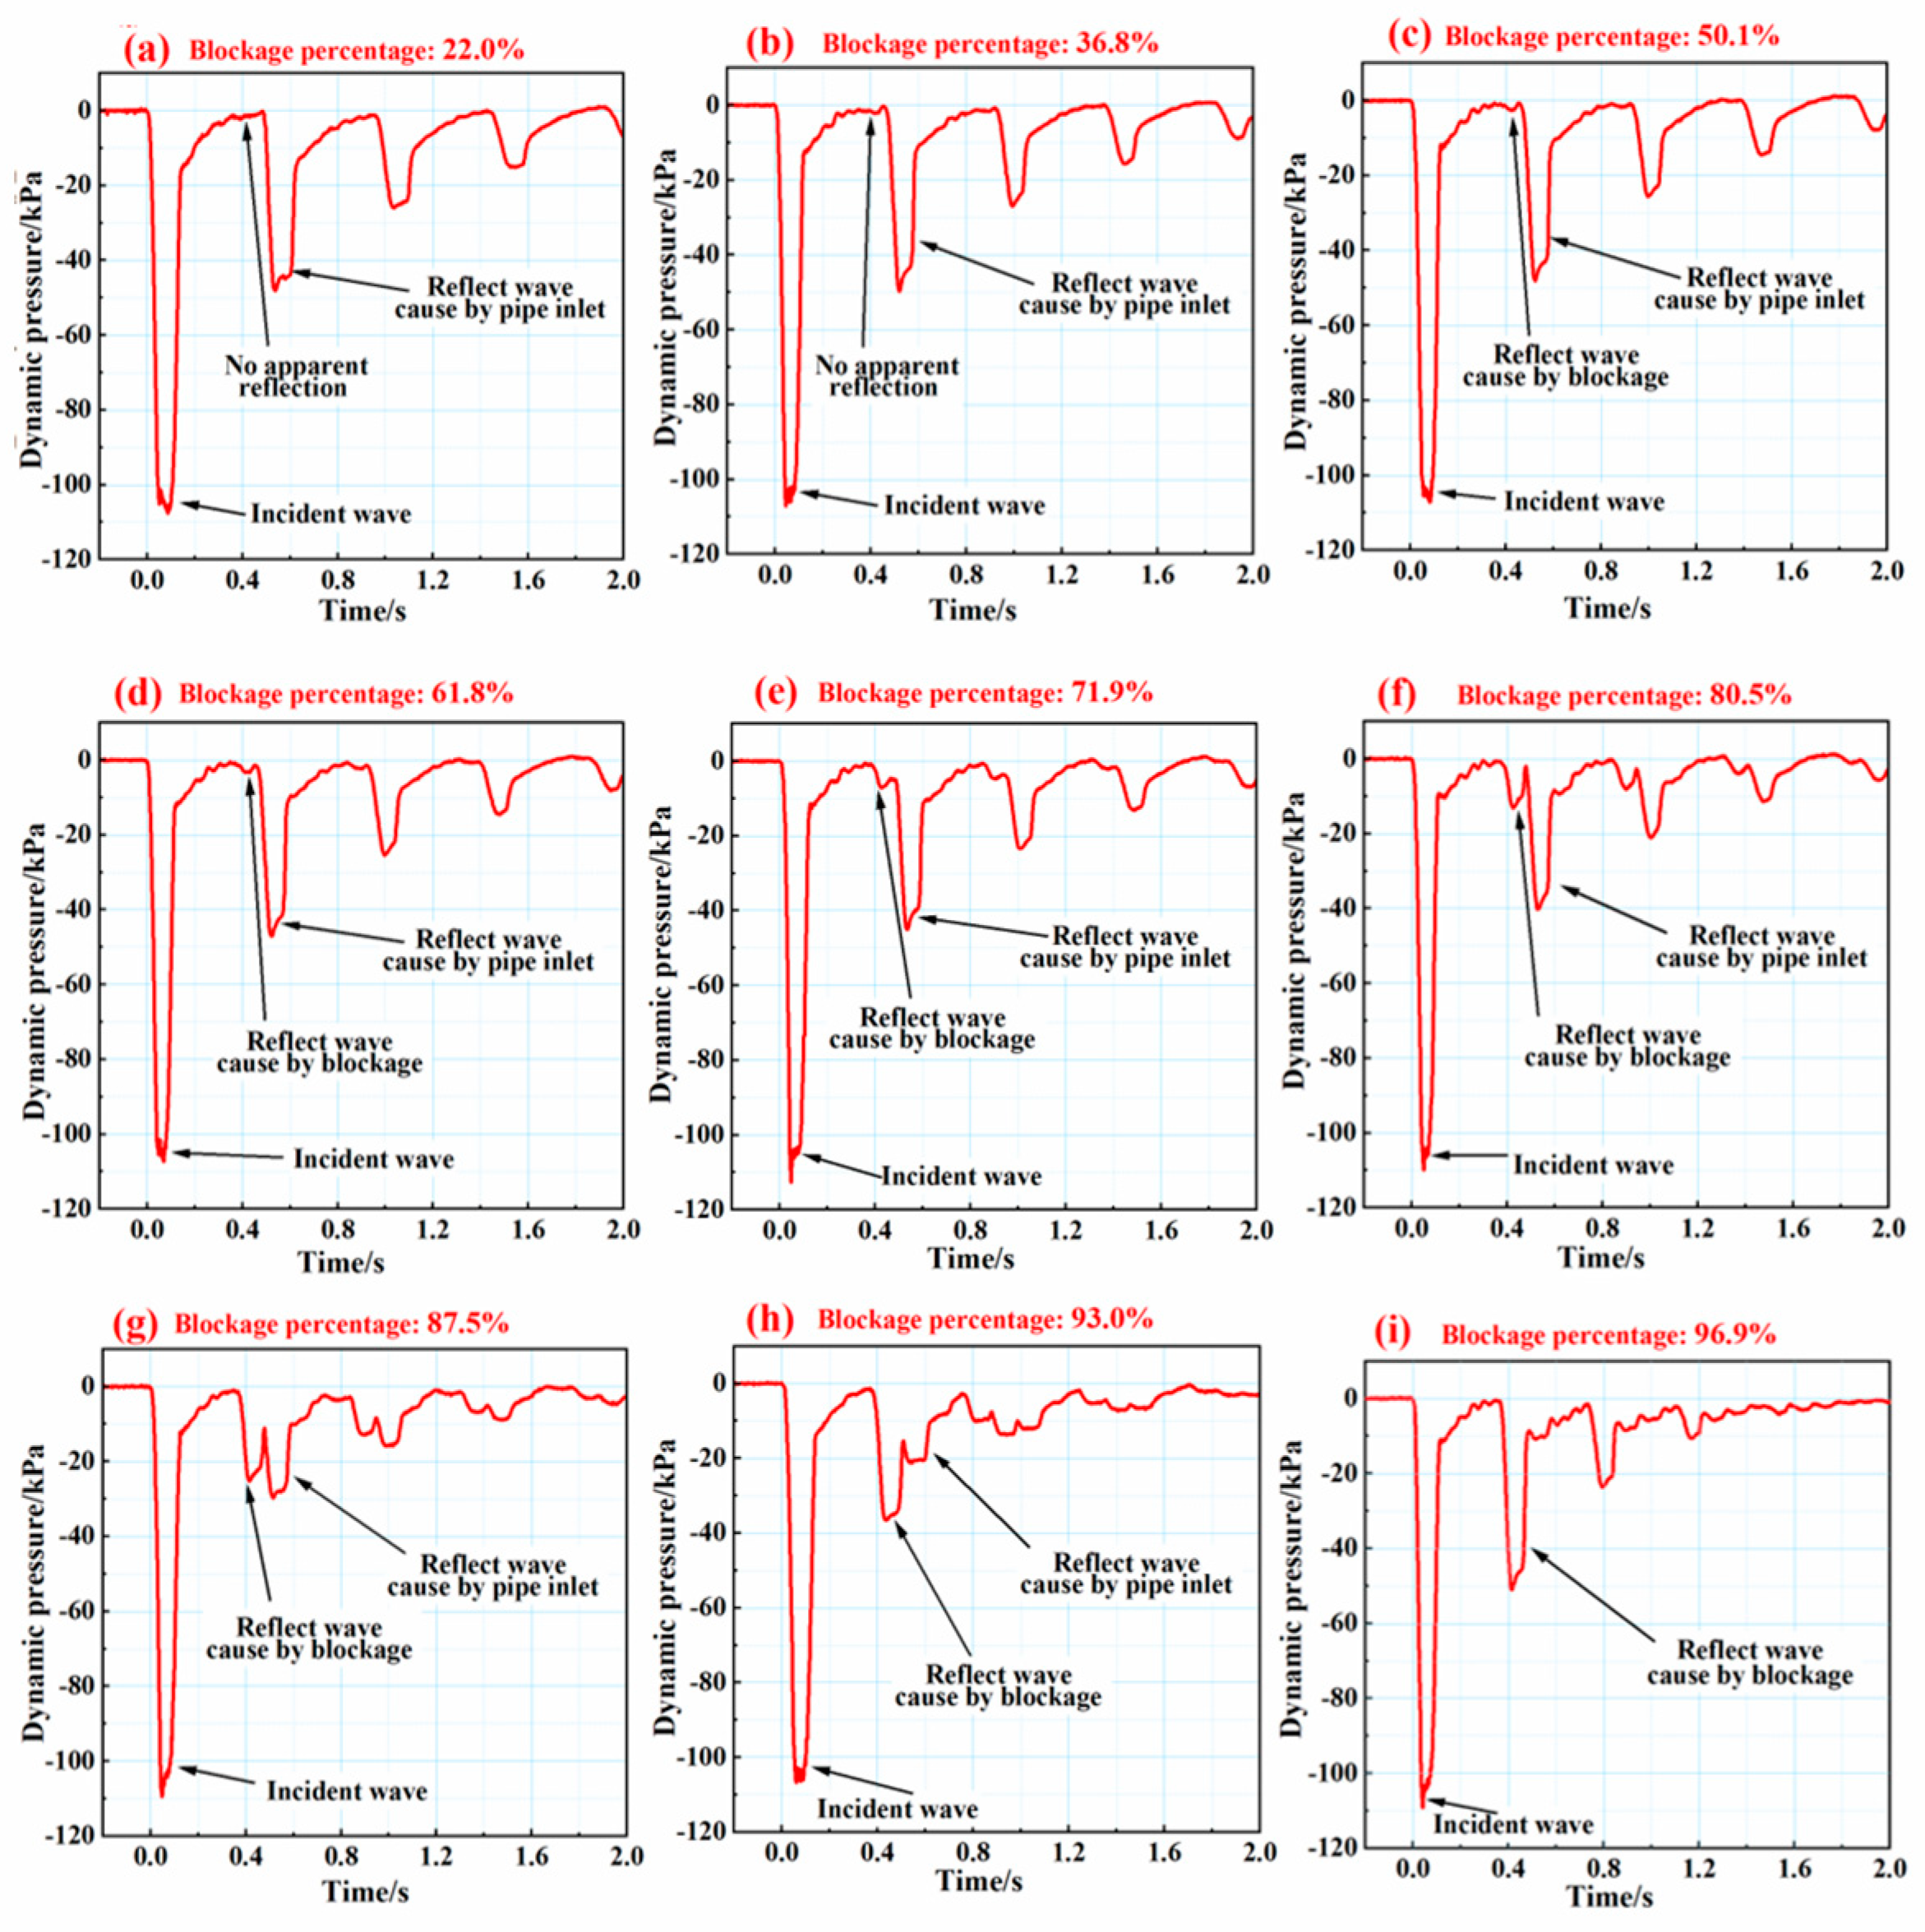
First, the blockage was simulated by installing metal rings of different sizes on a partial blockage section at a distance of 76.7 m from the dynamic pressure sensor. A total of nine sets of blockage detection experiments were conducted, in which the blockage percentage (ratio of blockage cross-section to pipe cross-section) ranged from 19.9% to 86.2%, and the simulated blockage shapes are shown in Figure 2. Each group of detection experiments was repeated several times to ensure the re-test reliability of the detection results. The variation of the pulse pressure wave signal pressure with time in one of the detection experiments is shown in Figure 3. According to the pressure wave propagation characteristics, it is known that the first wave is an incident wave, the second wave is a reflected wave caused by blockage, and the third wave is a reflected wave caused by pipeline inlet in the dynamic pressure signal. When the blockage percentage is high (96.9%), the reflectivity of the incident wave is also high, so the reflected wave signal is strong, while the transmitted wave signal passing through the blockage section is weak. Due to the high reflectivity of the blockage section, only part of the inlet reflected wave penetrates. Therefore, the reflected wave signal caused by the subsequent pipe inlet monitored by the dynamic pressure sensor is difficult to distinguish in Figure 3a. When the blockage percentage further decreases, the reflectivity of the blocked section decreases and the penetration rate increases. Therefore, the reflected wave amplitude caused by blockage decreases, and the reflected wave amplitude caused by pipeline inlet increases rapidly. This phenomenon is very obvious in Figure 3b–i. The waves reflected by the blockage can be observed in the range of 26.9% to 86.2% of the blockage percentage. When the blockage percentage drops below 36.8%, the reflected wave caused by blockage attenuates to a small extent. In addition, the distance between the blocked section and the pipeline inlet is short. The blocked reflected wave is submerged in the reflected wave caused by the pipeline inlet, which makes it difficult to distinguish the blocked reflected wave.
The nine tests were conducted in the 8-to-8.5 bar static pressure range. The experimental temperatures are about 20 °C. Based on the data measured in the experiment, the incident wave time (t1) and the reflected wave time (t2) caused by the pipe inlet are calculated. The length of the experimental pipe (l) is 106m. Due to the short experimental time, there is no obvious change in the pressure and temperature in the pipe. It is therefore possible to ignore changes in wave speed caused by the change of external conditions and regard the pressure wave propagation as an average velocity process. The wave velocity (u) is calculated as follows:
u = 2 l t 2 t 1
According to the wave velocity (u) and the reflected wave time (t3) caused by blockage, which is the time for the pulsed pressure wave to propagate from the sensor to the blockage section and then to be reflected back to the sensor, the predicted position (χ) of partial blocked sections is calculated as follows:
x = u ( t 3 t 1 ) 2
Since the experimental gas is compressed air, the dynamic viscosity (μ) of the gas is obtained. According to the amplitude (ΔP) and width (lp) of the pressure wave emitted from the experiment and the inner diameter (d) of the experimental pipe, the gas velocity of the pressure wave and the friction coefficient (λ) of the gas flow in the pipe are calculated as follows:
u x = Δ p 32 μ l p d 2
λ = 64 Re = 64 μ ρ u x d
The density (ρ) and specific heat (γ) of compressed air can be checked according to the experimental conditions. The angular frequency and inclination angle of the pressure pulse wave are obtained from the experimental data. The pulsed pressure wave has an exponential decay of the wave crest during the propagation. In addition, the attenuation coefficient (η) of the pressure wave in the pipeline is calculated via the calculation formula of pressure wave attenuation coefficient in the previous study by Meng et al. [24].
Therefore, the amplitude before and after the reflection of pressure wave at the blocking position can be calculated as follows:
P 2 = P 1 e η l
The amplitude before reflection (P3) is calculated by substituting the amplitude of the transmitted pressure wave (P1). The amplitude after reflection (P4) is calculated by substituting the amplitude of the reflected wave (P2) caused by blockage. Finally, the detailed derivation of the blockage percentage prediction formula can be understood based on the authors’ previous papers [22]. The prediction of blockage percentage (χ) is calculated as follows:
χ = 2 P 3 P 3 + P 4

3.2. Results

The results of the calculation of the blockage position and the percentage of blockage of the metal ring are shown in Table 1. From the first seven sets of experimental results, it can be seen that the maximum error of blockage position prediction is −4.9, and the average error is 3%, which shows that the blockage position prediction technique based on the pressure pulse wave method has a high degree of accuracy. The main reason for this error is that the solenoid valve cannot open and close exactly according to the set time, and the waveform measured in the experiment is not the ideal state of the pulse pressure wave. Nevertheless, the prediction of the blockage percentage was not sufficiently successful, with a maximum error of −20.6%, and the average error is −10.34%. The main reason for this result is the additional attenuation of the pressure wave caused by the friction of the main pipe wall and the inaccuracy of the pressure wave amplitude at the blockage calculated by the equation. At the same time, due to the nonlinear effect in the propagation of pressure wave, the reflected wave is distorted, and the amplitude of the reflected wave is deviated due to the absorption and transmission ability of blocking material in the reflection process, resulting in large prediction error of blocking percentage. In addition, according to the author’s previous research [25], the front edge of the blocking section with long continuity will produce the same negative pressure wave reflection signal as the incident wave, and the rear edge of the blocking section will produce the positive pressure wave reflection signal opposite to the incident wave. In this experiment, only the negative pressure wave reflection signal caused by the front edge of the blocking section is observed because the length of the blocking section in this experiment is too short (only 15 mm). It is much smaller than the pressure wave length. Therefore, the pressure wave reflection signals generated at the front and rear edges of the pressure wave overlap and cancel each other, and finally form the single negative pressure wave reflection signal shown in the figure, which is one of the reasons why the reflected wave amplitude decreases rapidly with the decrease in the blockage percentage (part of the negative pressure wave amplitude generated at the front edge of the blockage is offset by the positive pressure wave generated at the rear edge of the blockage).
In subsequent experiments, the metal ring in the partially blocked section was replaced with a gate valve to simulate different types of blockages. Nine sets of blockage detection experiments with different blockage percentages were then carried out by adjusting the gate valve opening, with blockage percentages ranging from 86.2% to 19.9%, and the simulated blockage shapes are shown in Figure 4. The experimental results are shown in Figure 5.
The experimental hydrostatic pressure and temperature were the same as in the previous experiments. The results of the calculation of the blockage position and the percentage of blockage of the gate vale are shown in Table 2. The maximum error in predicting the blockage position for the first eight experimental datasets was −4.1%, which is relatively accurate. However, the blockage percentage was poorly predicted, with a maximum error of -35.4%. In addition, contrary to the prediction of the blockage percentage of the metal ring, the predicted values of the blockage percentage are greater than the actual values. This shows that the length of the blockage (20 mm for gate valves) and the shape of the cross-section significantly affect the reflectivity of the pulse pressure wave when the blockage area is the same. If we want to further improve the accuracy of blockage percentage prediction, we need to optimize the blockage of different shapes on the basis of the existing treatment model so as to make it suitable for the blockage detection of complex shapes in the actual pipeline in order to improve the enforceability of the method.

4. Discussion

This research carried out a series of blockage detection experiments in laboratory pipes. The results of the experiments show that the pressure pulse wave blockage detection technique is more accurate in predicting the location, while the prediction of the blockage percentage still needs to be enhanced. Due to the wave distortion caused by the nonlinear effect in the wave propagation process and the energy dissipation in the wave reflection process, and the length of the blocking section in this experiment is very short, i.e., much shorter than the pressure wave length, resulting in the superposition and cancellation of the reflected waves at the front and back edges of the blocking. The detected reflected wave amplitude is less than that at the front of the blocking section, and the blockage percentage predications percentage is poor. Therefore, it is necessary to optimize the relevant calculation methods to improve the calculation accuracy of the blockage percentage. It was also found that the length of the blockage and the shape of the blockage cross-section also have a significant effect on the reflection percentage of the pressure wave. Therefore, it is necessary to add the influence of blockage length and cross-sectional shape to the subsequent optimization of the blockage area prediction equation.

5. Conclusions

Based on the experimental results, we conclude that:
(1)
The blockage detection based on pressure wave method has the advantages of high detection accuracy, simple operation, short detection time, low cost;
(2)
It was suitable for complex plugging conditions and has good reliability and practicability;
(3)
The data selection method and model establishment and calculation method adopted in this paper are more accurate for blocking location, but the prediction model for blocking percentage needs to be reasonably optimized.
Meanwhile, there are branch pipes, different blocking substances, and irregular blocking shapes in the gas transport pipelines, which will have varying degrees of impact on the blocking detection. Limited by the length of this article and the limitation of the experimental platform, this paper did not discuss these issues, which will feature in future works.

Author Contributions

K.Y.: Project administration, Funding acquisition. D.X.: Writing—original draft. Q.W.: Funding acquisition, Resources, Writing—review and editing. J.C.: Conceptualization, Methodology, Software, Investigation. S.Z.: Funding acquisition, Software, Investigation. J.Z.: Resources, Writing—review and editing, Project administration, Funding acquisition. All authors have read and agreed to the published version of the manuscript.

Funding

This study was supported by the National Natural Science Foundation of China (Grant Nos. 51904330), the Ministry of Science and Technology of Sinopec (A-535), and the open project of State Key Laboratory of chemical safety control (Grant Nos. 20200102).

Data Availability Statement

Data is contained within the article.

Conflicts of Interest

The authors declare no conflict of interest.

References

  1. Yuan, Z.; Deng, Z.; Jiang, M.; Xie, Y.; Wu, Y. A modeling and analytical solution for transient flow in natural gas pipelines with extended partial blockage. Nat. Gas Sci. Eng. 2015, 22, 141–149. [Google Scholar] [CrossRef]
  2. Wang, L.; Sun, X.; Shen, S.; Wu, P.; Liu, T.; Liu, W.; Zhao, J.; Li, Y. Undrained triaxial tests on water-saturated methane hydrate-bearing clayey-silty sediments of the South China Sea. Can. Geotech. J. 2021, 58, 351–366. [Google Scholar] [CrossRef]
  3. Wang, L.; Li, Y.; Wu, P.; Shen, S.; Liu, T.; Leng, S.; Chang, Y.; Zhao, J. Physical and mechanical properties of the overburden layer on gas hydrate-bearing sediments of the South China Sea. J. Pet. Sci. Eng. 2020, 189, 107020. [Google Scholar] [CrossRef]
  4. Wang, L.; Li, Y.; Shen, S.; Liu, W.; Sun, X.; Liu, Y.; Zhao, J. Mechanical Behaviors of Gas Hydrate-bearing Clayey Sediments of the South China Sea. Environ. Geotec. 2022, 9, 210–222. [Google Scholar] [CrossRef]
  5. Zhang, X.; Lee, B.; Sa, J.; Kinnari, K.; Askvik, K.; Li, X.; Sum, A. Hydrate management in deadlegs: Effect of header temperature on hydrate deposition. Energy Fuels 2017, 31, 11802–11810. [Google Scholar] [CrossRef]
  6. Scott, S.L.; Satterwhite, L.A. Evaluation of the backpressure technique for blockage detection in gas flowlines. J. Energy Resour. Technol. 1998, 120, 27–31. [Google Scholar]
  7. Mazzotti, M.; Khazaali, M.; Bocchini, P.; Di Lullo, A.; Marzani, A. Restrictions and obstructions detection in pipe networks using incomplete and noisy flow and pressure steady-state measurements. Struct. Control Health Monit. 2022, 29, e2854. [Google Scholar]
  8. Koyama, H.; Watanabe, K.; Himmelblau, D.M. Identification of partial plugging in a gas-transport pipeline by an acoustic method. Appl. Acoust. 1993, 40, 1–19. [Google Scholar] [CrossRef]
  9. Pratap, V.; Rajendran, S.; Agrawal, R.K.; Indimath, S.S.; Reddy, B.P.; Balamurugan, S. Blockage Detection in Gas Pipelines to Prevent Failure of Transmission Line. J. Pipeline Syst. Eng. Pract. 2021, 12, 04021031. [Google Scholar] [CrossRef]
  10. Bello, O.; Virani, N.; Oyadiji, S.O. Identification of blockage in a pipe using modal analysis. In Proceedings of the ASME 2011 International Design Engineering Technical Conferences & Computers and Information in Engineering Conference (IDETC/CIE), Washington, DC, USA, 28–31 August 2012; pp. 551–559. [Google Scholar]
  11. Duan, H.F.; Lee, P.J.; Ghidaoui, M.S.; Tuck, J. Transient wave-blockage interaction and extended blockage detection in elastic water pipelines. J. Fluids Struct. 2014, 46, 2–16. [Google Scholar] [CrossRef] [Green Version]
  12. Duan, H.F.; Lee, P.J. Transient-based frequency domain method for dead-end side branch detection in reservoir pipeline-valve systems. J. Hydraul. Eng. 2016, 142, 04015042. [Google Scholar] [CrossRef]
  13. Shi, W.; Yao, Y.; Cheng, S.; Shi, Z. Pressure transient analysis of acid fracturing stimulated well in multilayered fractured carbonate reservoirs: A field case in Western Sichuan Basin, China. J. Pet. Sci. Eng. 2019, 184, 106462. [Google Scholar] [CrossRef]
  14. Zhang, Y.; Duan, H.F.; Keramat, A.; Che, T.C. On the leak-induced transient wave reflection and dominance analysis in water pipelines. Mech. Syst. Signal Process. 2022, 167, 108512. [Google Scholar] [CrossRef]
  15. Duan, H.F.; Lee, P.J.; Ghidaoui, M.S.; Tung, Y.K. Extended blockage detection in pipelines by using the system frequency response analysis. J. Water Resour. Plan. Manag. 2012, 138, 55–62. [Google Scholar] [CrossRef]
  16. Lee, P.J.; Vítkovský, J.P.; Lambert, M.F.; Simpson, A.R.; Liggett, J.A. Discrete blockage detection in pipelines using the frequency response diagram: Numerical study. J. Hydraul. Eng. 2008, 134, 658–663. [Google Scholar] [CrossRef] [Green Version]
  17. Meniconi, S.; Brunone, B.; Ferrante, M. Water-hammer pressure waves interaction at cross-section changes in series in viscoelastic pipes. J. Fluids Struct. 2012, 33, 44–58. [Google Scholar] [CrossRef]
  18. Meniconi, S.; Duan, H.F.; Lee, P.J.; Brunone, B.; Ghidaoui, M.S.; Ferrante, M. Experimental investigation of coupled frequency and time-domain transient test–based techniques for partial blockage detection in pipelines. J. Hydraul. Eng. 2013, 139, 1033–1040. [Google Scholar] [CrossRef]
  19. Adewumi, M.; Eltohamie, E.; Solaja, A. Possible detection of multiple blockages using transients. J. Energy Resour. Technol. 2003, 125, 154–159. [Google Scholar] [CrossRef]
  20. Adeleke, N.; Ityokumbul, M.T.; Ademumi, M. Blockage detection and characterization in natural gas pipelines by transient pressure-wave reflection analysis. SPE J. 2013, 18, 355–365. [Google Scholar] [CrossRef]
  21. Stewart, N.; Jack, G. Pipeline blockage location by pressure wave analysis. In Proceedings of the Abu Dhabi International Petroleum Exhibition & Conference, Abu Dhabi, United Arab Emirates, 13–16 November 2017. [Google Scholar]
  22. Chu, J.; Liu, Y.; Song, Y.; Yang, L.; Li, X.; Yan, K.; Zhao, J. Experimental platform for blockage detection and investigation using propagation of pressure pulse waves in a pipeline. Measurement 2020, 160, 107877. [Google Scholar] [CrossRef]
  23. Chu, J.; Yang, L.; Liu, Y.; Song, Y.; Yu, T.; Lv, X.; Li, Q.; Zhao, J. Pressure pulse wave attenuation model coupling waveform distortion and viscous dissipation for blockage detection in pipeline. Energy Sci. Eng. 2020, 8, 260–265. [Google Scholar] [CrossRef] [Green Version]
  24. Meng, Y.; Li, H.; Li, G.; Zhu, L.; Wei, N.; Lin, N. Investigation on propagation characteristics of the pressure wave in gas flow through pipes and its application in gas drilling. J. Nat. Gas Sci. Eng. 2015, 22, 163–171. [Google Scholar] [CrossRef]
  25. Chu, J.; Liu, Y.; Lv, X.; Li, Q.; Dong, H.; Song, Y.; Zhao, J. Experimental investigation on blockage predictions in gas pipelines using the pressure pulse wave method. Energy 2021, 230, 120897. [Google Scholar] [CrossRef]
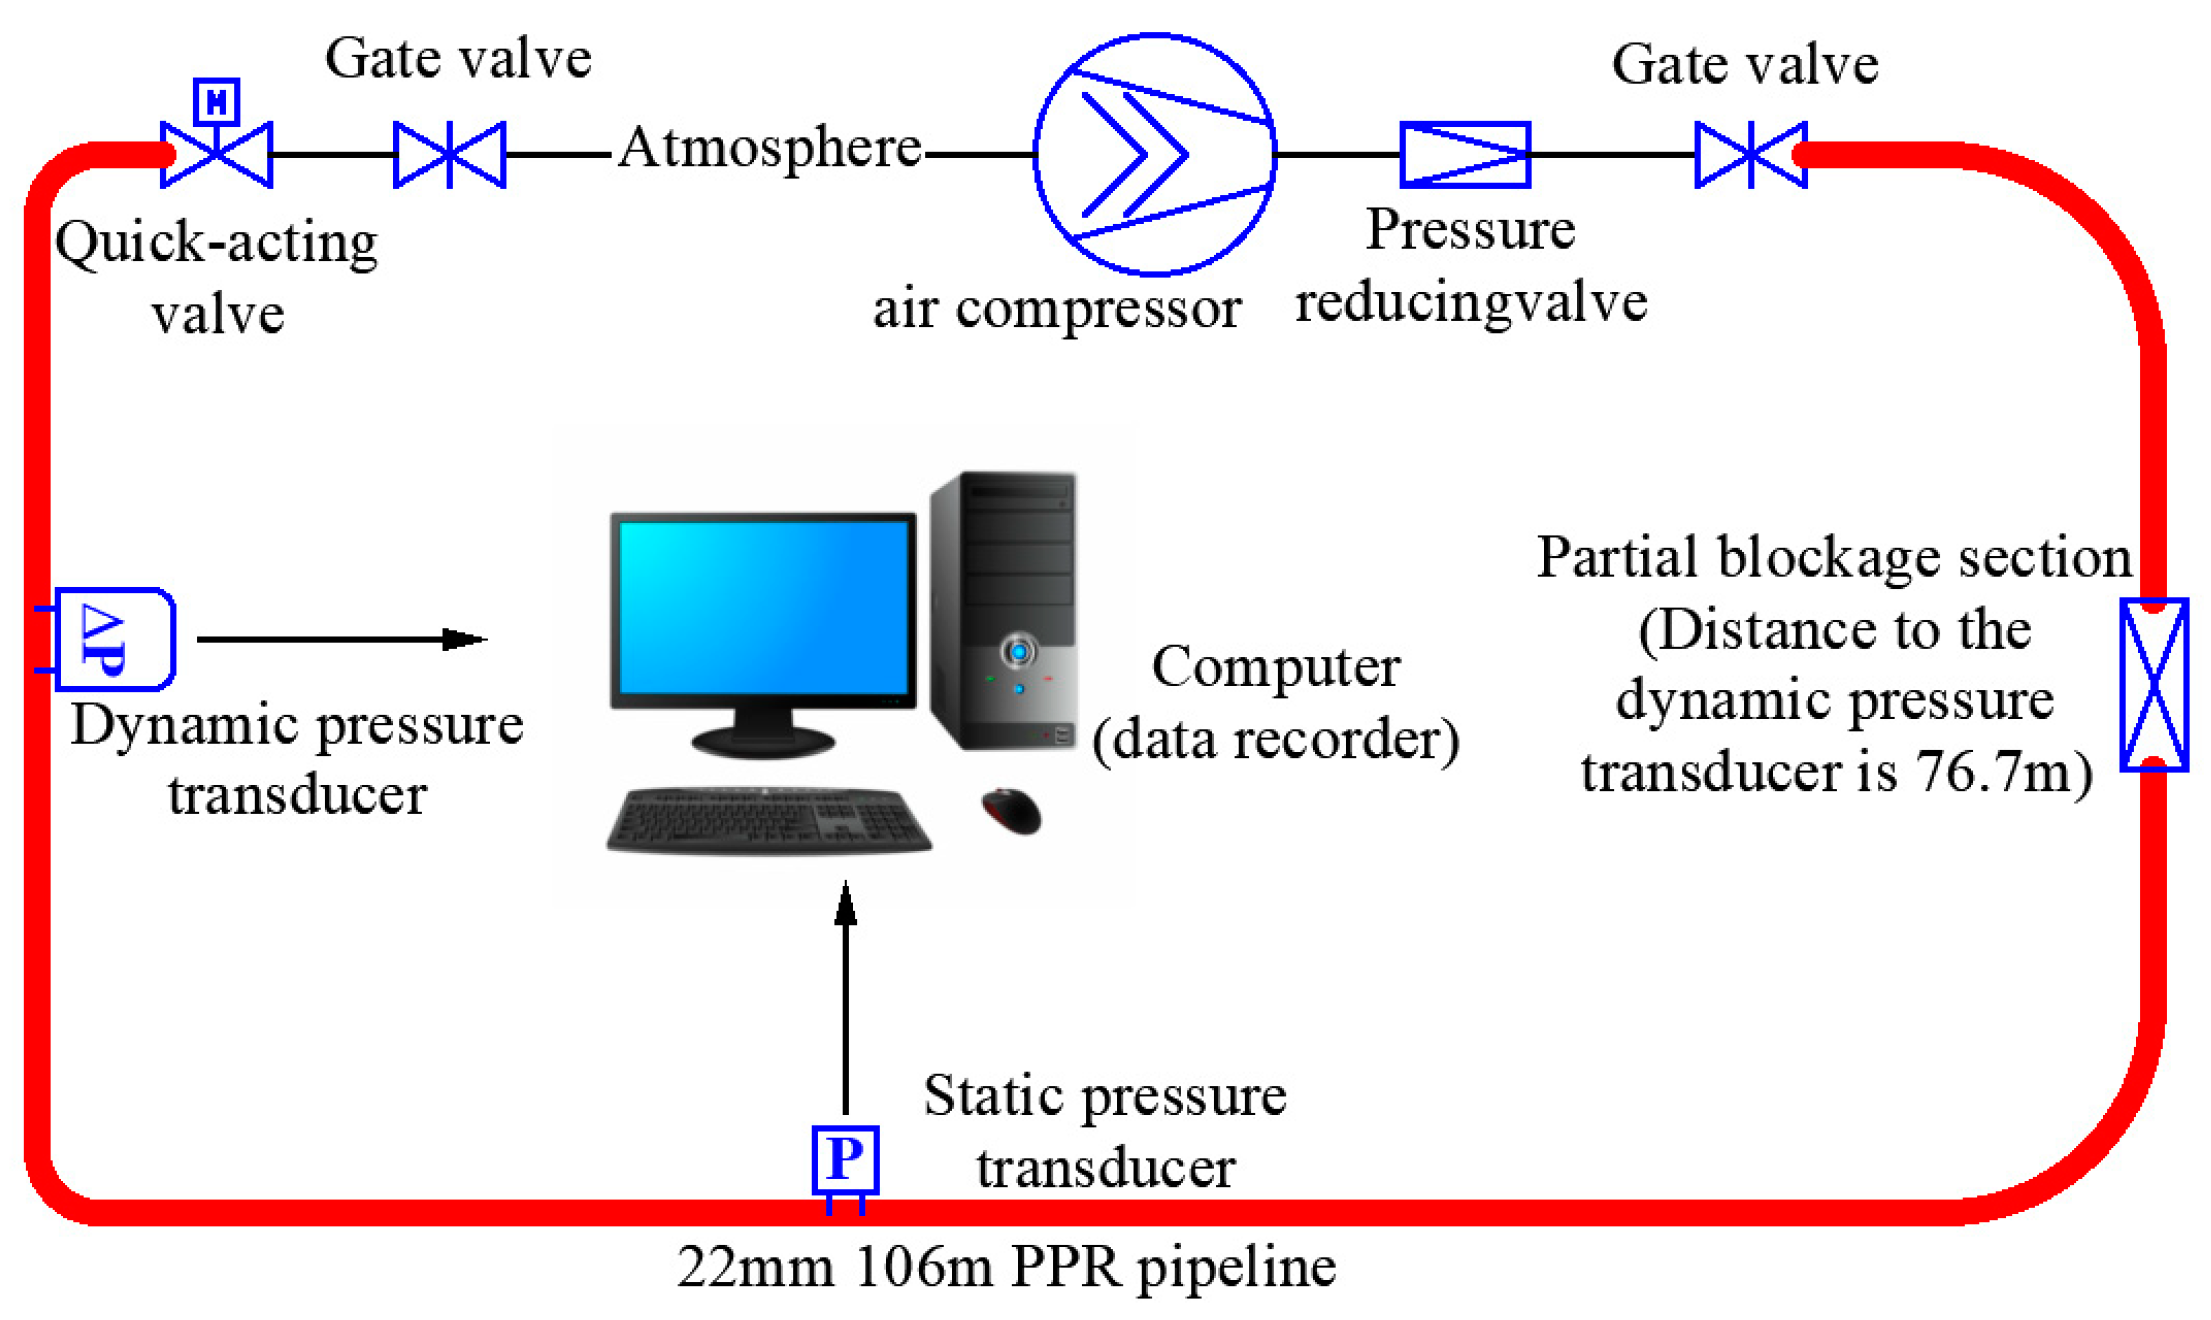
Figure 1. A schematic of the test rig.
Energies 16 05620 g001
Figure 2. A list of the metal ring blockages at various dimensions.
Energies 16 05620 g002
Figure 3. The results of blockage detection experiments simulated by the metal rings.
Energies 16 05620 g003
Figure 4. A list of the valve blockages at various openings.
Energies 16 05620 g004
Figure 5. The results of blockage detection experiments simulated by the valves.
Energies 16 05620 g005
Table 1. The calculated results of blockage detection experiments based on simulations of the metal rings.
CaseBlockage LocationBlockage Percentage
Pred. (m)Real. (m)%ErrPred.Real.%Err
161.459.4−3.448.1%50.1%−4
260.259.4−1.551.2%61.8%−20.6
362.359.4−4.961.2%71.9%−17.5
461.959.4−4.270.1%80.5%−14.8
560.759.4−2.381.7%87.5%−7.1
661.159.4−2.888.7%93.0%−4.8
760.559.4−1.993.6%96.9%−3.6
Table 2. The calculated results of blockage detection experiments based on simulations of the gate valve.
CaseBlockage LocationBlockage Percentage
Pred. (m)Real. (m)%ErrPred.Real.%Err
179.976.7−4.141.6%26.9%35.4
279.576.7−3.646.5%34.4%26.1
379.976.7−4.151.1%42.3%17.2
479.976.7−4.158.9%50.6%14.1
577.176.7−0.470.8%59.2%16.3
677.876.7−1.476.1%68.1%10.6
777.876.7−1.485.2%77.1%9.5
877.476.7−0.992.1%86.2%6.5
Disclaimer/Publisher’s Note: The statements, opinions and data contained in all publications are solely those of the individual author(s) and contributor(s) and not of MDPI and/or the editor(s). MDPI and/or the editor(s) disclaim responsibility for any injury to people or property resulting from any ideas, methods, instructions or products referred to in the content.