Article

Thermohydraulic Efficiency of a Solar Air Heater in the Presence of Graded Aluminium Wire Mesh—A Combined Experimental–Numerical Study

by
Rawal Diganjit
1,
Nagaranjan Gnanasekaran
1,* and
Moghtada Mobedi
2,*
1
Department of Mechanical Engineering, National Institute of Technology, Surathkal, Mangalore 575025, India
2
Mechanical Engineering Department, Faculty of Engineering, Shizuoka University, 3-5-1 Johoku, Naka-ku, Hamamatsu-shi 432-8561, Japan
*
Authors to whom correspondence should be addressed.
Energies 2023, 16(15), 5633; https://doi.org/10.3390/en16155633
Submission received: 30 June 2023 / Revised: 19 July 2023 / Accepted: 24 July 2023 / Published: 26 July 2023
(This article belongs to the Section J1: Heat and Mass Transfer)

Abstract

:
In this work, aluminium wire mesh (WM) samples with 3, 9, and 18 pores per inch (PPI) and porosities of 0.894, 0.812, and 0.917, respectively, were combined together to form graded structures including 3-9-18, 9-18-3, and 18-3-9 PPIs. A 5 mm thickness for each WM was considered for a length of 2 m and inserted into a single-pass solar air heater (SAH) in which the height of the SAH was 120 mm. For the numerical analysis, a 3D numerical model was considered in ANSYS fluent software, and the Rosseland radiation model renormalization group (RNG) k-ε enhanced wall function was incorporated to account for solar radiation. The local thermal equilibrium (LTE) model was considered to obtain the heat-transfer characteristics of the WM. The numerical results of the thermohydraulic performance parameter (THPP) of the 9-18-3 PPI WM were 13.04% and 11.92% higher than the 3-9-18 and 18-3-9 PPI samples, respectively. Later, 25% of the 9-18-3 graded wire mesh (GWM) was considered at four different locations, i.e., 0, 0.5, 1, and 1.5 m away from the inlet, and analysed to obtain the best location for efficient heat transfer. The computational results show that 1.5 m away from the inlet is the best location among the different locations considered. The experimental results of the GWM at 1.5 m away from the inlet demonstrated a 20.91% and 23.32% increase in thermal efficiency compared to the empty channel for the 0.027 kg/s and 0.058 kg/s mass flow rates, respectively. From numerical-cum-experimental analysis, it was found that inserting 25% length of GWM of the entire length of the test section at a distance of 1.5 m from the inlet in single pass SAH improves the overall performance of the empty channel of single-pass SAH.

1. Introduction

Solar energy is freely and readily available. Nowadays, the maximum utilisation of solar energy is highly important to minimize global dependency on non-renewable energy sources. The electric heater is more effective because it is useful in both day- and night-time settings and also in any season, and it has a fast drying capacity with a constant temperature. At the same time, it has several drawbacks such as a high cost, requirement for skilled workers, and complicated design, and electricity is also very much required. Hence, the single-pass solar air heater (SAH) is the most beneficial and least costly product to reduce the dependency on the electric heater. The single-pass SAH has a simple design, low cost, is easy to operate and manufacture, and requires little maintenance. The drawback of the single-pass SAH is its low efficiency as a result of the greater volume of air. The thermal efficiency of SAHs can be improved by the use of fins, porous media arrangements in the test section of the SAH [1,2]. Many researchers prefer porous media over fins in order to save on material costs. The fins have an extended surface with a complete solid shape. The porous media has a pore-like structure in which the air flows between the space available in the metal foam and the pitch of the wires in the wire mesh. The use of a porous medium like metal foam, wire mesh, and round-shaped marbles can be helpful in increasing the heat-transfer rate in thermal application devices. Porous media is used in thermal applications such as heat exchangers [3,4], vertical channels [5,6,7], heat storage systems [8,9], and solar applications [10,11,12,13,14].
The single-pass SAH inserting an Al wire mesh with a porosity of 0.96 to 0.98 obtained a thermal efficiency of up to 75% for a 0.038 kg/s mass flow rate [15]. Sharma et al. [16] experimentally investigated the thermal efficiency using wire matrices with a porosity of 0.875 to 0.953 in single-pass SAH. The authors obtained a rise in thermal efficiency from 23% to 61% for five different wire matrices having different wire diameters and pitches of the wire matrices for 0.0159 to 0.0318 kg/s mass flow rates. The authors observed that a greater amount of energy was obtained from higher values of volumetric thermal capacity in the wire matrices. It is beneficial to transfer the maximum energy to the air from porous wire matrices. It reduces the thermal losses from the porous bed to the atmosphere. It also reduces the absorber plate temperature. Similarly, Ahmad et al. [17] experimentally studied the thermohydraulic efficiency of single-pass SAH for iron wire meshes with a porosity of 0.823 to 0.968 considering the mass flow rate as 0.0138 to 0.0252 kg/s. The authors obtained a greater thermohydraulic efficiency using a lower porosity of wire mesh. The authors noticed an increase in the superficial velocity of the fluid as the porosity of wire mesh decreased. In addition, the friction losses are greater, which results in a lower thermohydraulic efficiency. Varshney and Saini [18] and Thakur et al. [19] studied the heat transfer and friction factor relation for SAH using different wire diameters and pitches of wire meshes for higher and lower porosities of wire mesh. The authors noticed that the ratio of the pitch-to-wire diameter plays a significant role in determining the thermal performance of the SAH. The authors noticed that the higher the ratio of the pitch-to-wire diameter, the greater the heat transfer from the wire mesh to the air because of the effect of vortex shedding. Similarly, Mittal and Varshney [20] theoretically studied the thermohydraulic efficiency of single-pass SAH for a mass flow rate from 0.005 to 0.05 kg/s. The authors measured a maximum thermohydraulic efficiency of 70% for the wire mesh with a porosity of 0.887 to 0.958. The authors observed that the performance of the SAH with a wire mesh depends not only on the porosity but also on the pitch and wire diameter. As the mass flow rate increases, the effective efficiency increases. Singh and Panwar [21] analysed the effects of different thermal conductivities of the material and different geometries of wire meshes in single-pass SAH. The authors concluded that the thermal performance of SAH is less dependent on the thermal conductivity of the wire-mesh material. The author observed that a significant change occurred in the performance of the SAH due to the extinction coefficient of wire mesh. The advantage of the minimum value of extension coefficients is a greater absorption of solar intensity and lower thermal losses. Similarly, Chouksey and Sharma [22] and Sharma et al. [23] proved that a wire mesh with a different porosity was the best option to increase energy efficiency. The energy efficiency increases as the mass flow rate increases. The above research shows that a fully filled wire mesh in single-pass SAH can improve the thermal efficiency of an SAH by more than 35%.
Similarly, certain researchers have investigated the insertion of a partially filled wire mesh with different orientations to improve the thermal performance of single-pass SAHs. Single-pass SAHs produced a better rise in temperature at the outlet by inserting a partially filled wire mesh in a number of studies: Abed et el. [24] utilised a ‘U’-type arrangement of aluminium wire mesh and compared it with ‘V’-type soft steel wire mesh as a corrugated absorber; Devecioglu et al. [25] utilised a copper wire mesh at four equal distances in the vertical direction, i.e., keeping perpendicular to the absorber plate; Ghritlahre et al. [26] and Rajarajeswari et al. [27] utilised a mesh in the diagonal direction lower side at the inlet and upper side at the outlet of an SAH; Sozen et al. [28] utilised an iron wire mesh, keeping at 100 mm equal intervals of distance perpendicular to the absorber plate; and Jalil and Ali [29] utilised steel wool and six layers at equal distances of stainless steel wire mesh, which improved the thermal performance of a single-pass SAH.
Recently, a partially filled wire mesh inserted into a single-pass SAH by different authors has been found to enhance the thermal efficiency. The thermal efficiency improved by 34% to 82%, keeping the vertical direction at four equal distances, in a study by Devecioglu et al. [25]; by 15% to 88% using a copper wire mesh of different porosity in a study by Rajarajeswari et al. [27]; and by 59.94% to 67.69% using an iron mesh with hollow-tube SAH in a study by Sozen et al. [28]. Similar improvements of 79.83% and 76% were found with steel wool and stainless steel wire mesh, respectively, in a study by Jalil and Ali [29]; and improvements of 56.32% to 71.30% for aluminium wool were observed in a study by Sozen et al. [30], measuring the energy efficiency of single-pass SAH.
The single-pass SAH with a single-type horizontally arranged WM has been studied widely by many authors. Hence, from the above literature, it can be observed that the single type of PPI, porosity, and pitch-to-wire diameter of the wire mesh inserted in single-pass SAHs have been studied, and a comparative analysis of SAHs’ thermal efficiency and thermohydraulic efficiency has been conducted. The literature shows that wire mesh is the best option to enhance the heat transfer in the SAH because of its availability, simple design, less material cost, less transportation cost, and appropriate pore structure. However, the literature shows that combinations of different PPIs, porosities, and pitch-to-wire diameters of the wire mesh have not been studied until today. The effect on the thermal performance of combining different PPIs and porosities has not been investigated numerically and experimentally to date. In particular, until today, the combination of three porosities of the same WM material in a single-pass SAH to improve its thermal efficiency has not been analysed in the research literature. Hence, the present paper aims to study the thermal performance of a single-pass SAH with three different types of PPI and porosity in aluminium wire mesh.
Hence, the objective of this study is (i) to evaluate the thermal performance of a single-pass SAH with a varying mass flow rate at different solar intensities and inlet temperatures; and (ii) to calculate the THPP of the three different porosities of 5 mm thickness of a combined WM arranged one over the other (Case 3-9-18 PPI, 9-18-3 PPI, and 18-3-9 PPI). From the results, the best combination is selected for further study, using a wire mesh of 25% of the entire length of test section at four different locations. To reduce the cost of the wire mesh, numerical simulations are performed at four different locations for the 25% length of the WM relative to the full-length test section at a distance of 0, 0.5, 1, and 1.5 m from the inlet, respectively. Further, a comparison study is made between the 25% filled conditions of all of the four cases considered above. To buttress the numerical results, experiments are performed for the case of 25% length of WM at a distance of 1.5 m from the inlet. The organization of the present paper is shown in Figure 1.

2. Materials and Methods

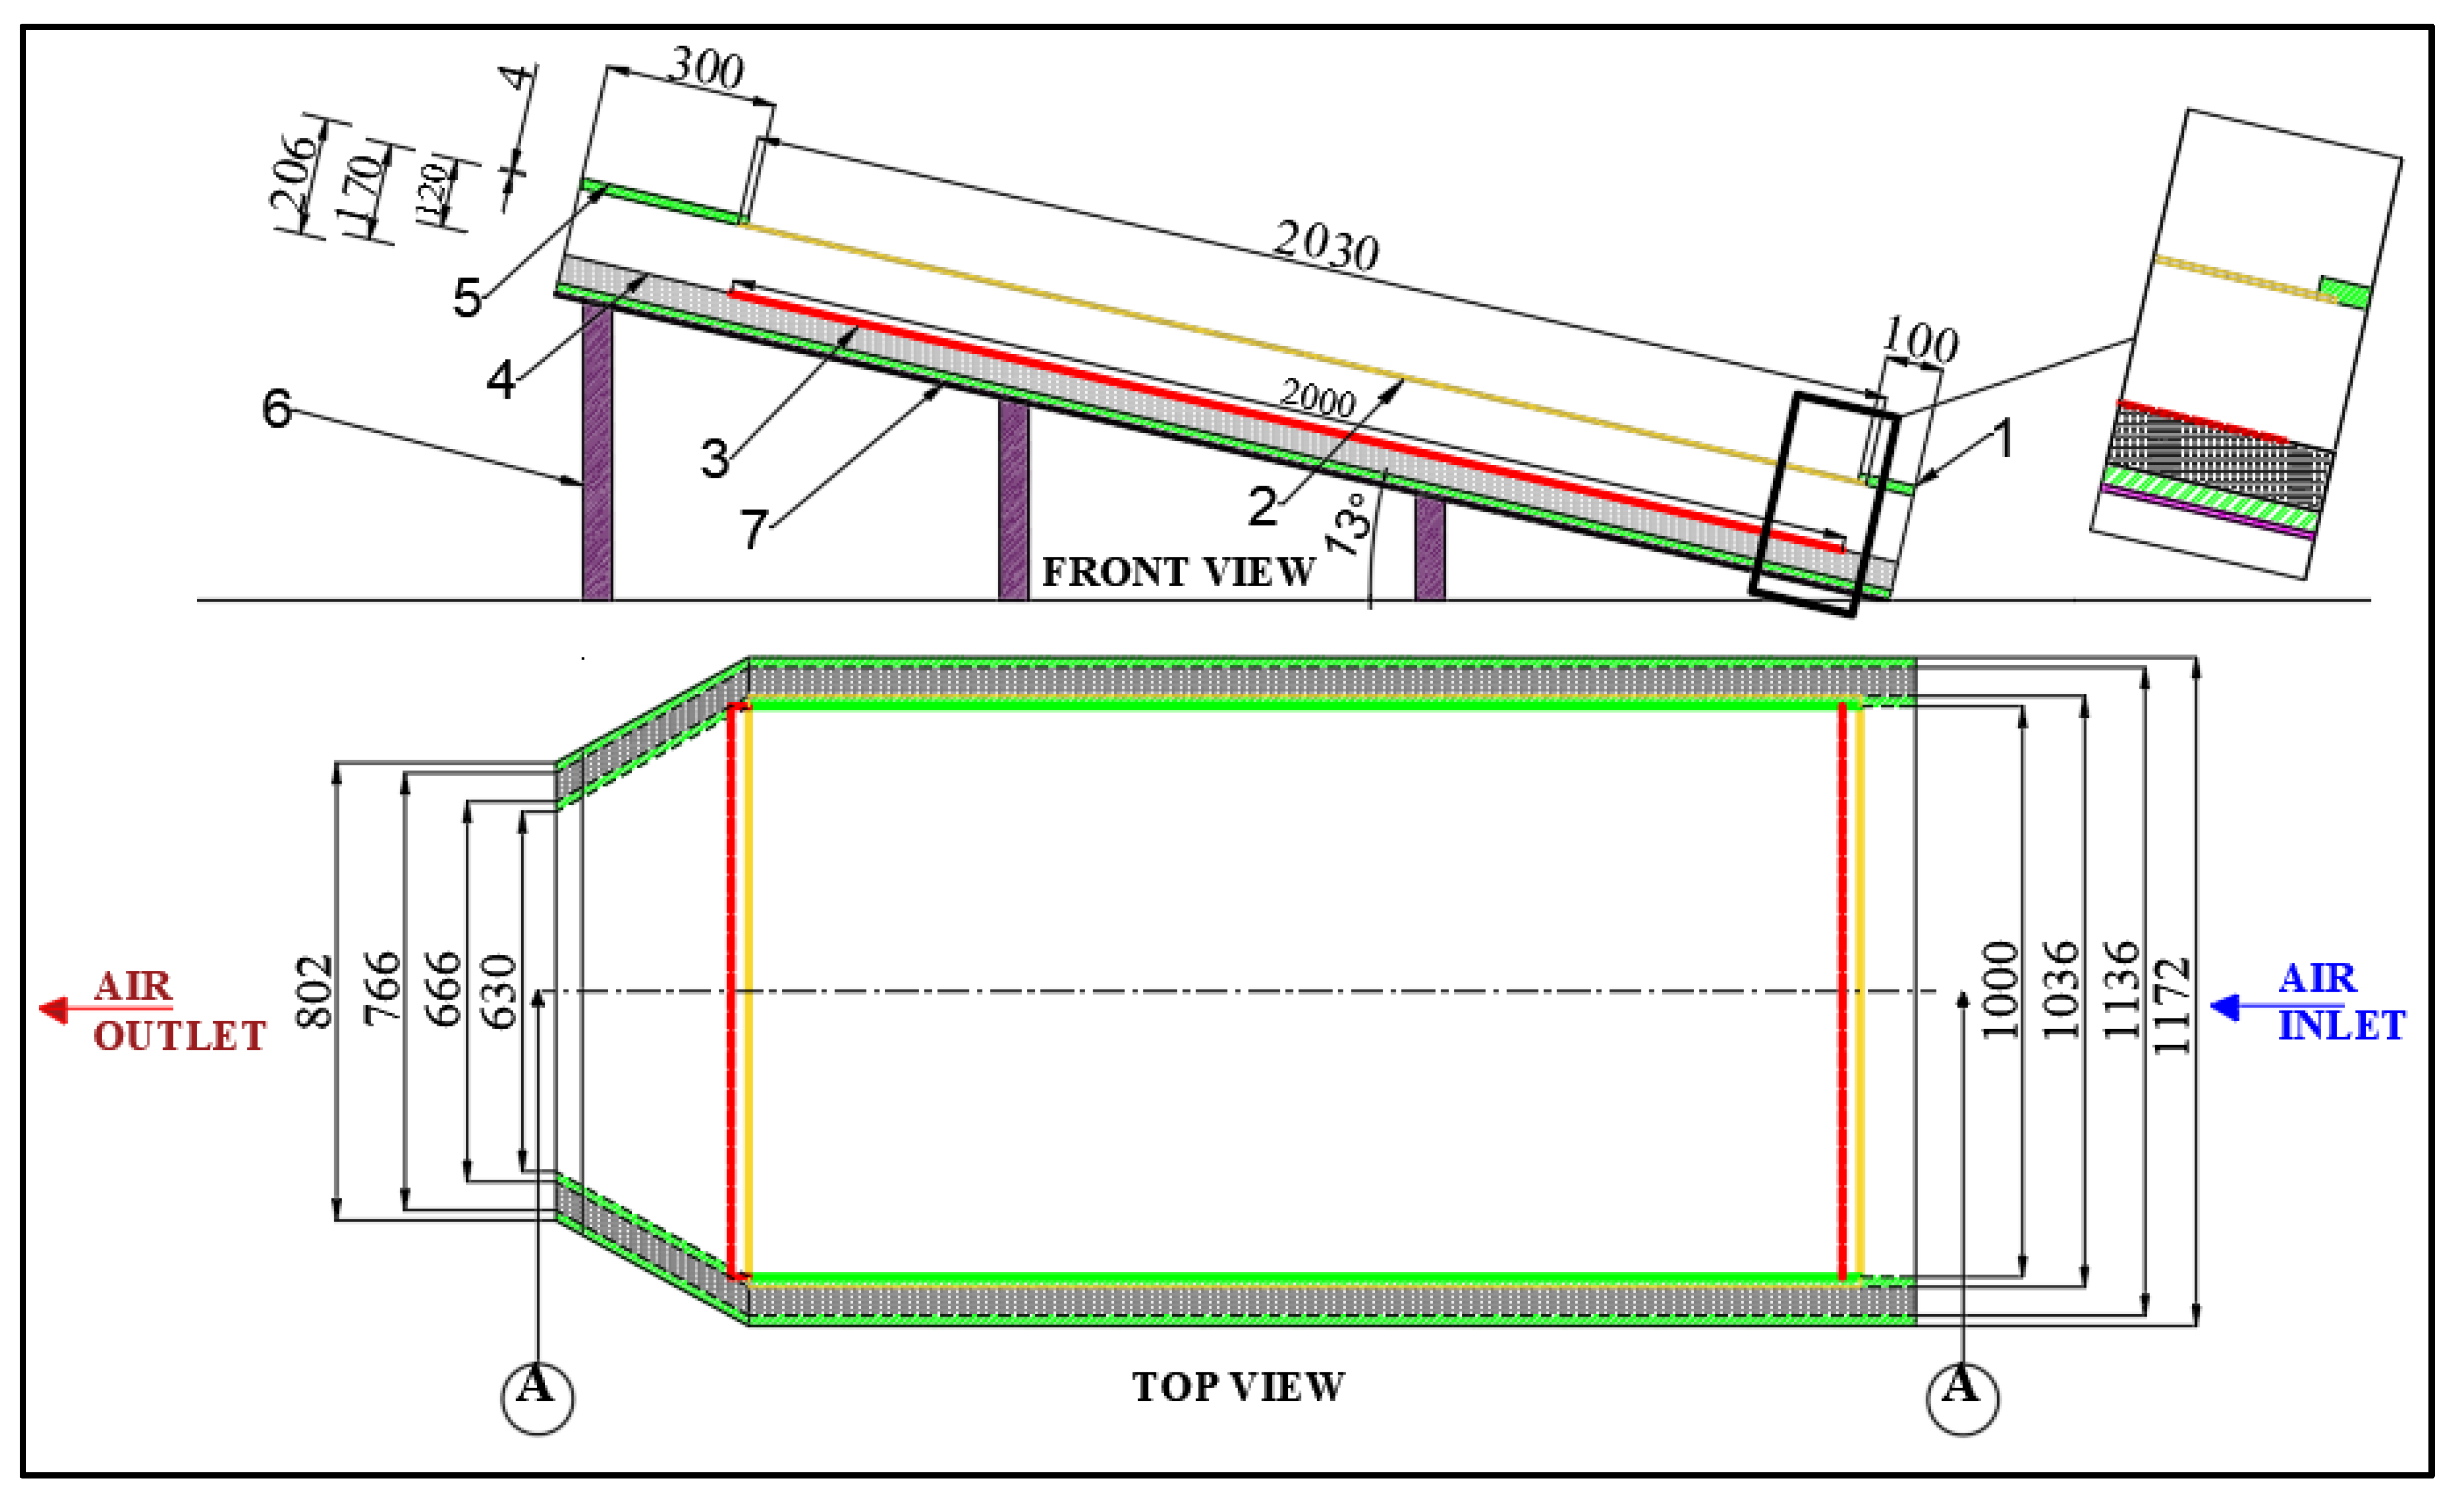
The standard commercial size of SAH is considered as 2 m2. The present SAH is developed based on the recent works of [24,27,31,32,33,34]. According to Rajarajeswari et al. [27], where the absorber plate was considered to be 2 m × 0.9 m, the authors in the present study slightly modified the dimensions of the absorber plate to 2 m × 1 m because of commercial scale, while the other dimensions are as per [27]. The SAH design is made up of one toughened piece of glass that acts as a transparent cover and an aluminium plate that acts as an absorber plate. The insulation material considered is ceramic wool, and the outer box is composed of a polyvinyl chloride (PVC) sheet. Air flows between the transparent cover and the absorber plate. The WM layers are placed horizontally above the absorber plate between the transparent cover and the absorber plate. An epoxy compound and silicon sealant are used to avoid leakages in the joints. A soap bubble test is performed to check for leakages present in between the joints. Figure 2 shows the dimensions and the type of materials of the SAH. The trapezium-type section is provided at the exit section to mix the hot air. The aluminium plate is painted with matte black spray paint to obtain a high absorptivity and to reduce the reflection of solar radiation from the aluminium plate. Insulation with a thickness of 50 mm reduces the heat losses from the bottom and side walls. The frame of a mild steel angle is used to provide support to the experimental SAH.
The experimental readings are taken during partly cloudy days in September 2022. It is impossible to achieve clear sunny days for full days and months. Hence, the average solar intensity of all experimental days is compared with clear sunny days. Thus, the average sunshine factor is 0.66 for all experimental readings. The experimental readings are considered under the climatic conditions of Surathkal, Karnataka, India (12.991° N, 74.81° E). Facing the southern direction and a 13° tilt angle to the ground surface is considered for testing the SAH so that the absorber plate can absorb the maximum solar radiation. The tilt angle equals the location’s latitude, as mentioned in [1,2,25,27,31,35,36].

2.1. Measurement Procedure

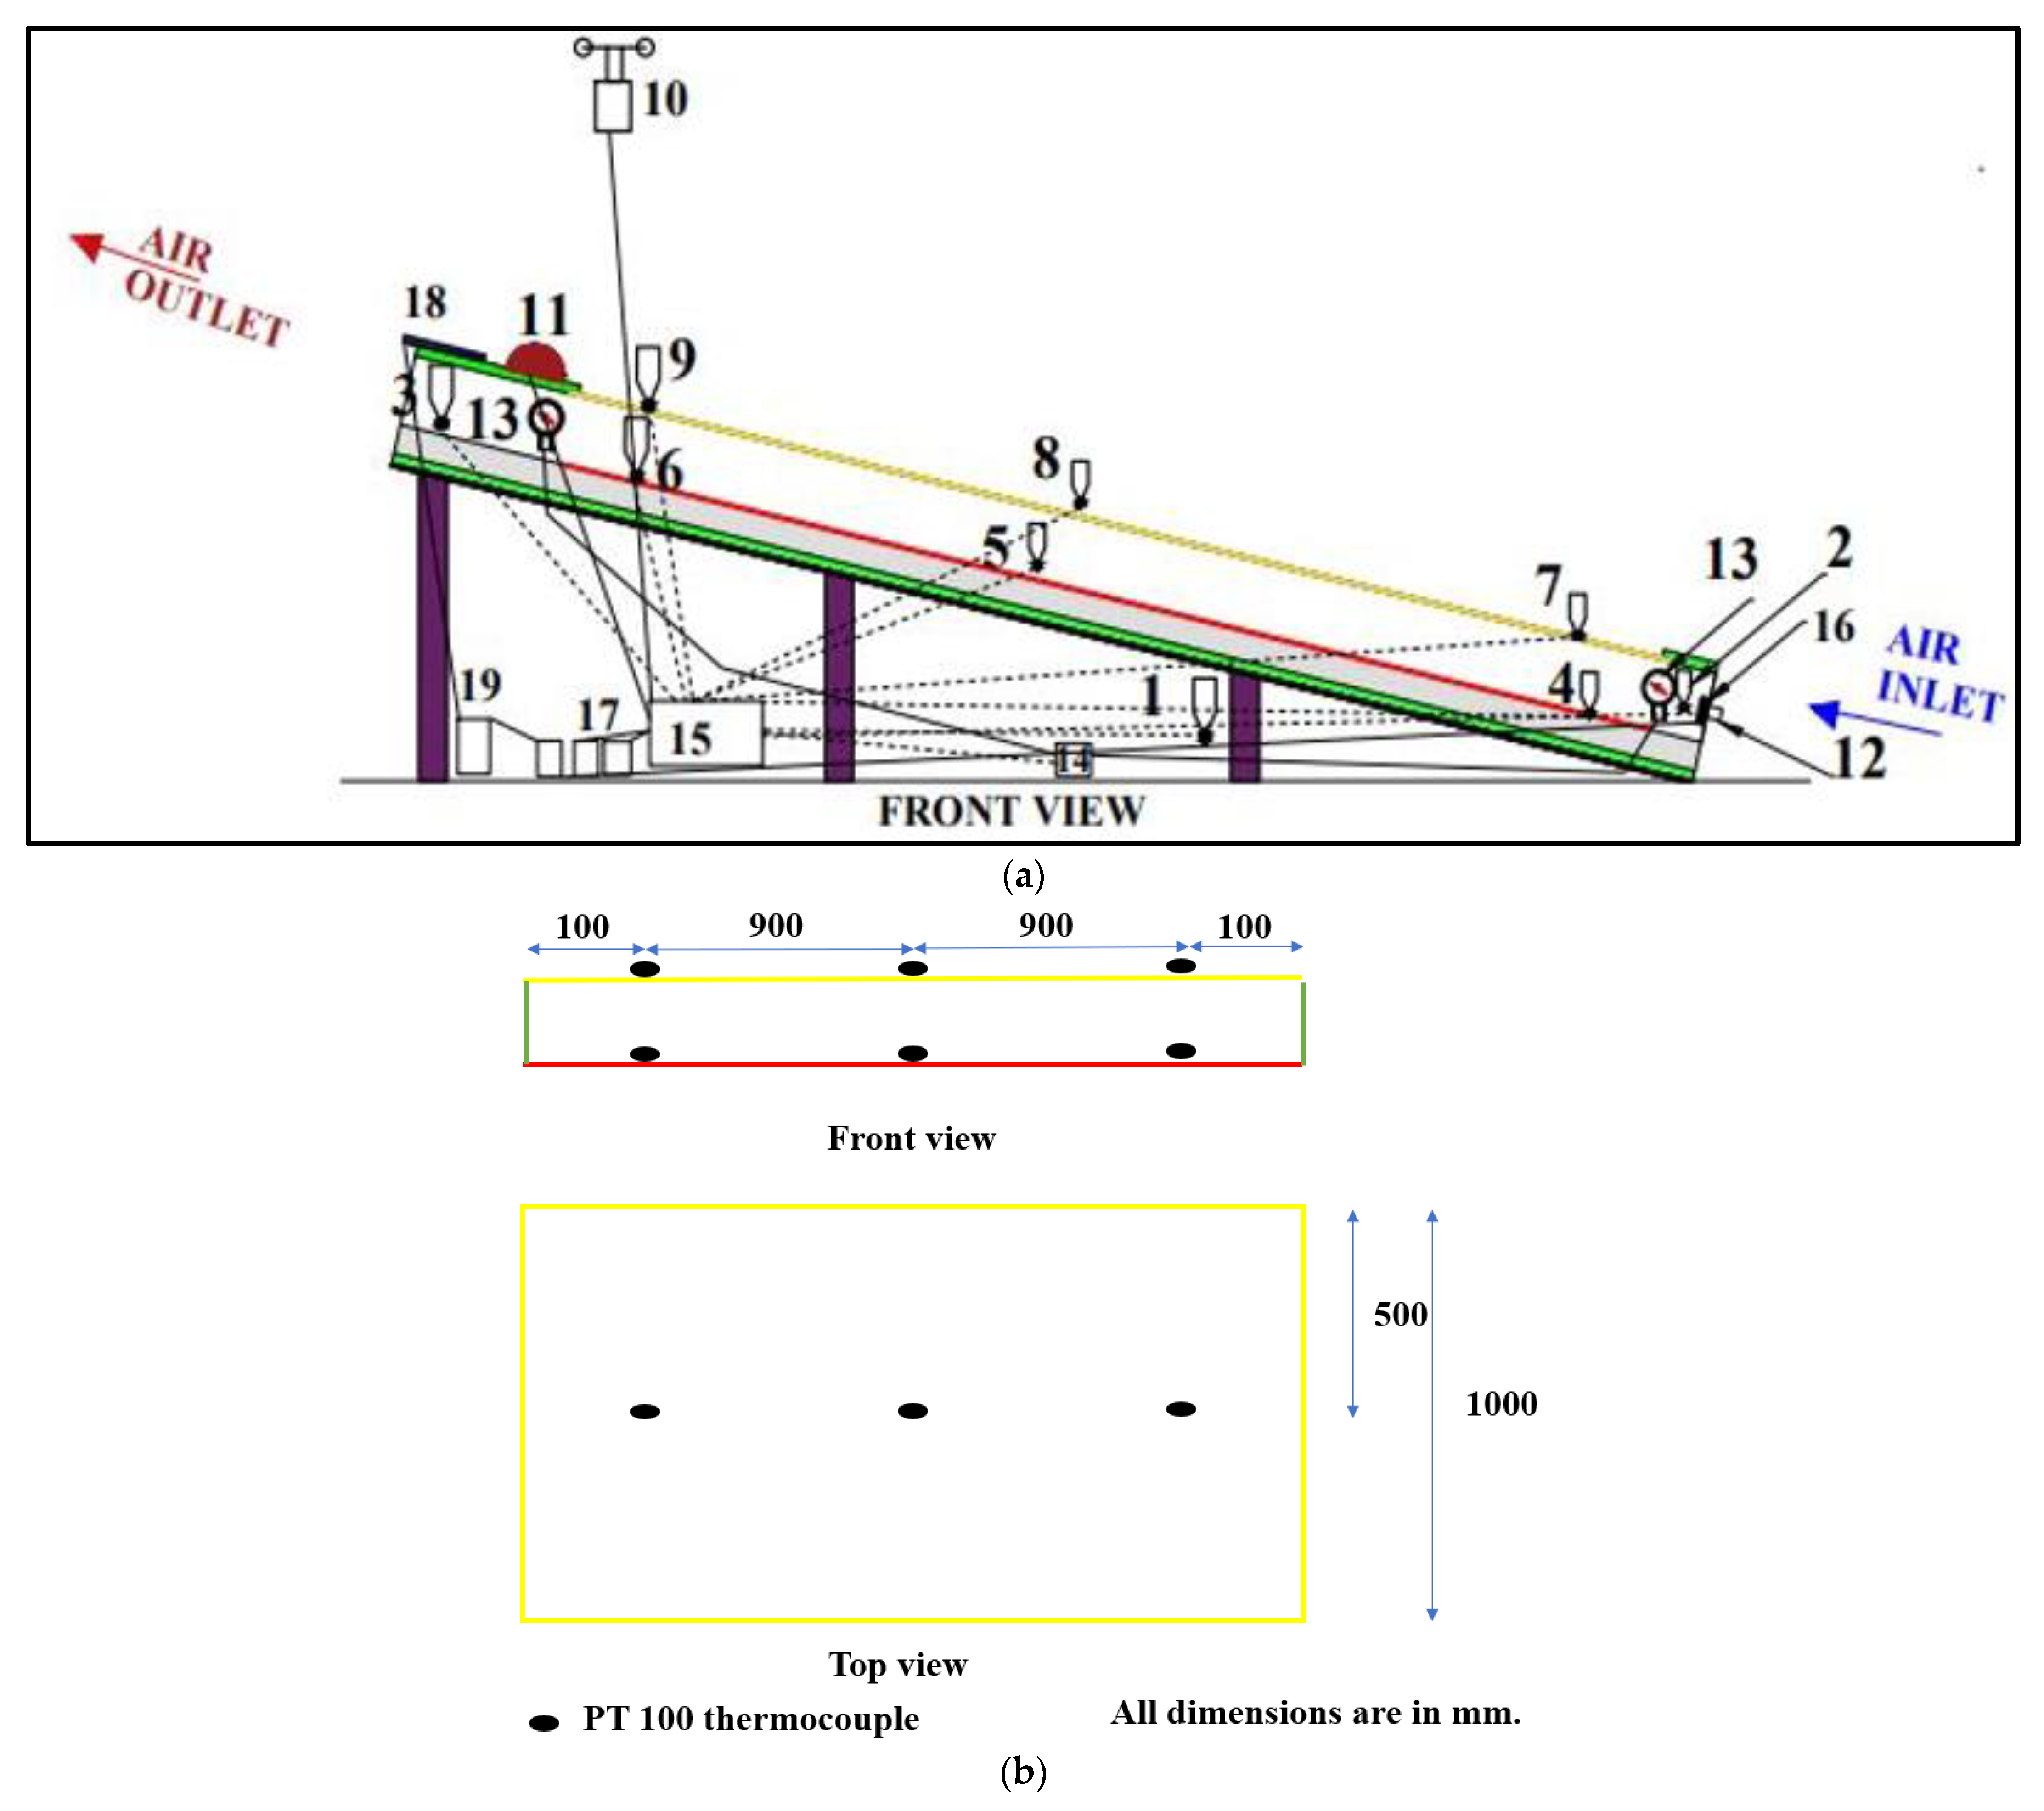
A PT100 RTD sensor is connected to the universal data logger to measure the temperature of the SAH at different locations. The fluid temperatures are measured at the inlet and outlet of the SAH. The temperatures for the absorber plate and glass cover are measured at the beginning, middle, and end, respectively. The ambient temperature is measured below the solar air heater. The temperature is measured every 10 min and considered for evaluating the thermal efficiency of SAH. The reading is taken from 9:00 h to 16:00 h [37,38] for each velocity for three days. The data from the logger are evaluated by the DAS software version 10.4 [39]. The anemometer is used to measure the velocity across the square section of 120 mm at the entrance section. A differential pressure transmitter and solar radiation sensor are used to measure the pressure drop across the absorber plate and the incident solar radiation, respectively. A 12 V DC battery which operates an exhaust fan is used to flow the air from the inlet to the outlet of the SAH. The mass flow rate is maintained as constant using a speed controller attached to the exhaust fan. The experimental trials are performed for two different air flow rates containing a minimum and a maximum of 0.027 and 0.058 kg/s, respectively. Similarly, in the recent literature, experiments were performed for two mass flow rates [28,34]. The exhaust fan is started well before taking the reading to obtain a steady-state flow of ambient air. The details of the measuring instruments are mentioned in Table 1. The details of the locations of the measuring instruments are shown in Figure 3a,b. The experimental setup front view and back side view are shown in Figure 4a,b.

2.2. Details of Wire Mesh as a Porous Media in SAHs with Its Different Arrangement with Geometrical Parameters

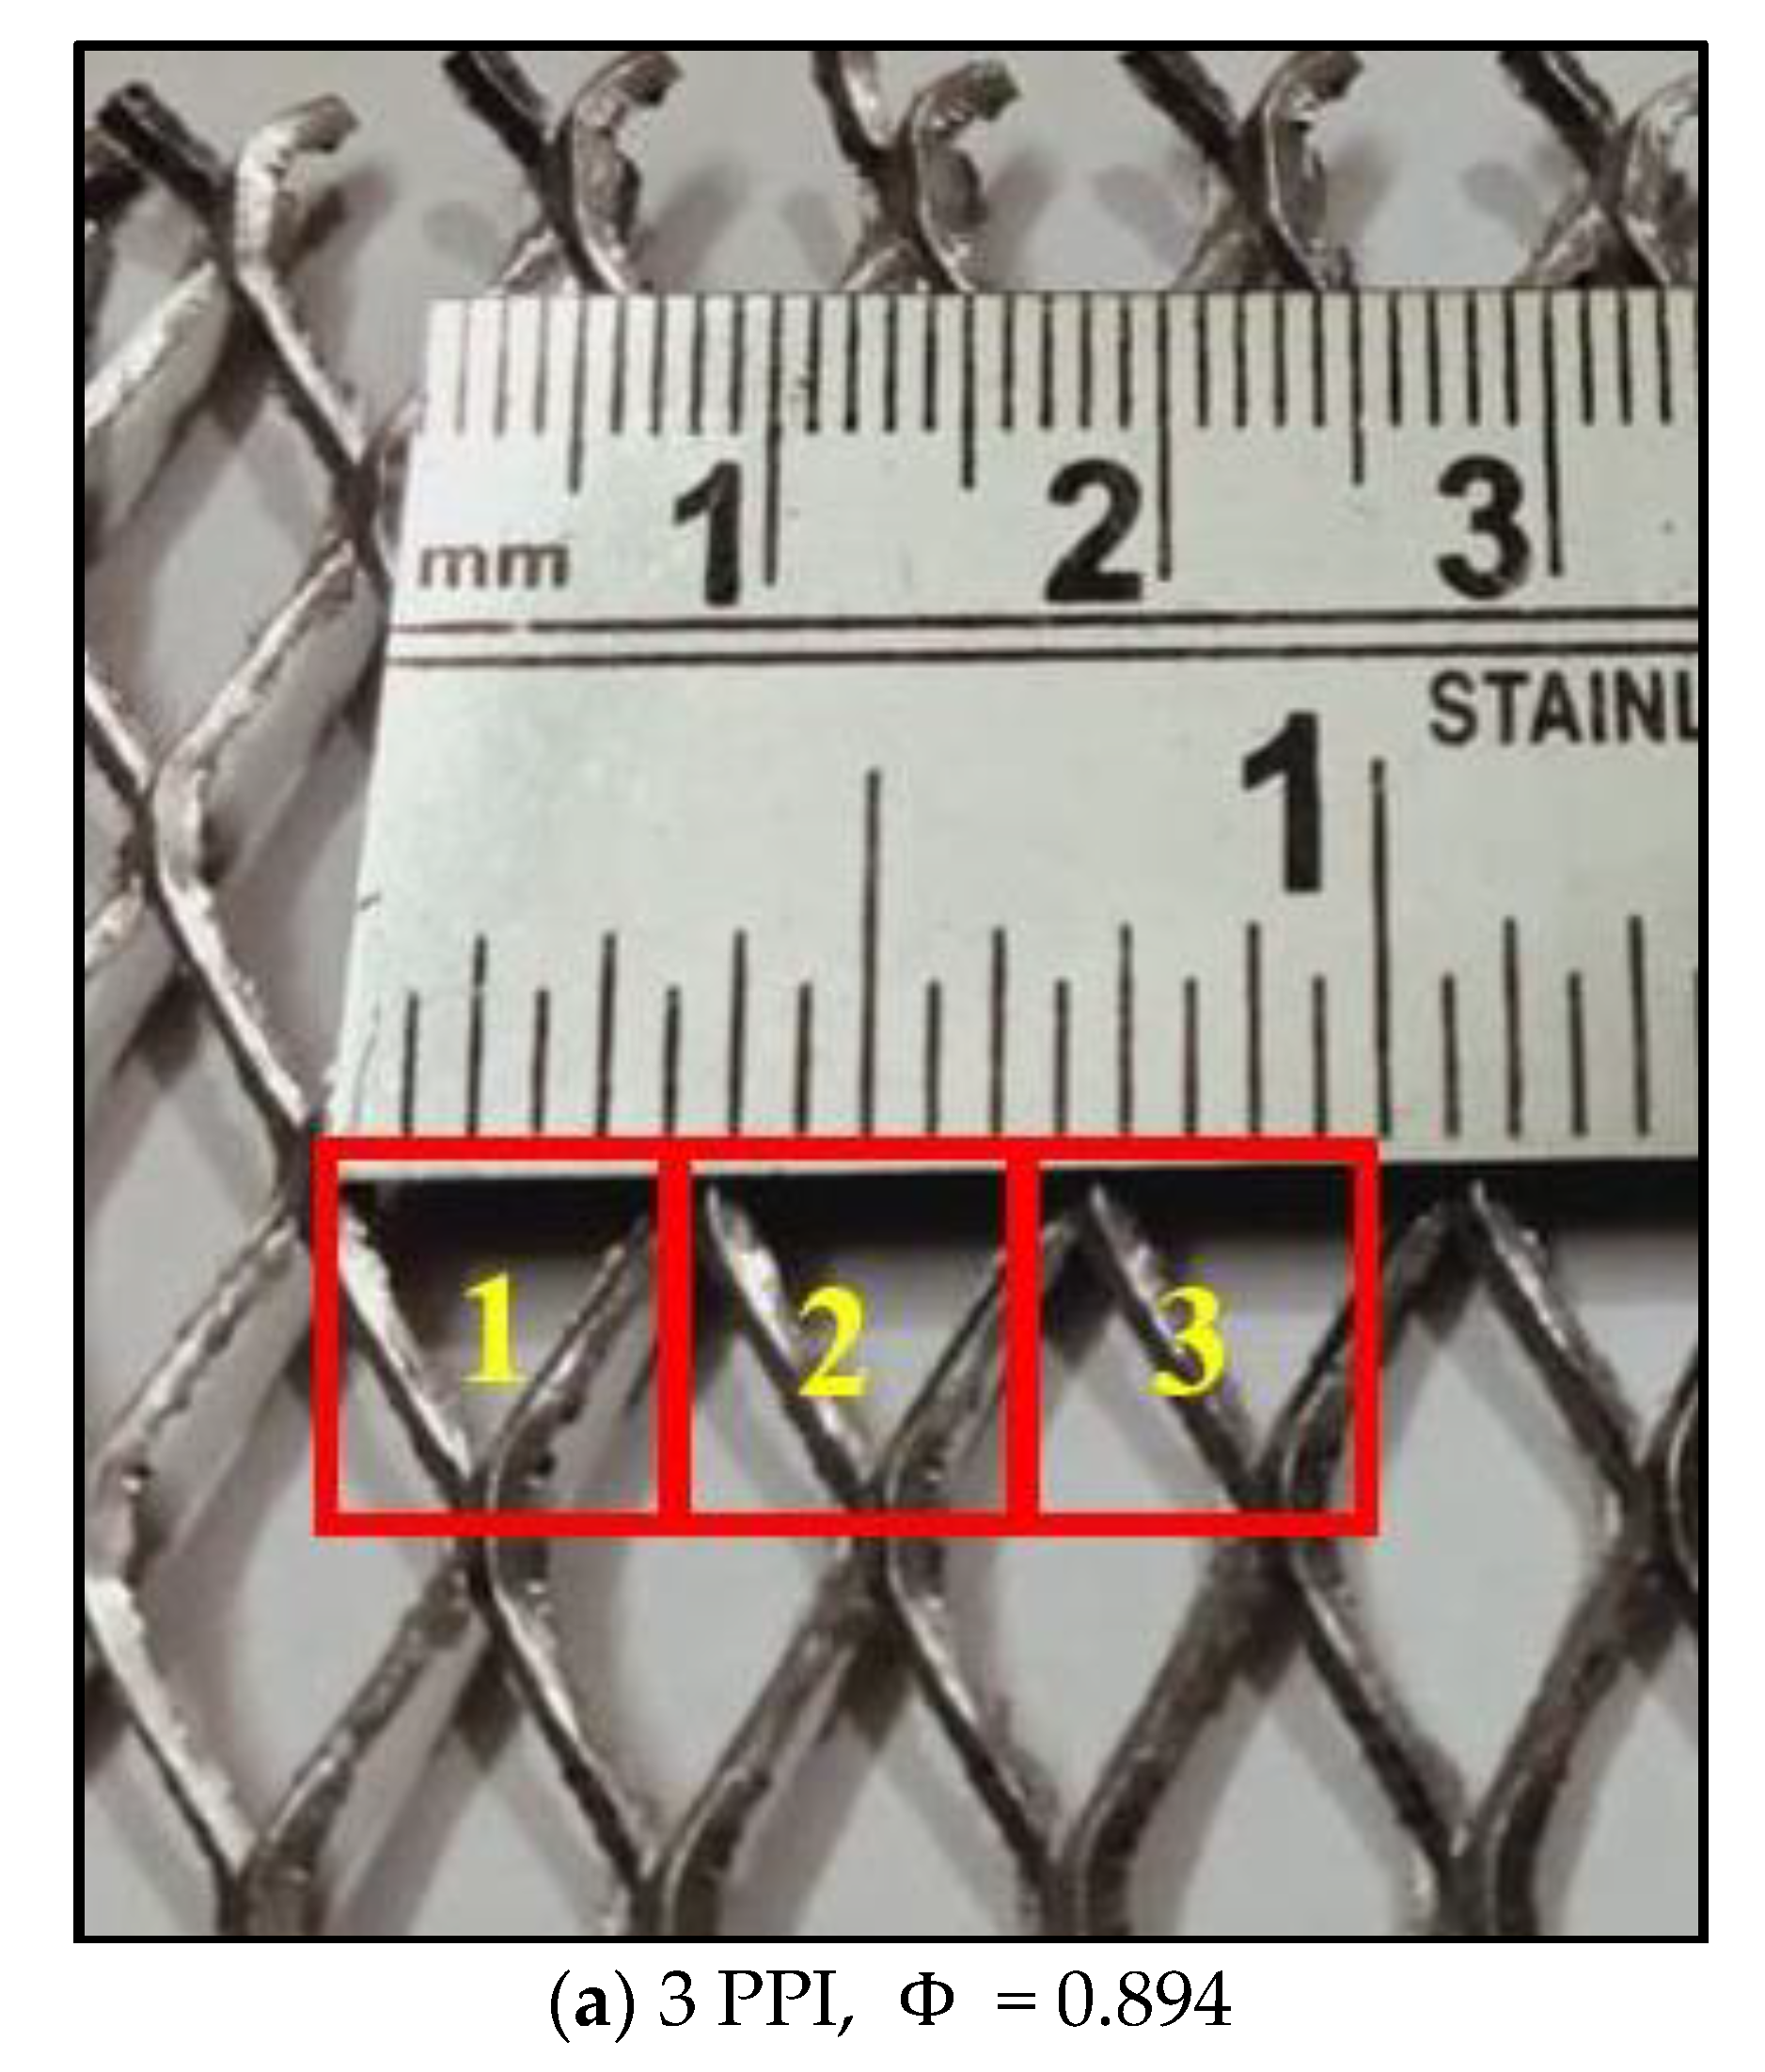
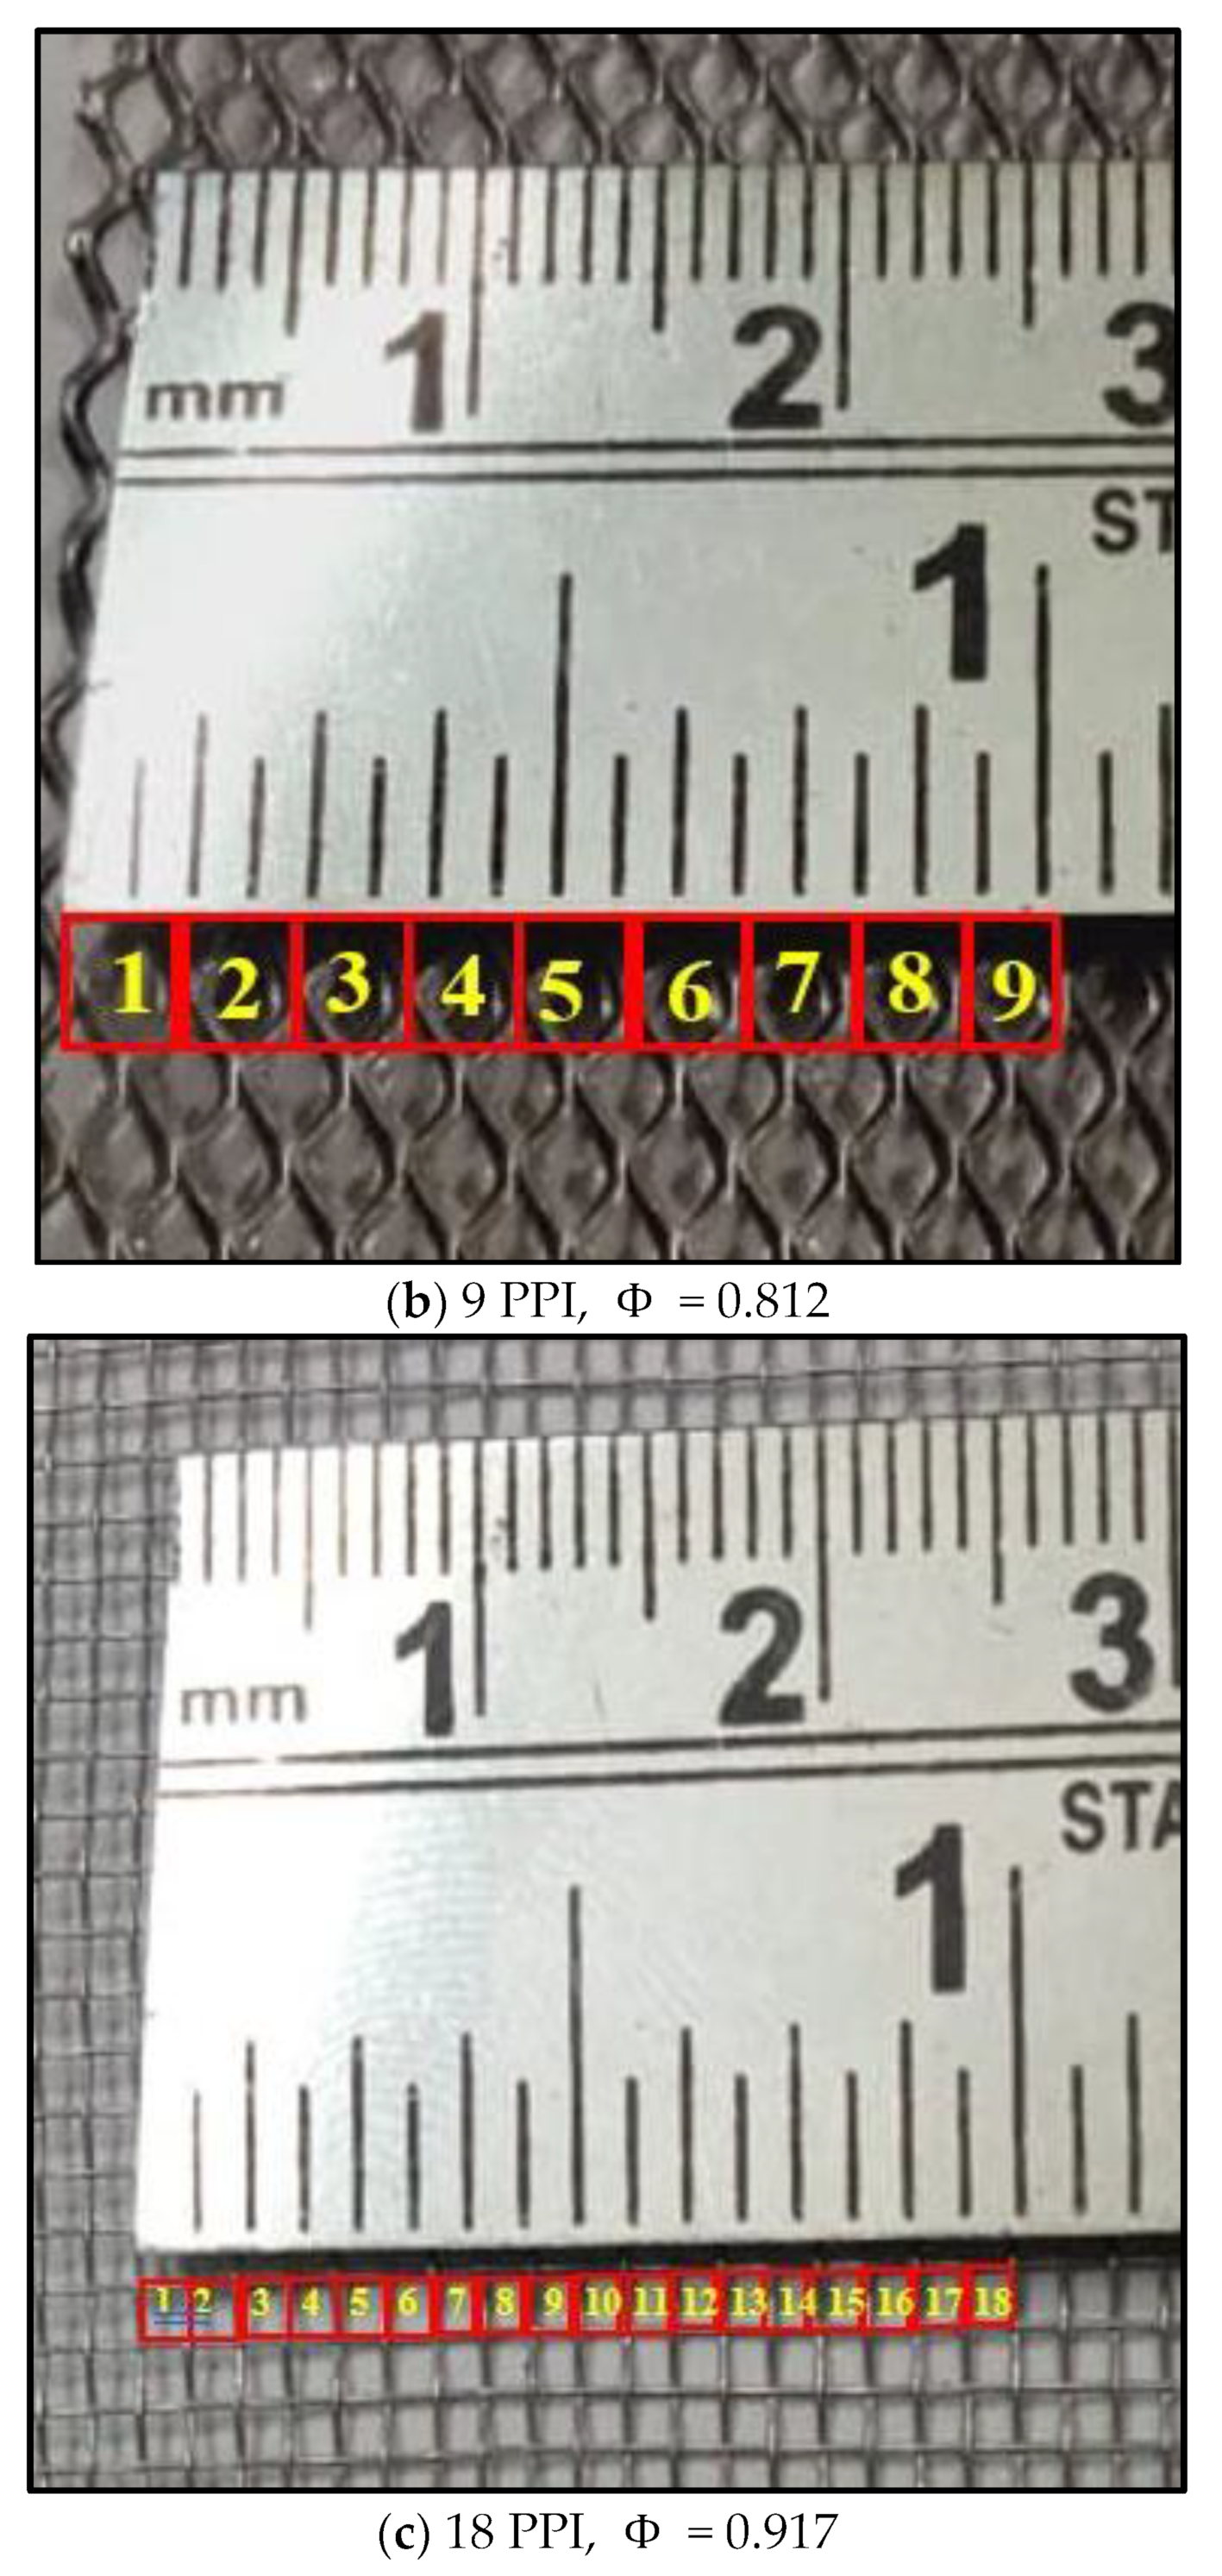
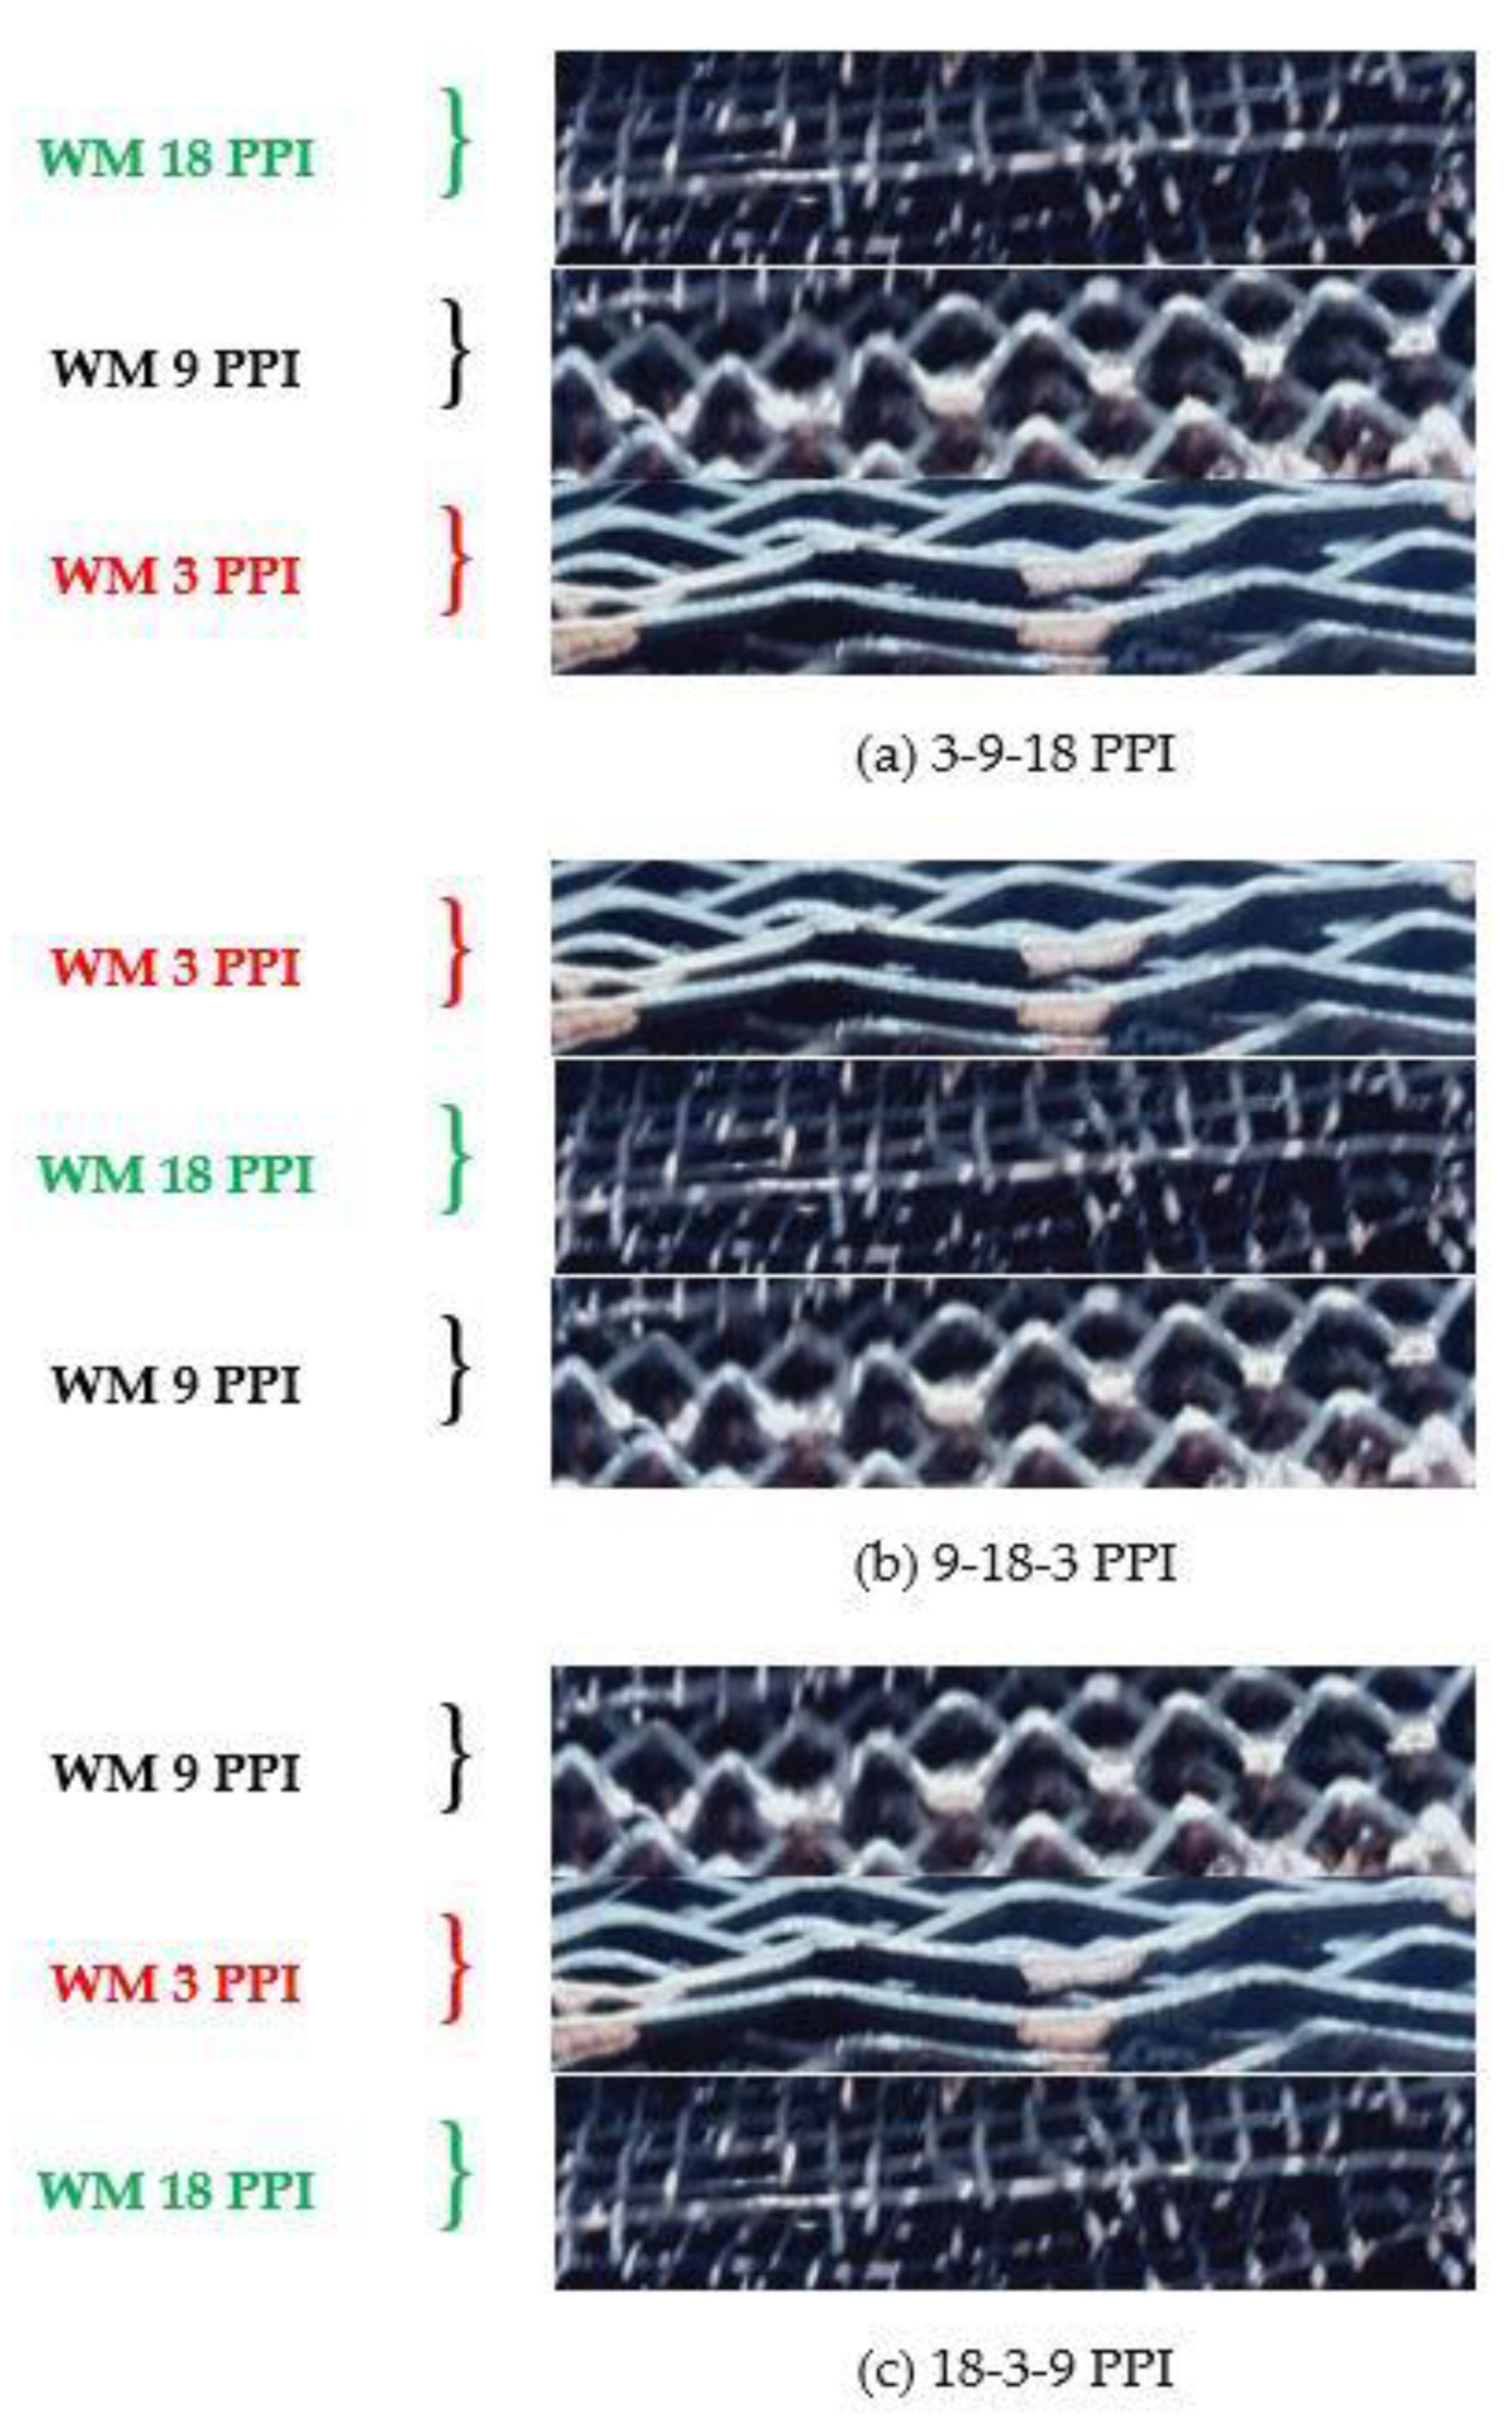
In the literature, researchers have mainly used copper and aluminium WM because of their high thermal conductivity and low weight compared to iron, steel, and GI WM. In this study, aluminium WM is selected, which is readily available on the market. Aluminium has a high thermal conductivity and a low cost compared to iron, GI, and brass WMs and a low weight compared to copper, iron, GI, and brass WMs. Table 2 presents the detailed specifications of the aluminium WM. It shows the types of WM and its properties. Figure 5 shows details of the size and shape of the aluminium WM. The porosity of the WM is calculated as per the expression mentioned in [23,25,33,37]. The absorption of a greater solar intensity and maximum outlet temperature of air is ensured by applying matte black paint on the WM. Case 9-18-3 PPI indicates that a WM of 9 PPI is kept horizontally at the lower side, while a WM of 18 PPI and a WM of 3 PPI are kept above the WM of 9 PPI, respectively. Thus, the case acts as a GWM which has a different PPI porosity structure. The height of each WM is fixed as 5 mm in the present study. The length is 500 mm and the width is 985 mm to avoid scratches on the side walls and WM bending. The detailed pictorial view of graded WM is shown in Figure 6.
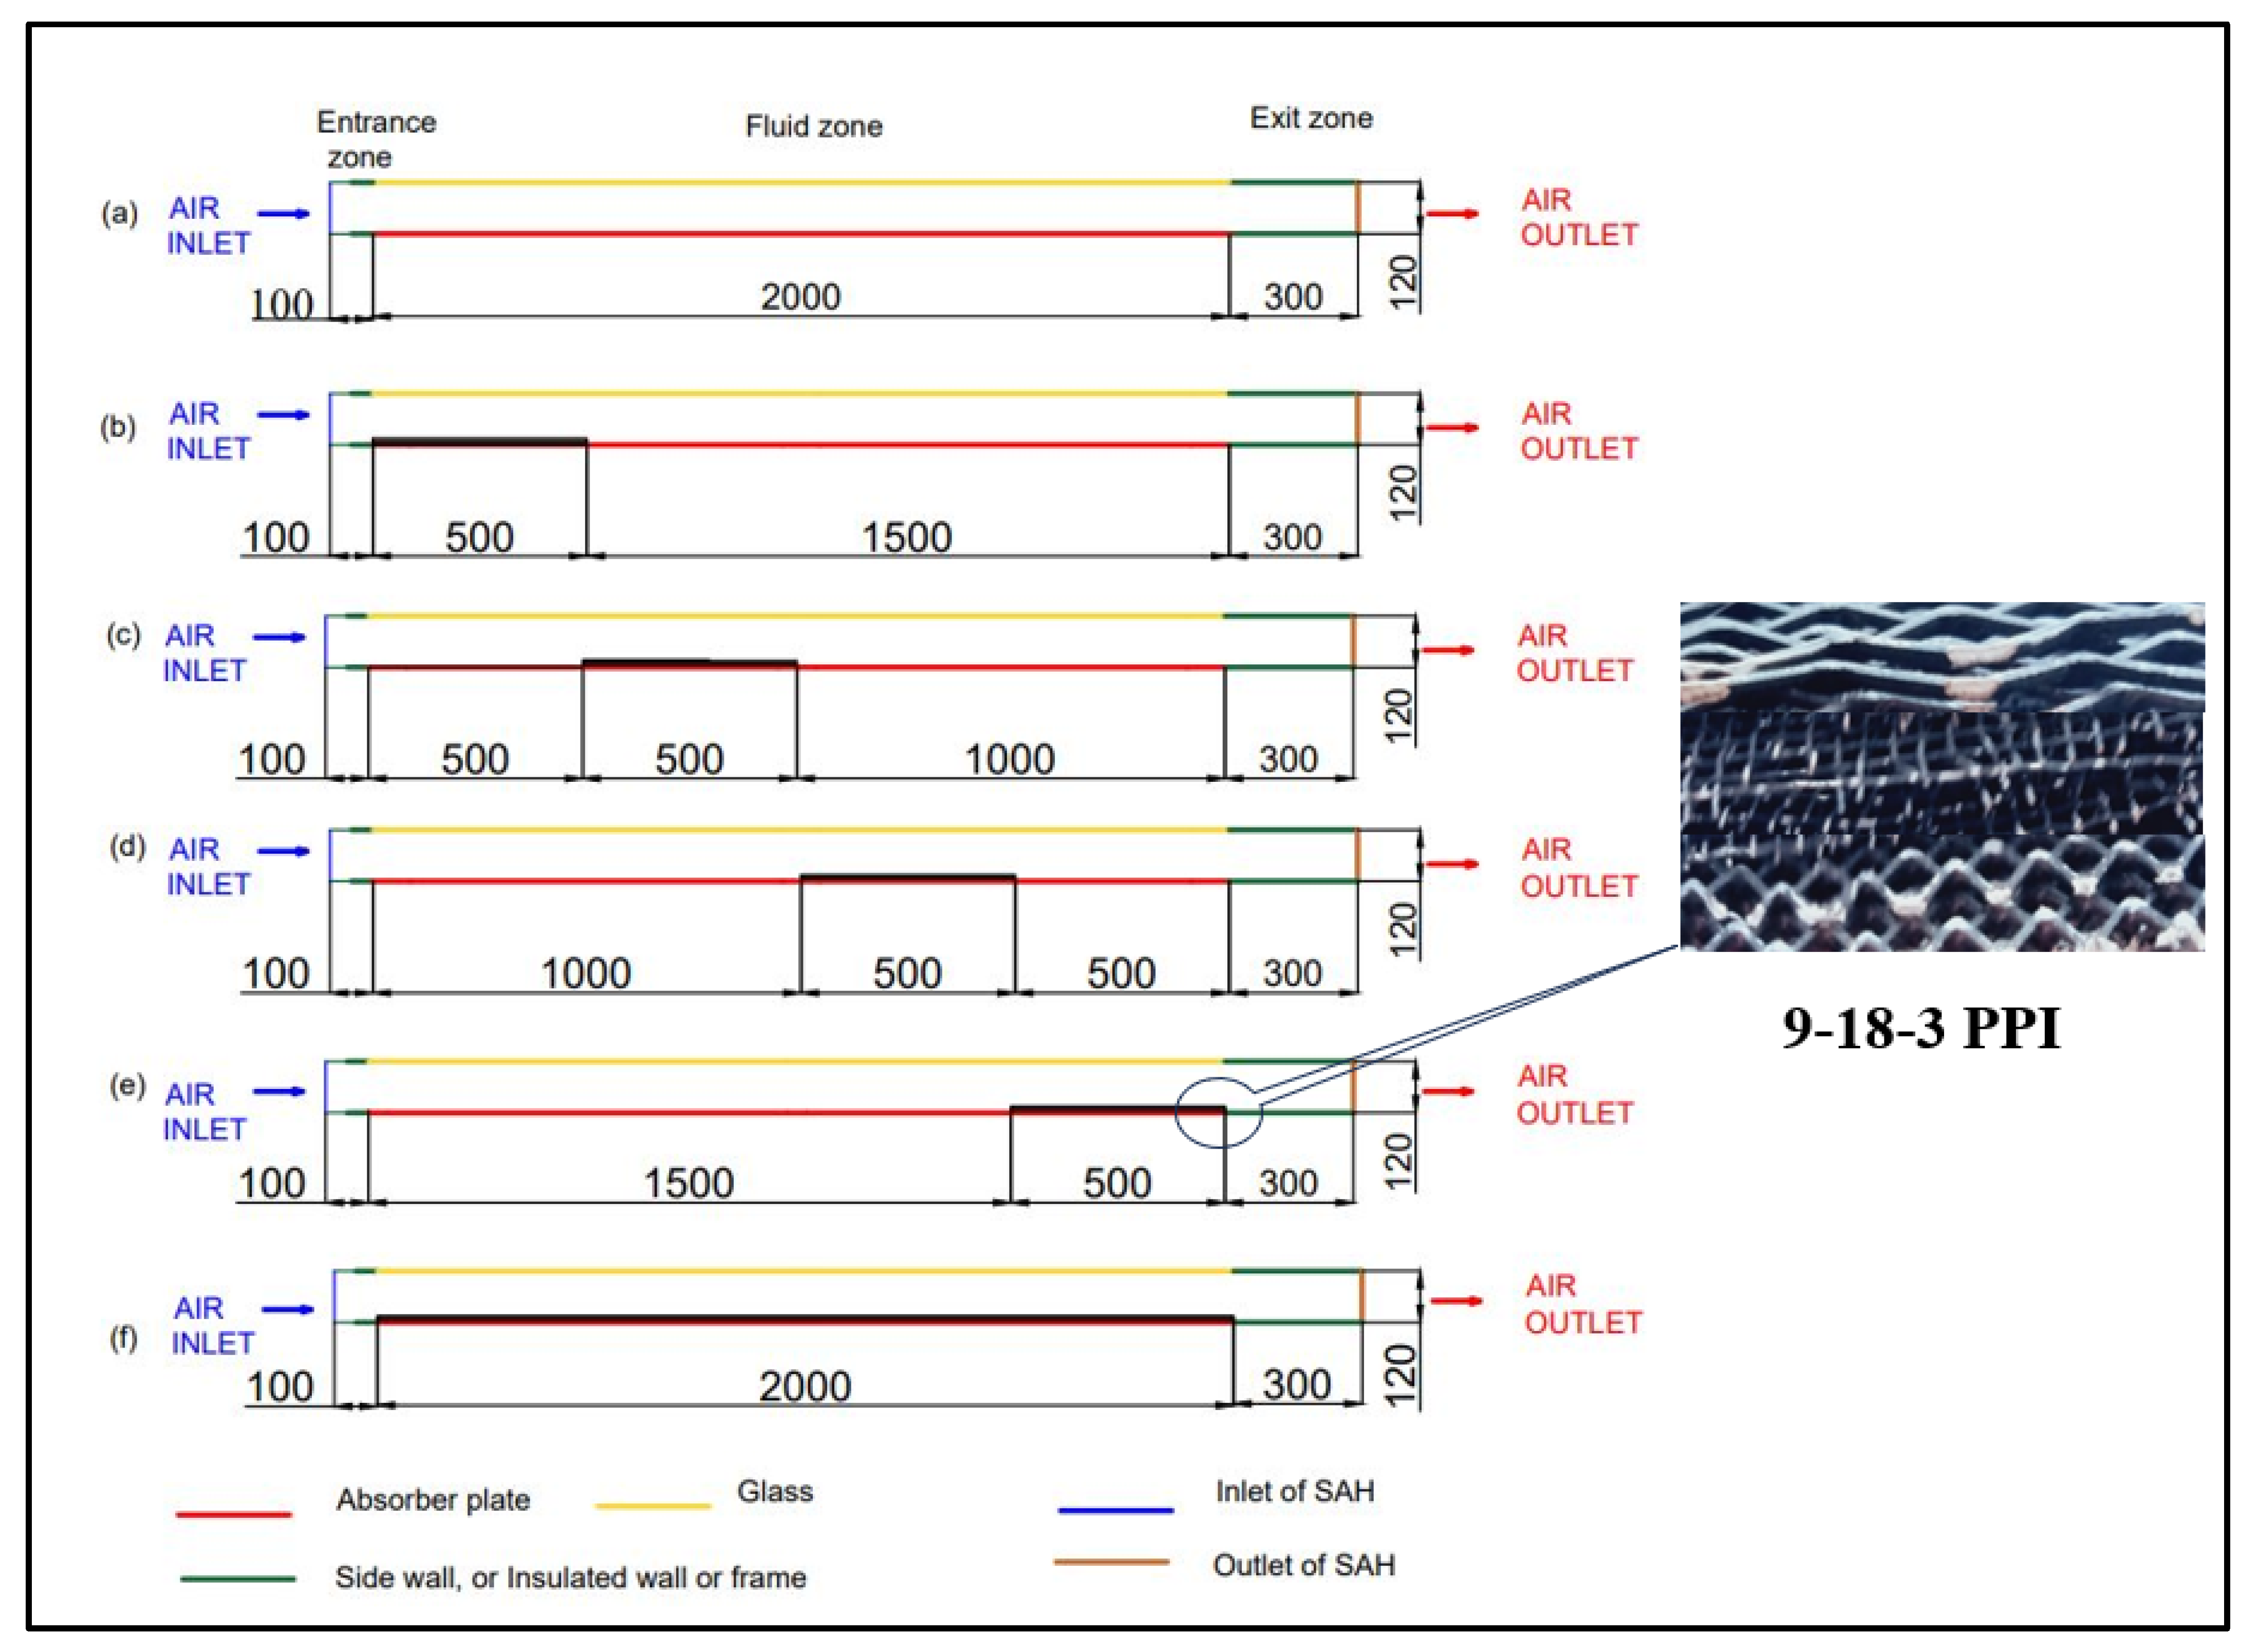
Two sample types kept at four different locations are shown in Figure 7: Case 9-18-3 PPI with a full horizontal length and at 25% of the length of the WM of the full-length test section.

2.3. Performance Paramaters of SAH

The properties of air are calculated at the bulk mean fluid temperature of air. The air temperature is calculated from the average of all of the empty experimental channel SAH readings.
Bulk mean fluid temperature (Tb) is calculated by Equation (1) as in [40],
T b = T O +   T i 2
The mass flow rate (   m ˙ ) of air is calculated by following Equation (2) as in [40],
m ˙ = ρ × A f × V air  
The hydraulic diameter (Dh) is calculated by Equation (3) as in [40],
D h = 4   C r o s s   sectional   Area   P e r i m e t e r   = 4   W H 2 W + H  
The Reynolds number (Re) for the empty-channel SAH is calculated by following the definition given in [40],
Re = ρ   V air D h   μ f
The useful heat gain (qu) is calculated as in [1,40],
q u =   m ˙ × C P × T O T i
The thermal efficiency of both the empty and the porous channels can be calculated by following the definition given in [1],
η th = q u I T ×   A c
where IT and AC are the solar intensity entering the SAH and area of the SAH, respectively, and ηth shows the thermal efficiency of the SAH. The thermohydraulic efficiency of the SAH can be found by Equation (7) [41],
η the = q u P fan I T × A C
where Pfan represents the power of the fan used in the system. It shows that the power needed to force the air through the channel is calculated by Equation (8) [41],
P fan = P flow η fan × η motor
where the ηfan and ηmotor are the efficiencies of the fan and motor, assumed as 70% and 90%, respectively [41].
Pflow can be calculated as [41],
P flow =   m ˙ × Δ P ρ
The heat transfer coefficient (h) for the entire channel with or without a WM is calculated by Equation (10) [1,40],
h = q u A P × T P T b
where Tb is the bulk temperature calculated by Equation (1) and TP is the absorber plate temperature. Tp is calculated by averaging all of the temperatures of thermocouples near to the inlet, in the middle, and near to the outlet location, each one kept above the absorber plate as shown in Figure 3b. Similar arrangements have been performed in the recent literature for glass and absorber plates [27,35,37].
The average temperature for the absorber plate is calculated by Equation (11) as,
T P = T absi + T absm + T abso 3
where Tabsi, Tabsm, and Tabso are the temperatures measured at the inlet, middle, and outlet side of the absorber plate as shown in the Figure 3a,b.
The Nusselt number (Nu) for the entire channel is calculated by Equation (12) [1,40],
Nu = h × D h k
Similarly, the friction factor (f) for entire channel is calculated by Equation (13) [1,40],
f = 2 × D h × Δ P 4 × ρ × L × V air 2
Finally, the thermohydraulic performance parameter is defined as follows [41],
THPP = Nu WM Nu e / f WM f e 1 3
where the suffix e and WM are considered for the entire channel and the wire-mesh channel, respectively.

2.4. Uncertainties in Measurement

During experiments, different measuring instruments are utilized for measuring different parameters. The details of the accuracy of the devices are given in the Table 1. An uncertainty analysis is performed to ascertain the standard error in the measurement of the mass flow rate and thermal efficiency [42,43,44].

2.4.1. Uncertainty for Mass Flow Rate

The fractional uncertainty in experimental results such as for mass flow rate, ω   m ˙ , is obtained as follows.
The mass flow rate (   m ˙ ) can be calculated by Equation (15) as in [45,46],
  m ˙   =   ρ   Q
where ρ is the density of the air and Q is the volume flow rate.
The density of the air (ρ) is obtained by Equation (16) as in [45],
ρ = P R air T a
Here, Rair is the gas constant which has a constant value. Therefore, the density of the air depends on the pressure and temperature values.
The uncertainty in the result is considered as wR, and w1, w2 … wn are the uncertainties in the independent variables. Thus, the uncertainty in the independent variables can be calculated by Equation (17) as in [45],
w R = R X 1 w 1 2 + R X 2 w 2 2 + + R X n w n 2 1 / 2
where X1, X2, and Xn are the independent variables.
Using the above Equation (17), the uncertainty for the mass flow rate is calculated by Equation (18) as,
ω   m ˙ =   m ˙ T a ω T a 2 +   m ˙ P ω P 2 +   m ˙ Q ω Q 2 1 2
The volume flow rate (Q) is calculated by Equation (19) as,
Q = A f × u air
where Af is the frontal area and uair is the velocity of air at the inlet. As the frontal area is constant,   m ˙ is a function of Ta, p, and u in the air. It is calculated according to the method explained in refs. [41,47], and the uncertainty in the mass flow rate is calculated by Equation (20) as,
ω   m ˙ =   m ˙ T a ω T a 2 +   m ˙ P ω P 2 +   m ˙ u air ω u air 2 1 2

2.4.2. Uncertainty for Thermal Efficiency

The fractional uncertainty in thermal efficiency ω η th is calculated by the below Equation (21),
ω η t h η t h = ω m ˙ m ˙ 2 + ω Δ T Δ T 2 + ω I T I T 2 1 2  
The obtained values of uncertainty for the mass flow rate and thermal efficiency are shown in Table 3.
As can be seen from the above table, the errors in the trials conducted are a result of the uncertainties in the instruments, which must be known to report an uncertainty analysis. It is well known that uncertainty analysis must be performed for measured experimental readings to obtain the errors in the measured values of mass flow rate, temperature, solar intensity, and calculated thermal efficiency.

3. Computational Investigations

3.1. Governing Equations

The computational domain consists of two parts, the first one is the empty part in which air flows and the second consists of a WM in which air flows between the wires. The governing equations for these two parts are different. The governing equations for the empty part are traditional three-dimensional continuity, momentum, and energy equations in a Cartesian coordinate system. In the present study, 1.7 and 3.6 m/s are the flow velocities of air, which is less than 30% of the speed of sound, i.e., the Mach number of flow is less than 0.3. Thus, the change in density due to fluid velocity is less than 5%. Hence, the flow is assumed to be incompressible [1,40,48,49]. The experimental parameter assumed for global radiation incident on the SAH, ambient temperature, fluid flow rate, temperature rise across SAH, and fluid inlet temperature are assumed to be within ±50 W/m2, ±1 °C, ±1%, ±1 °C, and ±1 °C, respectively, within a 15 min duration [1]. Thus, the system is assumed to be in a steady state. The obtained velocities measured via the anemometer and hydraulic diameter are used to calculate the Reynolds number, which is mentioned in Section 2.3 in Equation (4). The calculated Reynolds numbers are 11,544 and 24,447. Hence, the flow is turbulent in the entire channel in the conventional SAH or non-porous region. The recent literature shows that the renormalisation group (RNG) k-ε viscous model with enhanced wall function is very much suitable for providing accurate results as per the experimental results of [41,47,48,49,50,51]. The advantages of this model are (i) the two equations produce a balance in CFD accuracy and time compared to other viscous models; (ii) the average absolute deviation is minimum relative to other viscous models [48]; (iii) an additional term in its k-ε equation increases the accuracy for rapid flows; and (iv) the effect of the swirl on turbulence is involved in the RNG model which is more accurate for swirling flows [52]. Hence, the RNG k-ε model with enhanced wall function is selected to obtain a higher accuracy in the present numerical study. The Reynolds number in the porous media is calculated by Equation (33) which is mentioned in this section. The calculated Reynolds number for porous media ranges from 26.92 to 1874. The Reynolds numbers are below 4000 (ReP < 4000). The flow inside the porous media is laminar. Hence, in the computational steps, the flow in the porous region is selected as the laminar zone [52].
The Rosseland radiation model is simple for solving radiative heat transfer and preferred for optically thick media, where the optical thickness is greater than one [53]. In the present study, the WM is considered as a optically thick media which takes part in the majority of the absorption of the incident solar radiation [54].
The governing equation for the empty channel can be written as follows,
The continuity equation is Equation (22) [55],
ρ f u i x i = 0
The momentum equation is Equation (23) [55],
x j ρ i u i u j + p x i = x j μ f + μ t u i x j + u j x i
The energy equation with the LTE model is Equation (24) [14,56],
x i ρ f u j T 16 σ T 3 3 K R + k x j T x J = 0
where σ is the Stefan–Boltzmann constant and KR is the extinction coefficient.
The turbulent kinetic energy equation and rate of energy equations are Equations (25) and (26) [52],
u j k x j = u i u j u i x j + x j k m k σ k x j ε
u j ε x j = C ε 1 ε k u i u j u i x j + x j k m ε σ ε x j C ε 2 ε 2 k
where μ t = ρ C μ k 2 ε and k m = ν 1 + C μ ν k ε 0.5 2 .
The values of the constants of the above equation are Cμ = 0.09, σk = 1.0, σε = 1.30, Cε1 = 1.44, and Cε2 = 1.92.
The governing equations for the second part of the computational domain in which wires are located in continuity, momentum, and energy equations for the fluid (air) and solid (wire mesh). Darcy extended Forchheimer is used in the momentum equation to include the effect of the porous media. The air and solid temperature are assumed to be equal in the porous zone; hence, the current study assumed the local thermal equilibrium (LTE) [11,27,53,54,57]. The WM is assumed as an isotropic and homogeneous porous medium.
The continuity equation,
ρ f Φ   u i X i = 0
The momentum equation for laminar flow [55],
ρ f u i u j x j = P x i + x j μ f u i x j + u j x i μ eff K u i + ρ f C F K u u i
The momentum equation for turbulent flow [55],
ρ f u i u j x j = P x i + x j μ f + μ t u i x j + u j x i μ eff K u i + ρ f C F K u u i
The energy equation with the LTE model [14,55,56],
x i ρ f C Pf u j T 16 σ T 3 3 K R + k λ eff x j T f x J = 0
where the effective viscosity is,
μ eff = μ f
Effective heat capacity is,
ρ C P eff = Φ ρ C P f + 1 Φ ρ C P S
Effective thermal conductivity is
λ eff = Φ λ f + 1 Φ λ s
where K and CF are the permeability and the inertia coefficient, respectively. The KR is a function of position. In the porous media, the viscous resistance (1/K) and inertia coefficient (CF) [52] are calculated by Equations (33) and (34),
1 / K = d w 2 150   Φ 2 1 Φ 2
C F = 3.5 d w   1 Φ Φ 2
where d w and Φ are the wire diameter and porosity of the WM.
The porosity ( Φ ) of the square WM is calculated by Equation (35) [22,27],
Φ = 1 π   n   d w 2 2   p t   D   1 + d w 2 p t 2 1 / 2
The porosity ( Φ d) of the diamond or expanded metal WM is calculated by Equation (36) [58],
Φ d = 1 ρ ¯
The relative density of the diamond (   ρ ¯ ) type WM is calculated by Equation (37),
  ρ ¯ ρ ρ S = π Nd w 2 2 l / n 1 + 1 1 + w / d w 2
The pore per inch (N) is calculated by the following Equation (38),
N = 1 d w + w
The Reynolds number for the WM porous media (ReP) can be calculated by Equation (39) [18],
Re P = 4 r h G O μ
The hydraulic radius (rh) for the WM is calculated by Equation (40) [18],
r h = Φ d w 4 1 Φ
The relative mass velocity (GO) can be found by Equation (41),
G O =   m ˙ A f Φ
The turbulent intensity (T.I.) for the velocity inlet and pressure outlet boundary condition can be defined by Equation (42) [52],
T . I .   =   0.16   ( Re ) 1 / 8
The thermophysical properties of the fluid and wire mesh, as well as the surface radiation properties, can be found in Table 4. The material properties are calculated at a mean fluid temperature of 47.5 °C. Similar considerations have been mentioned in previous works [59,60,61,62,63,64]. The properties are assumed to be the same throughout the day.

3.2. Details of Geometry, Mesh Generation, and Boundary Conditions

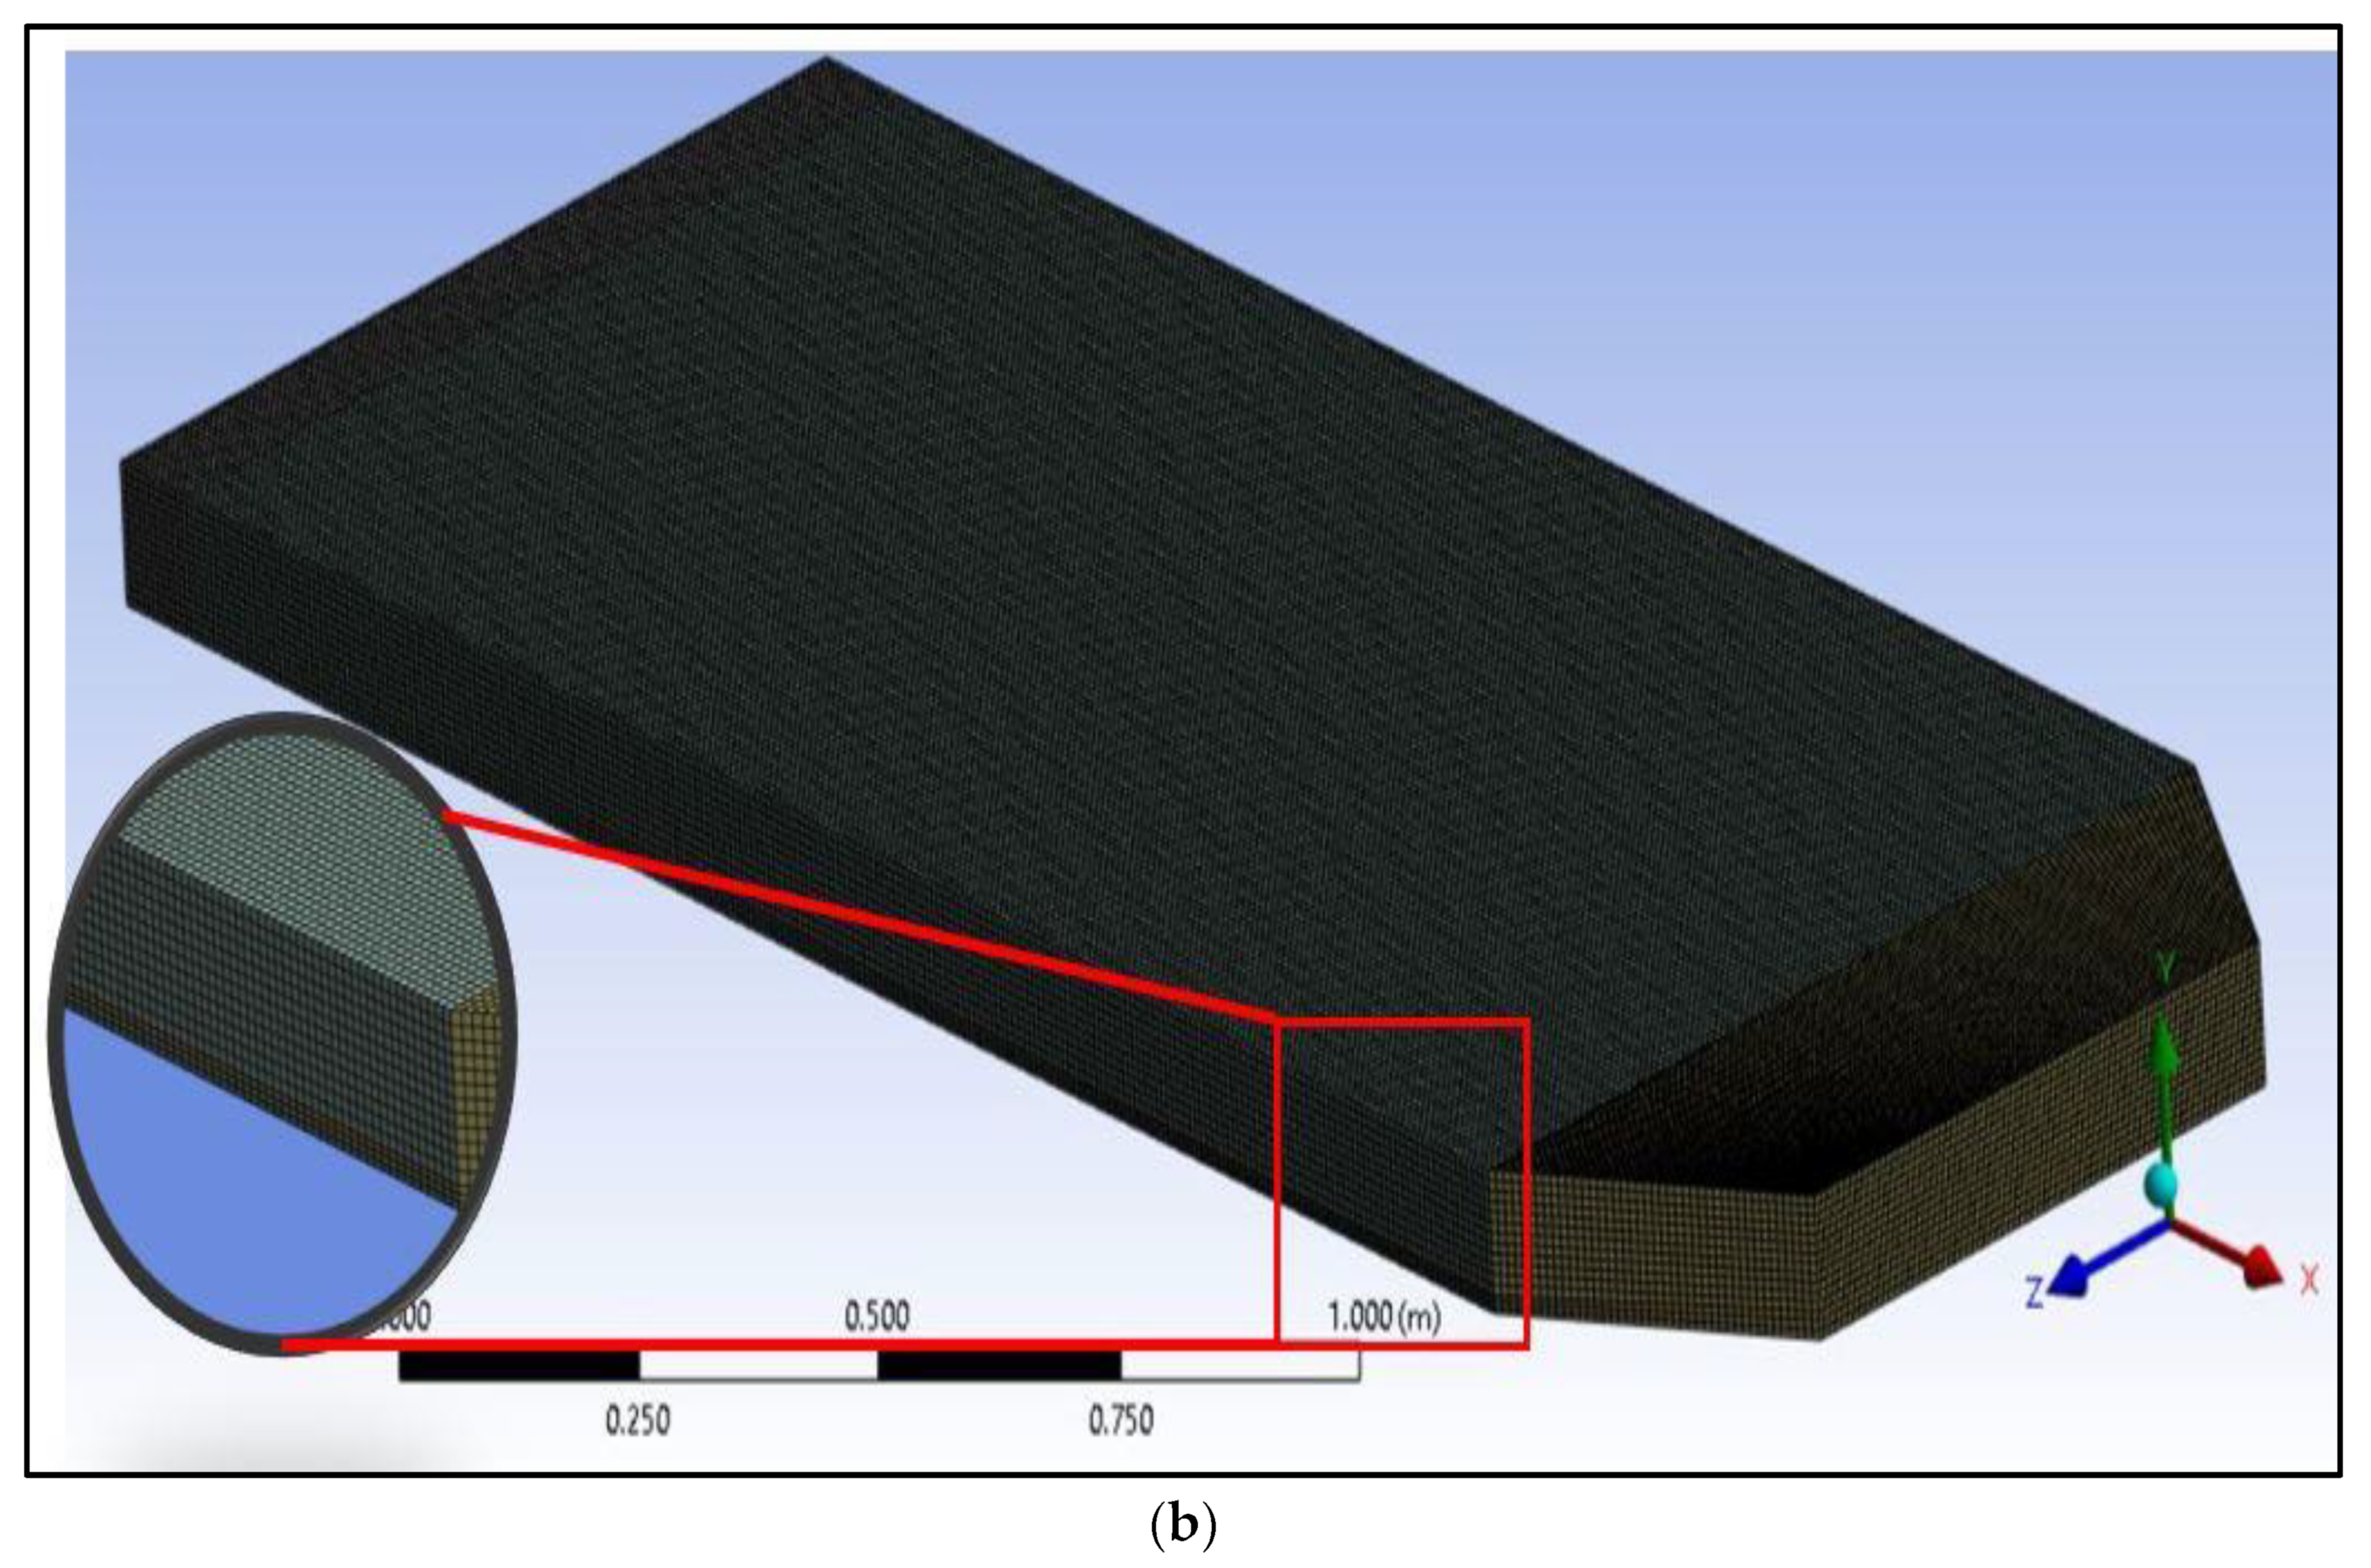
The 3D numerical study is performed using Ansys Fluent 2019 R3. The air flow is in the x-direction. The quadrilateral mesh is selected for all of the entrance, test, or porous and exit zones. Figure 8 shows the geometry and quadrilateral mesh of the SAH for the case of 25% of the length of the WM of the full-length test section at a distance 1.5 m from the inlet. The boundary conditions for the momentum and energy equations, as well as for thermal radiation, are given in Table 5. The ranges of inlet fluid temperature and solar intensity as obtained from experimental results are 29–36.5 °C and 200–1000 W/m2, respectively. The average wind velocity from all experimental data is obtained as 0.97 m/s.

3.3. Computational Details

In the setup of Ansys fluent, the accuracy is obtained from the numerical evaluation of the SAH by the pressure type solver, absolute velocity formulation, and steady time with double precision options. The coupled scheme and least square cell based discretization are selected in the pressure velocity coupling and spatial discretization, respectively, to obtain more perfect results. The standard pressure and second-order upwind momentum, turbulent kinetic energy, and turbulent dissipation rate and energy are selected to perform faster convergence with a greater accuracy. The relaxation factors for solution controls are selected as 0.3 for pressure, 0.7 for momentum, 0.8 for turbulent kinetic energy, and a turbulent dissipation rate. The convergence criteria for energy and all other cases were 10−6 and 10−4, respectively.

3.4. Grid-Independence Study

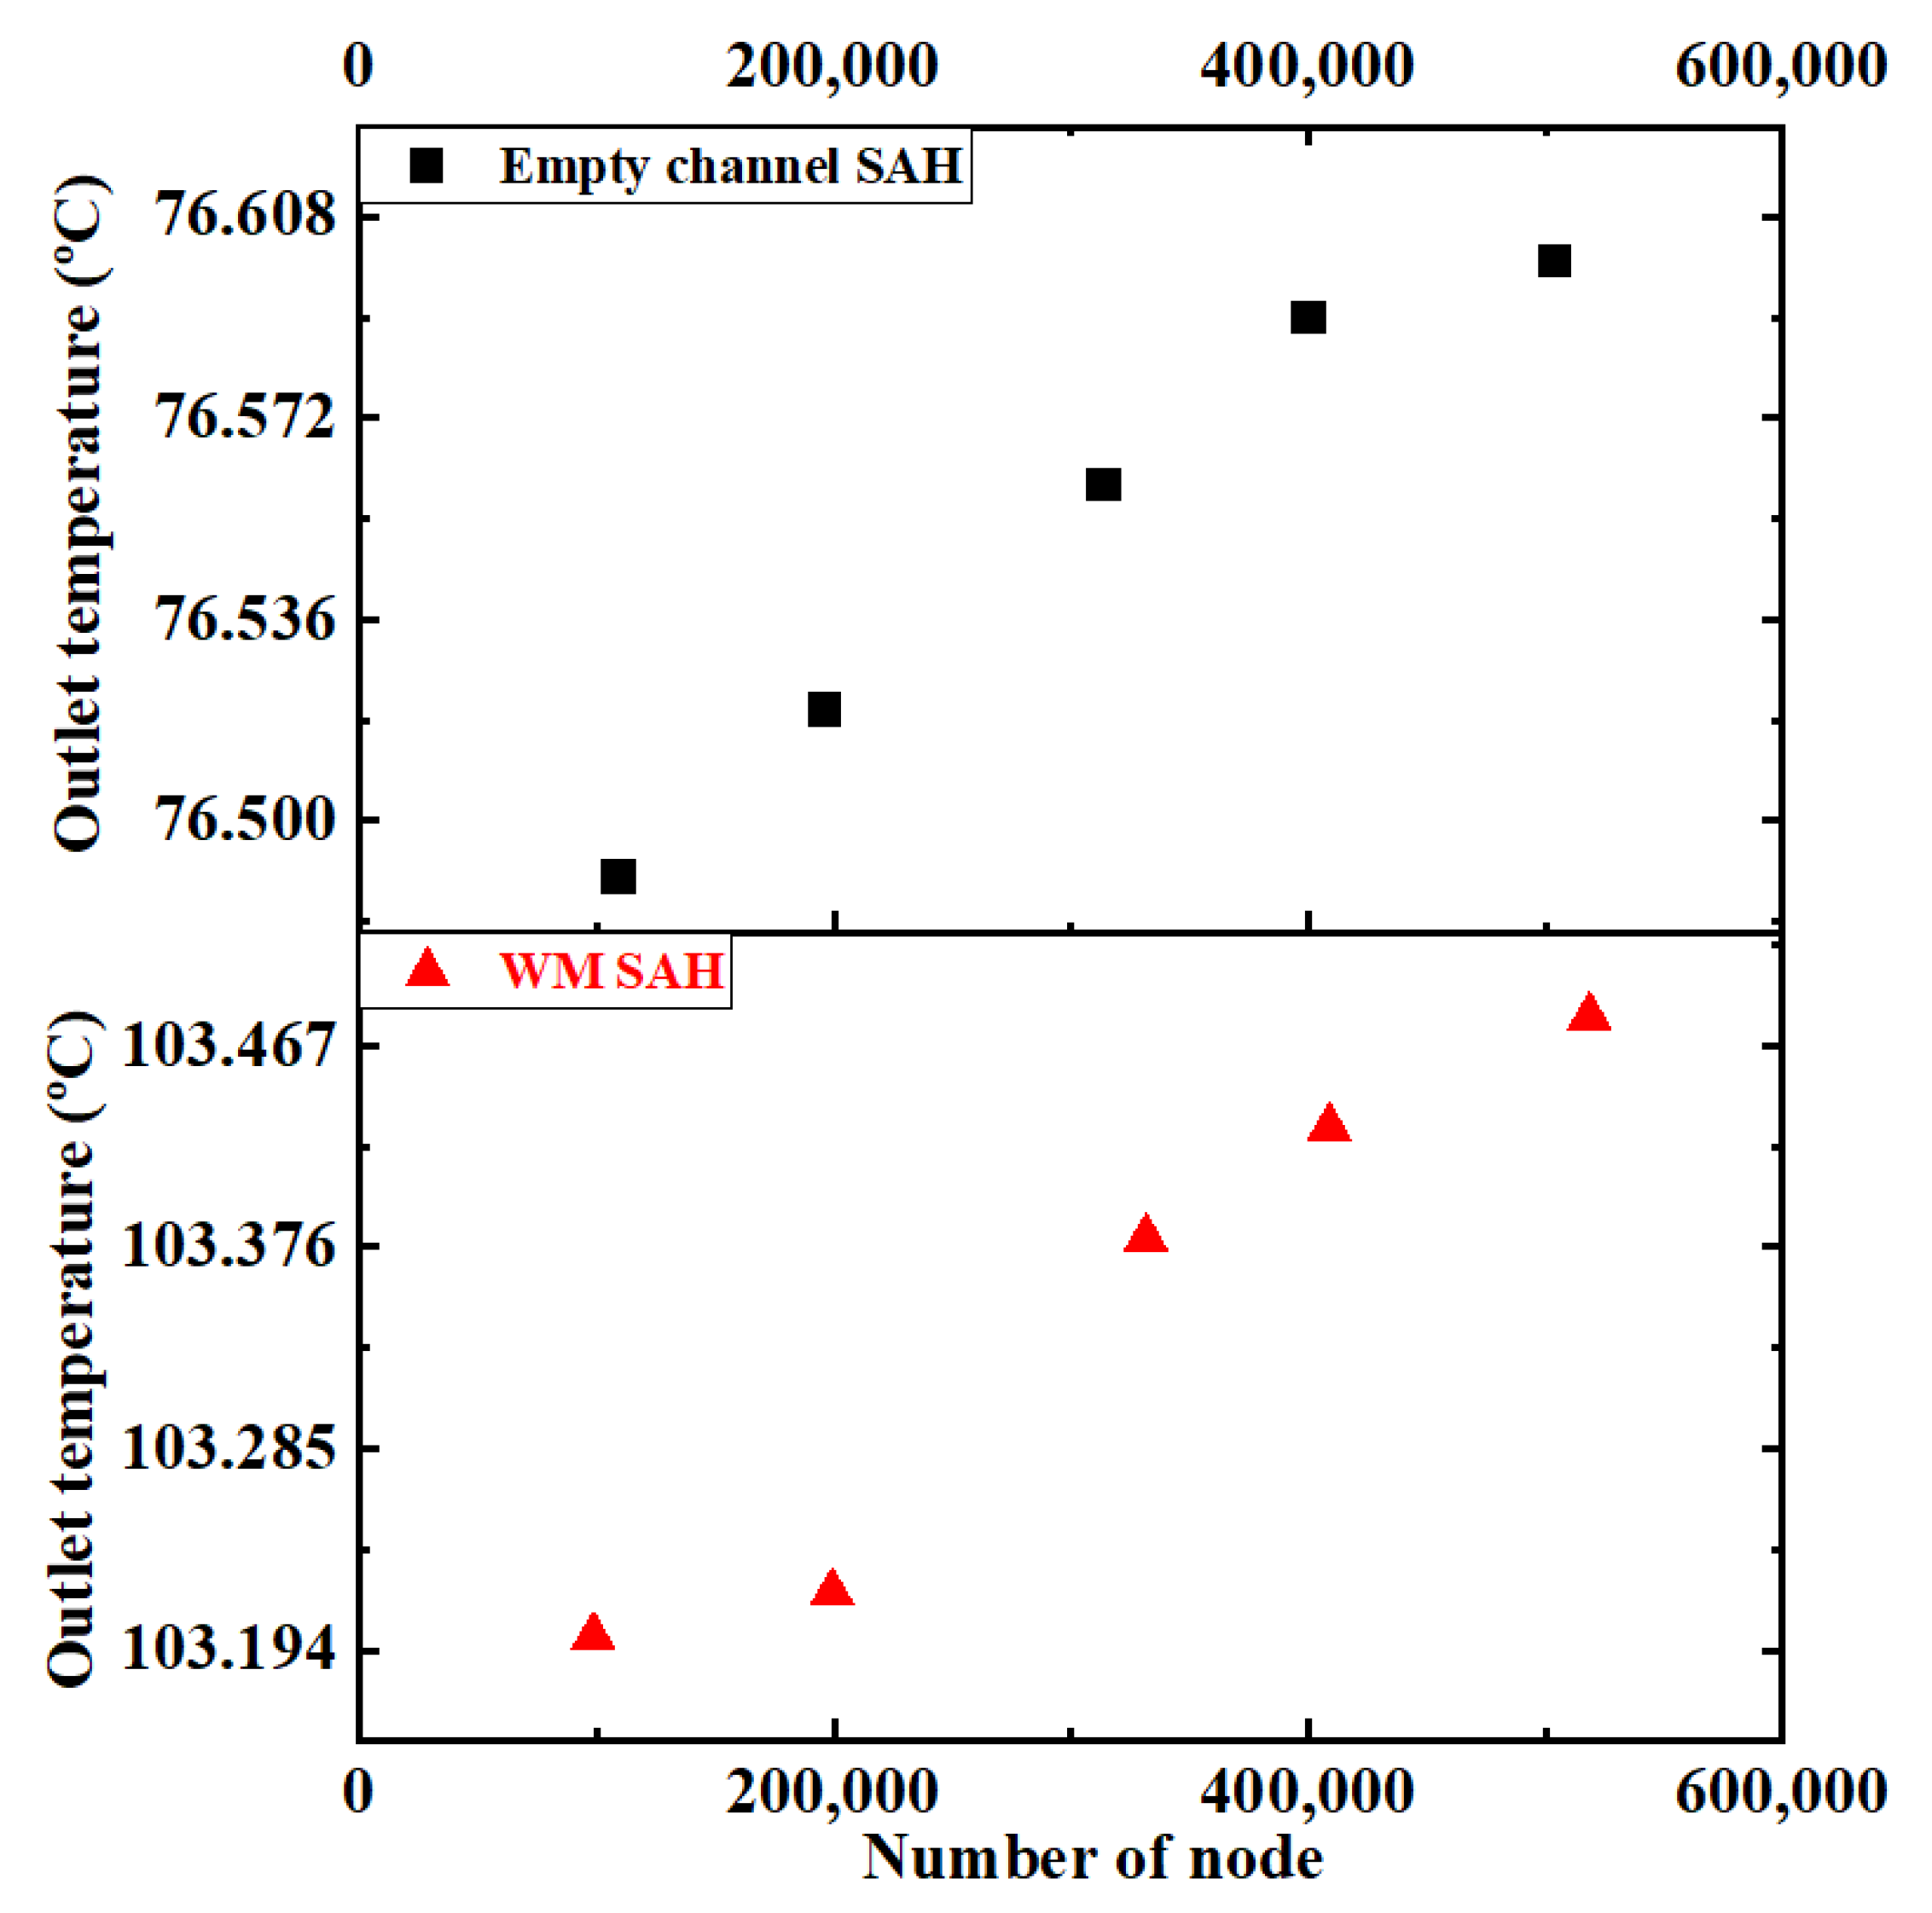
The grid study is significant for fixing the number of grids required to obtain the optimum temperature and pressure of the system. A uniform structured mesh with rectangular elements is used in the meshing of geometry. Table 6 shows the results of a grid study for different numbers of nodes. In total, 400,365 nodes for the empty channel and 409,136 nodes for the WM channel have lower deviation from the baseline. The percentage deviation is 0.01% and 0.048% for the outlet temperature and a 1.25% and 0% pressure drop in the empty channel SAH and WM SAH, respectively. Hence, numerical analysis is performed with 400,365 and 409,136 nodes for the empty channel and the WM channel for further study. The grid-independence study for the outlet temperature is shown in Figure 9.

3.5. Validation of Numerical Study with Experimental Data

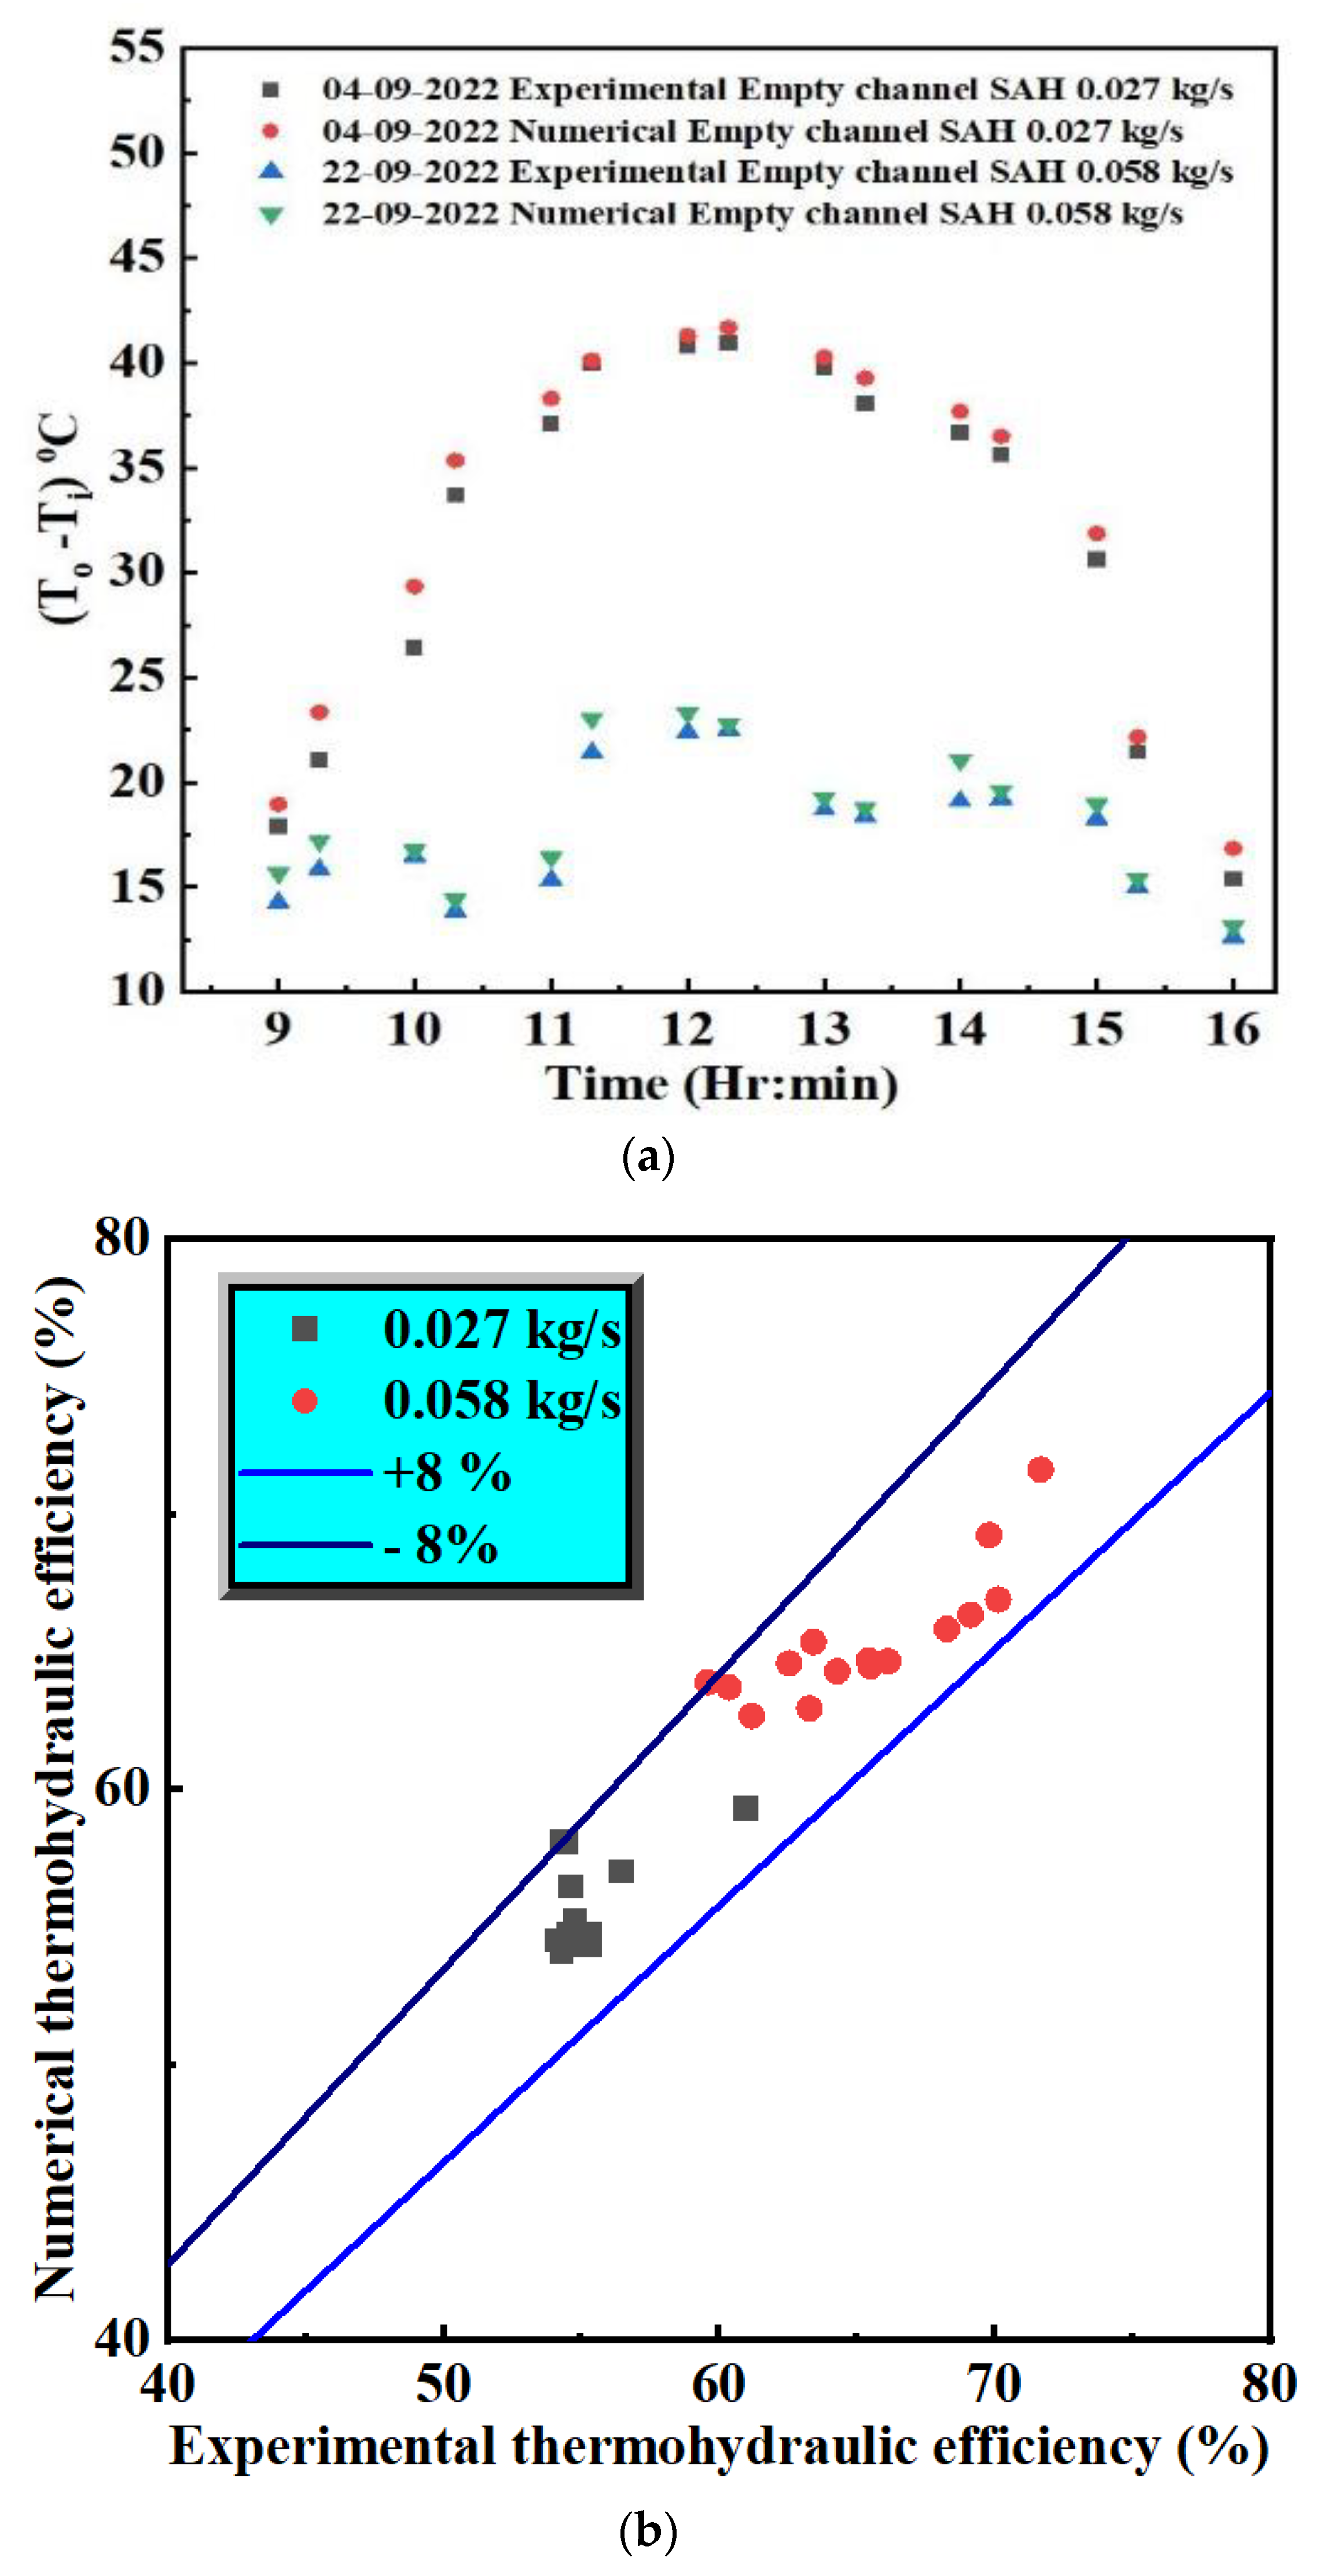
Comparisons between numerical and experimental results are performed, and the agreement between them validates both the obtained numerical and experimental results. Figure 10a shows the change in the temperature difference between the inlet and outlet during two days in September 2022 for two different values of air mass flow rate for the empty channel. As can be seen, there is a good agreement between the measured experimental and obtained numerical results, and the deviation in the temperature rise between the numerical and experimental value is 4%. Furthermore, the thermohydraulic efficiency of the experimental and numerical setups are calculated and shown for scenarios of 0.027 kg/s and for 0.058 kg/s in Figure 10b. The deviation between them do not exceed ±8% for 0.027 kg/s and for 0.058 kg/s for the empty channel. The validation for the temperature rise via the thermohydraulic efficiency for the numerical and experimental trials is between ±8%. A similar average range of deviation is considered in the work of Singh [41].

4. Results and Discussion

A numerical analysis is performed for the date 4 September 2022 at 13.00 h with a sunshine factor as 0.809 [27,57,70]. The experimental inlet temperature, ambient temperature, and solar intensity are considered for numerical study on the same day. The average temperature of the absorber plate and glass plate of the empty channel is considered as the inlet temperature for the WM SAH in the numerical simulation [27].

4.1. Numerical Results for Different Case Studies

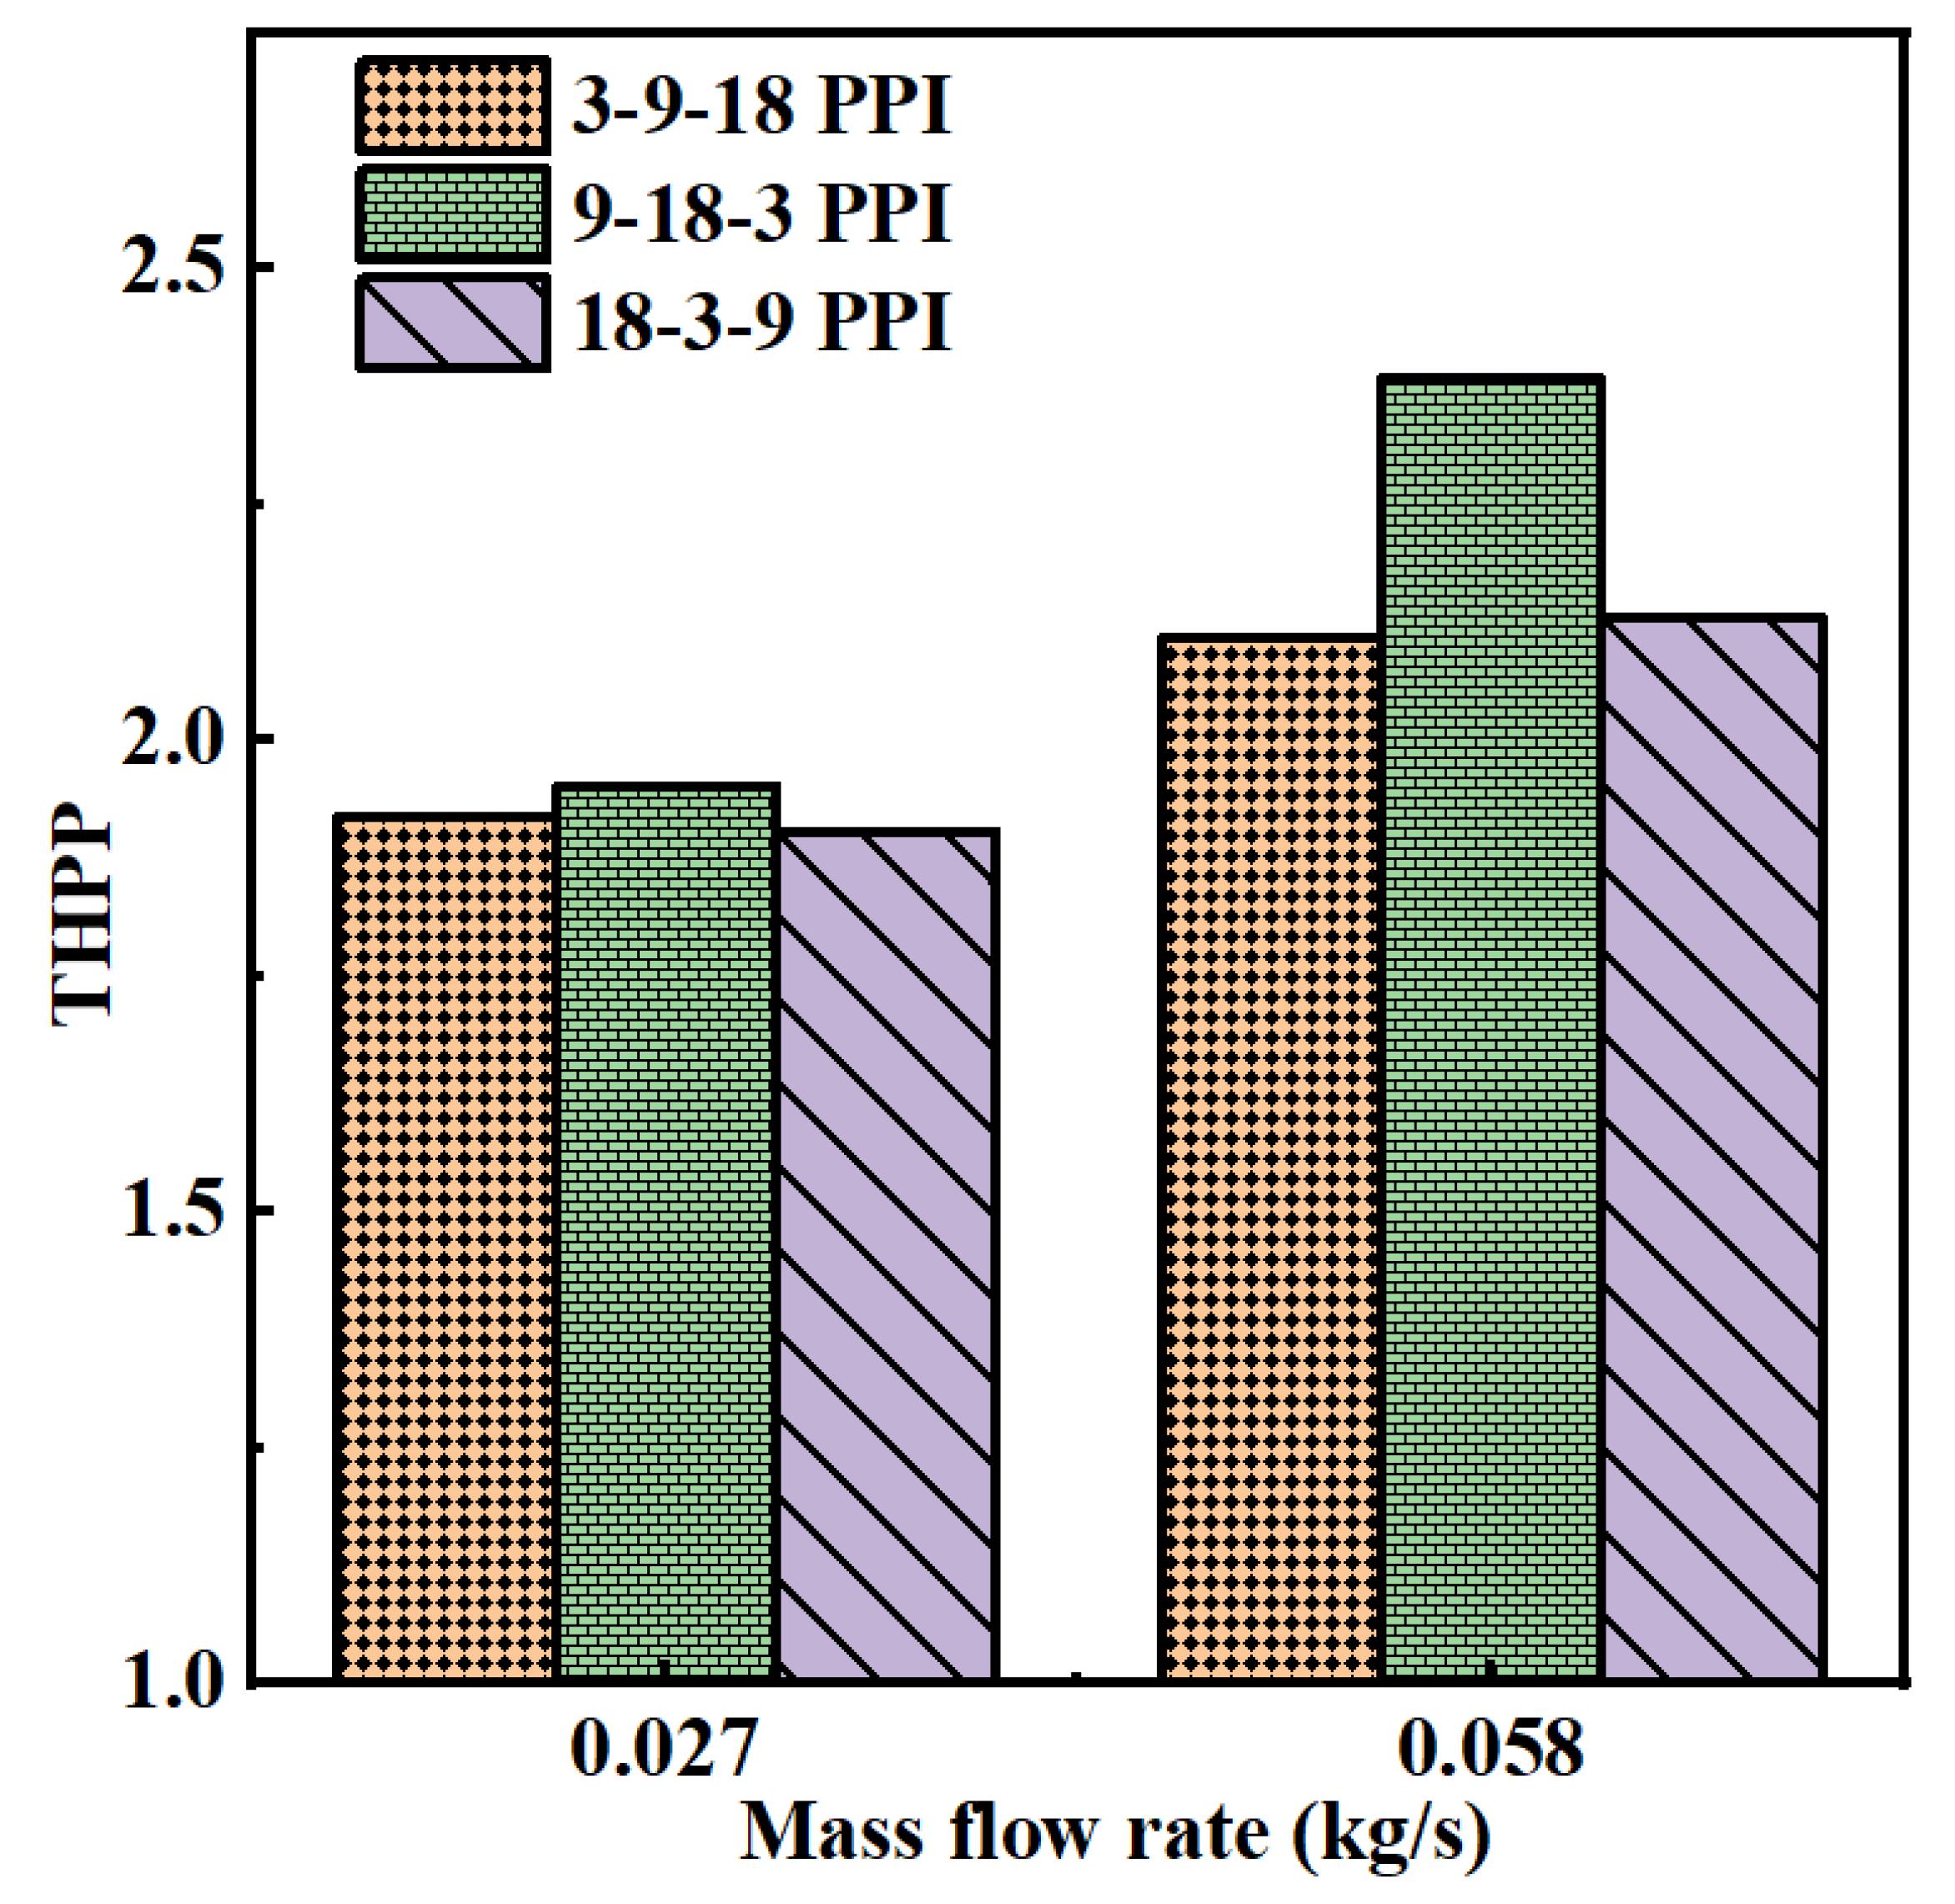
A numerical comparison of Cases 3-9-18, 9-18-3, and 18-3-9 is performed for 0.027 and 0.058 kg/s. Figure 11 shows that the THPP for the full length of Case 9-18-3 is 13.04% and 11.92% higher than for Case 3-9-18 and 18-3-9 PPI case, respectively. The 9-18-3 PPI case has porosities of 0.812, 0.917, and 0.894, respectively.
The lower porosity contains more material. Hence lower porosity near the wall (i.e., near to absorber plate) absorbs more heat from the absorber plate towards WM. Then heat is transferred to the incoming air which is available in the channel [4,71]. Further, the lower porosity occupies a greater specific area density and increases the volumetric heat transfer coefficient. For this reason, there is a greater heat transfer to the working fluid which minimizes the absorber plate temperature, reducing the thermal losses to the atmosphere; therefore, the thermal efficiency increases. Hence, the sequence from the absorber plate side is a 0.812 porosity near to the wall, then 0.917 and 0.894 porosities of Al WM, as the porosity for the 18 and 3 PPI is nearly identical. For the same porosity, the decreasing gradient in PPI from the absorber plate side minimizes the thickness of the thermal boundary layer which lowers the pressure drop and ultimately reduces the friction factor and increases the thermohydraulic performance parameter. The pitch-to-wire diameter ratios for the 9-18-3 PPI case are 3.54, 6, and 7.54, respectively. For the 0.917 and 0.894 porosities, the pitch-to-wire diameter ratios are 6 and 7.54 respectively. The friction factor is less due to the combination of 0.917 porosity and pitch-to-wire diameter ratio of 6, as a result there is a decrease in pressure drop. A similar trend is observed in the work of [18,36]. For the 18 and 3 PPI cases, the ratios of the pitch-to-wire diameter are 6 and 7.54, which ae nearly the same. The 1/n Φ ratios for 9-18-3 PPI are 0.31, 0.14, and 0.37, respectively. For the same pitch-to-wire diameter ratio, the 1/np ratio increases and the friction factor also increases; hence, the 18 PPI should be near to the absorber plate to obtain a higher THPP. The results were similar for the 9 and 3 PPI Al WM; the 1/n Φ ratios are 0.31 and 0.37, which are very similar. For the same 1/n Φ ratio, the friction factor is lower for lower values of the pitch-to-wire diameter ratio, and hence the THPP is higher. The same consideration was investigated in the literature [18,36]. Thus, the present numerical analysis calculated and presented in Figure 11 is correct. Hence, further simulations consider Case 9-18-3 to be the full-length WM condition and the results are compared with a WM of 25% of the length of the full-length test section for four different scenarios, i.e., 0, 0.5, 1, and 1.5 m from the inlet.

4.1.1. Comparative Study of Temperature Rise, Nusselt Number, Friction Factor, and THPP

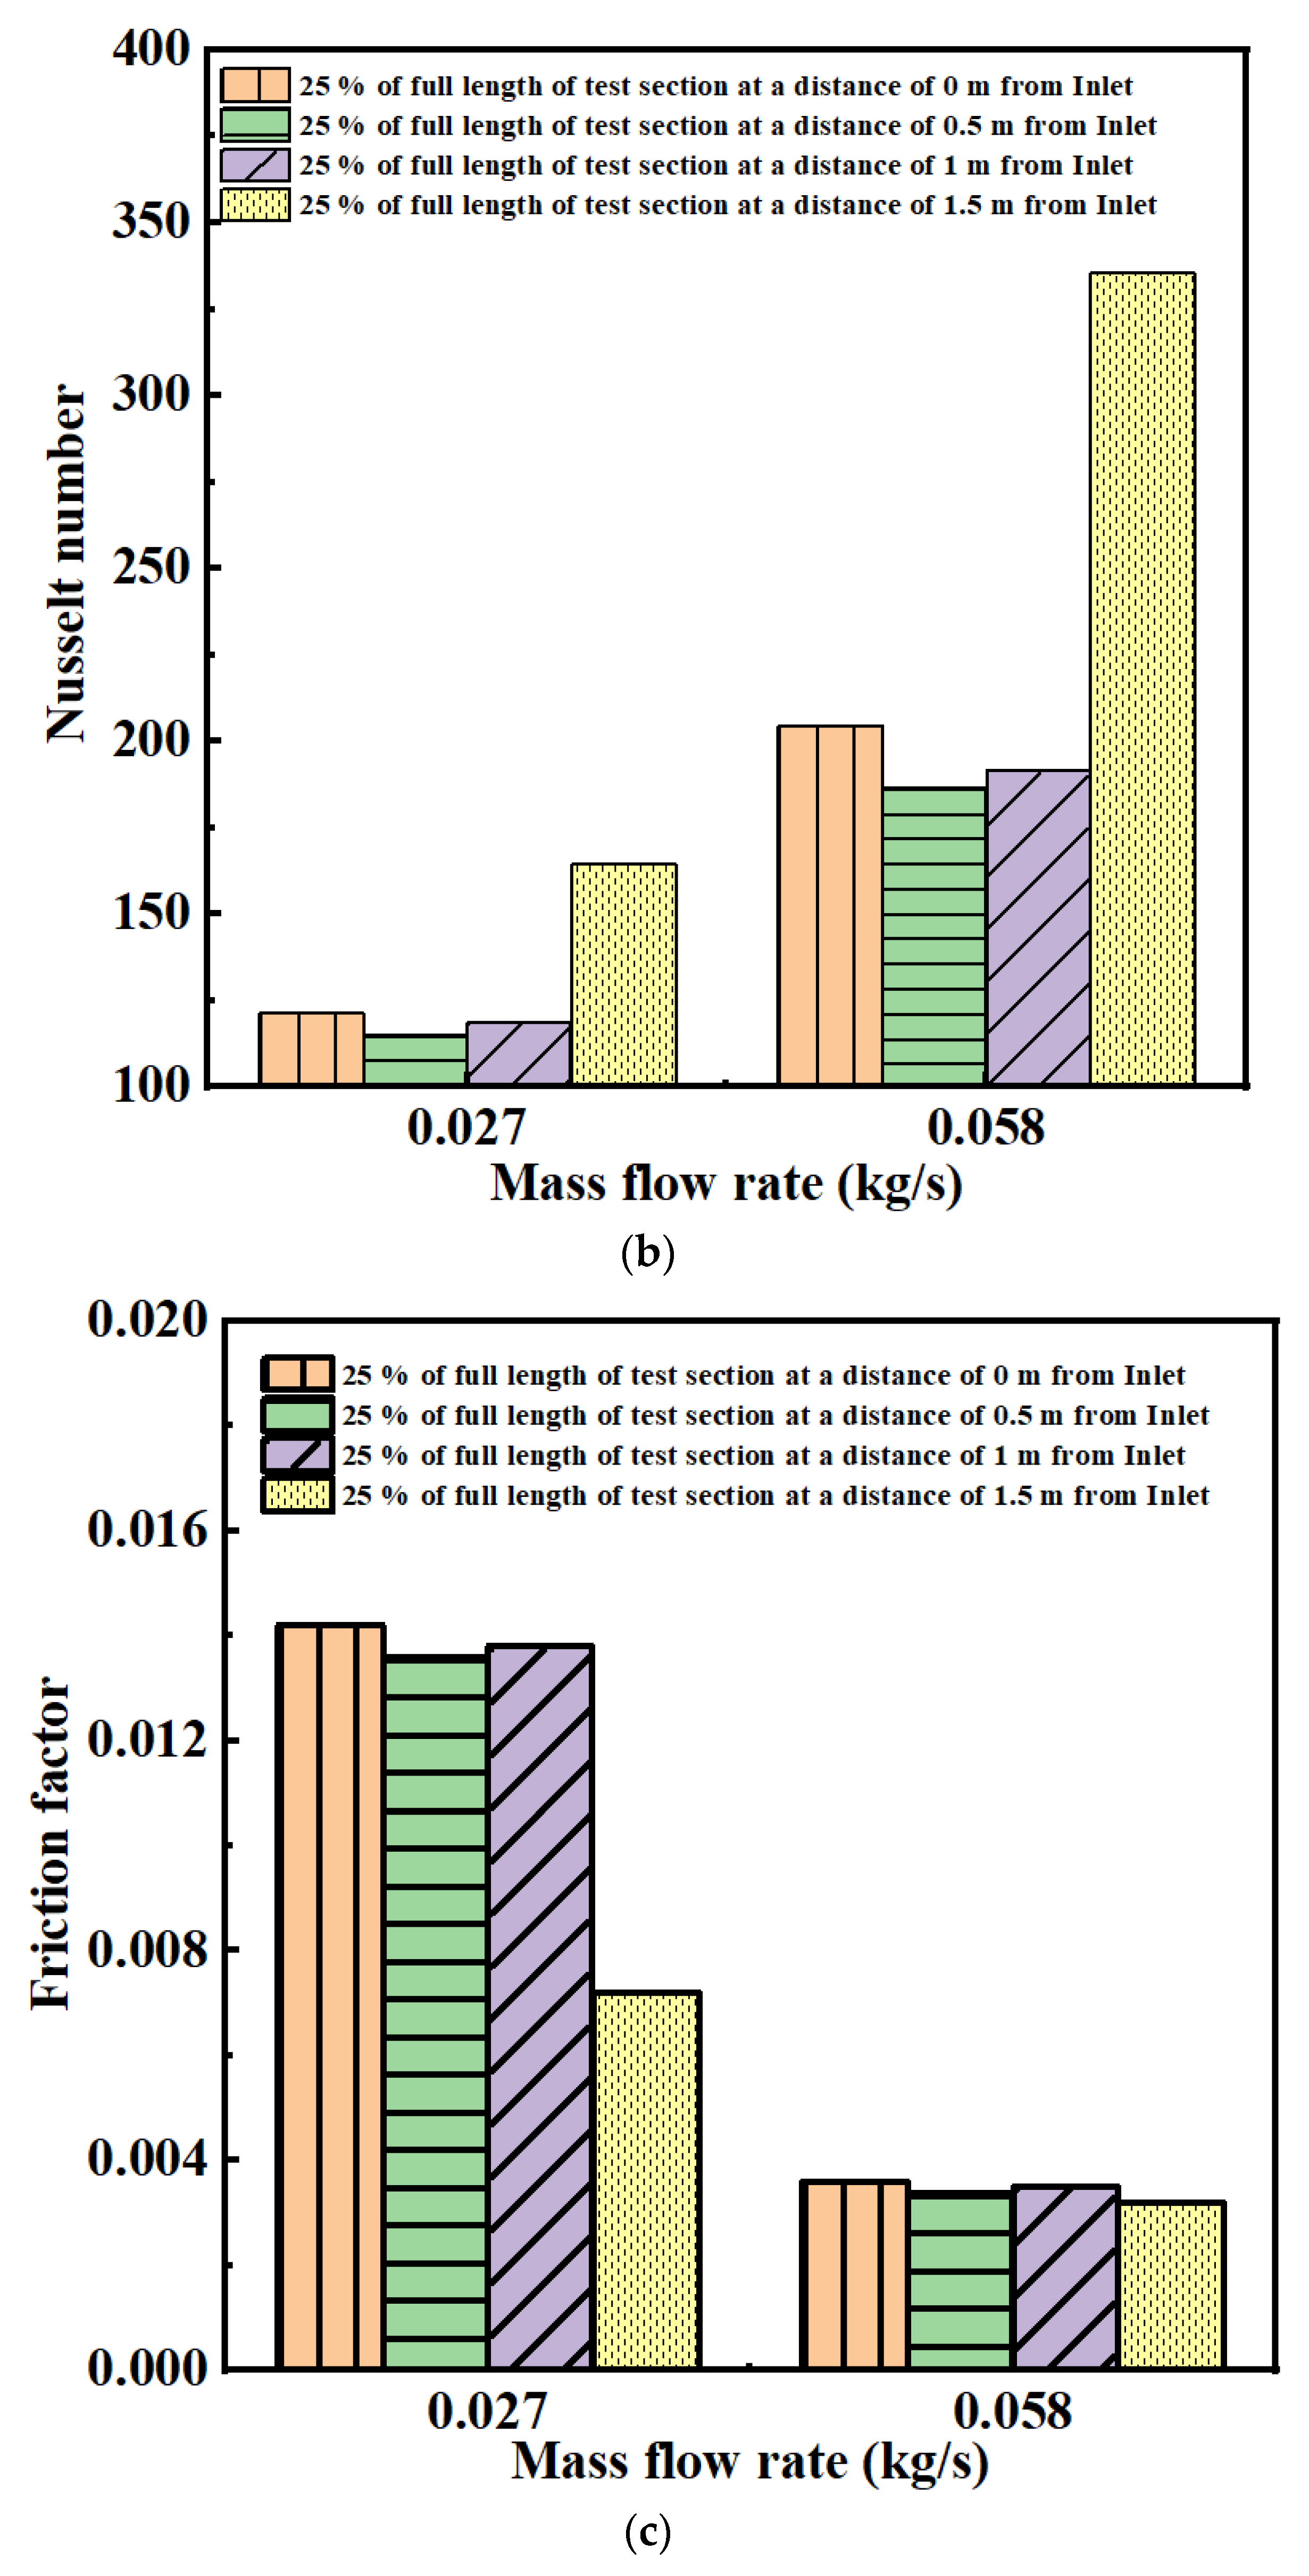
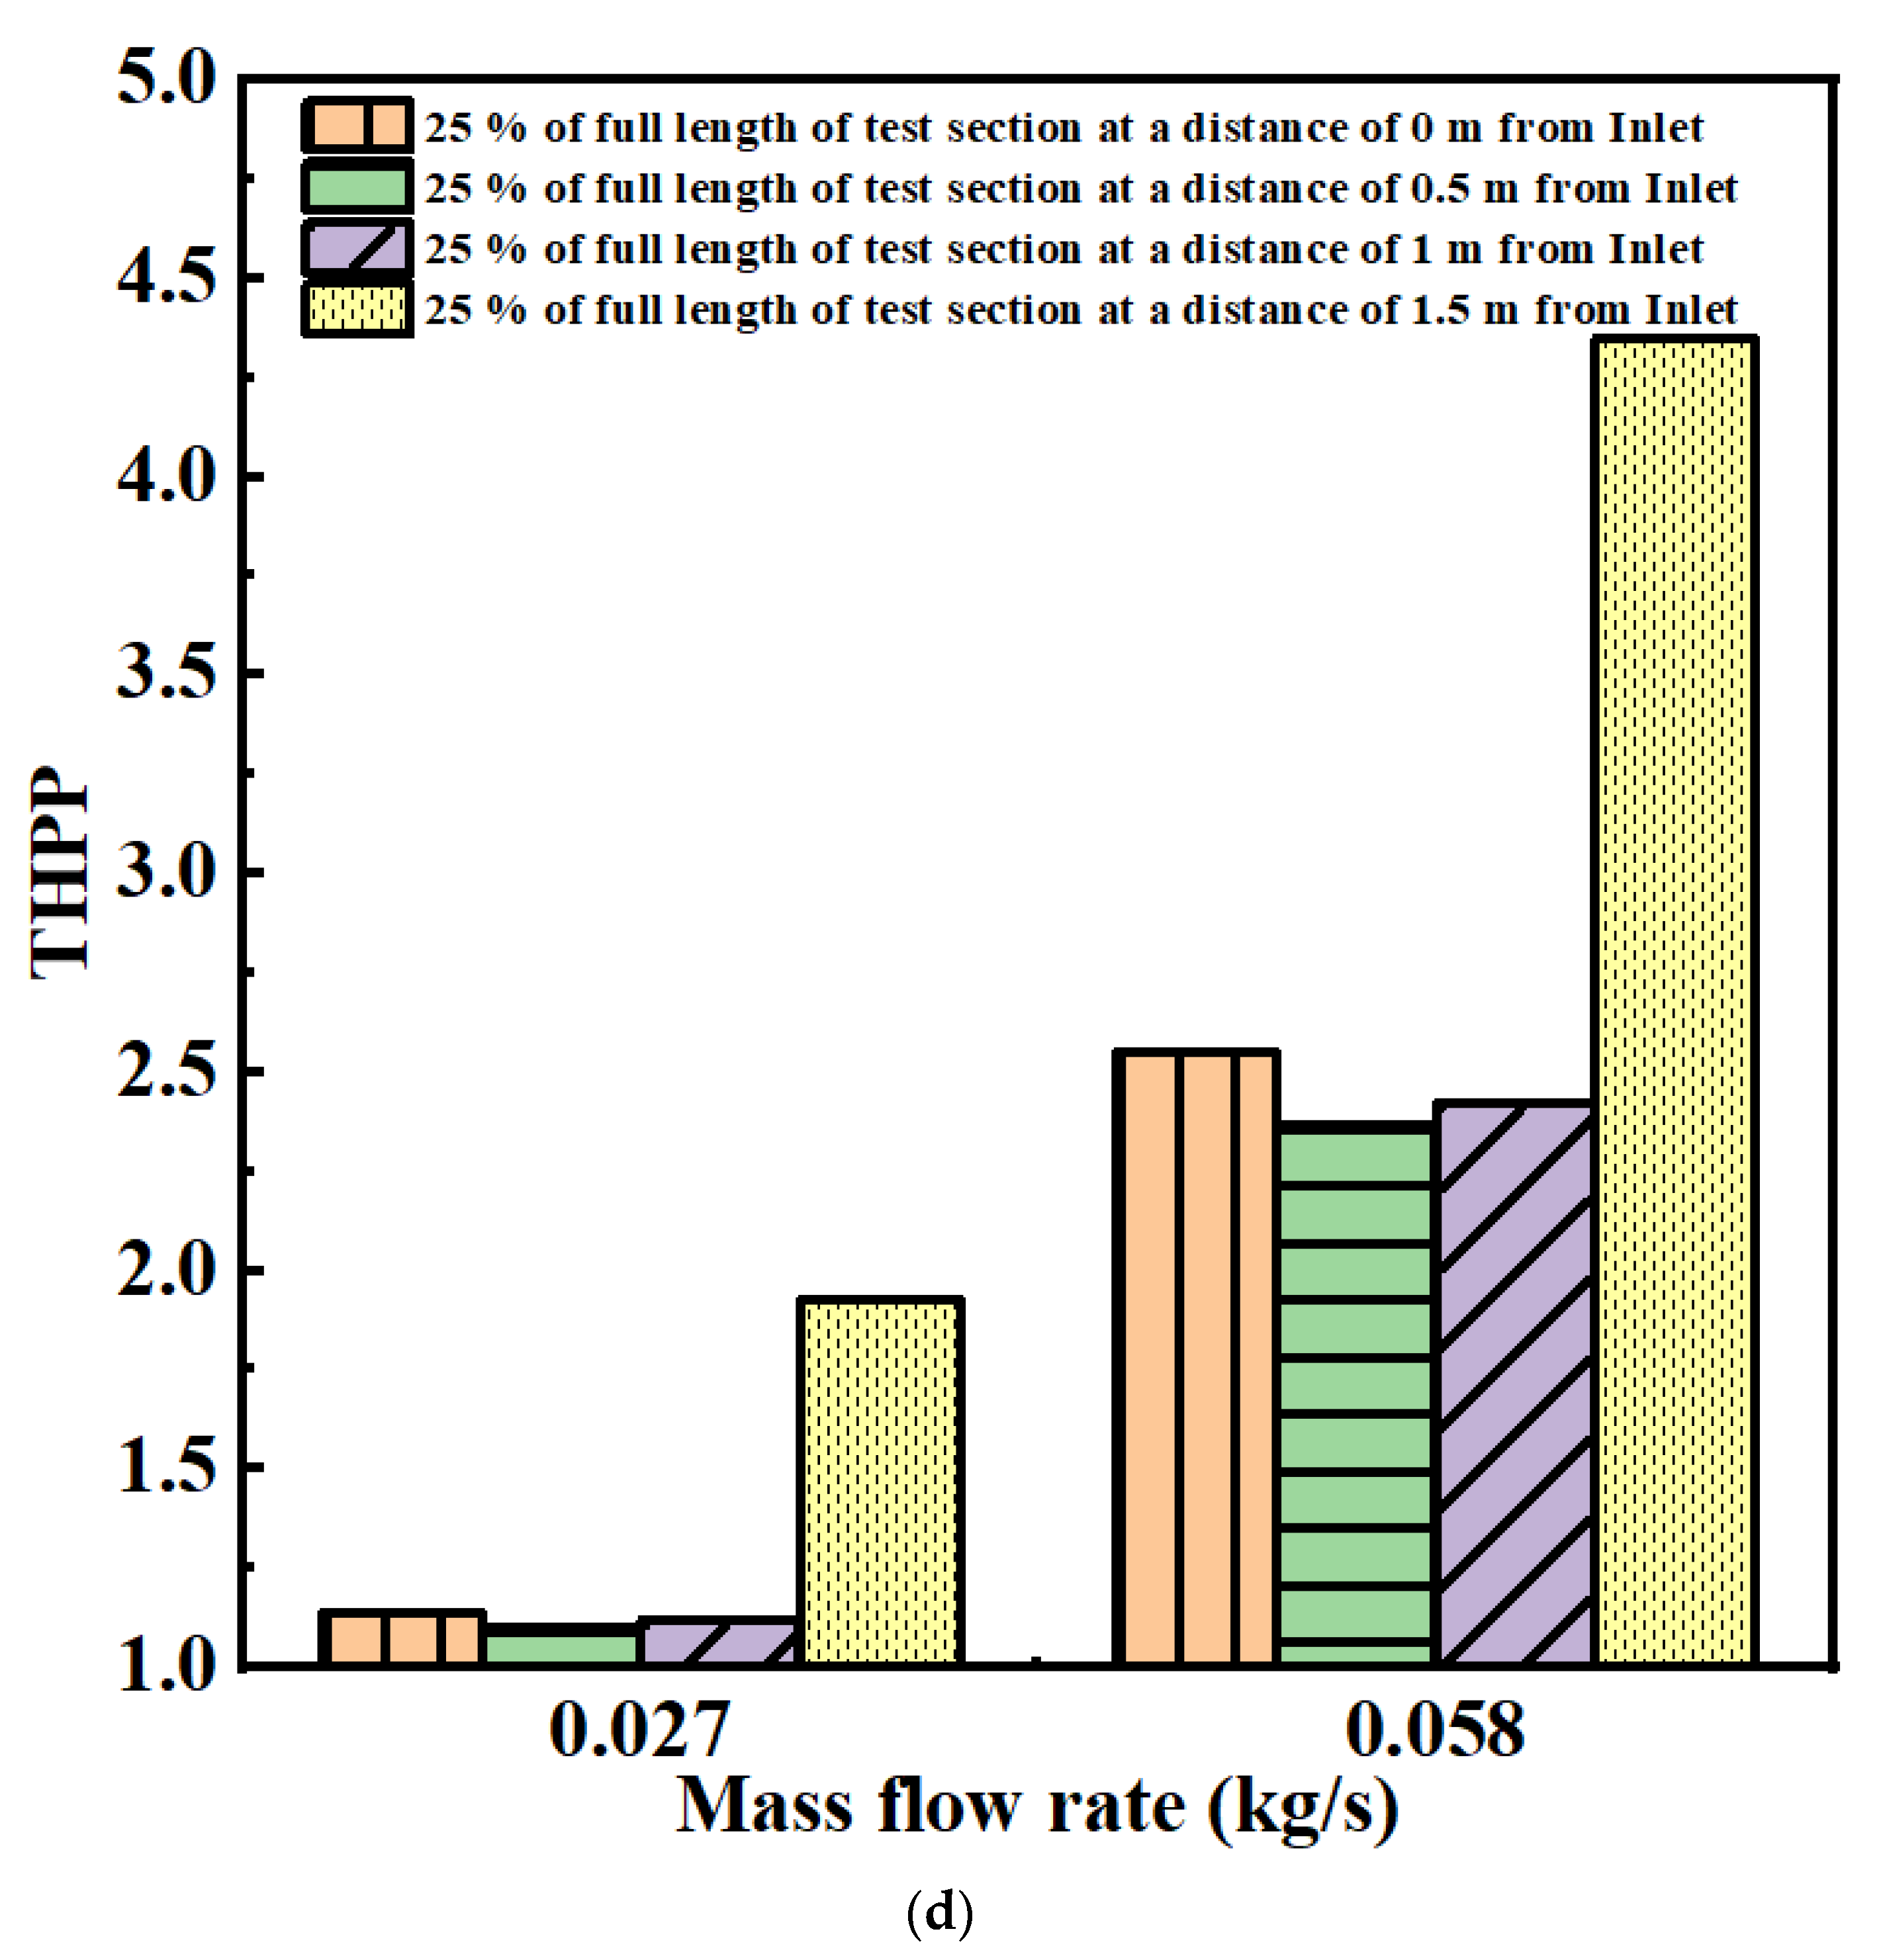
The case of a WM of 25% of the length of the WM of the full-length test section is simulated at four different locations for the same input conditions. Figure 12a,b show the temperature rise and Nusselt number variation for the 0.027 and 0.058 kg/s mass flow rates. The 25% length case at a distance of 1.5 m from the inlet shows a greater temperature rise and a greater heat-transfer enhancement compared to other 25% length cases at distances 0, 0.5, and 1 m from the inlet. The average temperature rises and average Nusselt number for the 25% length case at a distance 1.5 m from the inlet is 2.34% and 38.65% higher for the 0.027 kg/s mass flow rate and 1.51% and 72.60% higher at the 0.058 kg/s mass flow rate, respectively, comparing all other cases. Figure 12c shows a lower friction factor for the 25% length case at a distance 1.5 m from the inlet compared to all of the other cases. It has a lower friction factor by an average of 48% and 8.5% for the 0.027 and 0.058 kg/s mass flow rates, respectively. The temperature rise reduces as the mass flow rate increases; this is because at high mass flow rate, the travel time for air is lower, hence it absorbs less heat. The 25% length case at a distance of 1.5 m from the inlet had a better THPP value compared to distances of 0, 0.5, and 1 m away from the inlet for the 0.027 and 0.058 kg/s mass flow rates, as shown in Figure 12d. It is an average THPP that is 72.69% and 77.83% higher than the all of the other cases. The outlet side has a higher temperature in the absorber plate compared to the inlet side; keeping the GWM at the outlet side, it absorbs more heat from the plate and when air passes through it, the velocity of the air is minimized, hence it absorbs more heat, and finally the temperature at the outlet is higher. The GWM at the outlet is helpful to lower the resistance to incoming air, and it is better for reducing the pressure distribution which gives a reduced pressure drop [54]. Hence, the 25% length case at a distance of 1.5 m from the inlet is better than the other cases. Hence, a WM of 25% of the full-length WM at a distance of 1.5 m from the inlet is selected for experimental analysis.

4.1.2. Temperature and Velocity Distribution in the 25% Length Case at a Distance 1.5 m from the Inlet for Single-Pass SAH

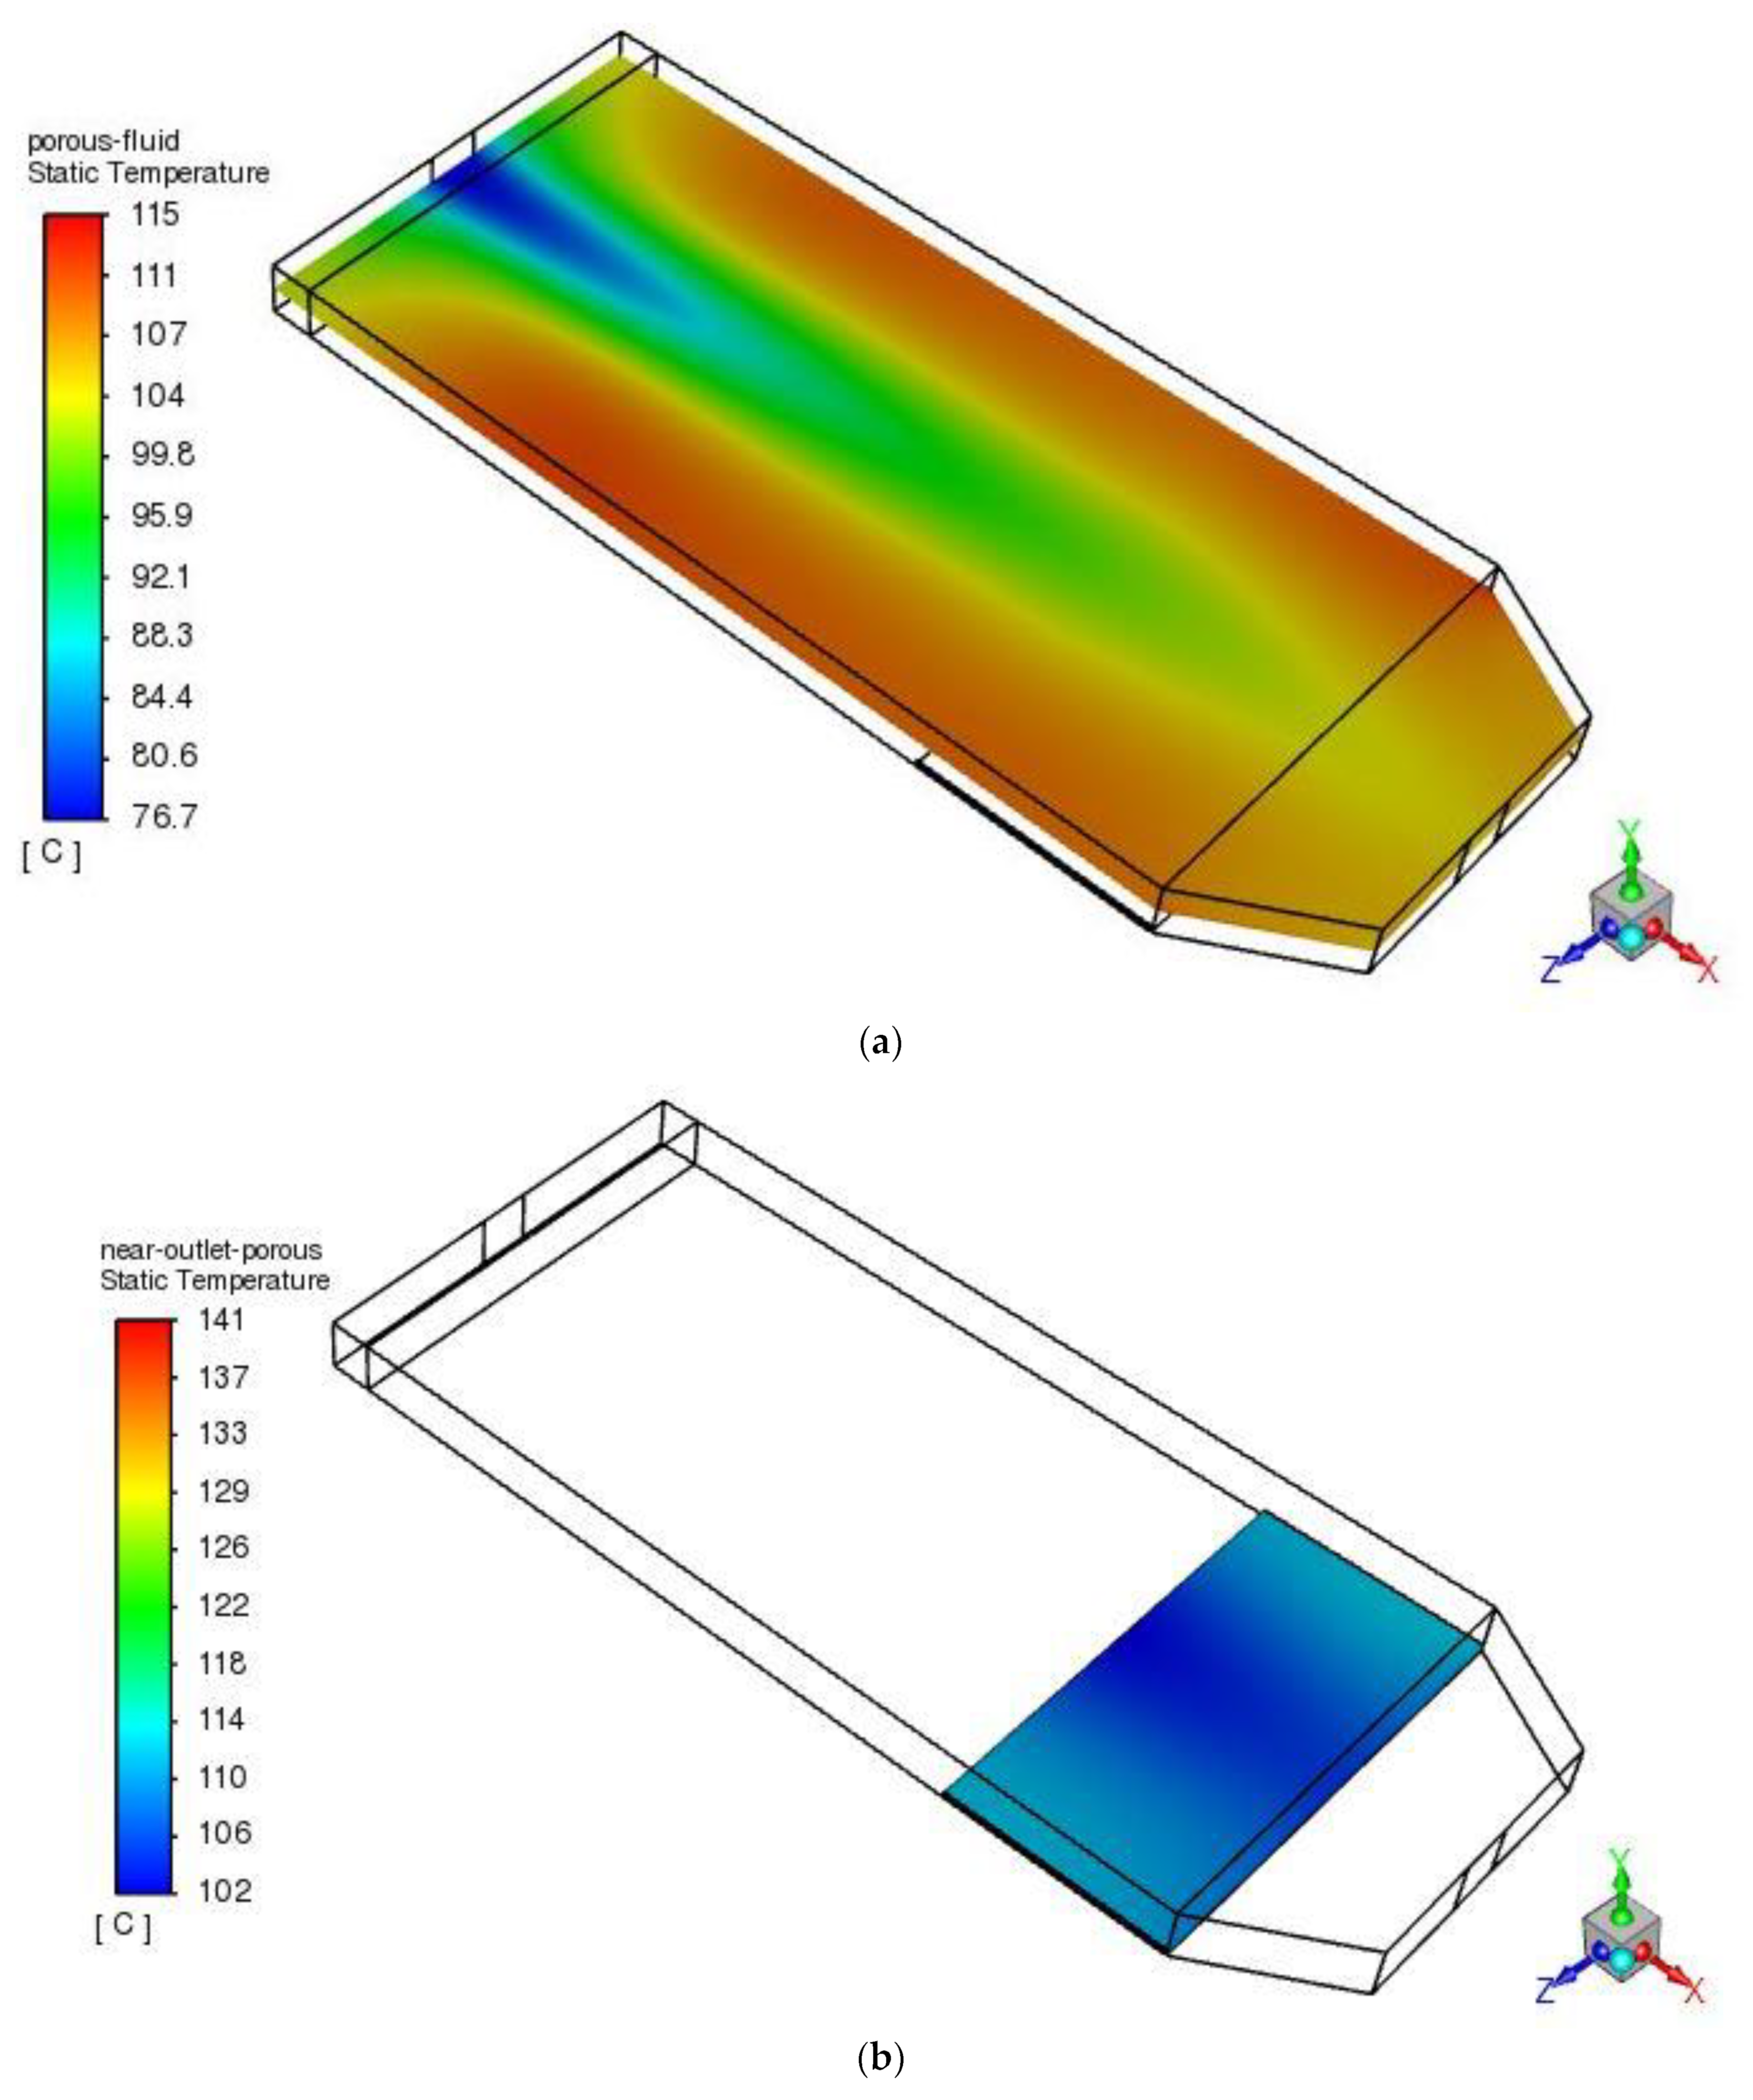
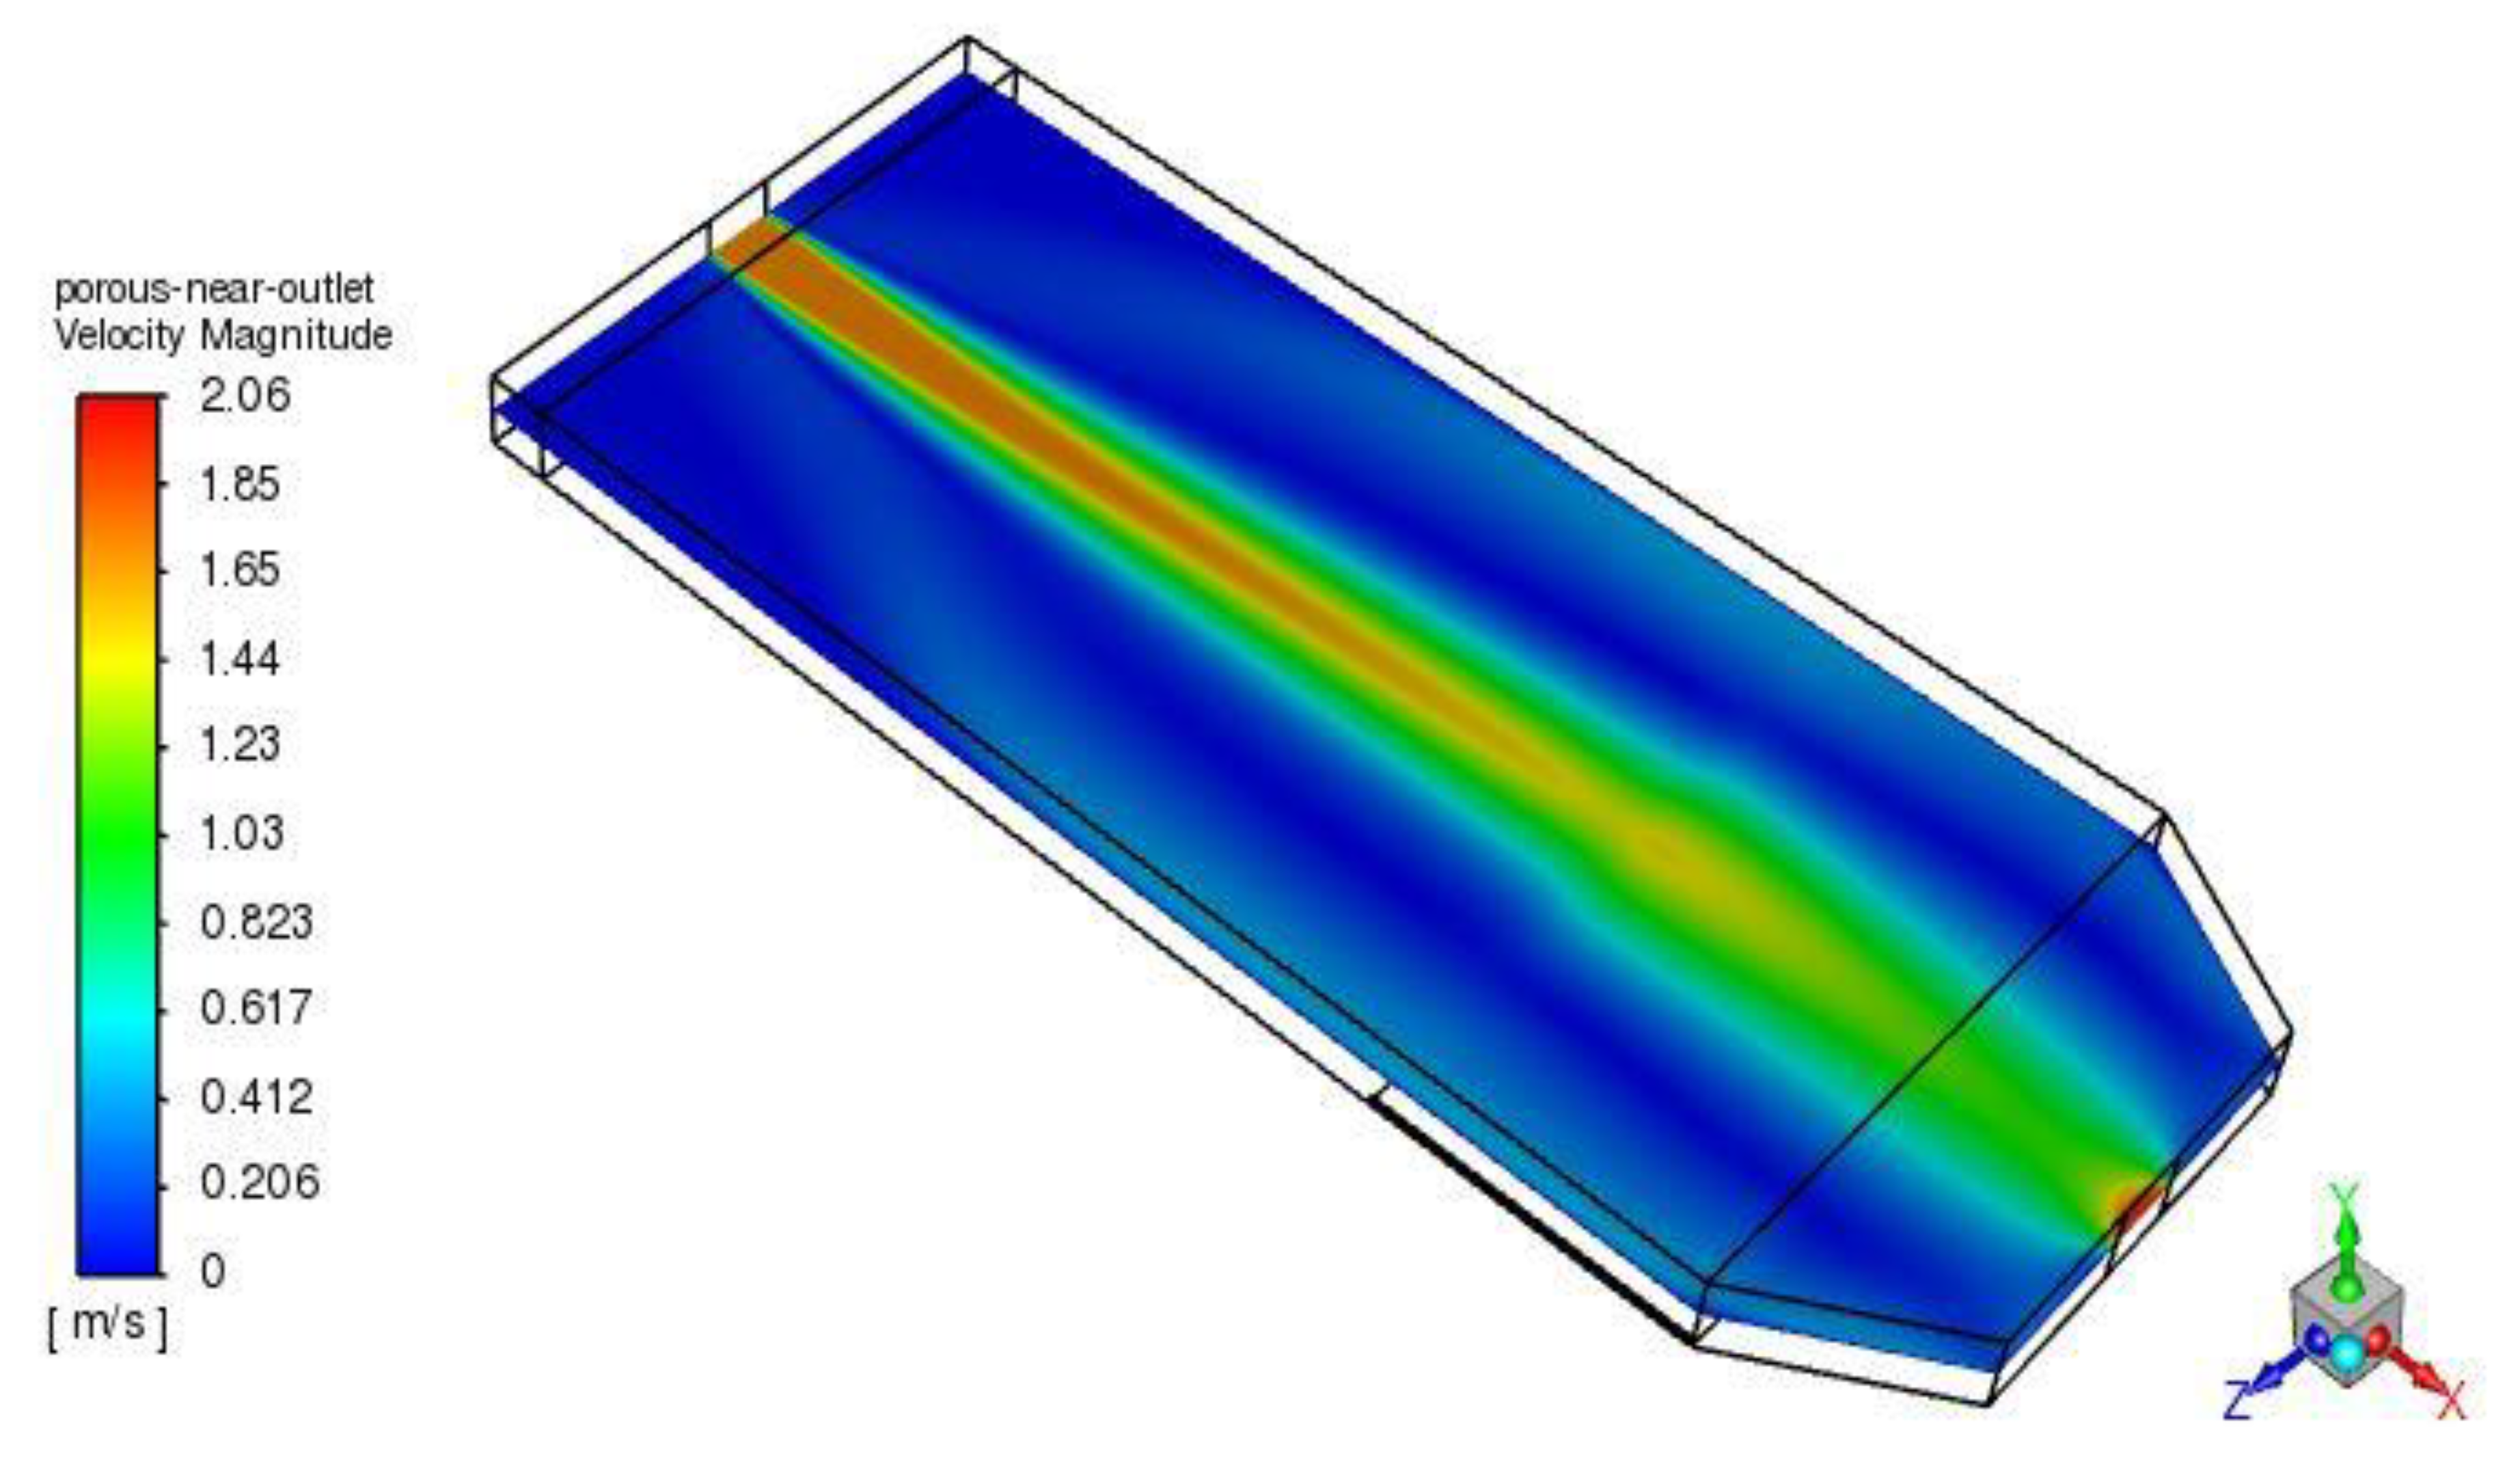
Figure 13a,b show the fluid temperature distribution along the plane and in the 25% length case of porous media near the outlet, respectively. It shows that the temperature is more homogenous in the porous zone. The heat transfer from the absorber plate to the WM and from the WM to the fluid is uniform. A 15 mm thickness of GWM at the outlet side gives a uniform temperature distribution. Figure 14 shows the velocity distribution along the plane in the porous SAH. The velocity in the porous zone is more uniform. Due to the lower velocity in the WM, a greater amount of heat is being absorbed; hence, there is an increase in the outlet temperature.

4.2. Experimental Results of Empty Channel and Porous SAH

4.2.1. Thermal Performance of Porous Bed SAH

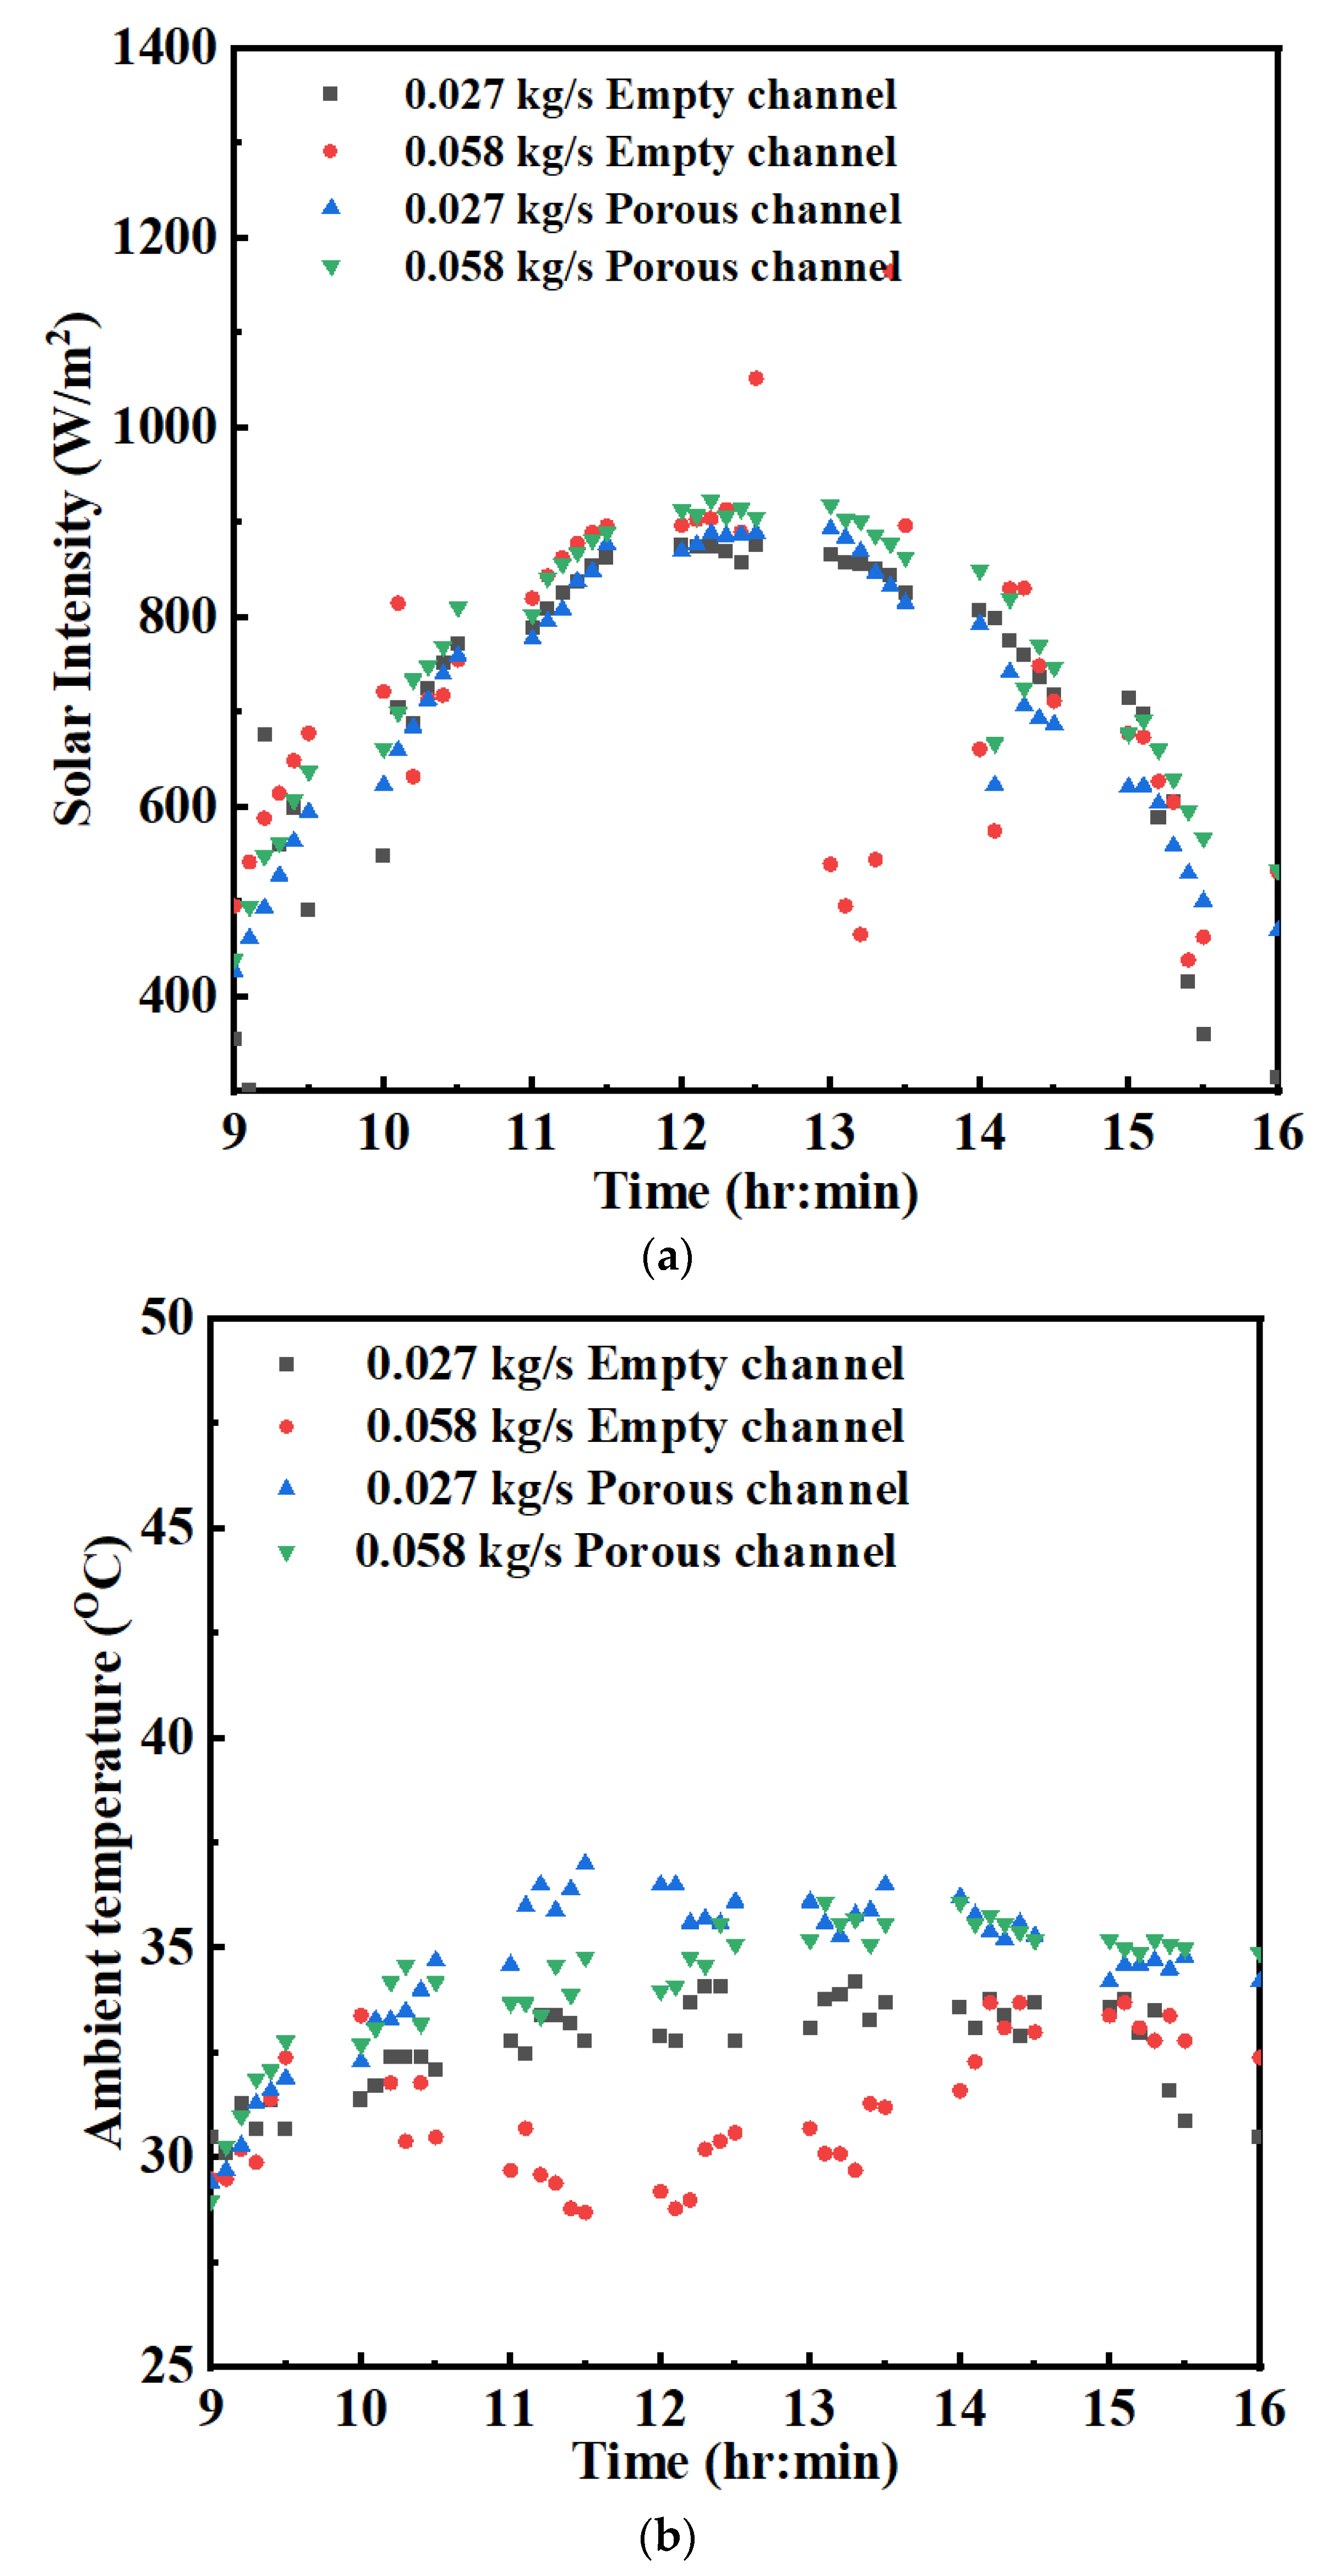
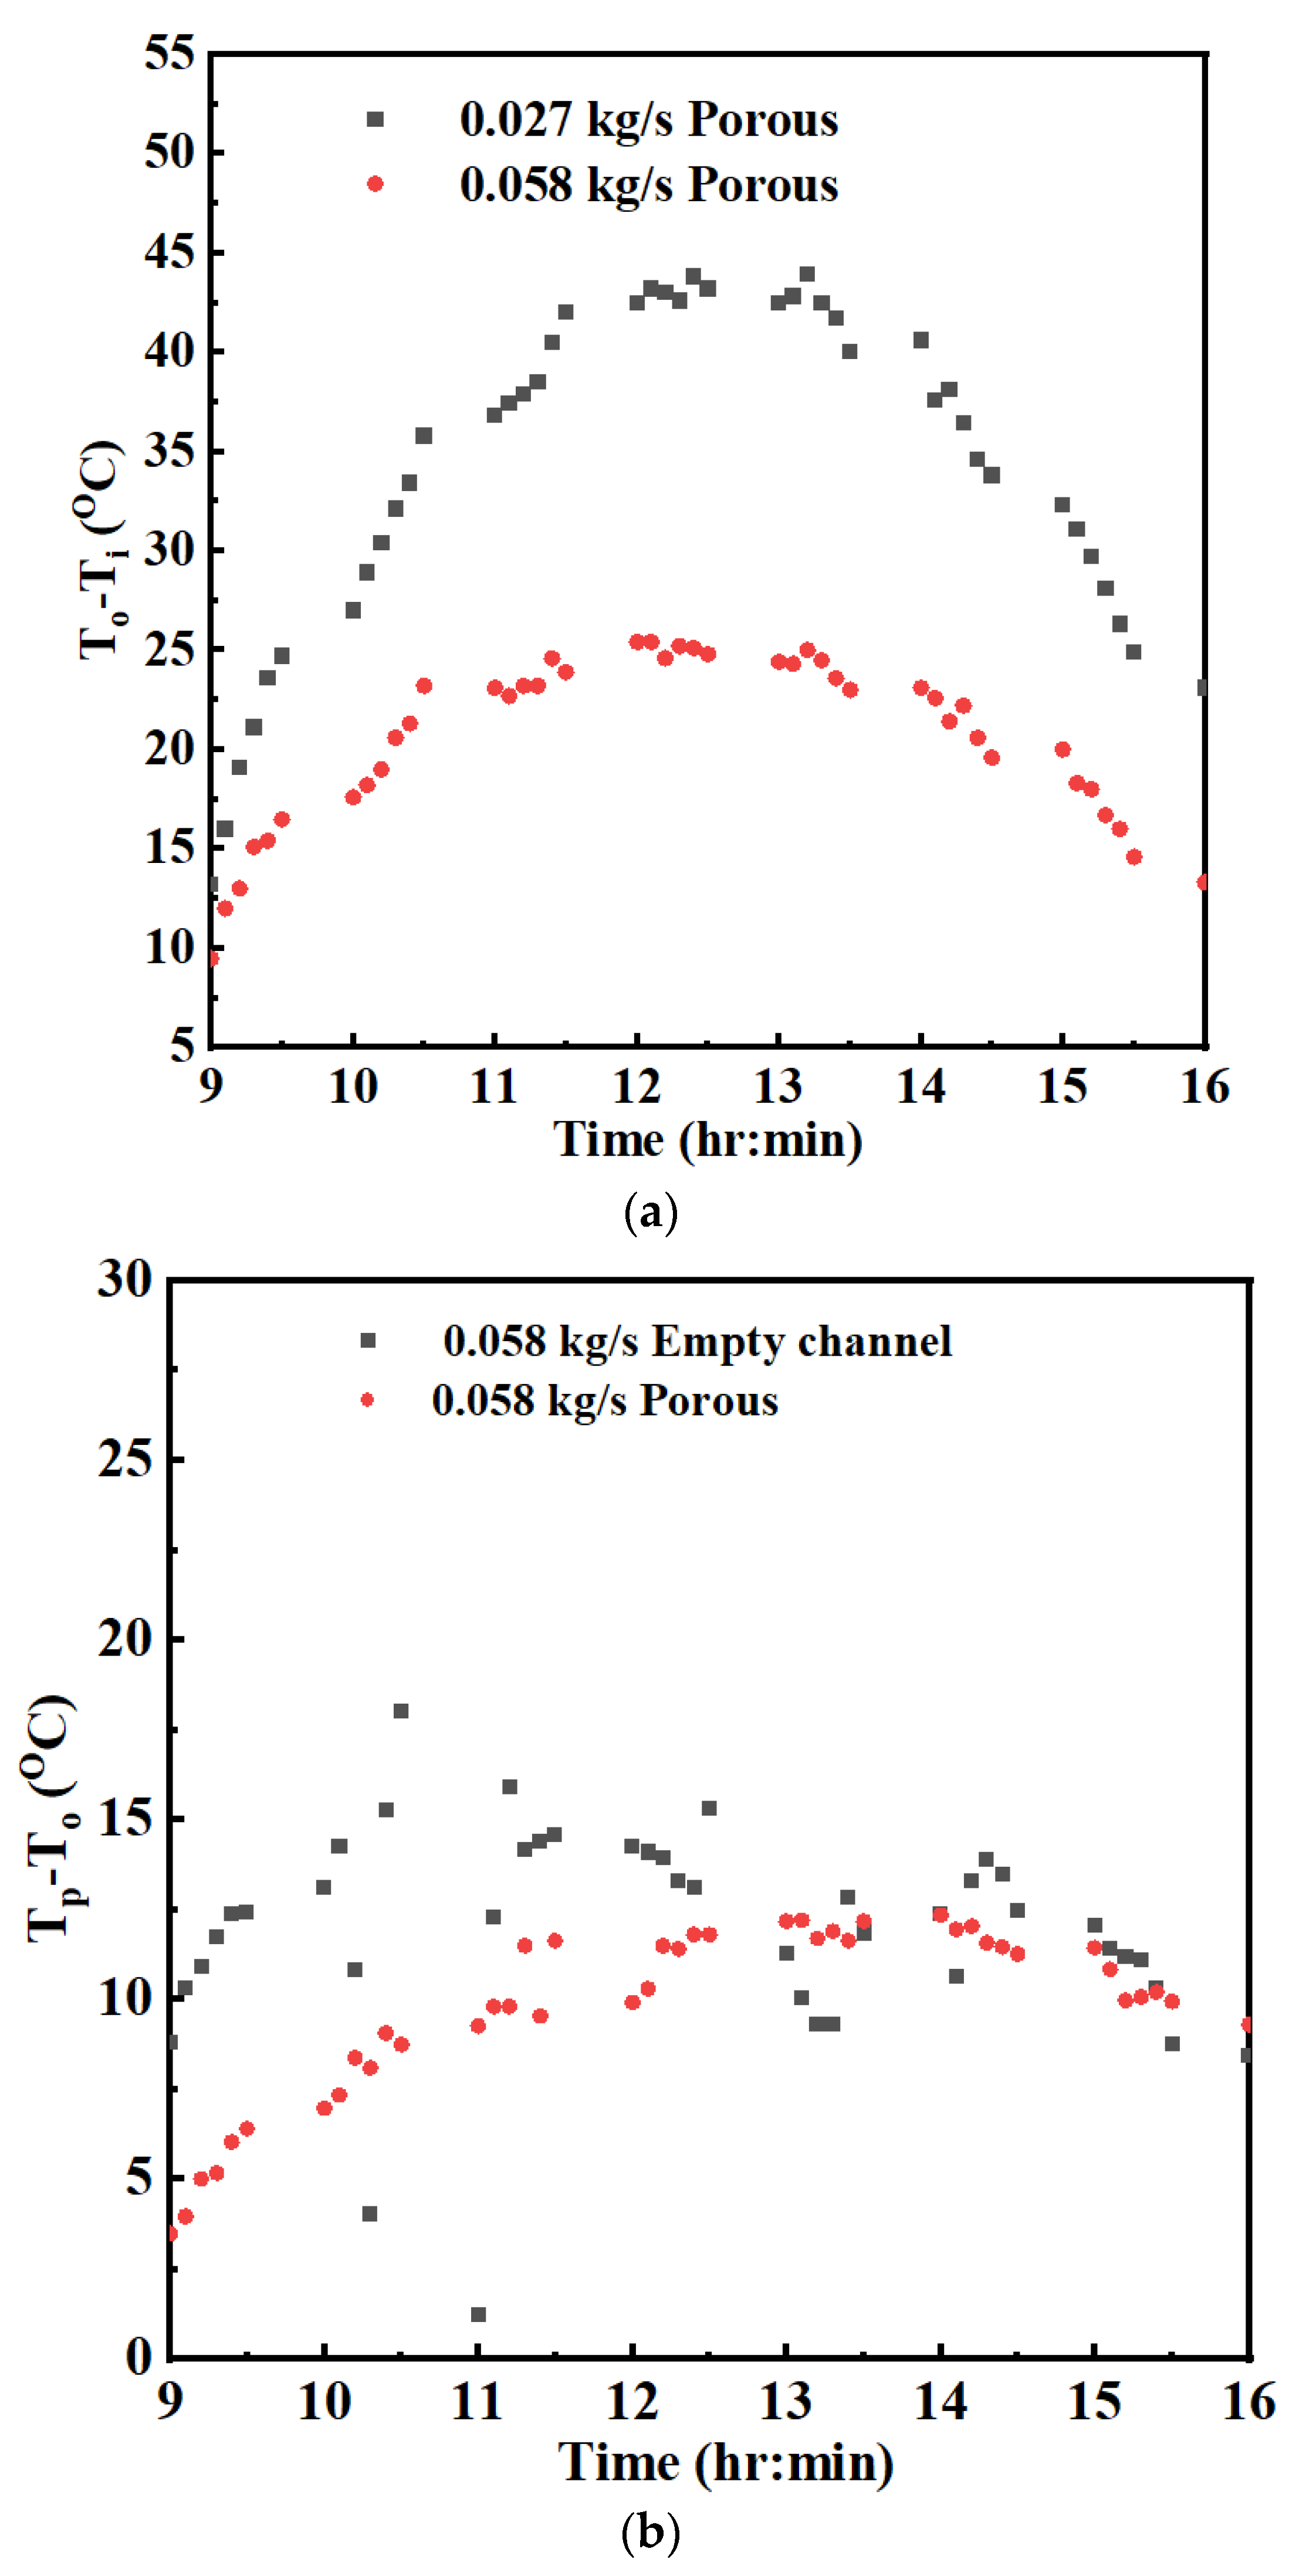
Figure 15a,b show the solar intensities and ambient temperature variation from 9.00 h to 16.00 h during the experimental trials. Figure 15a shows the maximum solar radiation ranges from 11.00 h to 14.00 h. The average solar radiation is obtained between 700 to 800 W/m2. The ambient temperature range during the experimental trials is 29 °C to 37 °C. Figure 16a shows the temperature rise in the porous media for the 0.027 and 0.058 kg/s mass flow rates. For the 0.027 and 0.058 kg/s mass flow rates, the outlet air temperature ranges between 43 °C to 80.4 °C and 39.7 °C to 64 °C, respectively. The maximum temperature rise attained is 43.9 °C for the 0.027 kg/s mass flow rate. Figure 16b shows the difference between the average absorber plate and the outlet air temperature for the empty and porous channel with a maximum mass flow rate of 0.058 kg/s. The average absorber and outlet air temperature difference is greater for the empty channel. Hence, the heat-transfer rate is higher for the graded WM compared to the empty channel.

4.2.2. Comparison of Porous-Bed SAH with Empty-Channel SAH

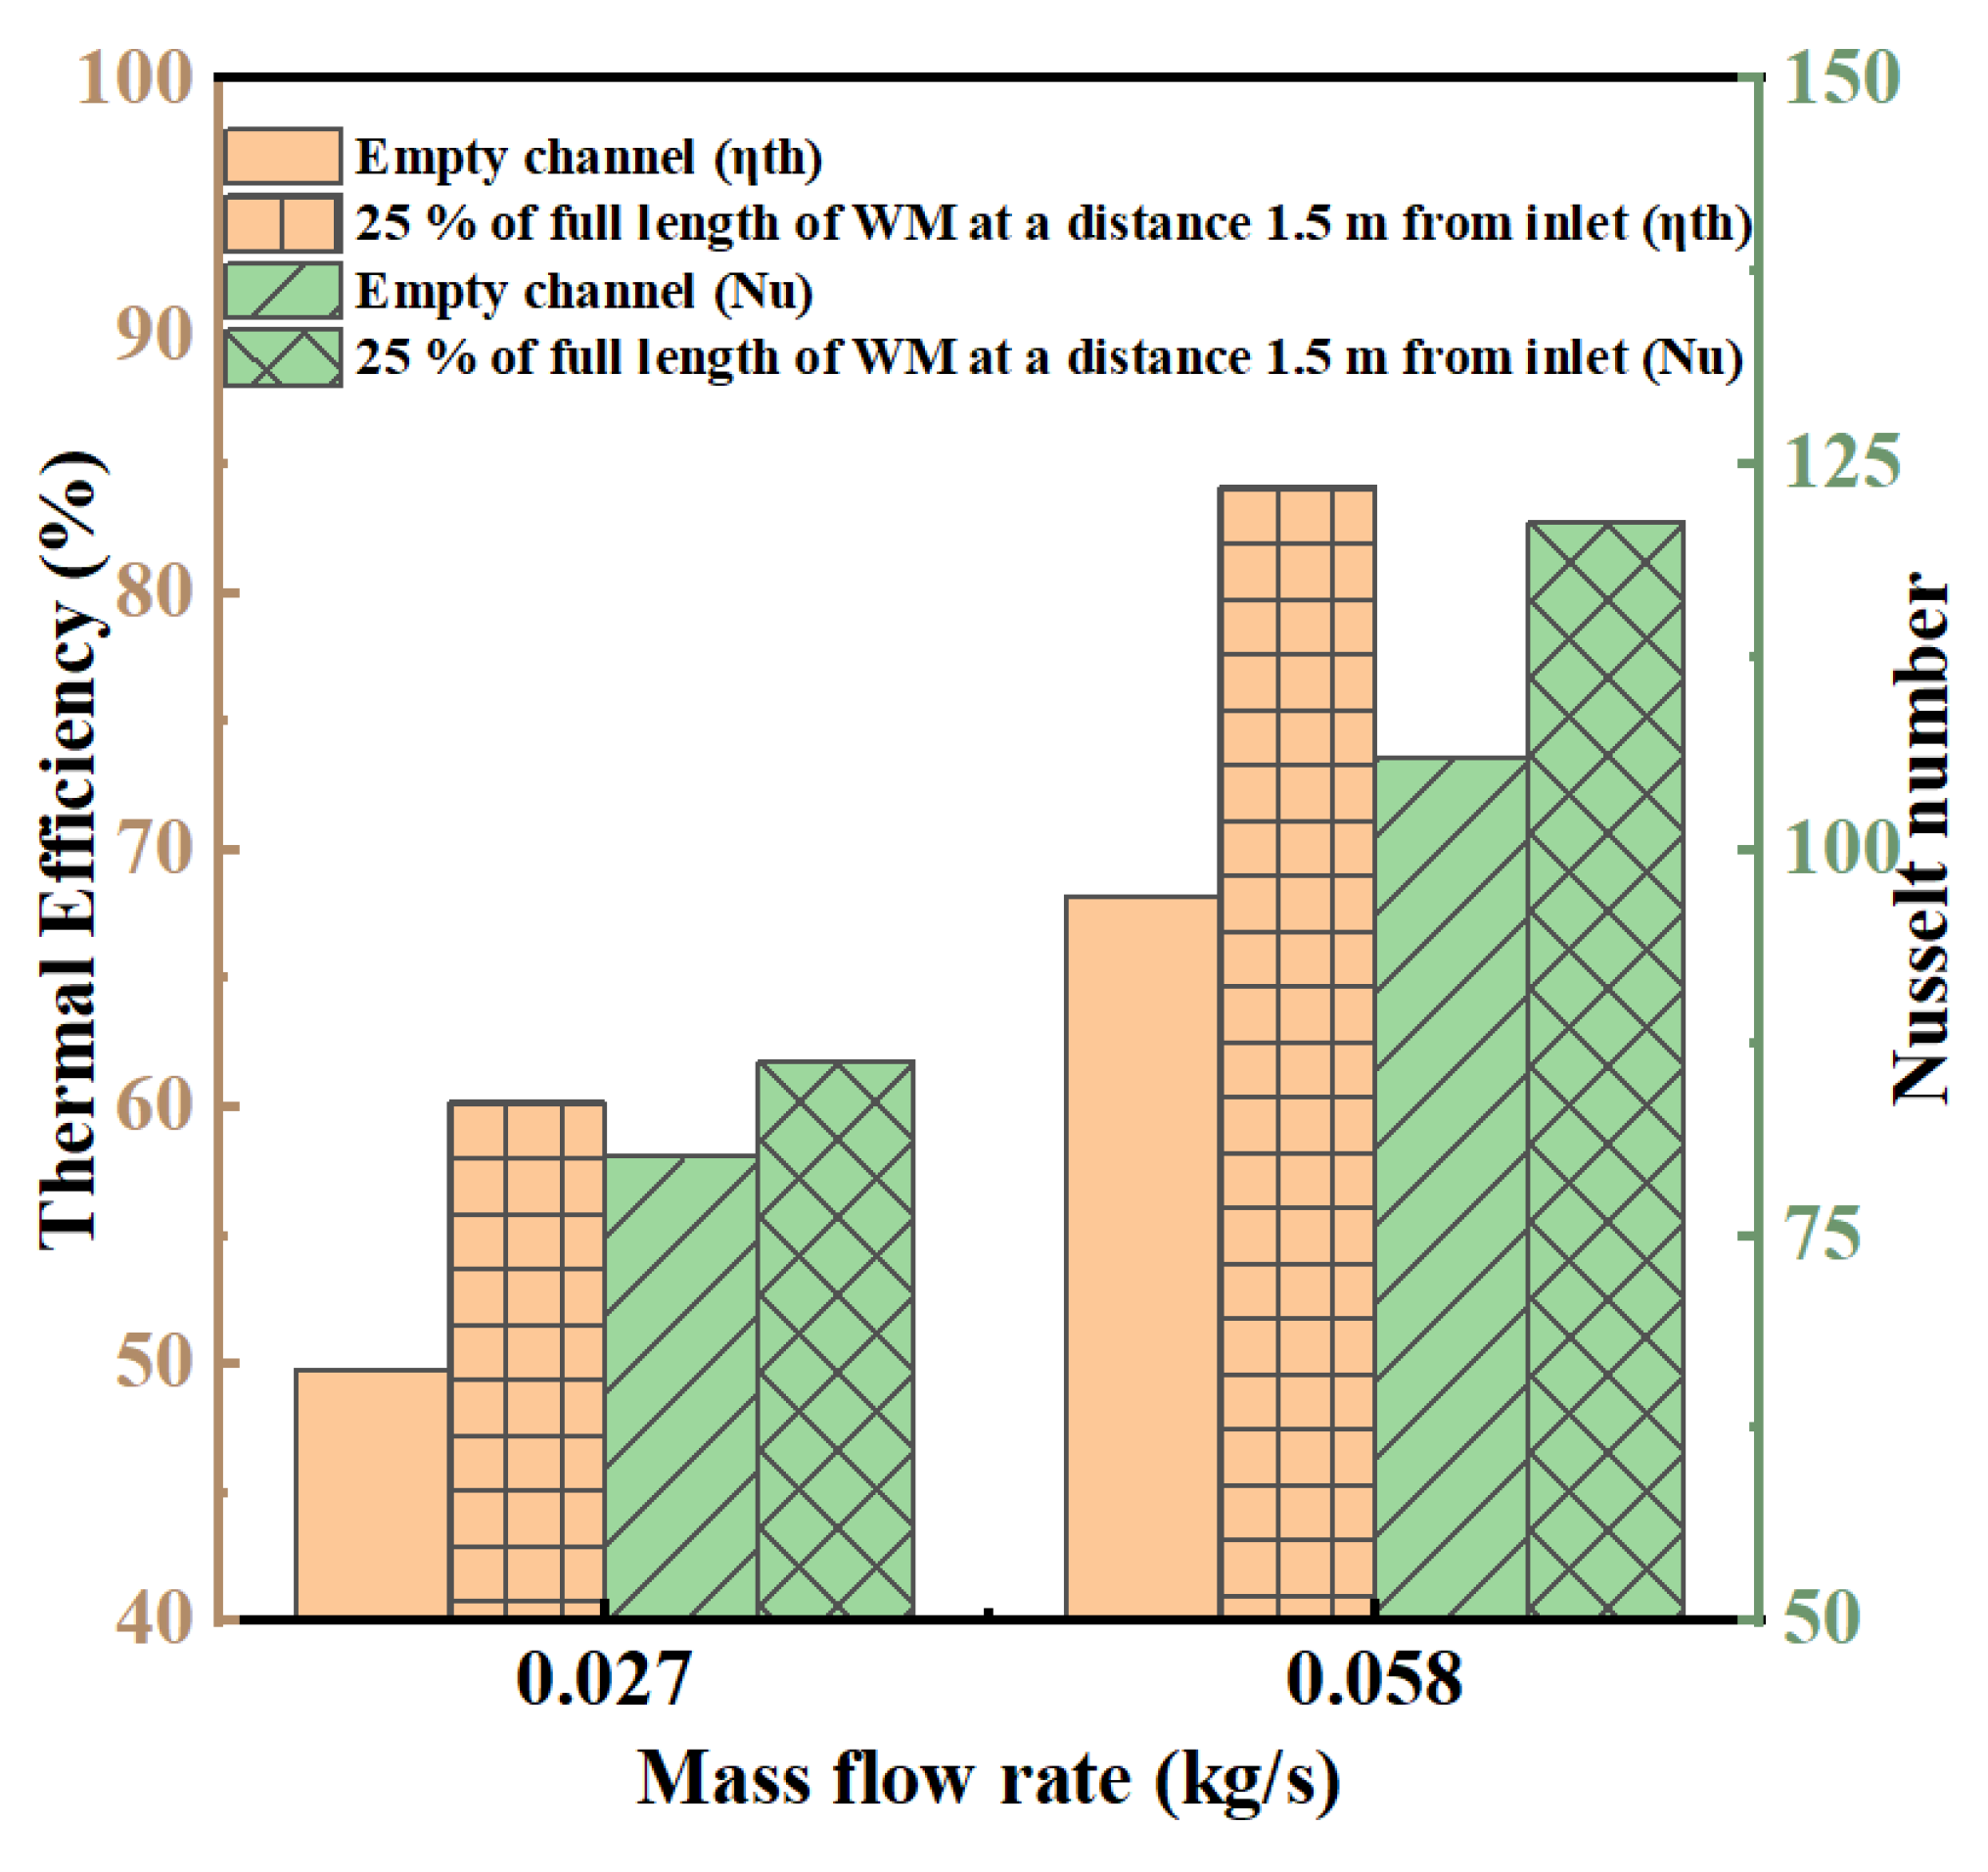
For the same average solar intensity, the percentage increase in the thermal efficiency of the GWM is 20.91% at 0.027 kg/s and 23.32% at 0.058 kg/s greater than the empty channel, as shown in Figure 17. The heat-transfer enhancement in the GWM is demonstrated in terms of the Nusselt number in Figure 17. The Nusselt number increases with the Reynolds number. For 0.027 kg/s and 0.058 kg/s, the Nusselt numbers are 86.33 and 121.29, respectively, for the same input condition in the GWM. The increase in performance is due to the temperature rise in the GWM because of the lower velocity in the GWM. Table 7 shows a comparative study of the present study with recently studied literature using different configurations of wire mesh as a heat-transfer enhancement media. It shows that the resulting 69.5% and 84.12% thermal efficiency is better than the wire mesh material cost and the performances of all of the other references mentioned in the Table 7.

5. Conclusions

The present study involves experiments and analysis of the 3D geometry of single-pass SAHs by a numerical finite volume method. The flow inside the single-pass SAH is assumed to be incompressible and steady state. The Rosseland radiation model with a solar ray tracing method is considered to evaluate the thermal performance of the single-pass SAH using a WM as a porous media. The properties of air are calculated at a bulk mean temperature and assumed to be constant throughout the length. Al WMs with three different porosities are combined together to enhance the heat-transfer rate in single-pass forced convection SAH. The Al WM is assumed to be isotropic, homogenous, and non-deformable. The wire mesh length, width, and thickness of each porosity is assumed to be 500 × 985 × 5 mm (i.e., 25% of the full length of the test section) in the present study. A local thermal equilibrium method was applied for the heat transfer from the WM to the air inside it. Experiments are performed for the 0.027 and 0.058 kg/s mass flow rates. The following results have been obtained based on the present work:
  • For the full-length case, 9-18-3 PPI is the best suitable combination compared to Cases 3-9-18 and 18-3-9 PPI in terms of maximum outlet temperature, Nusselt number and THPP. Case 9-18-3 PPI has 7.62% and 7.22% higher average THPP than Case 3-9-18 and 18-3-9, respectively, for both the mass flow rate.
  • The 25% length of the GWM of the full-length test section was kept at four different locations (i.e., 0, 0.5, 1, and 1.5 m from the inlet) in numerical analysis. The thermal performance was analysed with respect to temperature, Nusselt number, friction factor, and THPP at these four locations. It shows that the rise in the outlet temperature was nearly the same for all of the cases. The Nusselt number is higher in the WM of 25% of the length of the full-length test section than all other cases considered above as a result of the changes in the absorber plate temperature and bulk mean fluid temperature. The friction factor was lower and THPP was higher for the case of 25% of the length of the WM of the full-length test section among all of the other cases.
  • The 25% length of the WM of the full-length test section at a distance 1.5 m from the inlet is more valuable than all other cases in terms of the overall performance of porous SAH. As the mass flow rate increases, thermal efficiency also increases. The enhancement in the thermal efficiency was 23.32% higher for 0.058 kg/s than the empty channel.
One limitation of the present work is the design of the present single-pass SAH, which is based on the commercial scale. Hence, it is useful for industrial purposes and not for domestic purposes. The Al WM material used in the present study is limited to 3, 9, and 18 PPI with porosities of 0.894, 0.812, and 0.917 of Al WM, respectively. Future studies could be performed by considering different PPIs and porosities and different materials which is available on the market. As per the application for a drying product, the outlet temperature can be enhanced by modifying the length of the GWM to 50%, 75%, and 100% of the full length of the test section. Hence, the empty-channel SAH can be modified with the Al GWM SAH.

Author Contributions

Conceptualization, R.D. and N.G.; methodology, R.D., N.G. and M.M.; software, R.D.; validation, R.D., formal analysis, R.D.; investigation R.D.; resources, R.D.; data curation, R.D.; writing—original draft preparation, R.D.; writing—review and editing, R.D., N.G. and M.M.; visualization, R.D.; supervision, N.G. and M.M.; project administration, R.D. All authors have read and agreed to the published version of the manuscript.

Funding

This research received no external funding.

Data Availability Statement

Not applicable.

Acknowledgments

The authors would like to thank Dnyandeo P. Nathe, Government Polytechnic Nashik Maharashtra (422101); and Abhay Wagh, Technical Education Maharashtra, Higher and Technical Education, Government of Maharashtra, for providing the opportunity to undertake research under the quality improvement programme (QIP) in the Mechanical Engineering Department, National Institute of Technology Surathkal Karnataka India. The authors are also thankful to AICTE India for providing the QIP scheme facility.

Conflicts of Interest

The authors declare no conflict of interest.

Nomenclature

AfFrontal area (m2)
AC Surface   collector   area   of   solar   air   heater   ( m 2 )
ApAbsorber plate area (m2)
C P Specific   heat   capacity   ( kJ / kg   K )
D h Hydraulic diameter (m)
DTotal height of the WM porous bed (m)
dwWire diameter (m)
fFriction factor
HHeight of the inlet (m)
h w Convective heat transfer coefficient for top cover (W/m2 K)
hHeat transfer coefficient (W/m2K)
I T Solar   intensity   ( W / m 2 )
kThermal conductivity (W/m K)
K R Extinction coefficient
LLength of the absorber plate (m)
lHeight of the diamond WM (m)
m ˙ Mass   flow   rate   ( kg / s )
NuNusselt number
NPores per inch of wire mesh
nNumber of WM layers
P fan Fan power
PflowFlow pumping power
PrPrandtl number
PtPitch of the WM (m)
ReReynolds number
RePReynolds number of porous media
q u Useful heat gain, W
rhHydraulic radius, m
T Temperature   ( ° C )
Vair Velocity   of   air   ( m / s )
WWidth of the inlet (m)
wPore of the diamond type WM (m)
Greek symbols
Φ Porosity of wire mesh (%)
Δ P Pressure drops across the absorber plate (Pa)
η fan Fan efficiency (%)
η motor Motor efficiency (%)
η th Thermal efficiency (%)
η the Thermohydraulic efficiency (%)
Ρ Density   of   air   ( kg / m 3 )
ρ ¯ Relative density of the WM
σStefan–Boltzmann constant
μ f Dynamic   viscosity   of   air ,   ( kg / m   s )
Subscripts
aAmbient
bBulk mean fluid temperature
eEmpty channel
iInlet
oOutlet
pAbsorber plate
Abbreviations
CFD Computational fluid dynamics
DAS Data acquisition system
DC Direct current
G I Galvanized iron
GWM Graded wire mesh
LTE Local thermal equilibrium
MS Mild steel
PVC Polyvinyl chloride
PPI Pores per inch
RNG Re-normalization group
RTD Resistance temperature detector
SAH Solar air heater
THPP Thermohydraulic performance parameter
WM Wire mesh

References

  1. Sukhatme, S.P.; Nayak, J.K. Solar Energy, 4th ed.; McGraw Hill: New York, NY, USA, 2018. [Google Scholar]
  2. Garg, H.P.; Prakash, J. Solar Energy Fundamentals and Applications, 1st ed.; Mc Graw Hill: New York, NY, USA, 2016. [Google Scholar]
  3. Yang, C.; Xu, Y.; Cai, X.; Zheng, Z.J. Effect of the Circumferential and Radial Graded Metal Foam on Horizontal Shell-and-Tube Latent Heat Thermal Energy Storage Unit by Choun Yang. Sol. Energy 2021, 226, 225–235. [Google Scholar] [CrossRef]
  4. Jadhav, P.H.; Gnanasekaran, N.; Mobedi, M. Analysis of Functionally Graded Metal Foams for the Accomplishment of Heat Transfer Enhancement under Partially Filled Condition in a Heat Exchanger. Energy 2023, 263, 125691. [Google Scholar] [CrossRef]
  5. Srinivasacharya, D.; Reddy, K.S. Lecture Notes in Mechanical Engineering Numerical Heat Transfer and Fluid Flow Select Proceedings of NHTFF 2018; Springer: Berlin/Heidelberg, Germany, 2018. [Google Scholar]
  6. Trilok, G.; Gnanasekaran, N.; Mobedi, M. Various Trade-Off Scenarios in Thermo-Hydrodynamic Performance of Metal Foams Due to Variations in Their Thickness and Structural Conditions. Energies 2021, 14, 8343. [Google Scholar] [CrossRef]
  7. Trilok, G.; Srinivas, K.E.S.; Harikrishnan, D.; Gnanasekaran, N.; Mobedi, M. Correlations and Numerical Modeling of Stacked Woven Wire-Mesh Porous Media for Heat Exchange Applications. Energies 2022, 15, 2371. [Google Scholar]
  8. Liu, G.; Li, Y.; Wei, P.; Xiao, T.; Meng, X.; Yang, X. Thermo-Economic Assessments on a Heat Storage Tank Filled with Graded Metal Foam. Energies 2022, 15, 7213. [Google Scholar] [CrossRef]
  9. Abdulla, A.; Reddy, K.S. Comparative Study of Single and Multi-Layered Packed-Bed Thermal Energy Storage Systems for CSP Plants. Appl. Sol. Energy 2017, 53, 276–286. [Google Scholar] [CrossRef]
  10. Du, S.; Li, Z.Y.; He, Y.L.; Li, D.; Xie, X.Q.; Gao, Y. Experimental and Numerical Analysis of the Hydraulic and Thermal Performances of the Gradually-Varied Porous Volumetric Solar Receiver. Sci. China Technol. Sci. 2020, 63, 1224–1234. [Google Scholar] [CrossRef]
  11. Saedodin, S.; Zamzamian, S.A.H.; Nimvari, M.E.; Wongwises, S.; Jouybari, H.J. Performance Evaluation of a Flat-Plate Solar Collector Filled with Porous Metal Foam: Experimental and Numerical Analysis. Energy Convers. Manag. 2017, 153, 278–287. [Google Scholar] [CrossRef]
  12. Farhan, A.A.; Obaid, Z.A.H.; Hussien, S.Q. Analysis of Exergetic Performance for a Solar Air Heater with Metal Foam Fins. Heat Transf.-Asian Res. 2020, 49, 3190–3204. [Google Scholar] [CrossRef]
  13. Taha, S.Y.; Farhan, A.A. Performance Augmentation of a Solar Air Heater Using Herringbone Metal Foam Fins: An Experimental Work. Int. J. Energy Res. 2021, 45, 2321–2333. [Google Scholar] [CrossRef]
  14. Anirudh, K.; Dhinakaran, S. Numerical Study on Performance Improvement of a Flat-Plate Solar Collector Filled with Porous Foam. Renew. Energy 2020, 147, 1704–1717. [Google Scholar] [CrossRef]
  15. Chiou, J.P.; El-Wakil, M.M.; Duffie, J.A. A Slit-and -Expanded Aluminum-Foil Matrix Solar Collector. Sol. Energy 1965, 9, 73–80. [Google Scholar] [CrossRef]
  16. Sharma, S.P.; Saini, J.S.; Varma, H.K. Thermal Performance of Packed-Bed Solar Air Heaters. Sol. Energy 1991, 47, 59–67. [Google Scholar] [CrossRef]
  17. Ahmad, A.; Saini, J.S.; Varma, H.K. Thermohydraulic Performance of Packed-Bed Solar Air Heaters; Elsevier: Amsterdam, The Netherlands, 1996; Volume 37. [Google Scholar]
  18. Varshney, L.; Saini, J.S. Heat Transfer and Friction Factor Correlations for Rectangular Solar Air Heater Duct Packed with Wire Mesh Screen Matrices; Elsevier: Amsterdam, The Netherlands, 1998; Volume 62. [Google Scholar]
  19. Thakur, N.S.; Saini, J.S.; Solanki, S.C. Heat Transfer and Friction Factor Correlations for Packed Bed Solar Air Heater for a Low Porosity System. Sol. Energy 2003, 74, 319–329. [Google Scholar] [CrossRef]
  20. Mittal, M.K.; Varshney, L. Optimal Thermohydraulic Performance of a Wire Mesh Packed Solar Air Heater. Sol. Energy 2006, 80, 1112–1120. [Google Scholar] [CrossRef]
  21. Singh, O.K.; Panwar, N.L. Effects of Thermal Conductivity and Geometry of Materials on the Temperature Variation in Packed Bed Solar Air Heater. J. Therm. Anal. Calorim. 2013, 111, 839–847. [Google Scholar] [CrossRef]
  22. Chouksey, V.K.; Sharma, S.P. Investigations on Thermal Performance Characteristics of Wire Screen Packed Bed Solar Air Heater. Sol. Energy 2016, 132, 591–605. [Google Scholar] [CrossRef]
  23. Sharma, S.P.; Chauksey, V.K.; Kumar, A.; Behura, A.K.; Kumar, R. Wire Screen Matrices Packed Bed Solar Air Heater Performance—An Exergetic and Energetic Approach. Appl. Sci. 2017, 4, 90–108. [Google Scholar]
  24. Adnan Abed, Q.; Badescu, V.; Ciocanea, A.; Soriga, I.; Bureţea, D. Models for New Corrugated and Porous Solar Air Collectors under Transient Operation. J. Non-Equilib. Thermodyn. 2017, 42, 79–97. [Google Scholar] [CrossRef]
  25. Devecioğlu, A.G.; Oruc, V.; Tuncer, Z. Energy and Exergy Analyses of a Solar Air Heater with Wire Mesh-Covered Absorber Plate. Int. J. Exergy 2018, 26, 3–20. [Google Scholar] [CrossRef]
  26. Ghritlahre, H.K.; Prasad, R.K. Investigation of Thermal Performance of Unidirectional Flow Porous Bed Solar Air Heater Using MLP, GRNN, and RBF Models of ANN Technique. Therm. Sci. Eng. Prog. 2018, 6, 226–235. [Google Scholar] [CrossRef]
  27. Rajarajeswari, K.; Alok, P.; Sreekumar, A. Simulation and Experimental Investigation of Fluid Flow in Porous and Non-Porous Solar Air Heaters. Sol. Energy 2018, 171, 258–270. [Google Scholar] [CrossRef]
  28. Sözen, A.; Şirin, C.; Khanlari, A.; Tuncer, A.D.; Gürbüz, E.Y. Thermal Performance Enhancement of Tube-Type Alternative Indirect Solar Dryer with Iron Mesh Modification. Sol. Energy 2020, 207, 1269–1281. [Google Scholar] [CrossRef]
  29. Jalil, J.M.; Ali, S.J. Thermal Investigations of Double Pass Solar Air Heater with Two Types of Porous Media of Different Thermal Conductivity. Eng. Technol. J. 2021, 39, 79–88. [Google Scholar] [CrossRef]
  30. Sözen, A.; Kazancıoğlu, F.Ş.; Tuncer, A.D.; Khanlari, A.; Bilge, Y.C.; Gungor, A. Thermal Performance Improvement of an Indirect Solar Dryer with Tube-Type Absorber Packed with Aluminum Wool. Sol. Energy 2021, 217, 328–341. [Google Scholar] [CrossRef]
  31. Omojaro, A.P.; Aldabbagh, L.B.Y. Experimental Performance of Single and Double Pass Solar Air Heater with Fins and Steel Wire Mesh as Absorber. Appl. Energy 2010, 87, 3759–3765. [Google Scholar] [CrossRef]
  32. Aldabbagh, L.B.Y.; Egelioglu, F.; Ilkan, M. Single and Double Pass Solar Air Heaters with Wire Mesh as Packing Bed. Energy 2010, 35, 3783–3787. [Google Scholar] [CrossRef]
  33. Nowzari, R.; Mirzaei, N.; Aldabbagh, L.B.Y. Finding the Best Configuration for a Solar Air Heater by Design and Analysis of Experiment. Energy Convers. Manag. 2015, 100, 131–137. [Google Scholar] [CrossRef]
  34. Nowzari, R.; Aldabbagh, L.B.Y. Experimental Study on a Solar Air Heater with Various Perforated Covers. Sadhana-Acad. Proc. Eng. Sci. 2017, 42, 1585–1593. [Google Scholar] [CrossRef] [Green Version]
  35. Kesavan, S.; Arjunan, T.V.; Vijayan, S. Thermodynamic Analysis of a Triple-Pass Solar Dryer for Drying Potato Slices. J. Therm. Anal. Calorim. 2019, 136, 159–171. [Google Scholar] [CrossRef]
  36. Prasad, S.B.; Saini, J.S.; Singh, K.M. Investigation of Heat Transfer and Friction Characteristics of Packed Bed Solar Air Heater Using Wire Mesh as Packing Material. Sol. Energy 2009, 83, 773–783. [Google Scholar] [CrossRef]
  37. Nowzari, R.; Saygin, H.; Aldabbagh, L.B.Y. Evaluating the Performance of a Modified Solar Air Heater with Pierced Cover and Packed Mesh Layers. J. Sol. Energy Eng. Trans. ASME 2021, 143, 011006. [Google Scholar] [CrossRef]
  38. Güler, H.Ö.; Sözen, A.; Tuncer, A.D.; Afshari, F.; Khanlari, A.; Şirin, C.; Gungor, A. Experimental and CFD Survey of Indirect Solar Dryer Modified with Low-Cost Iron Mesh. Sol. Energy 2020, 197, 371–384. [Google Scholar] [CrossRef]
  39. Ranake Vinayak Data Loggers, Wireless Data Logger, Chart Recorder, Manufacturer, India. Available online: https://www.sunsuiprocess.com/ (accessed on 23 November 2022).
  40. Cengel, Y.A. Heat Transfer a Practical Approach; McGraw-Hill: New York, NY, USA, 2003. [Google Scholar]
  41. Singh, S. Utilising Fractional Porous Interface for High Thermal Performance of Serpentine Wavy Channel Solar Air Heater. Appl. Therm. Eng. 2022, 205, 118044. [Google Scholar] [CrossRef]
  42. Azad, R.; Bhuvad, S.; Lanjewar, A. Study of Solar Air Heater with Discrete Arc Ribs Geometry: Experimental and Numerical Approach. Int. J. Therm. Sci. 2021, 167, 107013. [Google Scholar] [CrossRef]
  43. Saravanan, A.; Murugan, M.; Reddy, M.S.; Ranjit, P.S.; Elumalai, P.V.; Kumar, P.; Sree, S.R. Thermo-Hydraulic Performance of a Solar Air Heater with Staggered C-Shape Finned Absorber Plate. Int. J. Therm. Sci. 2021, 168, 107068. [Google Scholar] [CrossRef]
  44. Kumar, D.; Layek, A. Nusselt Number and Friction Characteristics of Solar Air Heater Roughened with Novel Twisted V-Shaped Staggered Ribs Using Liquid Crystal Thermography. Renew. Energy 2022, 201, 651–666. [Google Scholar] [CrossRef]
  45. Holman, J.P. Experimental Methods for Engineers, 6th ed.; McGraw-Hill: New York, NY, USA, 1994. [Google Scholar]
  46. El-khawajah, M.F.; Aldabbagh, L.B.Y.; Egelioglu, F. The Effect of Using Transverse Fins on a Double Pass Flow Solar Air Heater Using Wire Mesh as an Absorber. Sol. Energy 2011, 85, 1479–1487. [Google Scholar] [CrossRef]
  47. Singh, S. Experimental and Numerical Investigations of a Single and Double Pass Porous Serpentine Wavy Wiremesh Packed Bed Solar Air Heater. Renew. Energy 2020, 145, 1361–1387. [Google Scholar] [CrossRef]
  48. Yadav, S.; Saini, R.P. Numerical Investigation on the Performance of a Solar Air Heater Using Jet Impingement with Absorber Plate. Sol. Energy 2020, 208, 236–248. [Google Scholar] [CrossRef]
  49. Diganjit, R.; Gnanasekaran, N.; Mobedi, M. Numerical Study for Enhancement of Heat Transfer Using Discrete Metal Foam with Varying Thickness and Porosity in Solar Air Heater by LTNE Method. Energies 2022, 15, 8952. [Google Scholar] [CrossRef]
  50. Parsa, H.; Saffar-Avval, M.; Hajmohammadi, M.R. 3D Simulation and Parametric Optimization of a Solar Air Heater with a Novel Staggered Cuboid Baffles. Int. J. Mech. Sci. 2021, 205, 106607. [Google Scholar] [CrossRef]
  51. Zhao, Z.; Luo, L.; Qiu, D.; Wang, Z.; Sundén, B. On the Solar Air Heater Thermal Enhancement and Flow Topology Using Differently Shaped Ribs Combined with Delta-Winglet Vortex Generators. Energy 2021, 224, 119944. [Google Scholar] [CrossRef]
  52. Ansys Fluent R2 Student Version; Ansys, Inc.: Canonsburg, PA, USA, 2022.
  53. Avila-Marin, A.L.; Fernandez-Reche, J.; Martinez-Tarifa, A. Modelling Strategies for Porous Structures as Solar Receivers in Central Receiver Systems: A Review. Renew. Sustain. Energy Rev. 2019, 111, 15–33. [Google Scholar] [CrossRef]
  54. Anirudh, K.; Dhinakaran, S. Performance Improvement of a Flat-Plate Solar Collector by Inserting Intermittent Porous Blocks. Renew. Energy 2020, 145, 428–441. [Google Scholar] [CrossRef]
  55. Jadhav, P.H.; Gnanasekaran, N. Optimum Design of Heat Exchanging Device for Efficient Heat Absorption Using High Porosity Metal Foams. Int. Commun. Heat Mass Transf. 2021, 126, 105475. [Google Scholar] [CrossRef]
  56. Howell, J.R.; Siegel, R. Thermal Radiation Heat Transfer; Taylor and Francis: Abingdon, UK, 2002. [Google Scholar]
  57. Gill, R.S.; Hans, V.S.; Singh, R.P. Optimization of Artificial Roughness Parameters in a Solar Air Heater Duct Roughened with Hybrid Ribs. Appl. Therm. Eng. 2021, 191, 116871. [Google Scholar] [CrossRef]
  58. Tian, J.; Kim, T.; Lu, T.J.; Hodson, H.P.; Queheillalt, D.T.; Sypeck, D.J.; Wadley, H.N.G. The Effects of Topology upon Fluid-Flow and Heat-Transfer within Cellular Copper Structures. Int. J. Heat Mass Transf. 2004, 47, 3171–3186. [Google Scholar] [CrossRef]
  59. Gupta, M.K.; Kaushik, S.C. Performance Evaluation of Solar Air Heater Having Expanded Metal Mesh as Artificial Roughness on Absorber Plate. Int. J. Therm. Sci. 2009, 48, 1007–1016. [Google Scholar] [CrossRef]
  60. Nidhul, K.; Yadav, A.K.; Anish, S.; Arunachala, U.C. Efficient Design of an Artificially Roughened Solar Air Heater with Semi-Cylindrical Side Walls: CFD and Exergy Analysis. Sol. Energy 2020, 207, 289–304. [Google Scholar] [CrossRef]
  61. Koholé, Y.W.; Fohagui, F.C.V.; Tchuen, G. Flat-Plate Solar Collector Thermal Performance and Optimal Operation Mode by Exergy Analysis and Numerical Simulation. Arab. J. Sci. Eng. 2021, 46, 1877–1897. [Google Scholar] [CrossRef]
  62. Patel, Y.M.; Jain, S.V.; Lakhera, V.J. Thermo-Hydraulic Performance Analysis of a Solar Air Heater Roughened with Discrete Reverse NACA Profile Ribs. Int. J. Therm. Sci. 2021, 167, 107026. [Google Scholar] [CrossRef]
  63. Nidhul, K.; Yadav, A.K.; Anish, S.; Arunachala, U.C. Thermo-Hydraulic and Exergetic Performance of a Cost-Effective Solar Air Heater: CFD and Experimental Study. Renew. Energy 2022, 184, 627–641. [Google Scholar] [CrossRef]
  64. Debnath, S.; Das, B.; Randive, P. Energy and Exergy Analysis of Plain and Corrugated Solar Air Collector: Effect of Seasonal Variation. Int. J. Ambient. Energy 2022, 43, 2796–2807. [Google Scholar] [CrossRef]
  65. Kothandaraman, C.P. Heat and Mass Transfer Data Book, 9th ed.; New Age International Publishers: Chennai, India, 2018; ISBN 978-93-86649-30-0. [Google Scholar]
  66. Hu, J.; Sun, X.; Xu, J.; Li, Z. Numerical Analysis of Mechanical Ventilation Solar Air Collector with Internal Baffles. Energy Build. 2013, 62, 230–238. [Google Scholar] [CrossRef]
  67. Hung, T.C.; Huang, T.J.; Lee, D.S.; Lin, C.H.; Pei, B.S.; Li, Z.Y. Numerical Analysis and Experimental Validation of Heat Transfer Characteristic for Flat-Plate Solar Air Collector. Appl. Therm. Eng. 2017, 111, 1025–1038. [Google Scholar] [CrossRef]
  68. Hu, J.; Guo, M.; Guo, J.; Zhang, G.; Zhang, Y. Numerical and Experimental Investigation of Solar Air Collector with Internal Swirling Flow. Renew. Energy 2020, 162, 2259–2271. [Google Scholar] [CrossRef]
  69. Jia, B.; Yang, L.; Zhang, L.; Liu, B.; Liu, F.; Li, X. Optimizing Structure of Baffles on Thermal Performance of Spiral Solar Air Heaters. Sol. Energy 2021, 224, 757–764. [Google Scholar] [CrossRef]
  70. Kansara, R.; Pathak, M.; Patel, V.K. Performance Assessment of Flat-Plate Solar Collector with Internal Fins and Porous Media through an Integrated Approach of CFD and Experimentation. Int. J. Therm. Sci. 2021, 165, 106932. [Google Scholar] [CrossRef]
  71. Bai, X.; Kuwahara, F.; Mobedi, M.; Nakayama, A. Forced Convective Heat Transfer in a Channel Filled with a Functionally Graded Metal Foam Matrix. J. Heat Transf. 2018, 140, 111702. [Google Scholar] [CrossRef]
  72. Gupta, C.L.; Garg, H.P. Performance Studies on Solar Air Heaters. Sol. Energy 1967, 11, 25–31. [Google Scholar] [CrossRef]
  73. Gill, R.S.; Singh, S.; Singh, P.P. Low Cost Solar Air Heater. Energy Convers. Manag. 2012, 57, 131–142. [Google Scholar] [CrossRef]
Figure 1. The organization of the present paper.
Energies 16 05633 g001
Figure 2. Layout of solar air heater with all its parts. (1) Entrance section with PVC sheet (green colour line), (2) toughened glass (yellow colour line), (3) absorber plate (red colour line), (4) ceramic wool (grey colour hatch line), (5) exit section (green colour line), (6) support for SAH (purple colour line), and (7) base frame of SAH (green colour line); all dimensions are in mm.
Energies 16 05633 g002
Figure 3. Details of the measuring instrument arrangement on the solar air heater (a) 1. PT 100 thermocouple for the ambient temperature (Ta), 2. PT 100 thermocouple for the inlet temperature (Ti), 3. PT 100 thermocouple for the outlet temperature (To), 4. PT 100 thermocouple for the temperature of the absorber plate at the inlet side (Tabsi), 5. PT 100 thermocouple for the temperature of the absorber plate at the middle (Tabsm), 6. PT 100 thermocouple for the temperature of the absorber plate at the outlet side (Tabso), 7. PT 100 thermocouple for the temperature of the glass at the inlet side (Tgi), 8. PT 100 thermocouple for the temperature of the glass at the middle (Tgm), 9. PT 100 thermocouple for the temperature of the glass at the outlet side (Tgo), 10. Anemometer for measuring wind speed (WA), 11. Solar pyranometer (SPM), 12. Anemometer for measuring inlet air velocity (AA), 13. Pressure tap across the test section, i.e., at the inlet side (Pin) and at the outlet side (Pout), 14. Differential pressure transmitter (DPT), 15. Data logger (DL), 16. A 12 V DC fan, 17. A 12 V DC battery, 18. Solar panel (SP), 19. Charge controller. (b) Arrangement of PT 100 thermocouples kept on the glass and absorber plate [27,35,37].
Energies 16 05633 g003
Figure 4. Details of the experimental setup of SAH (a) Front side view (b) backside view.
Energies 16 05633 g004
Figure 5. Size and shape of aluminium WM available on the local market. (a) Diamond or expanded metal mesh—3 PPI, (b) diamond or expanded metal mesh—9 PPI, and (c) square mesh—18 PPI.
Energies 16 05633 g005aEnergies 16 05633 g005b
Figure 6. Detailed pictorial view of GWM arrangement in the channel of the SAH: (a) 3-9-18 PPI, (b) 9-18-3 PPI, and (c) 18-3-9 PPI.
Energies 16 05633 g006
Figure 7. Arrangement of WM in SAH. (a) Empty channel, (b) Case 1: 25% of the length of the WM of the full-length test section and at a distance of 0 m from the inlet, (c) Case 2: 25% of the length of the WM of the full-length test section and at a distance of 0.5 m from the inlet, (d) Case 3: 25% of the length of the WM of the full-length test section and at a distance of 1 m from the inlet, (e) Case 4: 25% of the length of the WM of the full-length test section and at a distance of 1.5 m from the inlet, (f) Case 9-18-3 PPI: WM with horizontal full length.
Energies 16 05633 g007
Figure 8. Numerical details of the 3D domain. (a) Geometry of a single-pass SAH for 9-18-3 PPI GWM with 25% of the length of the WM full-length test section at 1.5 m from the inlet; (b) quadrilateral mesh for 3D geometry.
Energies 16 05633 g008aEnergies 16 05633 g008b
Figure 9. Grid-independence study for the empty channel and wire mesh at different nodes.
Energies 16 05633 g009
Figure 10. (a) Variation in the rise in temperature with time. (b) Parity plot for validation of the thermohydraulic efficiency in numerical and experimental trials for the 0.027 kg/s and 0.058 kg/s mass flow rates.
Energies 16 05633 g010
Figure 11. Variation in the THPP vs. mass flow rate for the full length of 3-9-18 PPI, 9-18-3 PPI, and 18-3-9 PPI.
Energies 16 05633 g011
Figure 12. Comparison study between the 25% length case at a distance of 0, 0.5, 1, and 1.5 m from the inlet for (a) temperature rise, (b) Nusselt number, (c) friction factor, and (d) THPP.
Energies 16 05633 g012aEnergies 16 05633 g012bEnergies 16 05633 g012c
Figure 13. Temperature distribution of air for   m ˙ = 0.027 kg/s and I = 851.24 W/m2 (a) along the plane and (b) in the 25% length case at a distance 1.5 m from the inlet.
Energies 16 05633 g013
Figure 14. Velocity distribution of fluid for the 25% length case at a distance 1.5 m from the inlet for   m ˙ = 0.027 kg/s and I = 851.24 W/m2.
Energies 16 05633 g014
Figure 15. Variation in solar intensity and ambient temperature with time. (a) Distribution of intensity of solar radiation during the experimental trials, (b) distribution of ambient temperature during the experimental trials.
Energies 16 05633 g015
Figure 16. Variation is the temperature difference with time for the empty channel and the 25% length case at a distance 1.5 m from the inlet. (a) Temperature rise parameter versus time of day, (b) temperature slip between the average absorber plate temperature and the outlet fluid temperature.
Energies 16 05633 g016
Figure 17. The variation in maximum thermal efficiency and maximum Nusselt number between the empty channel and the 25% length case at a distance 1.5 m from the inlet.
Energies 16 05633 g017
Table 1. Measuring instruments used during experimental work.
Sr. NoName of the Product, QuantityPurposeMake and ModelAccuracyRangeResolution
1Solar pyranometer, 1To measure the intensity of solar radiation.Pyra
300 V
±5 W/m20–1800 W/m20.1 W/m2
2PT 100 RTD, 9At different positions to measure the temperatures of glazing (3), absorber (3), inlet air, outlet air, ambientHeatron
Industrial Heaters
Class 1/3
±1 °C0–800 °C0.001 °C
3Vane probe anemometer, 1To measure the velocity inside the ductMextech
AM 4208
±2%0.4–45 m/s0.1 m/s
4Differential pressure
transmitter, 1
To connect across the test section and to measure the pressure drop inside the ductSensocon Series 211±5%0.5%0.25%
5Universal data logger 16 Channel, 1To record the temperatures, pressure drop, velocity, and solar intensity for every 10 minSunsui Make DL-35-16For RTD ±0.2% or
±0.5 °C
For RTD
0–400 °C
For RTD
0.1 °C
6Wind speed Sensor, 1To measure the wind speedSunsui
Make-OC ANE-01,
±2%0.3 to 60 m/s0.1 m/s
7Measuring tape, 1To measure the length, width, and height of the parts of the SAHVenus-Stylo±0.001 m0 to 3 m0.001 m
8Flat scale rule, 1To measure the lengthS.K.±0.001 m0 to 0.015 m0.001 m
9Vernier
Caliper, 1
To measure the lengthKristeel-Shinwa±0.01 m0 to 0.015 m0.01 m
Table 2. Geometrical parameters of aluminium wire mesh.
Type of Wire MeshDiamond or Expanded Metal MeshDiamond or Expanded Metal MeshSquare Mesh
Pore per inch (PPI)3918
Wire diameter dw (mm)0.910.480.21
Pitch Pt (mm)6.8621.71.26
Thickness of single-layer WM (mm)1.8041.1760.618
Porosity   Φ 0.8940.8120.917
Viscous resistance (1/K) (m−2)2,546,508.71834,898,955.1230,116,606.43
Inertial resistance (CF) (m−1)570.582560.51865
Pt/dW7.543.546
The number of layers used to achieve 5 mm thickness348
1/n Φ 0.370.310.14
Table 3. Uncertainties in measuring parameters during experimental work.
Uncertainty
in Measurement
UncertaintyUnit
Mass flow rate, m ˙ ±1.47%–1.028% k g / s
Thermal efficiency, η t h ±3.48%
Table 4. Material properties considered for CFD analysis of the present SAH [49,52,62,65].
PropertiesAluminiumToughened GlassPolyvinyl Chloride Board Sheet (PVC)Ceramic WoolAir
47.5 °C
Density (ρ) kg/m3271925000.55641.1035
Specific heat capacity (Cp)
J/kg K
87167090012461005
Thermal conductivity (k) W/m K202.40.74430.050.200.02805
Dynamic viscosity (μ) Ns/m2----1.95 × 10−5
Absorptivity0.950.06---
Emissivity-0.88---
Transmissivity-0.90---
Absorption coefficient----1
Refractive index----1
Table 5. Boundary conditions used during simulation in the SAH.
MomentumThermalRadiation
Absorber plateStationary wall
No slip condition
Heat flux is flux absorbed by the absorber plate in W/m2 which is equal to the product of IT(τα) [50,65].
Absorber plate material is aluminium
and wall thickness is 0.0005 m
Bottom of the wall
Opaque BC type and absorptivity is 0.95
GlassStationary wall
No slip condition
Mixed [66,67,68]
hw = 5.7 + (3.8 V ) in W/m2
[68,69] Free stream temperatures are ambient temperature
External emissivity is 0.88
External radiation temp is ambient temperature
Wall thickness is 0.004 m
BC type—semi-transparent wall
Absorptivity is 0.1
Transmissivity is 0.9
Side wall and other wallsStationary wall
No slip condition
Heat flux is zero W/m2, i.e., adiabatic wall
Wall Material is PVC
Wall thickness is 0.018 m
BC type is opaque
and does not participate in solar ray tracing
InletVelocity magnitude as 1.7 and 3.6 m/s, with turbulent intensity as 4.9696 and 4.5247, respectively, and hydraulic diameter as 0.12Inlet temperature is obtained from experimental readingRadiation condition is participating and factor is 1
OutletPressure outlet as zero and hydraulic diameter as 0.12Back flow temperature in the initial case same as inlet temperatureRadiation condition is participating and factor is 1
Table 6. Results of grid-independence study for Re = 11,544.
CaseNumber of NodesOutlet Temperature in °C Pressure   Drop   ( Δ P )
in Pa
% Deviation for |To| %   Deviation   for   | Δ P |  
Empty channel SAH109,20076.491.620.142.53
196,22476.521.620.112.53
314,16076.561.630.053.16
400,36576.591.600.011.25
504,19276.601.58Baseline
WM SAH98,560103.21.640.270.61
199,281103.221.640.250.61
331,500103.381.640.0970.61
409,136103.431.650.0480
518,500103.481.65Baseline
Table 7. Comparison with previous similar type of rectangular single-pass SAH.
Author Year and Ref.Mass Flow Rate (kg/s)Different Porous
Absorbers
Thermal Efficiency (%)
Gupta and Garg
1967 [72]
1.22 × 10⁻³ g/cm2 sAluminium expanded metal mesh with carbon black coating50
Omojaro and Aldabbagh 2010 [31]0.012 to 0.038WM with longitudinal finsMax. 59.62
Aldabbagh et al., 2010 [32]0.012 to 0.038WM without absorber plateMax. 45.93
Singh and Panwar 2013 [21]0.02281Iron
Brass
Copper
61.47,
64.42,
64.42
Nowzari et al., 2015 [33]0.011, 0.032WM with different covers48
Nowzari and Aldabbagh 2017 [34]0.011, 0.032Partially perforated cover with WM55
Abed et al., 2017 [24]0.033U and V corrugated WM absorberNM
Rajarajeswari et al., 2018 [27]0.01 to 0.055Cu WM15–88
Gill et al., 2012 [73]0.011 to 0.020 m/sIron chips37.45
Present study0.027 and 0.058Partially filled Al WM with different PPI and porosity35.8 to 69.5 for 0.027 kg/s and
53.8 to 84.12 for 0.058 kg/s
Disclaimer/Publisher’s Note: The statements, opinions and data contained in all publications are solely those of the individual author(s) and contributor(s) and not of MDPI and/or the editor(s). MDPI and/or the editor(s) disclaim responsibility for any injury to people or property resulting from any ideas, methods, instructions or products referred to in the content.