Abstract
The integrity of wellbore cement is an important guarantee for the long-term safety and effectiveness of carbon dioxide geological storage. During the process of CO2 capture, utilization, and storage, construction factors will cause changes in temperature and pressure distribution, leading to changes in the pore structure of cement and a decline in compressive strength, which can easily cause the failure of cement ring integrity. To provide theoretical guidance and analysis methods for evaluating the mechanism of cement strength performance degradation and optimizing injection parameters, in this study, we conducted the following research based on relevant studies: (1) The fracture theory was revised based on the characteristic factors of oil-well cement; (2) a pore structure model was established to analyze the failure process of cement, clarifying the relationship between pore structure and the compressive strength of cement; (3) the parameters of the pore structure model were determined and analyzed, considering the influence of cement content and total porosity on the model, and finally, the regression parameter K value was determined to be 1600. This article can provide a useful reference for the research on the failure of cement rings in the CO2 injection process and other related studies.
1. Introduction
The concept of “carbon neutrality” first emerged in 1997, and until October 2018, the United Nations Intergovernmental Panel on Climate Change called for countries to work toward limiting warming to 1.5 degrees Celsius, requiring reforms in the energy, construction, industrial and urban sectors [1,2,3,4,5,6,7,8]. Geological carbon dioxide sequestration is a geological engineering technology that can realize the storage of greenhouse gases, and improving the integrity of cement rings can ensure the long-term effective implementation of this technology [9,10,11,12,13,14]. Research on the deterioration of cement mechanical properties can provide theoretical guidance for cement slurry design and improve the long-term sealing performance of cement sheaths, which is of great significance.
The pore structure is an important part of the interior of cement, which has an important influence on its macroscopic mechanical properties. Neville [15] once proposed that “the properties of concrete can be predicted by means of the pore structure characteristics of cement.” In addition, with the development of computer technology and the introduction of various software, several scholars simulated the microstructure of cement by constructing the accumulation of cement hydration products or simulating the spatial distribution of pores [16,17,18,19,20,21].
The pore structure has an influence on numerous properties of oil-well cement, such as strength, deformability, permeability, etc. Its influence on the strength of cement is the most significant [22,23,24,25]. Feret [26] proposed that the strength of cement is inversely proportional to the pore volume, similar to the relationship between cement strength and porosity. Abrams [27] established a relationship model between the strength of cement and the water–cement ratio; this model has played a great guiding role in engineering applications. Powers [28] studied the influencing factors of cement strength and proposed the theory of the glue-to-air ratio, which is the ratio of gel volume to capillary pore volume. Balshin [29] derived a model for the relationship between strength and porosity. Ryshkewitch [30] also provided semiempirical formulas for strength and porosity. Griffith [3] pointed out that the theoretical strength of a material is considerably greater than the actual strength, defects exist inside and on the material surface, stress concentration occurs at microcracks under a load, and the total energy shows no change during crack expansion. The above pore structure–strength relationship models all point out that with the increase in porosity, the strength of cement decreases. However, porosity is related to the characteristics of pore distribution. With the same porosity, the range of pore size distribution and the formed space network structure may be different. The influence of these factors on the strength of cement has not been quantitatively studied in detail.
The existing models of pore structure and compressive strength of cement-based materials are mostly obtained through the regression of test data, and porosity is often used to characterize the relationship between pore structure and compressive strength. Combined with the hypothesis of cement pore in the mercury injection method, this paper establishes the pore structure model of oil-well cement [31]. This model not only considers the influence of total porosity on the compressive strength of cement but also the cement content, cement-based elastic modulus, and fracture surface energy. The compressive strength of cement is tested to verify the rationality of the strength model. The cement content is considered in the model, and the relationship between the elastic modulus, fracture surface energy, and total porosity of the cement base is established.
2. Description of the Experiment
In this paper, the pore characteristics of G-grade oil-well cement were studied, and the factors affecting the properties of cement were cement content and curing time (the hydration process). The effects of different types of additives and admixtures, different temperatures, and pressure levels on the structure and properties of cemented pores were not studied.
Based on this, cement slurry was prepared according to the recommended method of “Test Method for Oil-Well Cement” [32], in which admixture A was used. The water-loss-reducing agent performed well, and the added amount accounted for 8% of the cement amount. The sample was prepared according to different cement concentrations (0.74, 0.69, 0.66, 0.63, and 0.61) and curing times (1d, 3d, 7d, and 14d).
The models and parameters of the main experimental devices used in this experiment are shown in Table 1.

Table 1.
Experimental equipment.
2.1. Experimental Reference Standard
- GB/T 19139-2012 “Oil-Well Cement Test Method” [32];
- API RP 10B-2-2005 “Recommended Practice for Oil-Well Cement Testing” [33].
2.2. Cement Sample Preparation
According to the formula design, the prepared cement slurry was poured into a mold (50.8 mm × 50.8 mm) for curing, and the curing temperature was 30 degrees under normal pressure.
3. Modification of Fracture Theory
In 1921, Griffith [3] proposed that the strength of a material refers to its capability to resist the intrusion of external loads, and the brittle fracture is the short board of the material’s performance; based on the energy theory, he established a relationship model between stress, crack size, and strength. When studying the influence of pore characteristics of oil-well cement on strength, the relevant characteristics of oil-well cement must be considered, theoretical corrections should be applied, and regression analysis must be conducted and combined with experimental data to find the relationship between pore structure and strength. The fracture theory states that a material will crack under the action of critical stress, which will lead to the growth of cracks. The critical stress is expressed as follows:
where σt refers to breaking strength, containing cracks of length 2C; C refers to half the length of the original crack; E can be used to describe the elastic modulus of material; and γ refers to the surface energy.
At the mesoscopic level, oil-well cement is a material with pores of different sizes and mainly includes the cement solid-phase material and pore structure. Referring to the research on composite materials, the elastic modulus of oil-well cement is Ec, the elastic modulus of the solid-phase matrix is Es, and the elastic modulus of the pore structure is Ep. The commonly used models are series and parallel models. The elastic modulus of oil-well cement can be calculated as follows [34].
Series model: the stiffness of the composite composed of the solid matrix and pore structure is
or
Parallel model: the elastic modulus of the composite composed of the solid matrix and pore structure is
where Vs refers to the volume percentage of the solid matrix, Vp refers to the volume percentage of the pore structure, Ec refers to the elastic modulus of cement, Es can be used to describe the elastic modulus of the solid matrix, and Ep refers to the elastic modulus of the pore structure. The series model and parallel model are shown in Figure 1.
Figure 1.
Schematic diagram of series and parallel models of elastic modulus.
The series and parallel models are extreme expressions considering the composite elastic modulus of the solid matrix and pore structure. There are some differences between the series model and the parallel model in describing the internal microstructure and mechanical properties of cement. In this paper, the stress distribution was considered to be uniform, and there was no stress concentration when the cement was stressed, so the parallel model was adopted. Given that pores lack stiffness, the elastic modulus is 0. Thus, according to Equation (4), the elastic modulus of the cement is obtained as follows:
When cement is a unit volume, the value of Vs is equal to (1 − ), and the following formula can be obtained from Formula (5):
where Vs refers to the volume percentage of the cement matrix, and can be used to describe the total porosity.
The damage and fracture of cement refer to the process of generating a new surface, and its surface energy γc is the energy required to generate a new surface at the interface of the cement matrix. For cement, the more internal the pores are, the smaller the surface energy required for net failure per unit area; that is, the fracture surface energy of cement decreases with the increase in porosity. Brandt and Wittmann [35,36] established the relationship between the fracture surface energy and porosity of cement-based material products:
where γ0 refers to the fracture surface energy of the solid matrix, and γc refers to the fracture surface energy of cement.
Through the above analysis, a functional relationship is established between the elastic modulus Ec, fracture surface energy γc, and the porosity of the cement. Based on this result, the following relationship between the radius r of the pore and the half-width value C of the crack is established:
where k refers to constants related to the pore shape of cementite.
Assuming that the pore size radius of the cement is r, and the porosity is , according to the fracture theory, by substituting Equations (6)–(8) into Equation (1), the expression of critical stress when the pore fails due to stress failure can be obtained through the following equation:
The hypothesis of Griffith’s fracture theory is the brittle fracture of the material. However, the fracture of oil well cement under the action of stress is not completely brittle fracture. When the load reaches a certain degree, the cement changes from being brittle to plastic and then undergoes partial plastic deformation and absorbs the energy of the elastic strain. Accordingly, Formula (9) needs to be modified for nonideal brittle materials, and (γ0 + γp) is used to replace γ0 in the formula. The revised formula is as follows:
where γp refers to the plastic work corresponding to crack propagation.
The model mainly considers the characteristics of the cement matrix and pore structure, and the effects of temperature, pressure, curing time, and active components can be further studied.
4. Establishment of the Model between Pore Structure and Strength
Given that the pores of oil-well cement had different size distributions and pore sizes, the pores could not be considered as a whole. Therefore, the cement was assumed to be a structure in which different cells represent pores of various size ranges. The compression and failure process analyses of different units were carried out, and the series or parallel model of elastic modulus was used to comprehensively consider the cement.
4.1. Establishment of the Pore Structure Model
To study its actual pore structure system, we considered cement as a structure composed of different units, each of which had a different pore size (as shown in Figure 2). The pore diameters were arranged from small to large to form a structure of n units. The sum of forces on each unit is the resultant force R on the cement structure. Based on this condition, the following assumptions were established:
Figure 2.
Structural model of oil-well cement hole.
- The percentage of pore volume occupied by pores with different pore diameters of cement is equal to the percentage of fractional porosity of the pore to the total porosity, which is expressed as fi:
- 2.
- According to the analysis conclusion in the previous section, the formula for calculating the critical stress when the cement is fractured in tension is as follows:
The total porosity in the formula is replaced by because it can reflect the pores of different sizes in the cement. Given that the uniaxial compressive strength of cement is closely related to the tensile strength, and the coefficient in Equation (1) is related to the strength of the solid-phase volume of cement, the critical stress of cement compressive failure is as follows:
where K0 is a constant related to the strength of cement matrix, and is the critical stress of failure of cement under compression.
According to the analysis above, the strength of the cement matrix is related to its hydration reaction, which is affected by the strength of solid particles and the van Edward force between particles of hydration products, as reflected in the gel content, which is directly proportional to the cement content C of oil-well cement. Formula (13) is modified as follows:
where K refers to the constant related to the properties of the cement matrix, and C refers to the cement content, percentage by weight.
- 3.
- Assuming that the failure of cement occurs first at the weakest cross-section, the average stress σ on the section at this time is
When σ > σc, the cement unit that reaches the stress condition fails, and the rest of the units are continuously loaded until the units that make up the cement fail. Then, the cement is completely destroyed and fails, reaching the limit of strength value.
4.2. Establishment of the Physical Model of Pore Structure
To establish a “structural body” model of an oil-well cement hole, we must obtain the average stress value of the weakest section under pressure. The variable An in Equation (15) is the net cross-sectional area of the cement cross-section, and the cross-sectional area An of the pores cannot be directly measured from the experiment. A scaling relationship exists between the surface area and volume of the cement sample. According to the “structural body” model, the pore area on the cross-section can be obtained, thereby obtaining the net cross-sectional area An.
The assumption of porosity by mercury intrusion porosimetry is that the pores are cylindrical. In the pore structure model used here, we also considered the same assumption to ensure consistency with the assumption of the porosity measurement principle of the mercury intrusion method and establish a three-dimensional orthogonal cylindrical pore model. As shown in Figure 3, in this model, r is the radius of the cylindrical hole, and s is the distance between adjacent cylindrical holes.
Figure 3.
The physical model plan of cement pore structure.
The pore structure model is suitable for the study of oil-well cement pores. A functional relationship exists between the average radius r of the pores, the number of pores per unit length N, and porosity, and it can be obtained via triple integration:
According to Figure 3, the relationship between the net sectional area of unit area An and rN is as follows:
Our analysis shows that the porosity of the pore structure model per unit volume is as follows:
The combined Formulas (16) and (18) can be obtained as follows:
The relationship between the net cross-sectional area and porosity can be obtained by combining Equations (16) and (18). The sub-porosity of the pores of each pore level can be obtained according to the experimental data of the pore structure. When the result is substituted into Equation (19), the product riNi of the pore radius and the number of pores per unit length can be obtained. With the help of the relational Equation (17) between the net cross-sectional area An and rN, the net cross-sectional area Ani of the structural unit under different sizes can be obtained.
5. Failure and Qualitative Analysis of the Pore Structure Model
5.1. Failure Process Analysis of the Pore Structure Model
In Section 4.1, assumptions were put forward when the pore structure model of cement was established, and the failure process of the weak surface of cement was simply described. In combination with the pore structure model, the process of compression failure of cement structure is described below. When the cement is loaded, the initial pressure is R1, the initial net cross-sectional area of the cement structure is A1, and the compressive stress is expressed as follows:
where A1 refers to the sum of the net cross-sectional areas of n monomers of the structure. It is determined as follows:
When the compressive stress increases:
When the compressive stress is greater than the critical stress for cement failure, the cement element containing pores with a radius of r1 will fail and be destroyed, and at this time, the net cross-sectional area of the cement per unit area decreases from A1 to A2:
Since the initial pressure is R1, when the net section decreases, the stress increases to R1/A2. Similarly, if there is
then the cement unit with a pore radius of r2 fails, and the net cross-sectional area of the cement per unit area is reduced from A2 to A3:
As the net section decreases, the stress increases to R1/A3.
Similarly, if the following relation exists
then the cement unit with a pore radius of ri fails, and the net cross-sectional area per unit length of cement is reduced to Ai+1:
As the net cross-section decreases, the stress increases to R1/Ai+1.
In the loading process, if
it means that the remaining section of cement can withstand the initial load R1, and at this time, the loading pressure is increased to R2 until
Then, unit i of the cement also fails, the net cross-sectional area of the cement decreases again, and the stress further increases. In this cycle, the load R is satisfied:
At this time, the cement is completely destroyed, and the load is R, from which the macroscopic compressive strength of the cement can be calculated.
5.2. Qualitative Analysis of the Cement’s Pore Structure Model
In accordance with the modified Griffith fracture theory and composite model, the cement’s pore structure model was established, and the failure process was analyzed. The qualitative analysis of the cement pore structure model was carried out as follows:
- Oil-well cement includes a solid matrix and a pore structure. The strength of the solid-phase matrix of cement is affected by its gel components. For cement with the same matrix, if the porosity is large, the net cross-sectional area per unit section will be small. The greater the compressive stress, the lower the load at the time of failure of the cement structure, and the lower the calculated compressive strength of the cement.
- If the matrix strength and total porosity of the cement are the same, according to the above cycle process, the more large pores per unit area, the faster the decrease in the net cross-sectional area, the smaller the load during the cement structure failure, and the lower the compressive strength. Thus, under the same porosity, the effect of large pores on strength is more unfavorable than that of small pores.
- Porosity is not the only parameter used to measure the compressive strength of cement. The pore size distribution also affects the compressive strength. If the influence of pore structure distribution is considered, the compressive strength of cement with a small porosity may be lower than that of cement with a large porosity, that is, the porosity is small but the distribution of macropores is large., and the porosity is large but the distribution of macropores is small.
- The strength of the cement matrix is related to the content of the cementitious components in unit volume. According to a previous analysis, this condition is related to the connection between the cement particles and the van der Waals force between the hydration products. The content of cementitious components per unit volume is related to the content of oil-well cement.
- The strength of the cement matrix is related to the cement content. The higher the cement content per unit volume, the higher the cementitious component, and the higher the matrix strength. Water content is proportional to the porosity of the cement.
According to the failure process analysis of the cement pore structure model, the influence of cement pores of different sizes on the compressive strength of oil-well cement was determined, and the pore size distribution and porosity of cement were quantitatively analyzed. The experimental data used in the model were the actual pore radius value ri. The accuracy was improved, thus reflecting the real situation of the influence of the pore structure of cement on the compressive strength.
6. Compilation and Parameter Analysis of the Relationship Model between Pore Structure and Strength
6.1. Compilation of the Relationship Model between Pore Structure and Strength
According to the establishment of the cement strength model and the analysis of the failure process and combined with the pore distribution data obtained from the mercury injection experiment, the compressive strength of cement required multiple cyclic calculations. Therefore, the failure process was programmed in accordance with the model principle to obtain the compressive strength value (as shown in Figure 4). To verify the accuracy of the strength model, we compared the calculated value of the strength model with the measured compressive strength of oil-well cement to verify their correlation. The parameters in the model were e analyzed using the same method.
Figure 4.
Schematic diagram of cement compressive strength model program.
6.2. Regression Analysis of Constant K
In Section 4.1, several assumptions were considered to establish the pore structure model. The formula for calculating the critical stress of the cement unit with the pore radius size ri in tension is as follows:
Considering the cement content, the formula for calculating the critical stress of the cement element under load is as follows:
The above formula is transformed from the critical tensile stress, which reflects the correlation between the tensile and compressive strengths of cement. K is a constant related to the elastic modulus, surface energy, and pore shape of the cement matrix. The K value under the action of multiple factors is very difficult to obtain. It can be obtained via regression analysis in combination with the experimental data of the pore characteristic parameters of cement. Oil-well cement slurries with different water–cement ratios were prepared, and the cement specimens were cured in an atmospheric curing kettle for 1, 3, 7, and 14 days. The compressive strength and pore distribution data of the corresponding cement were tested. The experimental results are shown in Table 2.
Table 2.
Compressive strength and pore distribution of oil-well cement.
Given the various pore structure distribution characteristics of different cement samples, i.e., since the particle size distribution range varied, when the model was verified, the size range was divided based on the pore size range of gel pores, capillary pores, and voids. The pore size nodes were 20, 50, and 200 nm. Given the large size range of large apertures (multiple orders of magnitude), the average size of large aperture size nodes was 2000 nm. According to the establishment process of the intensity model above, the half-values of the corresponding aperture nodes were 10, 25, 100, and 1000 nm. After dividing the pore size, the fractional porosity of the corresponding pore size was obtained, and it was substituted into the model to determine the K value as follows:
- The range of K values was preliminarily determined through trial calculation;
- The calculation was carried out through interpolation to obtain a relatively accurate K value, and then the value was substituted into the strength model for verification;
- If the calculated intensity error of the obtained K value was large, the calculation was repeated until the result became close to the measured value.
The trial calculation was carried out using the program of the strength model. The initial K value was 1000, and with this value, the calculated compressive strength of cement were less than the measured value. The K value was 3000 for the next trial calculation. The K value was preliminarily determined to be between 1000 and 3000, and the corresponding compressive strength values are shown in Table 2. The calculated and measured values were fitted when K values were 1000 and 3000. If the predicted value was close to the measured value, its correlation coefficient was close to 1, and its slopes were 0.638 and 2.013, respectively. Further trial calculation was required, and the K value was 2000. The corresponding fitting curves for the different K values are shown in Figure 5, Figure 6 and Figure 7.
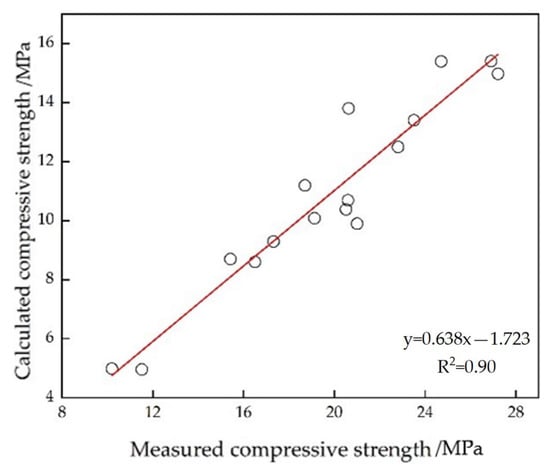
Figure 5.
The relationship between the calculated strength and the measured strength (K = 1000).
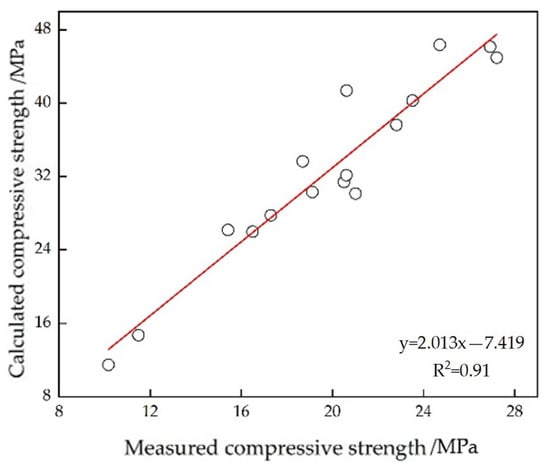
Figure 6.
The relationship between the calculated strength and the measured strength (K = 3000).
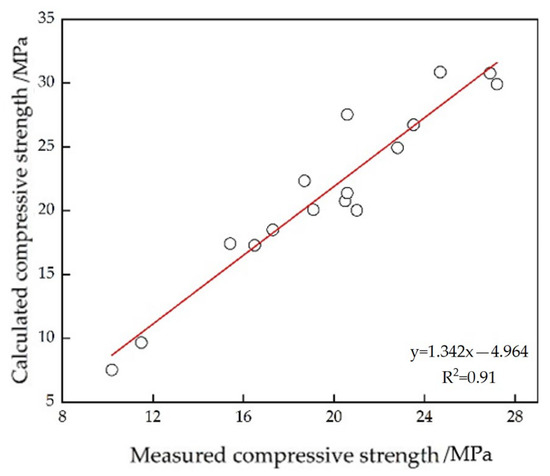
Figure 7.
The relationship between the calculated strength and the measured strength (K = 2000).
When the value of K was 2000, the correlation coefficient of the fitting curve between the calculated intensity of the model and the measured intensity was 1.342. Considering the calculated value, the value of K selected in the trial calculation is too large, so the smaller values of K were again used for the trial calculation. The values of 1600 and 1700 were substituted into the model for calculation. Table 3 shows the calculated values of the model. The strength values of the samples were fitted with the calculated values of the model again.
Table 3.
Calculated strength and measured strength of oil-well cement (K = 1600 and 1700).
When the value of K was 1600, the fitting curve between the strength value of the sample and the calculated value of the model was determined (Figure 8). The slope of the fitting curve was 1.077, and the correlation coefficient was 0.84. The distribution on both sides of the curve shows that the K value of 1600 should be very close. To avoid obtaining an extremely small value, the K value of 1700 was used again, and the model calculation value of compressive strength was determined. The results are fitted and shown in Table 3. Figure 9 displays the fitting curve. The slope of the curve was 1.146. This shows that when K value was 1600, the calculated value was closer to the experimental value and more accurate.
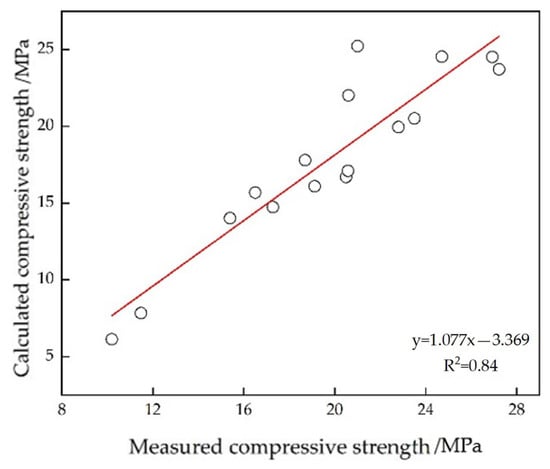
Figure 8.
The relationship between the calculated strength and the measured strength (K = 1600).
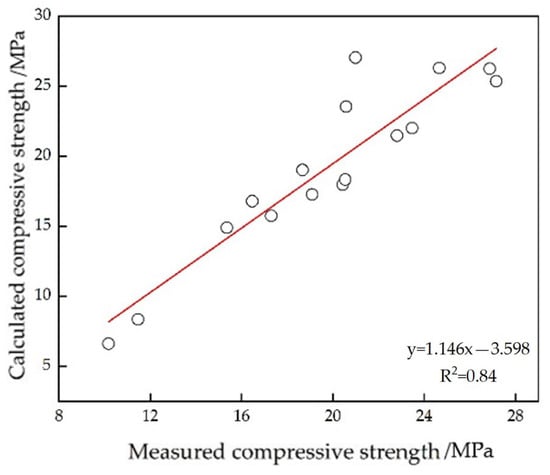
Figure 9.
The relationship between the calculated strength and the measured strength (K = 1700).
The final K value was 1600, and the relationship between the model-calculated and measured strengths was established as follows:
6.3. Analysis of the Influence of Cement Content on the Model
In the previous section, in the actual measurement test of the compressive strength of oil-well cement, the content range of the corresponding oil-well cement was 0.74–0.61. The cement pore structure model established in this paper considers the influence of oil-well cement content C on the compressive strength of cement. If the cement content is not considered, the strength value calculated using the cement strength model will have a certain error with the predicted value of the structure model. The cement content C was removed from the prepared model, the K value of 1600 was used, the strength value was recalculated, and the effect of cement content on the results of strength calculation for cement paste was verified. Table 4 shows the measured and calculated strength values. If the cement content is not considered, then the critical stress of compression failure of the structural model is as follows:
Table 4.
Calculated strength and measured strength of oil-well cement.
The model calculation values considering the cement content and the model calculation values without considering the cement content were compared and plotted in a graph to observe their distribution patterns, as shown in Figure 10.
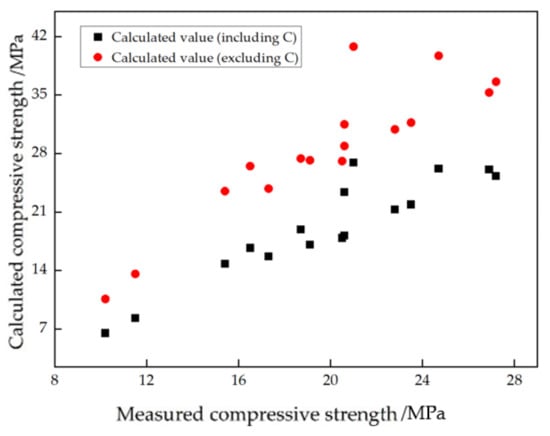
Figure 10.
Compressive strength value calculated with and without cement content.
Considering the above strength data and the distribution of strength values in the figure, the content of oil-well cement C has a great effect on the compressive strength of cement. If the cement content is not considered, then the calculated compressive strength value increases significantly. Thus, the strength calculation value without considering the cement content is not a simple proportional relationship with the strength calculation value considering the cement content; rather, it also reflects the fluctuating effect of cement content.
The research on the pore structure distribution characteristics of oil-well cement shows that porosity is greatly affected by the cement content. The higher the cement content, the lowerthe corresponding porosity. The relationship between the macroscopic pore structure, the strength of the cement matrix, and the compressive strength of the cement was pointed out. The pore structure model described in this section was established from a mesoscopic perspective, and it can be combined with pore structure distribution data, cement content, etc., to calculate the compressive strength value.
6.4. Analysis of the Influence of Total Porosity on the Model
For developing the cement structure model explained in this section, the cement was considered as a structure composed of the cement matrix and pore structure, and a parallel model suitable for the characteristics of cement was used to obtain the elastic modulus of the cement matrix and elastic modulus. Combined with the relationship between the fracture surface energy and porosity of cement-based material products, the Griffith fracture theory formula was revised, and the strength relationship model of the pore structure was established. The total porosity of the cement was removed from the compiled model, the K value of 1600 was considered, and the strength value was recalculated. Given that partial porosity is related to surface energy, the extent of the effect of total porosity on the strength calculation results of the cement was verified. Table 5 reveals the measured strength values and calculated values. If the relationship between elastic modulus Ec, fracture surface energy γc, and porosity φ is not considered, then the critical stress for the failure of the structural model under compression is as follows:
Table 5.
Calculated strength and measured strength of oil-well cement.
The model calculation values considering and not considering the total porosity of the cement were drawn into a figure, and the distribution law was observed, as shown in Figure 11.
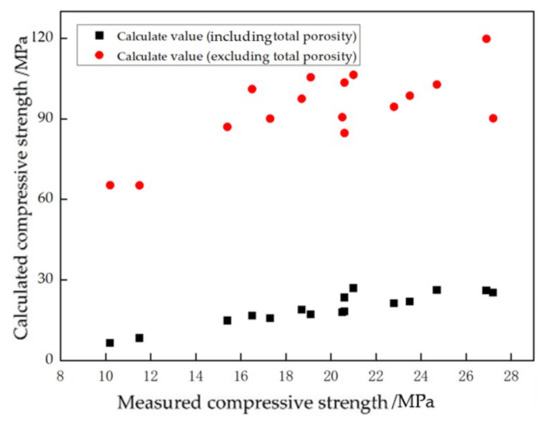
Figure 11.
Compressive strength value calculated with and without total porosity.
Considering the above strength data and the distribution of strength values in the figure, the total porosity has a great influence on the calculation results for cement-paste strength. From the failure process of the cement-paste structure model, when the total porosity is not considered, the stress value entering the cycle is high. Therefore, the calculated strength value is substantially large. According to the analysis of the previous model establishment process, total porosity is related to the elastic modulus of cement Ec and its fracture surface energy γc. If the influence of this factor is not considered, then the calculated intensity value will have a large deviation.
Through the above analysis, the cement structure model considers the influence of factors, such as cement content, elastic modulus of cement, fracture surface energy, and other pore distribution, and its establishment process is reasonable. Through regression analysis, the K value of 1600 was obtained.
7. Conclusions
By analyzing the relationship model between the cement hole’s structure and strength, the following conclusions can be drawn:
- Class G cement is composed of a cement matrix and pore structure. Through the analysis of its failure process, it can be concluded that when the strength of the cement matrix and the pore size distribution characteristics are the same, the smaller the porosity is, the higher the compressive strength of the cement specimen is.
- The cement with the same formula and porosity as Class G oil well, if containing more large pores, leads to a faster reduction in the effective cross-sectional area of loaded units and a smaller load at which the cement fails. Therefore, the compressive strength of cement specimens is lower. This also indicates that porosity alone cannot fully describe the pore structure characteristics of cement, and the existence of large pores has a more adverse effect on compressive strength than small pores with the same volume.
- The porosity of cement is not the only structural parameter affecting compressive strength. The size distribution of pores has a significant impact on the strength of cement. For example, a cement specimen with low porosity may have lower compressive strength than a specimen with relatively high porosity if it contains a certain amount of large pores, provided that the specimen with higher porosity has uniformly distributed small pores.
- Through the above analysis, the structural model of cement considers the influence of factors such as cement content, the elastic modulus of cement, fracture surface energy, and pore distribution. The establishment process is reasonable. Via regression analysis, taking the K value as 1600, the correlation coefficient between the calculated values of the model and experimental measurements was 1.077.
Author Contributions
Methodology, J.S.; Formal analysis, G.Z.; Writing—original draft, G.Z.; Supervision, X.G.; Project administration, Z.L. All authors have read and agreed to the published version of the manuscript.
Funding
This research work and APC was funded by the science and technology project of CNPC BOHAI Drilling Engineering Company Limited (No. 2021ZD24Y-02) and the National Natural Science Foundation of China (52274010).
Data Availability Statement
The data that support the findings of this study are available from the corresponding author, [G.Z.], upon reasonable request.
Conflicts of Interest
The authors declare no conflict of interest.
References
- Niu, Q.H.; Cao, L.W.; Sang, S.X.; Wang, W.; Yuan, W.; Chang, J.F.; Jia, X.-J.; Zheng, W.-M.; Zhang, Z.X. A small-scale experimental study of CO2 enhanced injectivity methods of the high-rank coal. Pet. Sci. 2021, 18, 1427–1440. [Google Scholar] [CrossRef]
- Li, H.B.; Yang, Z.M.; Li, R.S.; Zhou, T.Y.; Guo, H.K.; Liu, X.W.; Dai, Y.-X.; Hu, Z.-G.; Meng, H. Mechanism of CO2 enhanced oil recovery in shale reservoirs. Pet. Sci. 2021, 18, 1788–1796. [Google Scholar] [CrossRef]
- Griffith, A.A. The Phenomena of Rupture and Flow in Solids. Philos. Trans. R. Soc. A Math. Phys. Eng. Sci. 1920, 221, 163–198. [Google Scholar] [CrossRef]
- Walton, J.; Button, C.E. Towards carbon neutrality and environmental sustainability at CCSU. Int. J. Sustain. High. Educ. 2009, 10, 279–286. [Google Scholar] [CrossRef]
- Jian, S.U.; Liang, Y.; Ding, L.; Zhang, G.; Liu, H. Research on China’s Energy Development Strategy under Carbon Neutrality. Bull. Chin. Acad. Sci. 2022, 36, 1001–1009. [Google Scholar] [CrossRef]
- Fuhrman, J.; Clarens, A.F.; McJeon, H.; Patel, P.; Doney, S.C.; Shobe, W.M.; Pradhan, S. China’s 2060 carbon neutrality goal will require up to 2.5 Gt CO2/year of negative emissions technology deployment. arXiv 2021, arXiv:2010.06723. [Google Scholar]
- Zhao, X.; Ma, X.; Chen, B.; Shang, Y.; Song, M. Challenges toward carbon neutrality in China: Strategies and countermeasures. Resour. Conserv. Recycl. 2022, 176, 105959. [Google Scholar] [CrossRef]
- Holt, G.C. Carbon neutrality—What does it mean? Nanotechnol. Percept. 2009, 5, 135–145. [Google Scholar] [CrossRef]
- Rakesh Kumar, A.; Bhattacharjee, B.B. Study on some factors affecting the results in the use of MIP method in concrete research. Cem. Concr. Res. 2003, 33, 417–424. [Google Scholar] [CrossRef]
- Aligizaki, K.K. Pore Structure of Cement-Basaed Matrrials: Testing, Interpretation and Requirements; CRC Press: Boca Raton, FL, USA, 2005. [Google Scholar]
- Barnes, P. Structure and Performance of Cements. Canadian J. Civ. Eng. 2003, 25, 127. [Google Scholar] [CrossRef]
- Claude, P.; Oliver, B.; Jerome, D. Reactive powder concrete: From theory to practice. Concr. Int. 1996, 18, 47–49. [Google Scholar]
- Chen, X.; Wu, S. Influence of water-to-cement ratio and curing period on pore structure of cement mortar. Constr. Build. Mater. 2013, 38, 804–812. [Google Scholar] [CrossRef]
- Cnudde, V.; Cwirzen, A.; Masschaele, B.; Jacobs PJ, S. Porosity and microstructure characterization of building stones and concretes. Eng. Geol. 2009, 103, 76–83. [Google Scholar] [CrossRef]
- Neville, A.M. Properties of Concrete. Prop. Concr. 1996, 36, 838–844. [Google Scholar] [CrossRef]
- Li, T.; Wu, C.F.; Wang, Z.W. The dynamic change of pore structure for low-rank coal under refined upgrading pretreatment temperatures. Pet. Sci. 2020, 18, 430–443. [Google Scholar] [CrossRef]
- Wang, Z.Z.; Njiekak, G.; Schmitt, D.R.; Wang, R.H. Empirical rock physics relationships on carbonate dry-frame elastic properties. Pet. Sci. 2021, 18, 783–806. [Google Scholar] [CrossRef]
- Jiang, L.; Guan, Y. Pore structure and its effect on strength of high-volume fly ash paste. Cem. Concr. Res. 1999, 29, 631–633. [Google Scholar] [CrossRef]
- Li, Y.; Cheng, Y.F.; Yan, C.L.; Wang, Z.Y.; Song, L.F. Effects of creep characteristics of natural gas hydrate-bearing sediments on wellbore stability. Pet. Sci. 2022, 19, 220–233. [Google Scholar] [CrossRef]
- Diamond, S. Mercury porosimetry: An inappropriate method for the measurement of pore size distributions in cement-based materials. Cem. Concr. Res. 2000, 30, 1517–1525. [Google Scholar] [CrossRef]
- Apedo, K.L.; Montgomery, P.; Serres, N.; Fond, C.; Feugeas, F. Geometrical roughness analysis of cement paste surfaces using coherence scanning interferometry and confocal microscopy. Mater. Charact. 2016, 118, 212–224. [Google Scholar] [CrossRef]
- Taylor, H. Discussion of the paper “Microstructure and strength of hydrated cements” by R.F. Feldman and J.J. Beaudoin. Cem. Concr. Res. 1977, 7, 465–468. [Google Scholar] [CrossRef]
- Roy, D.M.; Gouda, G.R. High Strength Generation in Cement Pastes. Cem. Concr. Res. 1973, 3, 807–820. [Google Scholar] [CrossRef]
- Zivica, V.; Krizma, M. Dependence of efficiency of pressure compaction on the cement type used. Constr. Build. Mater. 2011, 25, 3073–3077. [Google Scholar] [CrossRef]
- Ahmad, S.N.; Manton, B.G. Some Factors Affecting the Compressive Strength of Soil-Cement; University of Utah: Salt Lake City, UT, USA, 1900; Volume 27. [Google Scholar]
- Taylor, F.W.; Thompson, S.E.; Feret, R.; Fuller, W.B. Chapter XXXI Cement Manufature; Thomas Telford: London, UK, 1922. [Google Scholar]
- Rao, G.A. Generalization of Abrams’ law for cement mortars. Cem. Concr. Res. 2001, 31, 495–502. [Google Scholar] [CrossRef]
- Powers, T.C. Should Portland cement be dispersed? J. Proc. 1945, 42, 117–140. [Google Scholar]
- Nielsen, L.F. Strength development in hardened cement paste: Examination of some empirical equations. Mater. Struct. 1993, 26, 255–260. [Google Scholar] [CrossRef]
- Luo, Y. Compressive strength and pore structure of high-performance concrete after exposure to high temperature up to 800degC. Cem. Concr. Res. 2000, 30, 247–251. [Google Scholar]
- Chen, G.; Hao, Y.; Hao, H. 3D meso-scale modelling of concrete material in spall tests. Mater. Struct. 2015, 48, 1887–1899. [Google Scholar] [CrossRef]
- GB/T 19139-2012; Testing of Well Cements. China National Standardization Commission: Beijing, China, 2012.
- API RP10B-2-2005; Recommended Practice for Oil-Well Cement Testing. American Petroleum Institute: Washington, DC, USA, 2005.
- Guzev, M.; Riabokon, E.; Turbakov, M.; Kozhevnikov, E.; Poplygin, V. Modelling of the Dynamic Young’s Modulus of a Sedimentary Rock Subjected to Nonstationary Loading. Energies 2020, 13, 6461. [Google Scholar] [CrossRef]
- Brandt, A.M. Cement-Based Composites: Materials, Mechanical Properties and Performance, 2nd ed.; CRC Press: Boca Raton, FL, USA, 2009. [Google Scholar]
- Wittmann, F. Fracture Mechanics of Concrete; Elsevier: Amsterdam, The Netherlands, 1983. [Google Scholar]


Disclaimer/Publisher’s Note: The statements, opinions and data contained in all publications are solely those of the individual author(s) and contributor(s) and not of MDPI and/or the editor(s). MDPI and/or the editor(s) disclaim responsibility for any injury to people or property resulting from any ideas, methods, instructions or products referred to in the content. |
© 2023 by the authors. Licensee MDPI, Basel, Switzerland. This article is an open access article distributed under the terms and conditions of the Creative Commons Attribution (CC BY) license (https://creativecommons.org/licenses/by/4.0/).