Article

A New Method for Comprehensive and Quantitative Characterization of Shale Microfractures: A Case Study of the Lacustrine Shale in the Yuanba Area, Northern Sichuan Basin

1
State Key Laboratory of Petroleum Resources and Prospecting, China University of Petroleum (Beijing), Beijing 102249, China
2
College of Geosciences, China University of Petroleum (Beijing), Beijing 102249, China
3
Carbonate Research Center, China University of Petroleum (Beijing), Beijing 102249, China
*
Author to whom correspondence should be addressed.
Energies 2023, 16(15), 5685; https://doi.org/10.3390/en16155685
Submission received: 1 July 2023 / Revised: 21 July 2023 / Accepted: 26 July 2023 / Published: 28 July 2023
(This article belongs to the Section H: Geo-Energy)

Abstract

:
Microfractures can connect isolated pores within shale, significantly increasing the shale’s storage capacity and permeability, and benefiting shale gas exploitation. Therefore, the quantitative characteristics of microfractures are important parameters for shale reservoir evaluation. In this paper, taking the Jurassic Da’anzhai Member (J1z4) lacustrine shale in the Yuanba area of the northern Sichuan Basin as an example, we propose a method for comprehensive and quantitative characterization of shale microfractures that combines rock thin section (RTS) and scanning electron microscopy (SEM) observations. The different magnifications of RTSs and SEM images lead to the identification and characterization of microfractures of different scales using these two methods. RTSs are mainly used to characterize microfractures with widths larger than 10 μm, while SEM is mainly used to characterize microfractures with widths smaller than 10 μm. These techniques can be combined to comprehensively and quantitatively characterize microfractures of different scales in shale. The microfracture characterization results show that the average total porosity of the J1z4 shale is 4.46%, and the average microfracture surface porosity is 1.20% in the Yuanba area. The calculated average percentage of microfracture porosity to total porosity is 21.09%, indicating that the J1z4 shale reservoir space is dominated by pores and has the conditions for stable shale gas production and potential for shale gas exploration. However, the percentage of microfracture porosity to total porosity of shale near faults and fold zones approaches or exceeds 50%, which may lead to the loss of shale gas. The new method proposed in this study is also useful for quantitative characterization of shale microfractures in the Sichuan Basin and other basins.

1. Introduction

Microfractures are fractures with widths (fracture width) of up to tens of microns and lengths of up to several millimeters [1,2], and can only be observed with a microscope. Shale microfractures provide important reservoirs and flow channels for shale gas and greatly impact shale gas accumulation and enrichment [3,4,5,6]. In addition, microfractures can connect the pores within shale and improve the permeability of low-permeability shale, greatly benefiting the development of shale gas [5,6,7,8]. Therefore, quantitative characterization of microfractures has attracted extensive interest in the evaluation of shale reservoir quality, gas-bearing property, and shale fracturing [4,8,9,10].
For RTS observations, an optical microscope is used to observe the shapes of the microfractures at magnifications of 20–500×, and to statistically quantify the surface porosity of the fractures. Limited by the magnification power, rock thin section observations are mainly used to identify micron-scale fractures and fail to recognize and characterize nano-scale fractures [8,11]. However, the nano-scale microfractures in shale are highly developed and help increase the shale reservoir volume and improve the reservoir permeability [11,12]. Therefore, a technique with a higher resolution (higher magnification) needs to be used to identify and quantitatively characterize nano-scale microfractures. SEM have magnifications of thousands of times to tens of thousands of times, so they are able to identify micron- and nano-scale microfractures that cannot be resolved by ordinary optical microscopes [13]. In addition, micro-CT scans are capable of reconstructing the shape, size, and distribution of the pores and fractures in shale [14,15]. However, micro-CT is unable to resolve microfractures that are less than 1 μm wide. Thus, each microfracture characterization technique has its own characteristics and application scope. The comprehensive quantitative characterization of cross-scale microfractures must be conducted using a combination of multiple analysis technologies.
At present, major breakthroughs in marine shale gas exploration have been made in the Sichuan Basin and adjacent regions [16,17,18,19], and lacustrine shale oil and gas have also been found to have good exploration potential in the Ordos Basin and Sichuan Basin [20,21], indicating that the lacustrine shale has a good oil and gas exploration potential. Because the organic pores in continental shale are not as developed as those in marine shale [22], microfractures are crucial to the enrichment and high production yield of continental shale gas [23,24,25,26]. Several wells drilled in the Yuanba area have yielded industrial gas flow in the lacustrine shale of the J1z4, but the enrichment of shale gas varies considerably [27,28]. The microfractures in the J1z4 shale are well developed [29], but a lack of comprehensive quantitative characterization of the microfractures in this area limits our understanding of the percentage of the microfracture porosity to the total porosity and the distribution of the microfractures, which limits our understanding of the relationships between the shale gas accumulation and enrichment and the shale microfractures. In this paper, we propose a new method that combines RTS and SEM observations to comprehensively characterize the microfractures in the J1z4 shale in the Yuanba area. Using this method, we identify the percentage of the microfracture porosity to the total porosity and analyze the influence of the microfractures to the shale gas production. The results provide a reference for the exploration and development of lacustrine shale gas in the study area and adjacent areas.

2. Geologic Background

The Yuanba area is located in the cities of Guangyuan and Bazhong in the northern Sichuan Basin. It is situated at the tectonic intersection of the Cangxi-Bazhong gentle slope, Tongnanba anticline, Jiulongshan anticline, Chixi depression, and Tongjiang depression in the southern part of the Micangshan uplift [30] (Figure 1A). The Yuanba area can be divided into four tectonic belts based on the characteristics of the tectonic deformation (Figure 1B): the Jiulongshan anticline belt (I), the western weak syncline belt (II), the central fault-fold belt (III), and the eastern fault-fold belt (IV). The tectonic deformation of the Jiulongshan anticline belt and the western syncline belt is relatively weak, and only small-scale faults are developed in the Jurassic, while the tectonic deformation of the central fault-fold belt and the eastern fault-fold belt is relatively strong, and more north–south- and northwest–southeast-trending faults and folds are developed in the Jurassic, respectively.
The Late Indosinian movement in the Middle Triassic caused the uplift of the Sichuan Basin, gradually changing from a marine carbonate platform depositional environment to a continental lacustrine basin depositional environment [29]. In the Late Triassic, delta and lacustrine deposits mainly developed in the Yuanba area. After the deposition of the Xujiahe Formation (T3x) in the Late Triassic, the Ziliujing Formation (J1z) and the Qianfoya Formation (J2q) developed successively in the Early Jurassic. The J1z can be further divided into four members from the bottom to the top: Zhenzhuchong (J1z1), Dongyuemiao (J1z2), Ma’anshan (J1z3), and Da’anzhai Members (J1z4) (Figure 1C) [32]. During the deposition of the J1z4 in the Early Jurassic, the lake basin experienced a complete regression–transgression cycle. According to the characteristics of the stratigraphy and sedimentary cycle, J1z4 can be divided into three sub-members, ranging in age from oldest to youngest: the third sub-member, the second sub-member, and the first sub-member. The water body moved increasingly deeper during the deposition of the third sub-member, and thick shell limestone interbedded with thin shallow lacustrine mudstone was deposited. During the deposition of the second sub-member, the maximum flooding period occurred, shallow-semi-deep lacustrine deposits were mainly developed in the Yuanba area, and thick layers of black mud shale interbedded with argillaceous shell limestone were deposited [33]. During the deposition of the first sub-member, the water body gradually became shallower, the Yuanba area evolved into a coastal-shallow lake depositional environment, and a thick layer of shell limestone was deposited [31,34].

3. Sampling and Methodology

Current microfracture characterization methods mainly include RTS observations [35,36], SEM [35,36,37,38,39,40,41], and micro-computed tomography (micro-CT) scanning [42,43,44]. In this study, thirty-five samples of the J1z4 shale were collected from nine wells (YB102, YB104, YB122, YB273, YL4, YL30, YL171, YL17 and YL176; the well locations are shown in Figure 1B) in the Yuanba area. The helium porosities of these samples were measured, and microfractures were observed and quantified via RTS and SEM characterization. Micro-CT scans were performed on five of these samples to identify and characterize the microfractures.
The microscope used for thin rock section observations was a Nikon LV100NPOL microscope, the observation of the samples was carried out in the State Key Laboratory of Petroleum Resources and Prospecting, China University of Petroleum (Beijing, China), and image analysis software (NIS-Elements Viewer 4.2.0) was used to automatically stitch the microscopic images to create a full-view image of RTS. Then, the Coreldraw2019 software package was used to draw a closed curve along the edges of each microfracture and fill it with a specific color, and Photoshop2019 was used to calculate the pixel area of the microfracture and a rock slice in the entire field of view. Finally, the pixel area of the microfracture was divided by the pixel area of the rock slice to obtain the fracture surface porosity. The SEM used was a Hitachi SU8010, the highest resolution of which was about 1 nm. The samples were processed in the Laboratory of Energy Materials Microstructure, China University of Petroleum (Beijing, China). First, 5 mm × 5 mm × 2 mm shale samples were cut perpendicular to the bedding direction, followed by argon ion polishing and gold plating, and observed using the back scattering mode and secondary electron method, while energy spectrometry was used to determine the mineral composition. They were imaged in secondary electron mode at magnifications of 300–10,000 times. Twenty images were taken perpendicular to the bedding direction. Then, a threshold segmentation method and the ImageJ V1.8.0 software were used to identify the microfractures in the microscopic images and quantitative statistical analysis was performed to obtain the average surface porosity of the microfractures at the scale of the SEM images [45,46,47,48,49]. The micro-CT instrument used was a MicroXCT-400 with a maximum resolution of up to 0.7 µm and an operating voltage of 40 kV. The samples were processed in the Experimental Center of Petroleum Geology of Research Institute of Petroleum Exploration and Development. The shale samples were cut into 1 mm cubes, and then chloroform circulation was conducted on the samples for 72 h at room temperature to remove the hydrocarbons within the samples. Then, they were dried in an N2 atmosphere and scanned via micro-CT for about 6 h. The tomography mode was used to collect the images of the samples. The two-dimensional slice images inside a sample were obtained consecutively. Finally, the microfractures in the slice images were identified and counted to obtain the surface porosity of the microfractures. The instrument used for the helium porosity analysis was a JS100007 helium porosimeter. The analysis and testing of helium porosity were conducted following the relevant industrial standards.

4. Results

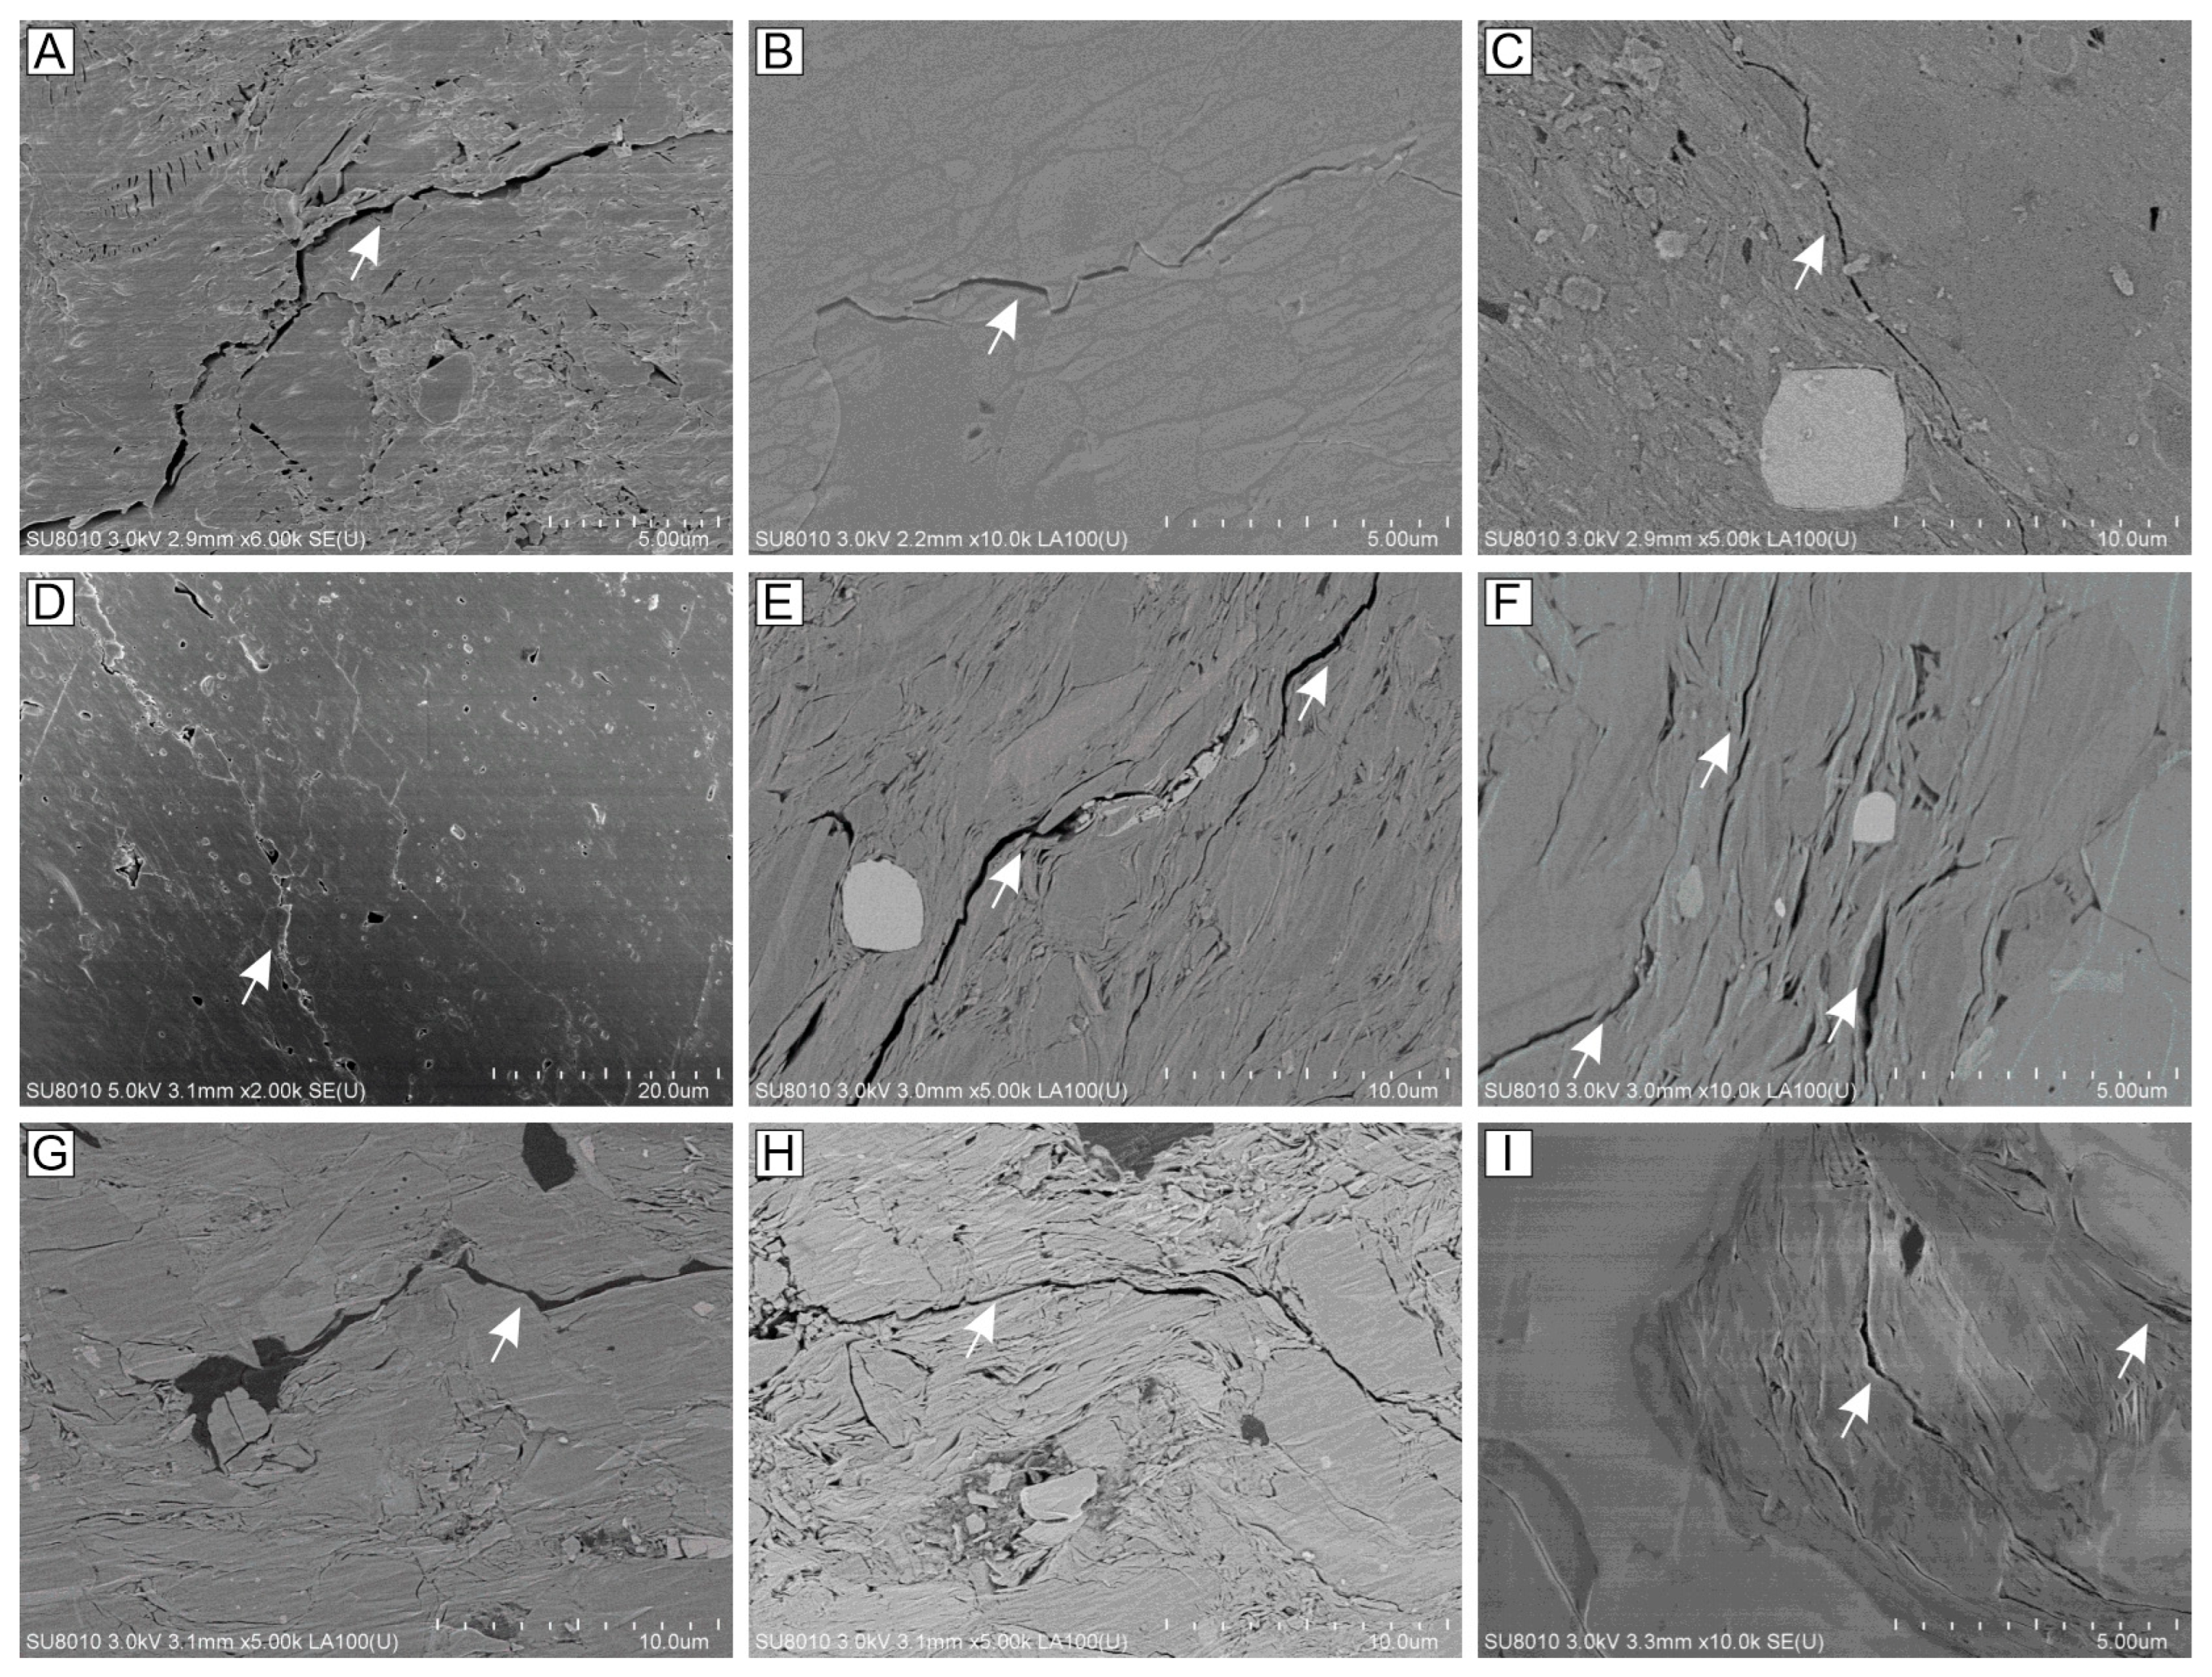
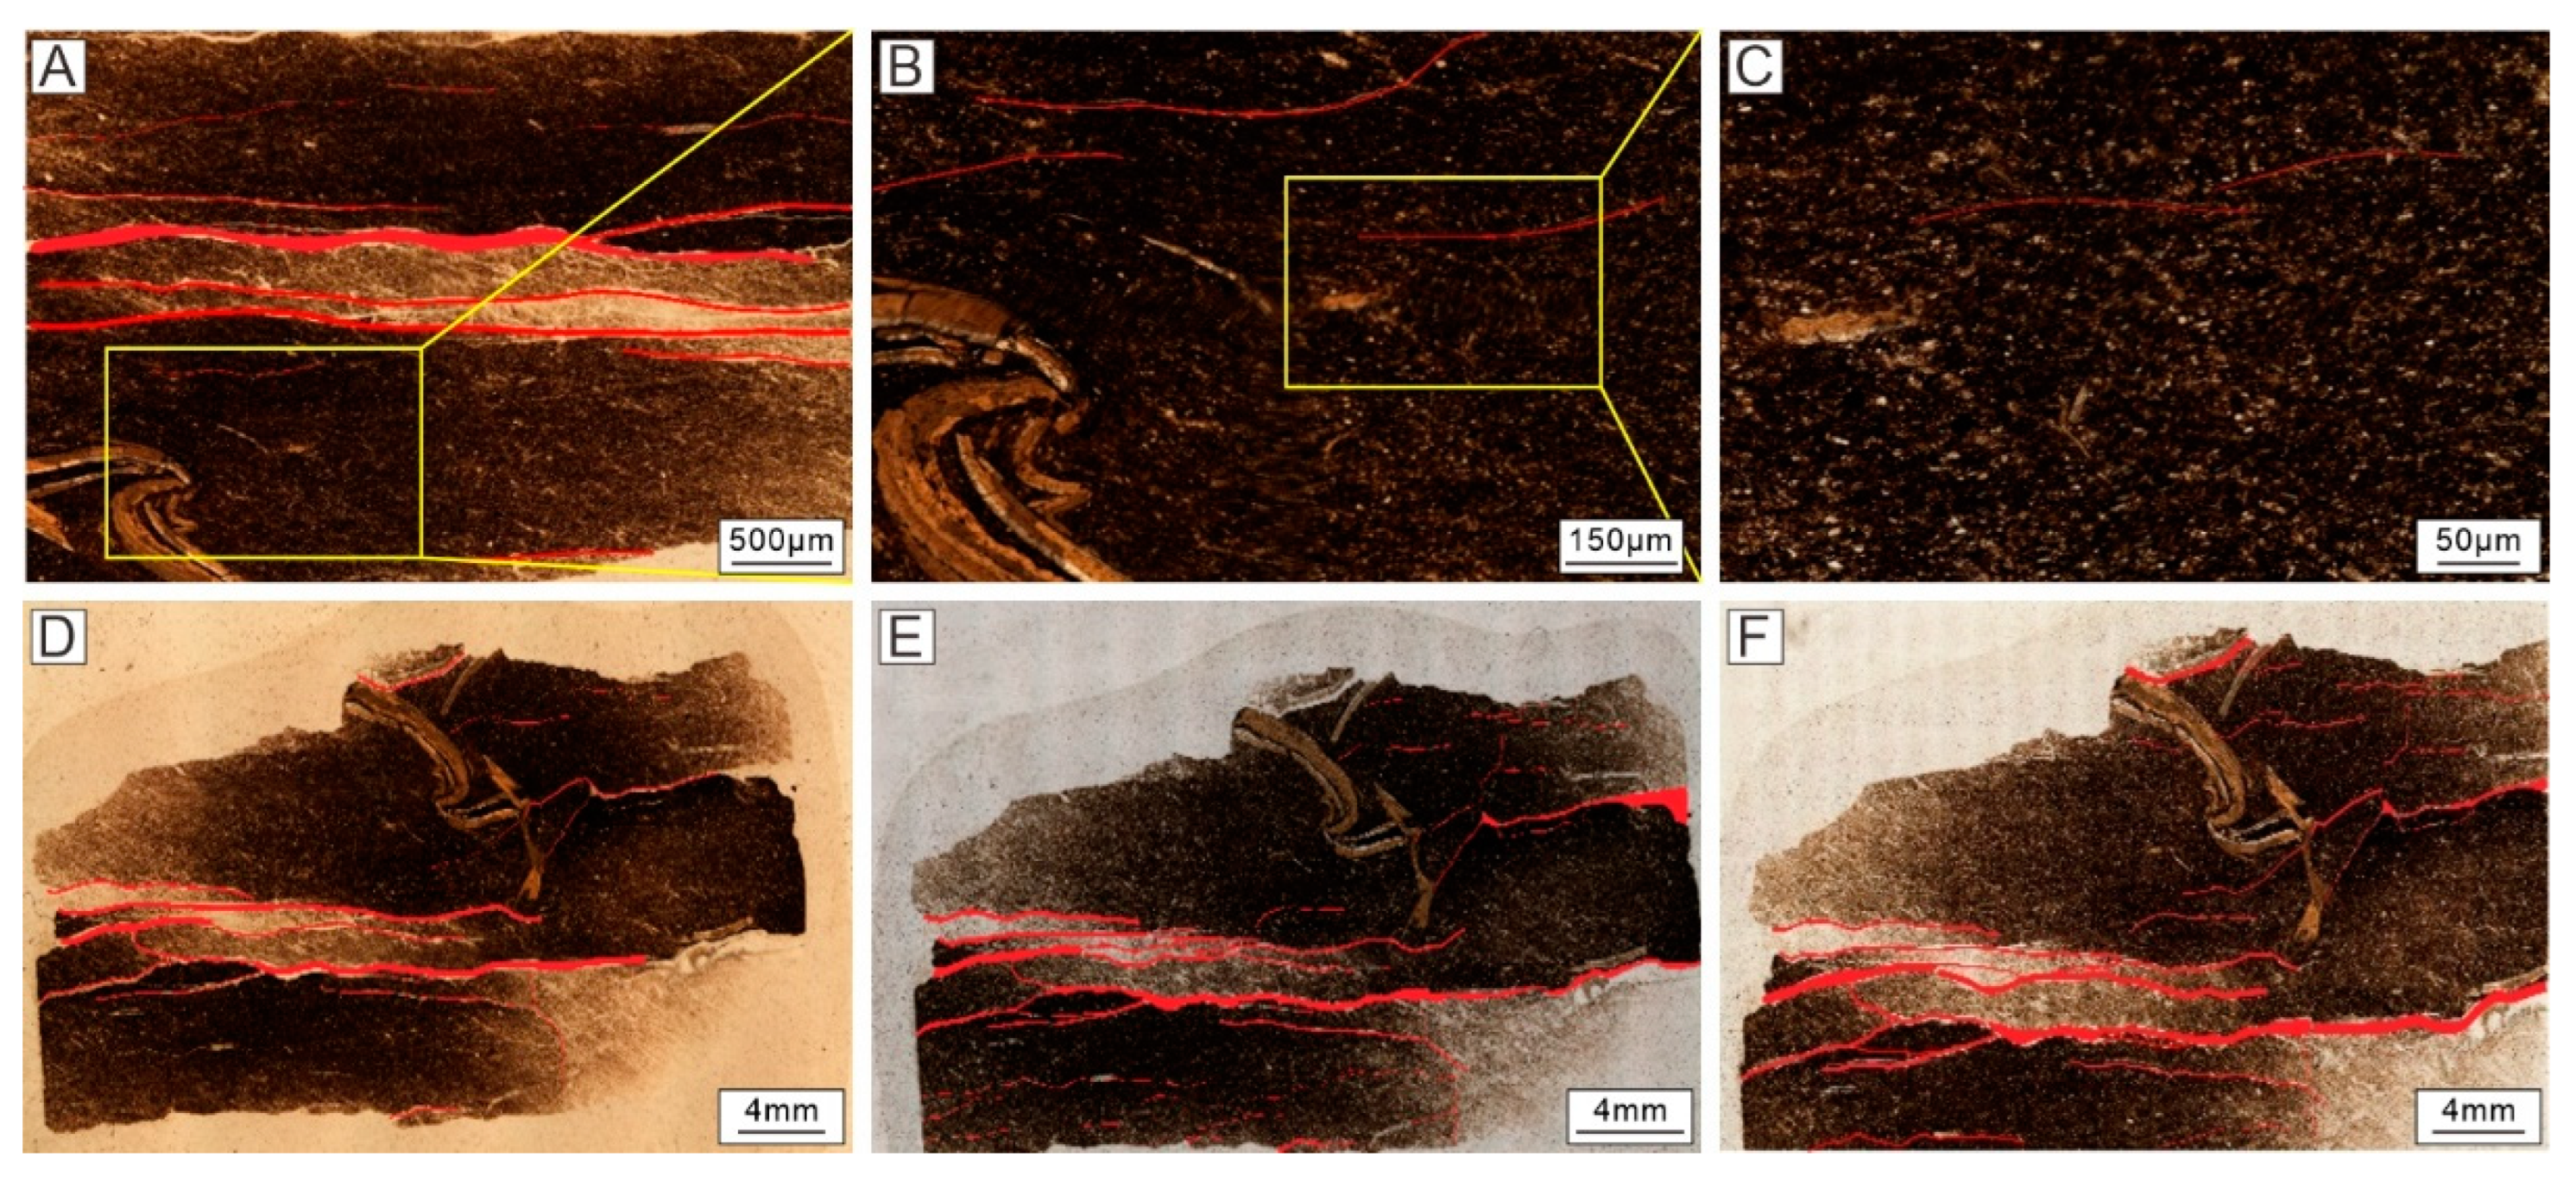
4.1. Morphology of Microfractures

Observations of RTSs of thirty-five shale samples directly provided the fracture shapes and occurrence characteristics of the J1z4 shale in the Yuanba area. The shale microfractures are principally dendritic, mesh-like, and hair-like (Figure 2). The microfractures are generally distributed along the bedding and are principally developed in shale samples with clear bedding. Some microfractures are also developed perpendicular to the bedding (Figure 2A,B,D,I) and even cut through the biological shells in the shale. A small number of microfractures also occur in some of the shell-bearing shale, but microfractures are rarely developed in the argillaceous siltstone and silty mudstone.
Based on the micro-CT scans of five shale samples, it was found that the microfractures are mostly straight and are occasionally bifurcated and step-like (Figure 3). The shale microfractures cut straight through the mineral matrix particles. The microfractures are nearly parallel to each other, extending along the bedding planes of the shale. In addition, the microfractures are dark gray on the images and have low densities, indicating that the microfractures are not filled and can supply space for shale gas accumulation and migration.
SEM can be used to identify micro- and nano-scale microfractures and can directly provide the morphology and filling status of microfractures. According to the SEM observations of thirty-five shale samples, the microfractures have curved fracture surfaces and are not filled. They often extend along the clay mineral plates and the edges of the brittle mineral particles, and they occasionally cut through the particles (Figure 4). Because isolated pores can be connected by microfractures, reservoir porosity and permeability are improved [50].
According to the formation mechanisms of microfractures, the origins of shale microfractures mainly include tectonic fractures, interlayer lamination fractures, layer slip fractures, and diagenetic contraction fractures [51]. The microfractures in the J1z4 shale samples observed in RTSs, micro-CT two-dimensional slices, and SEM images have relatively long lengths, extend along the bedding direction and perpendicular to the bedding direction, and cut the mineral grains, suggesting that these microfractures are mainly tectonic fractures.

4.2. Quantitative Evaluation of Shale Microfractures

The different magnifications or resolutions of these different methods results in their ability to identify microfractures of different scales. According to the observations and statistics using the 50× optical microscope, the microfractures identified via RTS observations are mainly micro-scale fractures, with widths of mainly 10–40 μm, followed by 50–100 μm (Figure 5A). The microfractures identified using micro-CT are mainly micro-scale fractures, with widths of mainly 2–10 μm (Figure 5B). The microfractures identified using SEM are nano- to micro-scale fractures, with widths of mainly 100–400 nm, followed by 400–1800 nm (Figure 5C).
The surface porosity of the microfractures in the J1z4 in the Yuanba area, obtained based on the quantitative statistics of the full-view of the RTS, ranges from 0.03% to 5.05% (averageof 0.82%; Figure 6A, Table S1). Specifically, the microfracture surface porosity of the shale in the western weak syncline is mostly less than 0.5%, with little variation. Because of the proximity to faults, the surface porosity of the microfractures in some of the shale samples from the central fault-fold belt reach 5%, and the microfracture development varies greatly. Compared to samples from the central fault-fold belt, the shale samples from the eastern fault-fold belt is further away from the faults, and the variation in the microfracture surface porosity is lower than that of the samples from the central fault-fold belt. The surface porosity of the shale microfractures obtained via micro-CT scanning ranges from 0.25% to 1.06% (average of 0.82%; Figure 6B, Table S2), which is basically consistent with the results obtained from the RTS analysis. The surface porosity of the nano-scale microfractures obtained via SEM ranges from 0.14% to 0.97% (average of 0.38%; Figure 6C, Table S1), with microfracture surface porosities of 0.21–0.53% for the samples from the western weak syncline belt, 0.14–0.97% for the shale samples from the central fault-fold belt, and 0.27–0.42% for the shale samples from the eastern fault-fold belt. In general, the microfractures in the shale samples collected from the western weak syncline belt are less developed, while the microfractures in the shale samples from the central and eastern fault-fold belts are more developed.

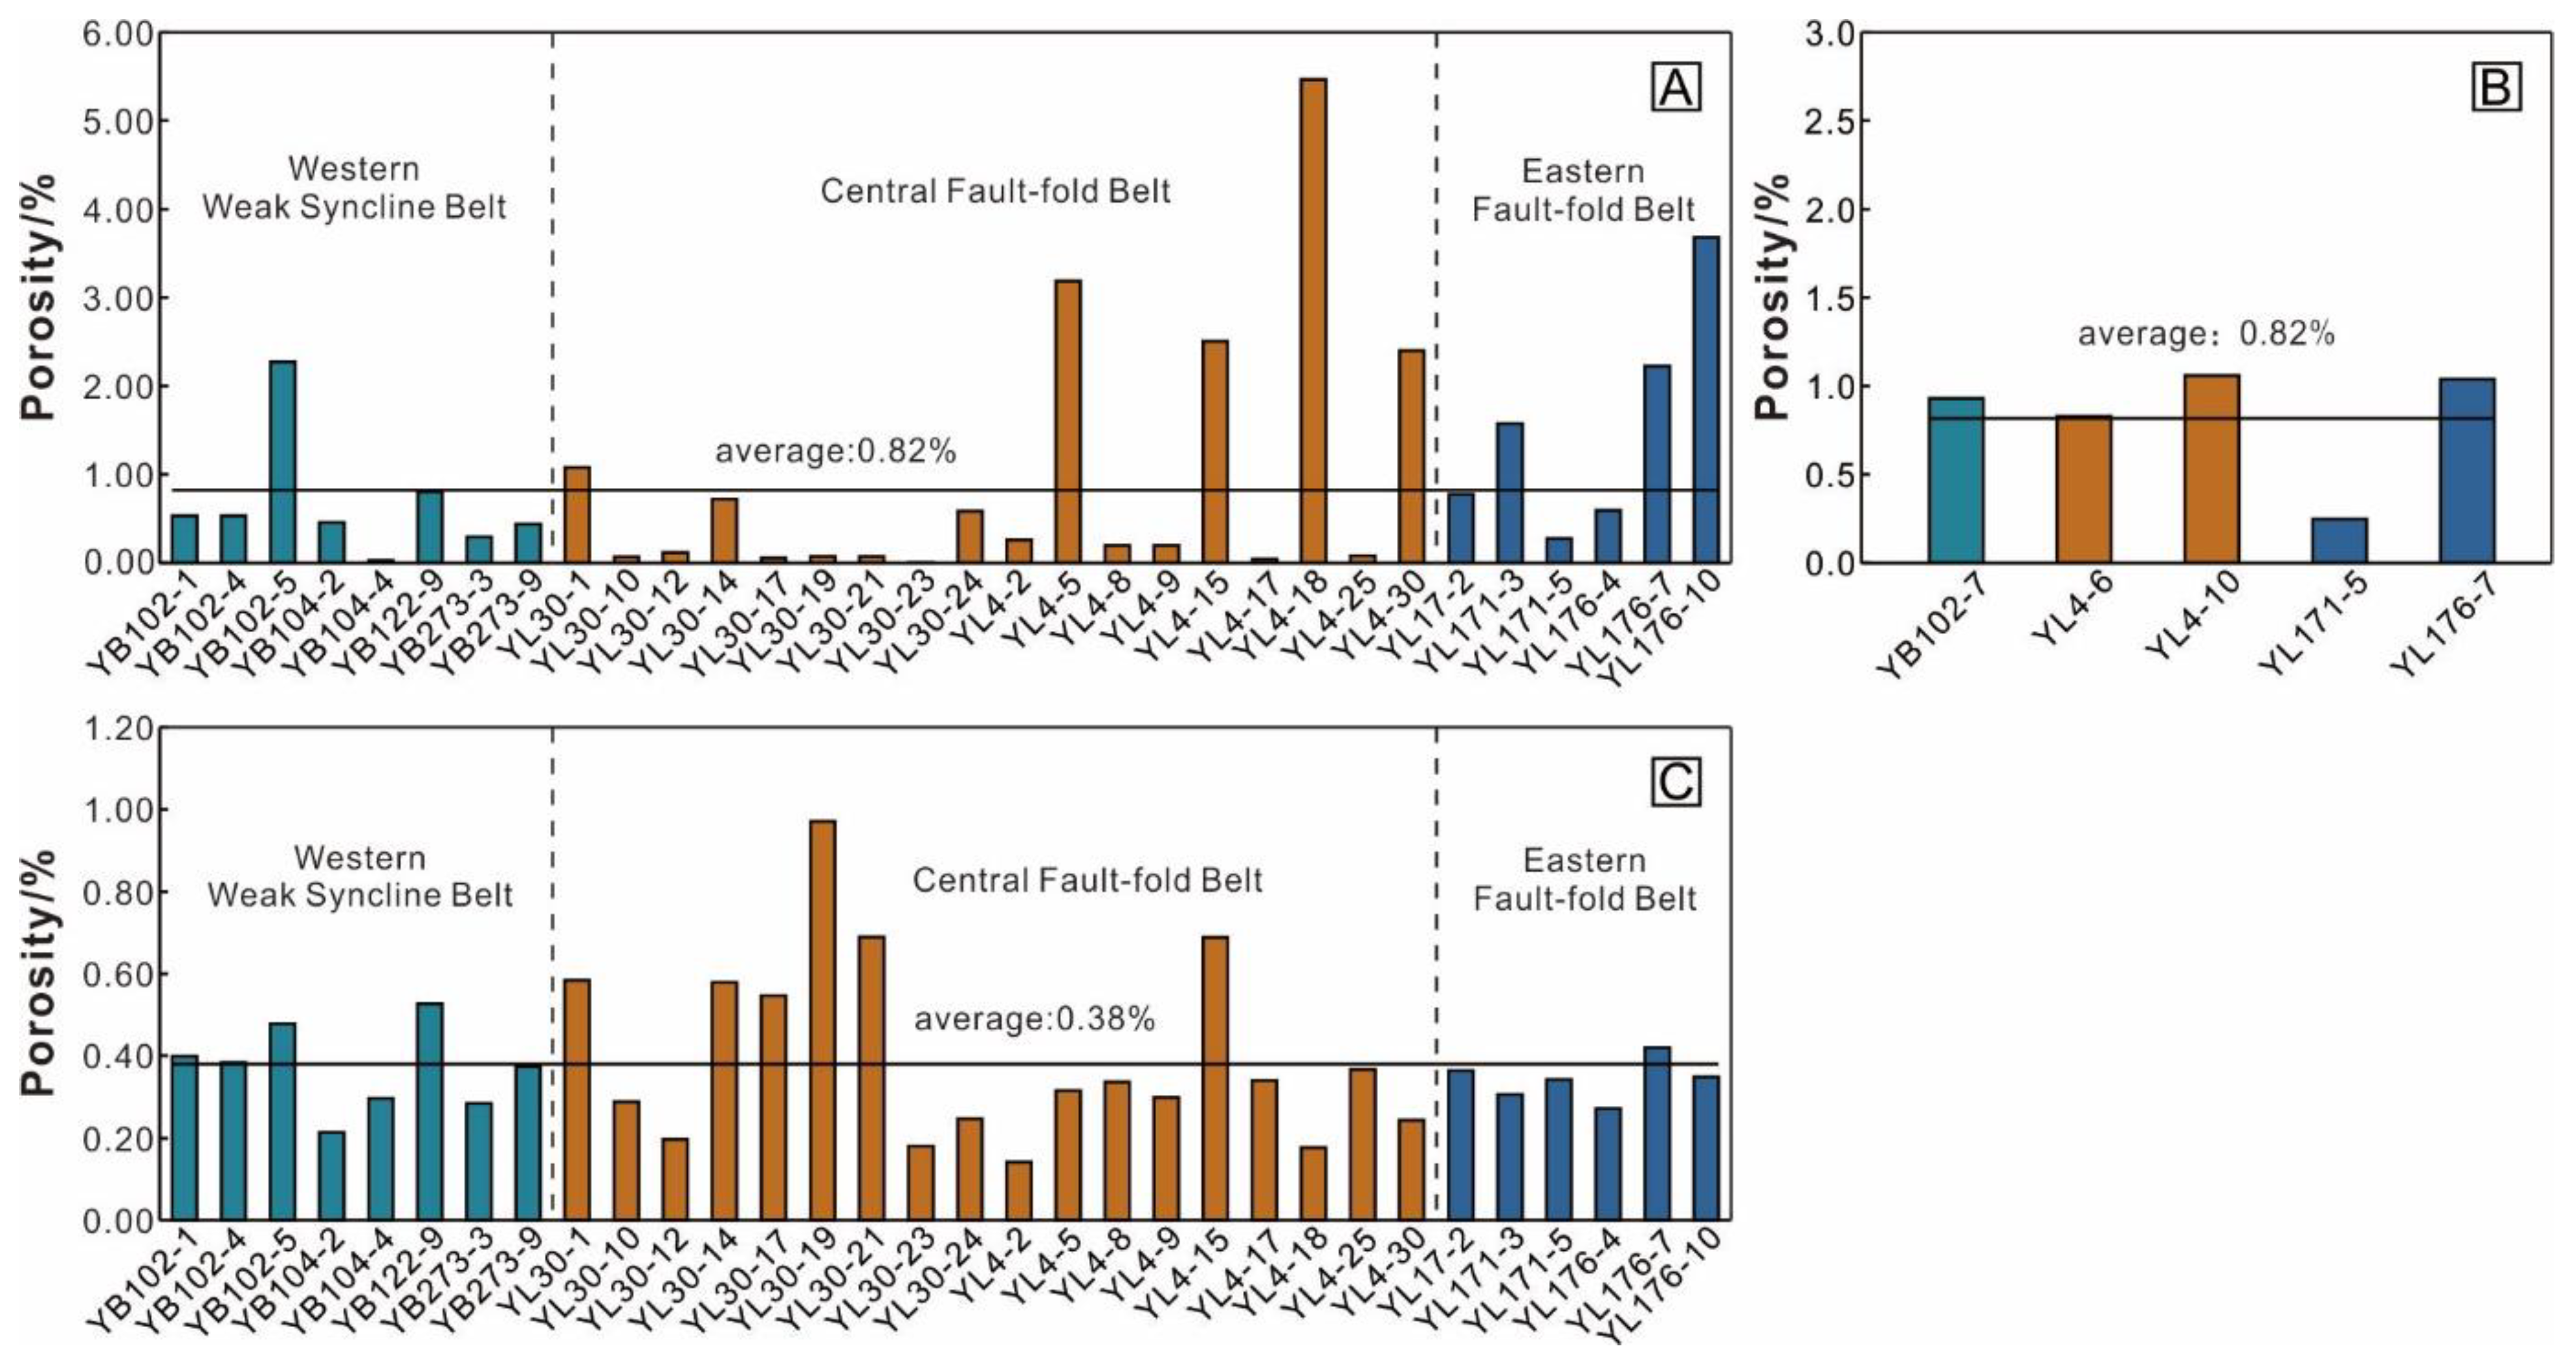
4.3. Total Porosity of Shale

The helium porosity test results show that the porosity of the J1z4 shale ranges from 1.69% to 7.37% (average of 4.17%; Figure 7A, Table S1). The porosities of the shales from the western weak syncline belt are 2.41–5.07% (average of 3.19%), the porosities of the samples from the central fault-fold belt are 2.44–7.37% (average of 4.88%), and the porosities of the samples from the eastern fault-fold belt are 1.69–5.00% (average of 3.36%). The shale porosities obtained via micro-CT are 1.27–2.46% (average of 1.76%), which are lower than the helium porosity test results (Figure 7B, Table S2). Overall, the porosities of the shale samples from the central fault-fold belt are higher than those from the western weak syncline belt.

5. Discussion

5.1. Performance of Comprehensive Quantitative Characterization of Shale Microfractures via RTS and SEM Observations

According to the widths of the microfractures, the scales of microfractures in shale can be divided into microfractures and nano-fractures [52]. Analytical techniques such as RTS observations, micro-CT analysis, and SEM have their own resolution ranges. Similar to the fact that pores of different scales in shale need to be characterized through comprehensive utilization of the CO2 adsorption, N2 adsorption, and high-pressure mercury intrusion techniques [53,54,55], the quantitative characterization of microfractures of different scales in shale requires the combined use of different analysis techniques. Full-scale quantitative characterization of microfractures, such as a combination of nuclear magnetic resonance and micro-CT analysis to obtain the microfractures of different scales in rocks, has been reported, but only microfractures with a fracture width greater than 50 μm can be characterized using previously reported methods [56]. The combination of field emission SEM, gas adsorption, micro-CT, and nano-CT analyses achieves full-scale characterization of pores and microfractures [43]. Based on previous studies, we propose a new method that combines RTS and SEM observations to quantitatively characterize the microfractures in shale at all scales. In this method, RTS observations are used to characterize micron-scale fractures, and SEM is mainly used to characterize nano-scale fractures.
Fracture identification using the RTS method depends on the magnification of the optical microscope. The minimum widths of microfractures that can be identified in RTSs vary. The minimum fracture widths that can be identified at magnifications of 20×, 50×, and 100× are about 10 μm, 5 μm, and 2–3 μm, respectively (Figure 8A–C). The higher the magnification, the greater the scale and the number of the fractures that can be identified, and the more accurate the surface porosity of the fractures will be. However, the higher the magnification is, the greater the number of micro-images that need to be stitched together to obtain a full-view image of the RTS, which consumes more time. If a magnification of 20× requires stitching 25 images, then magnifications of 50× and 100× require stitching 100 and 400 images, respectively. In order to choose appropriate magnifications for microfracture identification and quantitative characterization of RTSs, the same RTSs were observed at 20×, 50×, and 100×, and the surface porosities of the fractures obtained were 3.39%, 5.28%, and 5.86%, respectively (Figure 8D–F). The surface porosities of the fractures for magnifications of 20× and 50× were 57.91% and 90.18% that obtained at 100×, respectively. Thus, the microfractures of most RTSs can be identified using a 50× magnification, and it takes less time to obtain a full-view RTS image. The maximum resolution of the SEM used in this study was 4–5 nm, while the widths of the nano-scale fractures in the J1z4 shale were mostly between 100 and 400 nm, i.e., greater than the minimum microfracture width that the SEM could identify, indicating that the SEM could completely and effectively characterize the nano-scale fractures of the J1z4 shale.
The fractures that can be identified using the RTS observations, CT scanning, and SEM have different width ranges. The widths of the fractures identified using RTS observations, CT scanning, and SEM were mostly 10–40 μm, 2–10 μm, and 100–400 nm, respectively (Figure 5). The widths of the microfractures measured using the RTS observation and the micro-CT techniques basically overlapped. The microfractures with widths of less than 10 μm that could be identified via RTS observation could be identified via SEM. However, the ordinary micro-CT analysis was unable to identify the nano-scale microfractures. As a result, the surface porosity of the microfractures was underestimated compared to those measured using RTS observation and SEM techniques (Figure 9, Tables S1 and S2). Therefore, a combination of RTS observations and SEM was used to comprehensively and quantitatively characterize the microfractures in the shale. The RTS observations were mainly used to identify the microfractures with widths of greater than 10 μm, and SEM was mainly used to identify the microfractures with widths of less than 10 μm. If the SEM recognized a fracture wider than 10 μm, the surface porosity was not counted in order to avoid overlap with the results of the RTS observations. In summary, RTS observations were mainly used to identify the meso-scale microfractures, and SEM was mainly used to identify the microscale-scale microfractures. The combination of these two techniques achieved the comprehensive and quantitative characterization of the shale microfractures of different scales.

5.2. Differences and Causes of Percentage of Microfracture Porosity to Total Porosity

Using RTS observation and SEM techniques, it was found that the surface porosities of the microfractures in the Yuanba area are 0.18–5.23% (average of 1.20%). Based on the helium porosity measurements of the samples, the percentage of microfractures to total porosity is 5% to 75% (average of 21.09%; Figure 9A, Table S1). The microfractures in the shales collected from the different tectonic belts make considerably different percentage to the total porosity. The percentage of fractures in the shale from the western weak syncline is about 10%, while the percentage of microfractures in some samples (e.g., YL4-5, YL4-18, and YL176-10) from the central fault-fold belt and the eastern fault-fold belt exceed 30% to 50%. These differences may be related to the relatively strong tectonic deformation of the central and eastern fold belts, which has led to more developed microfractures with tectonic origin. This is consistent with the relatively straight or mesh-like microfractures with a tectonic origin (Figure 2, Figure 3 and Figure 4) identified via RTS observation, micro-CT, and SEM techniques.
Tectonic stress is one of the key factors leading to the development of tectonic microfractures. When the stress is greater than the limit the rocks can withstand, the rocks rupture and microfractures are formed [9,57,58]. These microfractures are relatively well developed in areas where the tectonic stress is large and concentrated [58]. Microfracture development and curvature increase with increasing strata deformation. The microfractures in samples from some wells in the Yuanba area are significantly highly developed. It is speculated that this is directly related to the tectonic deformation of the strata in these wells. For example, wells YB102, YB104, YB122, and YB273 are located in the western syncline belt, which has relatively good tectonic stability and is located away from faults (Figure 10), so the microfractures in the shale samples from these wells are relatively underdeveloped, and the percentage of the microfracture porosity to the total porosity is 15% to 30% (Figure 9A). Well YL4 is located near the central fault-fold belt, the microfractures in the shale samples from this well (samples YL4-5, YL4-15, YL4-18, and YL4-30) are more developed, and the percentage of the microfracture porosity to the total porosity is as high as 70%. Wells YL171, YL17, and YL176 are located in the eastern fault-fold belt, the microfractures in the samples from well YL176 are more developed, and the percentage of the microfracture porosity to the total porosity ranges from 30% to 50% (Figure 9 and Figure 10, Table S1). It was also found that the fracture development and the percentage of microfracture porosity to the total porosity are significantly positive correlated with the structural deformation. They are higher in the areas with greater tectonic deformation and are lower in the more stable areas, but the percentage of the microfracture porosity to the total porosity is no more than 50% in most of these areas, indicating that the J1z4 shale reservoir space is dominated by pores and has the condition for stable shale gas production and potential of shale gas exploration in the stable tectonic area.

5.3. Shale Gas Enrichment and Favorable Exploration Area

Shale hydrocarbon-generating conditions, reservoir conditions, and preservation conditions are the main determinants of the gas-bearing properties of shale [59,60]. High-quality shale is the material foundation for shale gas enrichment, and microfracture development is the foundation of a high shale gas yield [61]. The completeness of the cover layer (far away from faults) is the basis for shale gas accumulation. Shale gas production is only high and stable in areas where the quantity of hydrocarbons is large and the tectonic deformation is weak.
The thickness of the J1z4 shale ranges from 30 to 70 m, and the total organic carbon (TOC) content ranges from 0.64% to 1.30% in Yuanba area. The TOC and shale thickness are obviously controlled by the depositional conditions. The sedimentation and subsidence centers are located in the central of Sichuan. From central Sichuan to northern Sichuan, the strata are semi-deep lacustrine deposits, shallow lacustrine deposits, shore lacustrine deposits, and delta deposits. The thickness of the J1z4 shale gradually decreases from south to north (Figure 10), and the TOC content also gradually decreases from south to north in the Yuanba area. Therefore, the conditions of hydrocarbons generation in the shale are better in the southern part. The reservoir volume mainly consists of inorganic pores, as well as a small proportion of organic pores [26,62]. In addition, microfractures are well developed in the Yuanba area. Shale has the characteristics of low porosity and low permeability, and most of the pores are isolated pores, which is not conducive to the migration and accumulation of oil and gas. Shale is a good source rock, due to the pressurization of organic matter and tectonic activity, a large number of microfractures are formed inside the shale, which effectively communicates isolated pores and serves as a favorable channel for oil and gas to migrate. Microfractures help to increase the volume of free natural gas in shale, can effectively connect the inorganic pores within shale, improve the shale’s permeability, and provide reservoirs for free shale gas [63], conducive to increased oil and gas production [64]. Therefore, favorable tectonic deformation conditions can increase the microfractures in shale and improve the reservoir performance of shale. However, near a fault-fold belt with strong tectonic deformation, shale microfractures develop abnormally, destroying the preservation conditions of the shale gas and leading to escape of the shale gas [65,66]. For example, wells YL30, YL31, YB9, and YL176 are located near a fault and are all low-yield wells; while wells YB21, YB101, YB102, YB11, and YB5 are located in weakly deformed areas that are far from faults and are all high-yield wells [27]. The tight shell limestone at the top of the J1z4 and the thick shale of the Qianfoya Formation overlying serve as the direct caprocks of the J1z4 shale in the Yuanba area. Considering factors such as the shale thickness, hydrocarbon generation intensity, fault development, microfracture development, and preservation conditions, the favorable shale gas enrichment areas of the J1z4 are the weak tectonic deformation areas far away from faults in the central-southern part of the western syncline and the southwestern part of the eastern fault-fold belt (Figure 10).

6. Conclusions

(1)
The widths of the microfractures identified using the RTS observation, CT scanning, and SEM techniques are mainly 10–40 μm, 2–10 μm, and 100–400 nm, respectively. The combination of the RTS observation and SEM techniques can be used to comprehensively and quantitatively characterize the microfractures of different scales in shale.
(2)
The RTS observations mainly identify fractures with widths greater than 10 μm, while SEM mainly identifies fractures with widths of less than 10 μm. Based on the combined characterization method of RTS observations and SEM, we found that the microfractures in the J1z4 in the Yuanba area account for 21.09% of the total porosity, indicating that the shale in the Yuanba area is dominated by pore-type reservoirs and has the potential to yield stable shale gas production.
(3)
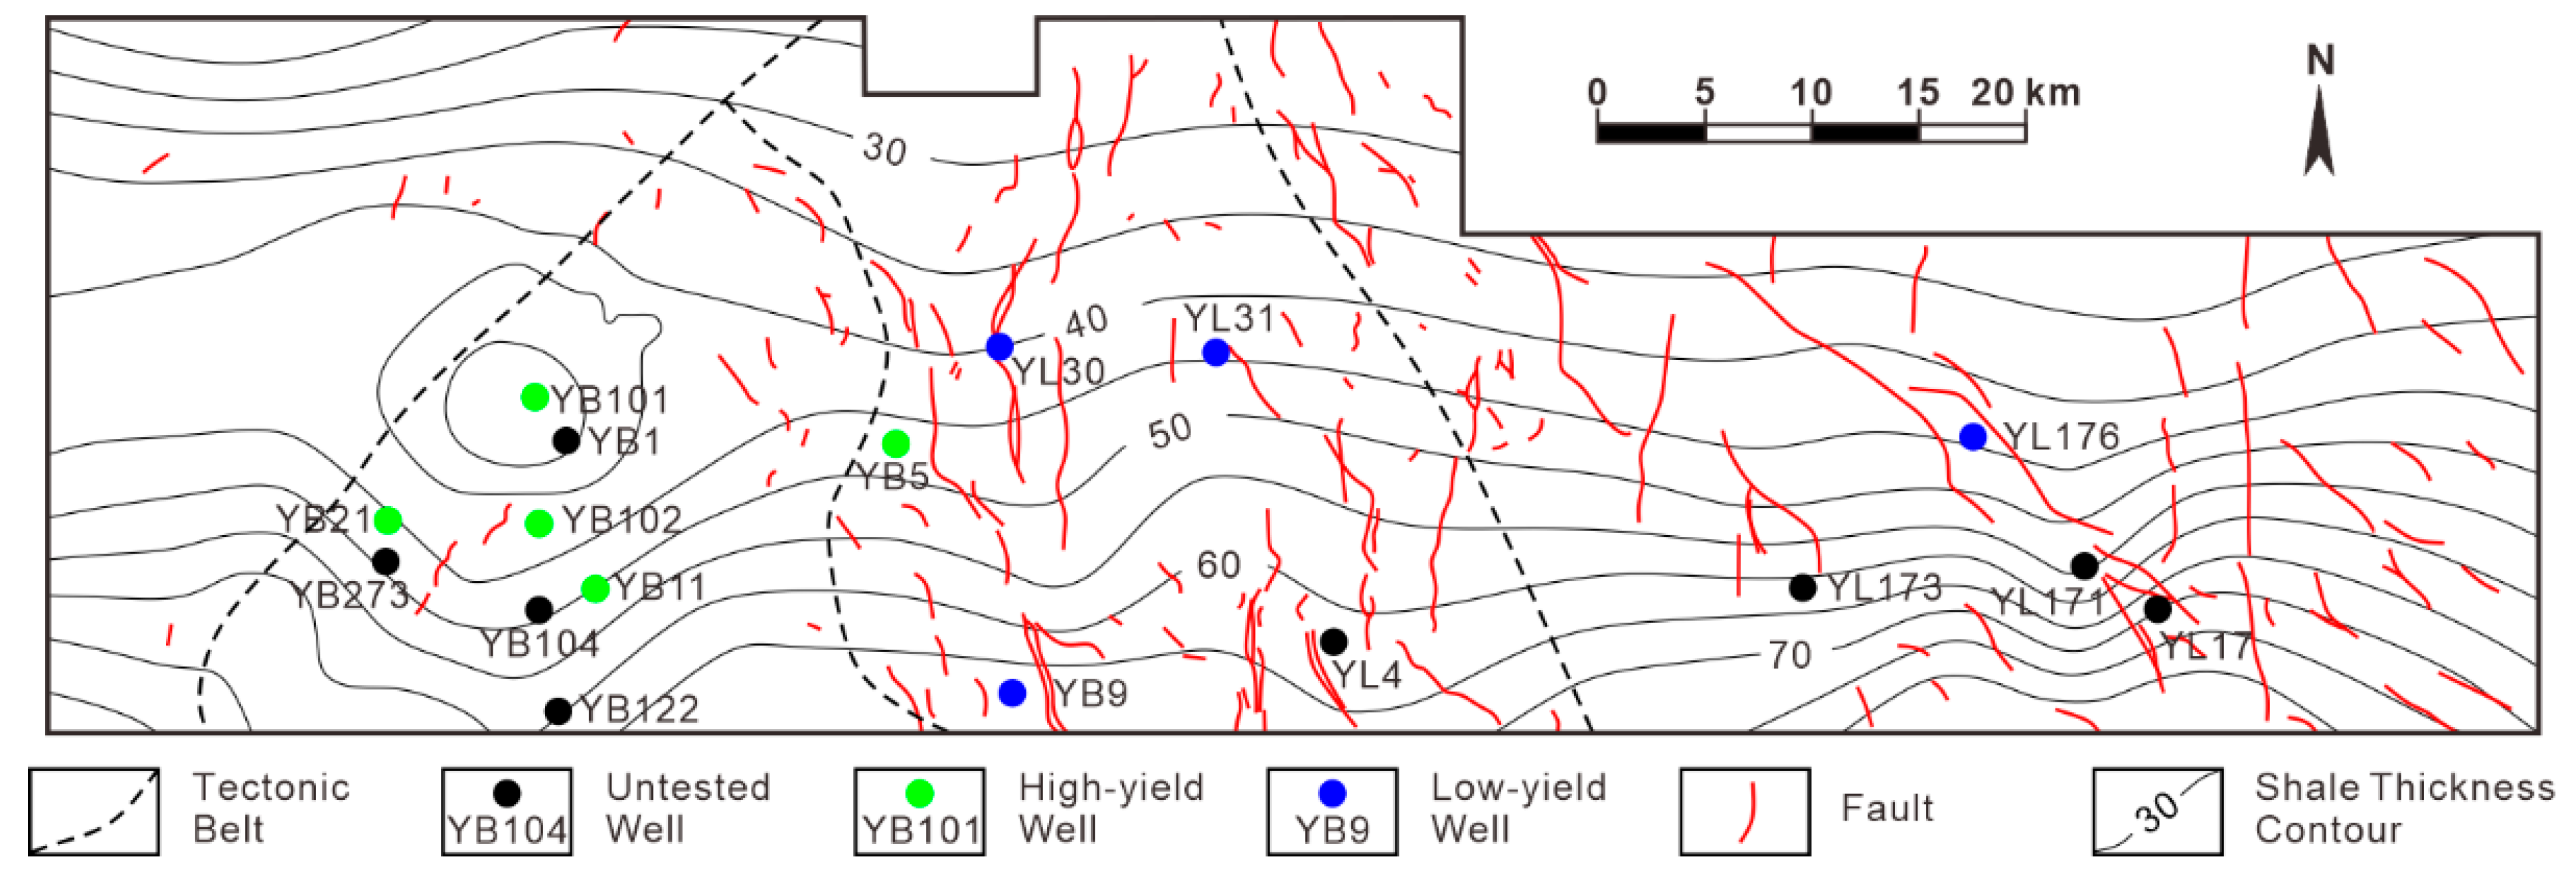
Some of the shales adjacent to faults and fold belts have relatively well developed microfractures, resulting in the percentage of microfracture porosity to the total porosity approaching or exceeding 50%, which may lead to the loss of shale gas. The weak tectonic deformation areas in the central–southern part of the western weak syncline belt and the southwestern part of the eastern fault-fold belt in the Yuanba area are the favorable enrichment areas for shale gas in the J1z4.

Supplementary Materials

The following supporting information can be downloaded at: https://www.mdpi.com/article/10.3390/en16155685/s1, Table S1: Surface Porosity of SEM and RTS and the percentage of the total surface porosity of the microfractures to the total porosity. Table S2: Surface Porosity of micro-CT scanning and the percentage of the total surface porosity of the microfractures to the total porosity.

Author Contributions

Conceptualization, P.L.; Methodology, P.L.; Investigation, Q.L.; Resources, L.L.; Writing—original draft, P.L. and Q.L.; Supervision, H.Z.; Funding acquisition, H.Z. All authors have read and agreed to the published version of the manuscript.

Funding

This study was supported by the Strategic Priority Research Program of the Chinese Academy of Sciences (XDA14010306).

Data Availability Statement

Not applicable.

Acknowledgments

We acknowledge SINOPEC Exploration Company for providing shale samples. We thank the three anonymous reviewers for their valuable comments, which further enhanced the quality of this paper.

Conflicts of Interest

The authors declare no conflict of interest.

References

  1. Anders, M.H.; Laubach, S.E.; Scholz, C.H. Microfractures: A review. J. Struct. Geol. 2014, 69, 377–394. [Google Scholar]
  2. Gale, J.F.W.; Laubach, S.E.; Olson, J.E.; Eichhuble, P.; Fall, A. Natural fractures in shale: A review and new observations. AAPG Bull. 2014, 98, 2165–2216. [Google Scholar] [CrossRef]
  3. Slatt, R.M.; O’Brien, N.R. Pore types in the Barnett and Woodford gas shales: Contribution to understanding gas storage and migration pathways in fine-grained rocks. AAPG Bull. 2011, 95, 2017–2030. [Google Scholar] [CrossRef]
  4. Clarkson, C.R.; Haghshenas, B.; Ghanizadeh, A.; Qanbari, F.; Williams-Kovacs, J.D.; Riazi, N.; Debuhr, C.; Deglint, H.J. Nanopores to megafractures: Current challenges and methods for shale gas reservoir and hydraulic fracture characterization. J. Nat. Gas Sci. Eng. 2016, 31, 612–657. [Google Scholar] [CrossRef]
  5. Zhang, C.; Liu, D.D.; Jiang, Z.X.; Song, Y.; Luo, Q.; Wang, X. Mechanism for the formation of natural fractures and their effects on shale oil accumulation in Junggar Basin, NW China. Int. J. Coal Geol. 2022, 254, 103973. [Google Scholar] [CrossRef]
  6. Zhang, X.J.; He, J.H.; Deng, H.C.; Fu, M.Y.; Xiang, Z.H.; Peng, X.F.; Gluyas, J.G.; Li, R.X. Controls of interlayers on the development and distribution of natural fractures in lacustrine shale reservoirs: A case study of the Da’anzhai member in the Fuling area in the eastern Sichuan Basin. J. Pet. Sci. Eng. 2022, 208, 109224. [Google Scholar] [CrossRef]
  7. Gou, Q.Y.; Xu, S.; Hao, F.; Yang, F.; Zhang, B.Q.; Shu, Z.G.; Zhang, A.H.; Wang, Y.X.; Lu, Y.B.; Cheng, X.; et al. Full-scale pores and micro-fractures characterization using FE-SEM, gas adsorption, nano-CT and micro-CT: A case study of the Silurian Longmaxi Formation shale in the Fuling area, Sichuan Basin, China. Fuel 2019, 253, 167–179. [Google Scholar] [CrossRef]
  8. Li, W.H.; Ying, J.F.; Huang, Y.R.; Wang, M. Quantitative characterization of microfractures in the Cretaceous tight reservoirs from the Liuhe Basin. Energy Rep. 2021, 7, 5795–5803. [Google Scholar] [CrossRef]
  9. Ougier-Simonin, A.; Renard, F.; Boehm, C.; Vidal-Gilbert, S. Microfracturing and microporosity in shales. Earth-Sci. Rev. 2016, 162, 198–226. [Google Scholar] [CrossRef] [Green Version]
  10. Yang, F.; Ning, Z.F.; Wang, Q.; Zhang, R.; Krooss, B.M. Pore structure characteristics of lower Silurian shales in the southern Sichuan Basin, China: Insights to pore development and gas storage mechanism. Int. J. Coal Geol. 2016, 156, 12–24. [Google Scholar] [CrossRef]
  11. Yuan, Y.; Zhao, J.Z.; Er, C.; Wang, R.; Wei, Z.K.; Shen, W.X. Study on types and features of the pore in Mesozoic and Upper Palaeozoic shales in Ordos Basin. J. Xi’an Shiyou Univ. (Nat. Sci. Ed.) 2014, 29, 14–19. (In Chinese) [Google Scholar]
  12. Vega, B.; Ross, C.M.; Kovscek, A.R. Imaging-based characterization of calcite-filled fractures and porosity in shales. SPE J. 2015, 20, 810–823. [Google Scholar] [CrossRef]
  13. Loucks, R.G.; Reeds, R.M.; Willis, J.J.; Willis, K.M.; Cantin, J.J.R. Scanning-electron-microscope petrographic evidence for distinguishing organic matter pores associated with depositional organic matter versus migrated organic matter in mudrocks. GCAGS J. 2014, 3, 51–60. [Google Scholar]
  14. Tiwari, P.; Deo, M.; Lin, C.L.; Miller, J.D. Characterization of oil shale pore structure before and after pyrolysis by using X-ray micro CT. Fuel 2013, 107, 547–554. [Google Scholar] [CrossRef]
  15. Ramandi, H.L.; Mostaghimi, P.; Armstrong, R.T.; Saadatfar, M.; Pinczewski, W.V. Porosity and permeability characterization of coal—A micro-computed tomography study. Int. J. Coal Geol. 2016, 154, 57–68. [Google Scholar] [CrossRef]
  16. Jiang, S.; Xu, Z.Y.; Feng, Y.L.; Zhang, J.C.; Cai, D.S.; Chen, L.; Wu, Y.; Zhou, D.S.; Bao, S.J.; Long, S.X. Geologic characteristics of hydrocarbon-bearing marine, transitional and lacustrine shales in China. J. Asian Earth Sci. 2016, 115, 404–418. [Google Scholar] [CrossRef]
  17. Jiang, S.; Peng, Y.M.; Gao, B.; Zhang, J.C.; Cai, D.S.; Xue, G.; Bao, S.J.; Xu, Z.Y.; Tang, X.L.; Dahdah, N. Geology and shale gas resource potentials in the Sichuan Basin, China. Energy Explor. Exploit. 2016, 34, 689–710. [Google Scholar] [CrossRef] [Green Version]
  18. Potter, C.J. Paleozoic shale gas resources in the Sichuan Basin, China. AAPG Bull. 2018, 102, 987–1009. [Google Scholar] [CrossRef]
  19. Ma, X.H.; Xie, J.; Yong, R.; Zhu, Y.Q. Geological characteristics and high production control factors of shale gas reservoirs in Silurian Longmaxi Formation, southern Sichuan Basin, SW China. Pet. Explor. Dev. 2020, 47, 901–915. [Google Scholar] [CrossRef]
  20. Li, Y.J.; Feng, Y.Y.; Liu, H.; Zhang, L.H.; Zhao, S.X. Geological characteristics and resource potential of lacustrine shale gas in the Sichuan Basin, SW China. Pet. Explor. Dev. 2013, 40, 454–460. [Google Scholar] [CrossRef]
  21. Wang, X.Y.; Jin, Z.K.; Zhao, J.H.; Zhu, Y.X.; Hu, Z.Q.; Liu, G.X.; Jiang, T.; Wang, H.; Li, S.; Shi, S.T. Depositional environment and organic matter accumulation of Lower Jurassic nonmarine fine-grained deposits in the Yuanba Area, Sichuan Basin, SW China. Mar. Pet. Geol. 2020, 116, 104352. [Google Scholar] [CrossRef]
  22. Fathy, D.; Wagreich, M.; Fathi, E.; Ahmed, M.S.; Leila, M.; Sami, M. Maastrichtian Anoxia and Its Influence on Organic Matter and Trace Metal Patterns in the Southern Tethys Realm of Egypt during Greenhouse Variability. ACS Omega 2023, 8, 19603–19612. [Google Scholar] [CrossRef] [PubMed]
  23. Fishman, N.S.; Hackley, P.C.; Lowers, H.A.; Hill, R.J.; Egenhoff, S.O.; Eberl, D.D.; Blum, A.E. The nature of porosity in organic-rich mudstones of the Upper Jurassic Kimmeridge Clay Formation, North Sea, offshore United Kingdom. Int. J. Coal Geol. 2012, 103, 32–50. [Google Scholar] [CrossRef]
  24. Tang, X.; Zhang, J.C.; Wang, X.Z.; Yu, B.S.; Ding, W.L.; Xiong, J.Y.; Yang, Y.T.; Wang, L.; Yang, C. Shale characteristics in the southeastern Ordos Basin, China: Implications for hydrocarbon accumulation conditions and the potential of continental shales. Int. J. Coal Geol. 2014, 128–129, 32–46. [Google Scholar] [CrossRef]
  25. Xu, Q.; Liu, B.; Ma, Y.; Song, X.; Wang, Y.; Chen, Z. Geological and geochemical characterization of lacustrine shale: A case study of the Jurassic Da’anzhai member shale in the central Sichuan Basin, southwest China. J. Nat. Gas Sci. Eng. 2017, 47, 124–139. [Google Scholar] [CrossRef]
  26. Chen, L.; Jiang, Z.X.; Liu, Q.X.; Jiang, S.; Liu, K.Y.; Tan, J.Q.; Gao, F.L. Mechanism of shale gas occurrence: Insights from comparative study on pore structures of marine and lacustrine shales. Mar. Pet. Geol. 2019, 104, 200–216. [Google Scholar] [CrossRef]
  27. Zhou, D.H.; Jiao, F.Z.; Guo, X.S.; Guo, T.L.; Wei, Z.H. Geologic analysis of Middle-Lower Jurassic shale reservoirs in Yuanba area, northeastern Sichuan Basin. Pet. Geol. Exp. 2013, 35, 596–600, 656, (In Chinese with English Abstract). [Google Scholar]
  28. Li, L.; Li, P.P.; Zhang, Z.C.; Hao, J.Y.; Xiao, J.L.; Zou, H.Y. Quantitative characterization of microscopic pore structure of shale in Da’anzhai Member in Yuanba area, northern Sichuan Basin. Sci. Technol. Eng. 2020, 20, 8923–8932, (In Chinese with English Abstract). [Google Scholar]
  29. Zhou, D.H.; Sun, C.X.; Liu, Z.B.; Nie, H.K. Geological characteristics of continental shale gas reservoir in the Jurassic Da’anzhai member in the northeastern Sichuan Basin. China Pet. Explor. 2020, 25, 32–42, (In Chinese with English Abstract). [Google Scholar]
  30. Li, P.P.; Hao, F.; Guo, X.S.; Zou, H.Y.; Yu, X.Y.; Wang, G.W. Processes involved in the origin and accumulation of hydrocarbon gases in the Yuanba gas field, Sichuan Basin, Southwest China. Mar. Pet. Geol. 2015, 59, 150–165. [Google Scholar] [CrossRef]
  31. Liu, Z.B.; Liu, G.X.; Hu, Z.Q.; Feng, D.J.; Zhu, T.; Bian, R.K.; Jiang, T.; Jin, Z.G. Lithofacies types and assemblage features of continental shale strata and their implications for shale gas exploration: A case study of the Middle and Lower Jurassic strata in the Sichuan Basin. Nat. Gas Ind. B 2020, 7, 358–369. [Google Scholar] [CrossRef]
  32. Yang, R.; He, S.; Li, T.Y.; Yang, X.Y.; Hu, Q.H. Origin of over-pressure in clastic rocks in Yuanba area, northeast Sichuan Basin, China. J. Nat. Gas Sci. Eng. 2016, 30, 90–105. [Google Scholar] [CrossRef]
  33. Li, Q.W.; Liu, Z.B.; Chen, F.R.; Liu, G.X.; Zhang, D.W.; Li, P.; Wang, P.F. Geochemical Characteristics and Organic Matter Provenance of Shale in the Jurassic Da’anzhai Member, Northeastern Sichuan Basin. Front. Earth Sci. 2022, 10, 860477. [Google Scholar] [CrossRef]
  34. Zheng, R.C.; Guo, C.L.; Liang, X.W.; Chang, H.L.; Lu, B.X. Characteristics and evaluation of reservoir spaces of shale gas (oil) in Da’anzhai member of Ziliujing Formation in Sichuan Basin. Lithol. Reserv. 2016, 28, 16–29, (In Chinese with English Abstract). [Google Scholar]
  35. Lai, J.; Li, D.; Wang, G.; Xiao, C.W.; Hao, X.L.; Luo, Q.Y.; Lai, L.B.; Qin, Z.Q. Earth stress and reservoir quality evaluation in high and steep structure: The Lower Cretaceous in the Kuqa Depression, Tarim Basin, China. Mar. Pet. Geol. 2019, 101, 43–54. [Google Scholar] [CrossRef]
  36. Zeng, L.B.; Jiang, J.W.; Yang, Y.L. Fractures in the low porosity and ultra-low permeability glutenite reservoirs: A case study of the late Eocene Hetaoyuan formation in the Anpeng oilfield, Nanxiang Basin, China. Mar. Pet. Geol. 2010, 27, 1642–1650. [Google Scholar] [CrossRef]
  37. Tang, X.L.; Jiang, Z.X.; Jiang, S.; Li, Z. Heterogeneous nanoporosity of the Silurian Longmaxi Formation shale gas reservoir in the Sichuan Basin using the QEMSCAN, FIB-SEM, and nano-CT methods. Mar. Pet. Geol. 2016, 78, 99–109. [Google Scholar] [CrossRef]
  38. Yang, F.; Ning, Z.; Wang, Q.; Liu, H. Pore structure of Cambrian shales from the Sichuan Basin in China and implications to gas storage. Mar. Pet. Geol. 2016, 70, 14–26. [Google Scholar] [CrossRef]
  39. Wang, P.F.; Jiang, Z.X.; Yin, L.S.; Chen, L.; Li, Z.; Zhang, C.; Li, T.W.; Huang, P. Lithofacies classification and its effect on pore structure of the Cambrian marine shale in the Upper Yangtze Platform, South China: Evidence from FE-SEM and gas adsorption analysis. J. Pet. Sci. Eng. 2017, 156, 307–321. [Google Scholar] [CrossRef]
  40. Zhang, J.Z.; Li, X.Q.; Wei, Q.; Gao, W.J.; Liang, W.L.; Wang, Z.; Wang, F.Y. Quantitative characterization of pore-fracture system of organic-rich marine-continental shale reservoirs: A case study of the Upper Permian Longtan Formation, Southern Sichuan Basin, China. Fuel 2017, 200, 272–281. [Google Scholar] [CrossRef]
  41. Adeyilola, A.; Nordeng, S.; Onwumelu, C.; Nwachukwu, F.; Gentzis, T. Geochemical, petrographic and petrophysical characterization of the Lower Bakken shale, Divide County, North Dakota. Int. J. Coal Geol. 2020, 224, 103477. [Google Scholar] [CrossRef]
  42. Heriawan, M.N.; Koike, K. Coal quality related to microfractures identified by CT image analysis. Int. J. Coal Geol. 2015, 140, 97–110. [Google Scholar] [CrossRef]
  43. Gou, Q.Y.; Hao, F.; Yang, F.; Wang, Y.X.; Lu, Y.B.; Zhang, A.H.; Cheng, X.; Qing, J.W.; Gao, M.T. Study on characterization of micro-fracture of shale based on, micro-CT. Acta Geol. Sin. 2019, 93, 2372–2382, (In Chinese with English Abstract). [Google Scholar]
  44. Ge, J.; Zhao, W.C.; Wang, T.T.; Cai, T.T.; Cong, Z.C.; Bai, Y.J.; Gu, H.P. Study on Micro-nano pore characteristics and classification of tight sandstone reservoir based on Q-cluster. Geofluids 2022, 2022, 3218636. [Google Scholar] [CrossRef]
  45. Dewers, T.A.; Jason, H.; Russ, E.; Luca, D. Three-dimensional pore networks and transport properties of a shale gas formation determined from focused ion beam serial imaging. Gas Coal Technol. 2012, 5, 229–248. [Google Scholar] [CrossRef]
  46. Curtis, M.E.; Cardott, B.J.; Sondergeld, C.H.; Rai, C.S. Development of organic porosity in the Woodford Shale with increasing thermal maturity. Int. J. Coal Geol. 2012, 103, 26–31. [Google Scholar] [CrossRef]
  47. Jin, L.X.; Mathur, R.; Rother, G.; Cole, D.; Bazilevskaya, E.; Williams, J.; Carone, A.; Brantley, S. Evolution of porosity and geochemistry in Marcellus Formation black shale during weathering. Chem. Geol. 2013, 356, 50–63. [Google Scholar] [CrossRef]
  48. Keller, L.M.; Schuetz, P.; Erni, R.; Rossell, M.D.; Lucas, F.; Gasser, P.; Holzer, L. Characterization of multi-scale microstructural features in Opalinus Clay. Microporous Mesoporous Mater. 2013, 170, 83–94. [Google Scholar] [CrossRef]
  49. Bai, B.J.; Elgmati, M.; Zhang, H.; Wei, M.Z. Rock characterization of Fayetteville shale gas plays. Fuel 2013, 105, 645–652. [Google Scholar] [CrossRef]
  50. Wang, H.; He, Z.L.; Zhang, Y.G.; Su, K.; Wang, R.Y. Quantitative identification of microfractures in the marine shale reservoir of the Wufeng-Longmaxi Formation using water immersion tests and image characterization. Interpretation 2018, 6, 23–30. [Google Scholar] [CrossRef]
  51. Long, P.Y.; Zhang, J.C.; Tang, X.; Nie, H.K.; Liu, Z.J.; Han, S.B.; Zhu, L.L. Feature of muddy shale fissure and its effect for shale gas exploration and development. Nat. Gas Geosci. 2011, 22, 525–532. (In Chinese) [Google Scholar]
  52. Wu, S.T.; Zhai, X.F.; Yang, Z.; Bale, H.; Hong, Y.L.; Cui, J.W.; Pan, S.Q.; Lin, S.H. Characterization of fracture formation in organic-rich shales—An experimental and real time study of the Permian Lucaogou Formation, Junggar Basin, northwestern China. Mar. Pet. Geol. 2019, 107, 397–406. [Google Scholar] [CrossRef]
  53. Dong, H.M.; Sun, J.M.; Zhu, J.J.; Lin, Z.Z.; Cui, L.K.; Yan, W.C.; Xiong, Z. Quantitative characterization and characteristic analysis of pore structure of shale-gas reservoir in the Sichuan Basin, China. Interpretation 2019, 7, 23–32. [Google Scholar] [CrossRef]
  54. Liu, Z.B.; Hu, Z.Q.; Liu, G.X.; Liu, Z.J.; Liu, H.T.; Hao, J.Y.; Wang, P.W.; Li, P. Pore characteristics and controlling factors of continental shale reservoirs in the Lower Jurassic Ziliujing Formation, northeastern Sichuan Basin. Oil Gas Geol. 2021, 42, 136–145, (In Chinese with English Abstract). [Google Scholar]
  55. Ma, K.; Zhang, B.; Wen, S.Y.; Lin, X.Y.; Wang, Y.; Yang, K. Quantitative Characterization and Controlling Factors of Shallow Shale Reservoir in Taiyang Anticline, Zhaotong Area, China. Minerals 2022, 12, 998. [Google Scholar] [CrossRef]
  56. Sun, Y.; Zhai, C.; Xu, J.Z.; Cong, Y.Z.; Qin, L.; Zhao, C. Characterization and evolution of the full size range of pores and fractures in rocks under freeze-thaw conditions using nuclear magnetic resonance and three-dimensional X-ray microscopy. Eng. Geol. 2020, 271, 105616. [Google Scholar] [CrossRef]
  57. Watkins, H.; Butler, R.W.H.; Bond, C.E.; Healy, D. Influence of structural position on fracture networks in the Torridon Group, Achnashellach fold and thrust belt, NW Scotland. J. Struct. Geol. 2015, 74, 64–80. [Google Scholar] [CrossRef] [Green Version]
  58. Wei, X.L.; Zhang, Y.X.; Zhang, S.; Zhang, J.C.; Shi, M. A study on the morphology of natural microfractures in marine and continental transitional shale based on scanning electron microscopy image. Micron 2021, 148, 103105. [Google Scholar] [CrossRef]
  59. Guo, X.S.; Hu, D.F.; Li, Y.P.; Wei, Z.H.; Wei, X.F.; Liu, Z.J. Geological factors controlling shale gas enrichment and high production in Fuling shale gas field. Pet. Explor. Dev. 2017, 44, 513–523. [Google Scholar] [CrossRef]
  60. Wang, X.Z.; Liang, Q.S.; Gao, C.; Xue, P.; Yin, J.T.; Hao, S.Y. Hydrocarbon accumulation model influenced by “three elements (source-storage-preservation)” in lacustrine shale reservoir-A case study of Chang 7 shale in Yan’an area, Ordos Basin. Front. Earth Sci. 2022, 10, 1012607. [Google Scholar] [CrossRef]
  61. Fathy, D.; El-Balkiemy, A.F.; Makled, W.A.; Hosny, A.M. Organic geochemical signals of Paleozoic rocks in the southern Tethys, Siwa basin, Egypt: Implications for source rock characterization and petroleum system. Phys. Chem. Earth Parts A/B/C 2023, 130, 103393. [Google Scholar] [CrossRef]
  62. Liu, W.W.; Zhang, K.; Li, Q.W.; Yu, Z.H.; Cheng, S.H.; Liu, J.Y.; Liu, P.; Han, F.L.; Tang, L.Y.; Li, Z.W.; et al. Quantitative characterization for the micronanopore structures of terrestrial shales with different lithofacies types: A case study of the Jurassic Lianggaoshan Formation in the southeastern Sichuan Basin of the Yangtze region. Geofluids 2021, 1416303. [Google Scholar] [CrossRef]
  63. Curtis, J.B. Fractured shale-gas systems. AAPG Bull. 2002, 86, 1921–1938. [Google Scholar]
  64. Yao, J.; Ding, Y.; Sun, H.; Fan, D.Y.; Wang, M.; Jia, C.Q. Productivity Analysis of Fractured Horizontal Wells in Tight Gas Reservoirs Using a Gas–Water Two-Phase Flow Model with Consideration of a Threshold Pressure Gradient. Energy Fuels 2023, 37, 8190–8198. [Google Scholar] [CrossRef]
  65. Panahi, H.; Kobchenko, M.; Meakin, P.; Dysthe, D.K.; Renard, F. Fluid expulsion and microfracturing during the pyrolysis of an organic rich shale. Fuel 2019, 235, 1–16. [Google Scholar] [CrossRef]
  66. Zeng, Y.J.; Du, S.H.; Zhang, X.; Zhang, B.P.; Liu, H.L. The crucial geometric distinctions of microfractures as the indispensable transportation channels in hydrocarbon-rich shale reservoir. Energy Rep. 2020, 6, 2056–2065. [Google Scholar] [CrossRef]
Figure 1. (A) Structural units and location of the Yuanba area in the northern Sichuan Basin (modified from [30]). (B) Main wells, structural belts, and faults in the Yuanba area. (C) Generalized lithology column of the Ziliujing (J1z) and Qianfoya (J2q) Formations in the Yuanba area (modified from [31]).
Energies 16 05685 g001
Figure 2. Microphotographs of RTSs of samples showing typical microfractures in the J1z4 shale in the Yuanba area. (A) YB122-8, 3561.25 m, mesh-like fractures in shale. (B) YL-3, 3747.18 m, mesh-like fractures in shell-bearing shale. (C) YL4-14, 3754.1 m, horizonal fractures in shale. (D) YL4-32, 3791.04 m, mesh-like fractures in shale. (E) YL17-4, 3865.32 m, (F) YB102-6, 3922.79 m, horizonal fractures in shell-bearing shale. (G) YL176-4, 4136.5 m, horizonal fractures in shale. (H) YB122-6, 3560.35 m, (I) YL176-10, 4141.85 m, mesh-like fractures in shale.
Energies 16 05685 g002
Figure 3. Micro-CT images showing typical microfractures in shale samples from the J1z4 in the Yuanba area. (A,B) YB102-7, 3923.19 m, one linear fracture in shale. (C,D) YL4-6, 3748.38 m, three fractures in shale. (E,F) YL4-10, 3754.1 m, two parallel fractures in shale.
Energies 16 05685 g003
Figure 4. Typical SEM images of microfractures in shale samples from the J1z4 in the Yuanba area. (A) YL4-25, 3784.54 m, siltstone. (B) YL4-2, 3746.58 m, shell limestone. (C) YL30-19, 3998.2 m, shale. (D) YL4-15, 3754.8 m, shale. (E) YB122-9, 3564.05 m, shale. (F) YB122-9, 3564.05 m, shale. (G) YB273-3, 4073.43 m, shale. (H) YB273-3, 4073.43 m, shale. (I) YL17-2, 3864.22 m, shale.
Energies 16 05685 g004
Figure 5. Histograms of microfracture widths observed using the (A) RTS observation, (B) micro-CT scanning, and (C) SEM techniques.
Energies 16 05685 g005
Figure 6. Microfracture surface porosity of the J1z4 shale in the Yuanba area. (A) Full-view image of a RTS, (B) micro-CT image, and (C) SEM image.
Energies 16 05685 g006
Figure 7. Porosities obtained via (A) helium porosimeter measurements, and (B) micro-CT scanning of shale samples from the J1z4 in the Yuanba area.
Energies 16 05685 g007
Figure 8. Microphotographs of the microfracture in the same RTSs at different magnifications. (A) YL4-6, 3748.38 m, magnified 20 times, the minimum width of fractures is about 10 μm; (B) YL4-6, magnified 50 times, the minimum width of fractures is about 5 μm, and more fractures can be observed than at 20 times magnification; (C) YL4-6, magnified 100 times, the minimum width of fractures is about 3 μm. More fracture can be observed at higher magnification, and the surface fracture porosity is about 3.39% (D), 5.28% (E), and 5.86% (F) at 20-, 50-, and 100-times magnification, respectively.
Energies 16 05685 g008
Figure 9. Percentage of the total surface porosity of the microfractures to the total porosity obtained via the (A) RTS observation and SEM techniques and (B) micro-CT scanning.
Energies 16 05685 g009
Figure 10. Distribution of shale thickness, faults, and wells with different gas yields in the J1z4 in the Yuanba area.
Energies 16 05685 g010
Disclaimer/Publisher’s Note: The statements, opinions and data contained in all publications are solely those of the individual author(s) and contributor(s) and not of MDPI and/or the editor(s). MDPI and/or the editor(s) disclaim responsibility for any injury to people or property resulting from any ideas, methods, instructions or products referred to in the content.

