Abstract
With the widespread application of permanent magnet synchronous motor (PMSM) drives, the demand for safety and reliability has increased. Inverter open-circuit fault is a frequent and severe failure that requires reliable detection and remedial measures. This paper proposes an open-circuit fault diagnosis technique based on voltage residual analysis that does not require additional voltage sensors. The proposed technique analyzes the characteristics of the reference voltage and the actual output voltage under both healthy and fault conditions. To achieve fast and reliable fault detection, it uses the DC component and second harmonic component in the residual voltage between estimated voltage and controller reference voltage. Once an open-circuit fault is detected, the polarity of the DC component is capable of identifying the fault location. The effectiveness and robustness of the proposed technique are verified through simulations and testing on a triple redundant PMSM under various load and speed conditions.
1. Introduction
As hydraulic, pneumatic, and mechanical transmissions are gradually replaced by electric drive systems, the demand for reliability in motor drives is becoming increasingly urgent [1]. A typical motor drive consists of a motor, inverter, and controllers, and a failure in any part can affect the normal operation of the system. Statistical data reveal that power switch failures in inverters account for approximately 38% of all failures [2]. Power switches are particularly vulnerable to failure and malfunction due to their exposure to transient voltage stress, current stress, and thermal stress during operation [3,4,5]. Therefore, it is crucial to study the fault detection and localization methods for open-circuit faults in inverters to promptly cut off faults or switch to fault-tolerant control algorithms to ensure the safe and reliable operation of the electric drive system [6].
Power switches faults can generally be categorized as open-circuit and short-circuit faults. Short-circuit faults can have a devastating impact on the motor drives and are generally handled by converting them into open-circuit faults through a real-time hardware monitoring circuit. As a result, current research on inverter faults mainly focuses on the detection and localization methods of open-circuit faults [7]. Open-circuit faults can cause a DC current offset in both the fault and non-fault phases, and the interaction between the DC current component and the permanent magnet field can produce significant torque ripple and speed fluctuations. Additionally, the DC current can generate uneven stress in the upper and lower switching switches of the same bridge arm, which can shorten the service life of other healthy power switches [8]. Although these impacts usually do not cause an immediate system shutdown, but significantly reduce system performance. If fault diagnosis and protection measures are not taken in a timely manner, the service life of the system will be seriously shortened.
Fault diagnosis methods for inverter open-circuit faults can be divided into two categories based on the detection signals: current-based methods [9,10,11,12,13,14] and voltage-based methods [15,16,17,18]. Current-based methods extract fault characteristics from motor current signals to detect and locate faults. For instance, reference [9] uses cost function values to indicate fault conditions, while reference [10] employs the average current Park vector method. In the case of low-power motor drives where only bus current sampling is available. In addition, reference [11] analyzes the frequency spectra of the DC-side current and identifies unique frequency components of the DC-side current spectra during normal operation, single switches open-circuit and single-phase open-circuit of the inverter. Reference [12] utilizes a wavelet convolutional neural network to extract fault features and identify the fault switch, while reference [13,14] develops a hybrid system state model of the motor drives to diagnose faults by analyzing the difference between predicted and actual currents. To reduce the dependence of these methods on load, reference [15] proposes using the normalized current average and absolute average methods to process three-phase current signals.
These current-based methods have some limitations, such as relatively slow fault diagnosis speed and being prone to load disturbances. Additionally, as the current in a voltage-source inverter is a continuous variable, its variation process can be easily affected by other factors, such as the electrical time constant and system operation status. To address these issues, voltage-based methods have been proposed. In reference [16], the phase voltage and line voltage during normal operation are compared with those during fault occurrence. Similarly, in reference [17], a switching function is established to obtain the fault characteristic signal by performing logic operations on the voltage signal output by the photocoupler and the switch signal. In addition, due to the fact that open-circuit faults can cause three-phase voltage asymmetry, zero-sequence components are also employed for fault diagnosis [18,19]. These voltage-based methods have fast diagnostic speeds and are not sensitive to changes in load current. However, they require modifications to the original hardware circuit, which can increase the system hardware cost.
Based on the literature review, current-based fault diagnosis methods are relatively slow and voltage-based methods require hardware modifications. Furthermore, the current research direction for inverter open-circuit fault diagnosis mainly focuses on analyzing the features of fault signals and modes, constructing fault indicator signals and proposing corresponding fault detection methods; however, there is relatively little research on the causes of fault features and the optimal fault signal with the highest signal-to-noise ratio. To address this limitations, this paper proposes a new fault diagnosis method based on the voltage residual of the inverter. The proposed method analyzes the operating characteristics of the voltage signal and uses the difference between the model-based predicted voltage and the controller output voltage to detect faults. This method is more sensitive to faults and has a higher signal-to-noise ratio than the traditional current and voltage-based fault diagnosis methods. Moreover, the proposed method does not require additional hardware circuit modifications, which increases the commonality between different systems. The effectiveness and superiority of the proposed method have been verified by simulation and experiment. By addressing the limitations of traditional fault diagnosis methods and leveraging the advantages of the voltage signal, the proposed method provides a promising approach for detecting and diagnosis inverter open-circuit faults in motor drives.
2. Fault Diagnosis
2.1. Voltage Residual Analysis
PMSM drives generally consist of a controller, inverter, and a motor, as shown in Figure 1. In healthy conditions, the controller will generate driving signals through SVPWM modulation to control the motor. Hence, the reference voltage provided by the controller is basically consistent with the actual output voltage of the motor. In the event of an open-circuit fault in the power switches, there is no circulating circuit in the current of the faulty phase for half a cycle, which can disrupt the relationship between the reference voltage and output voltage of the motor drives.
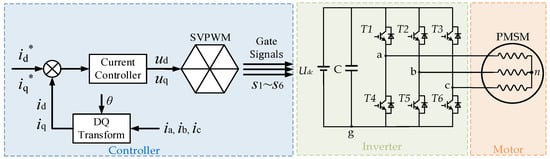
Figure 1.
PMSM drives.
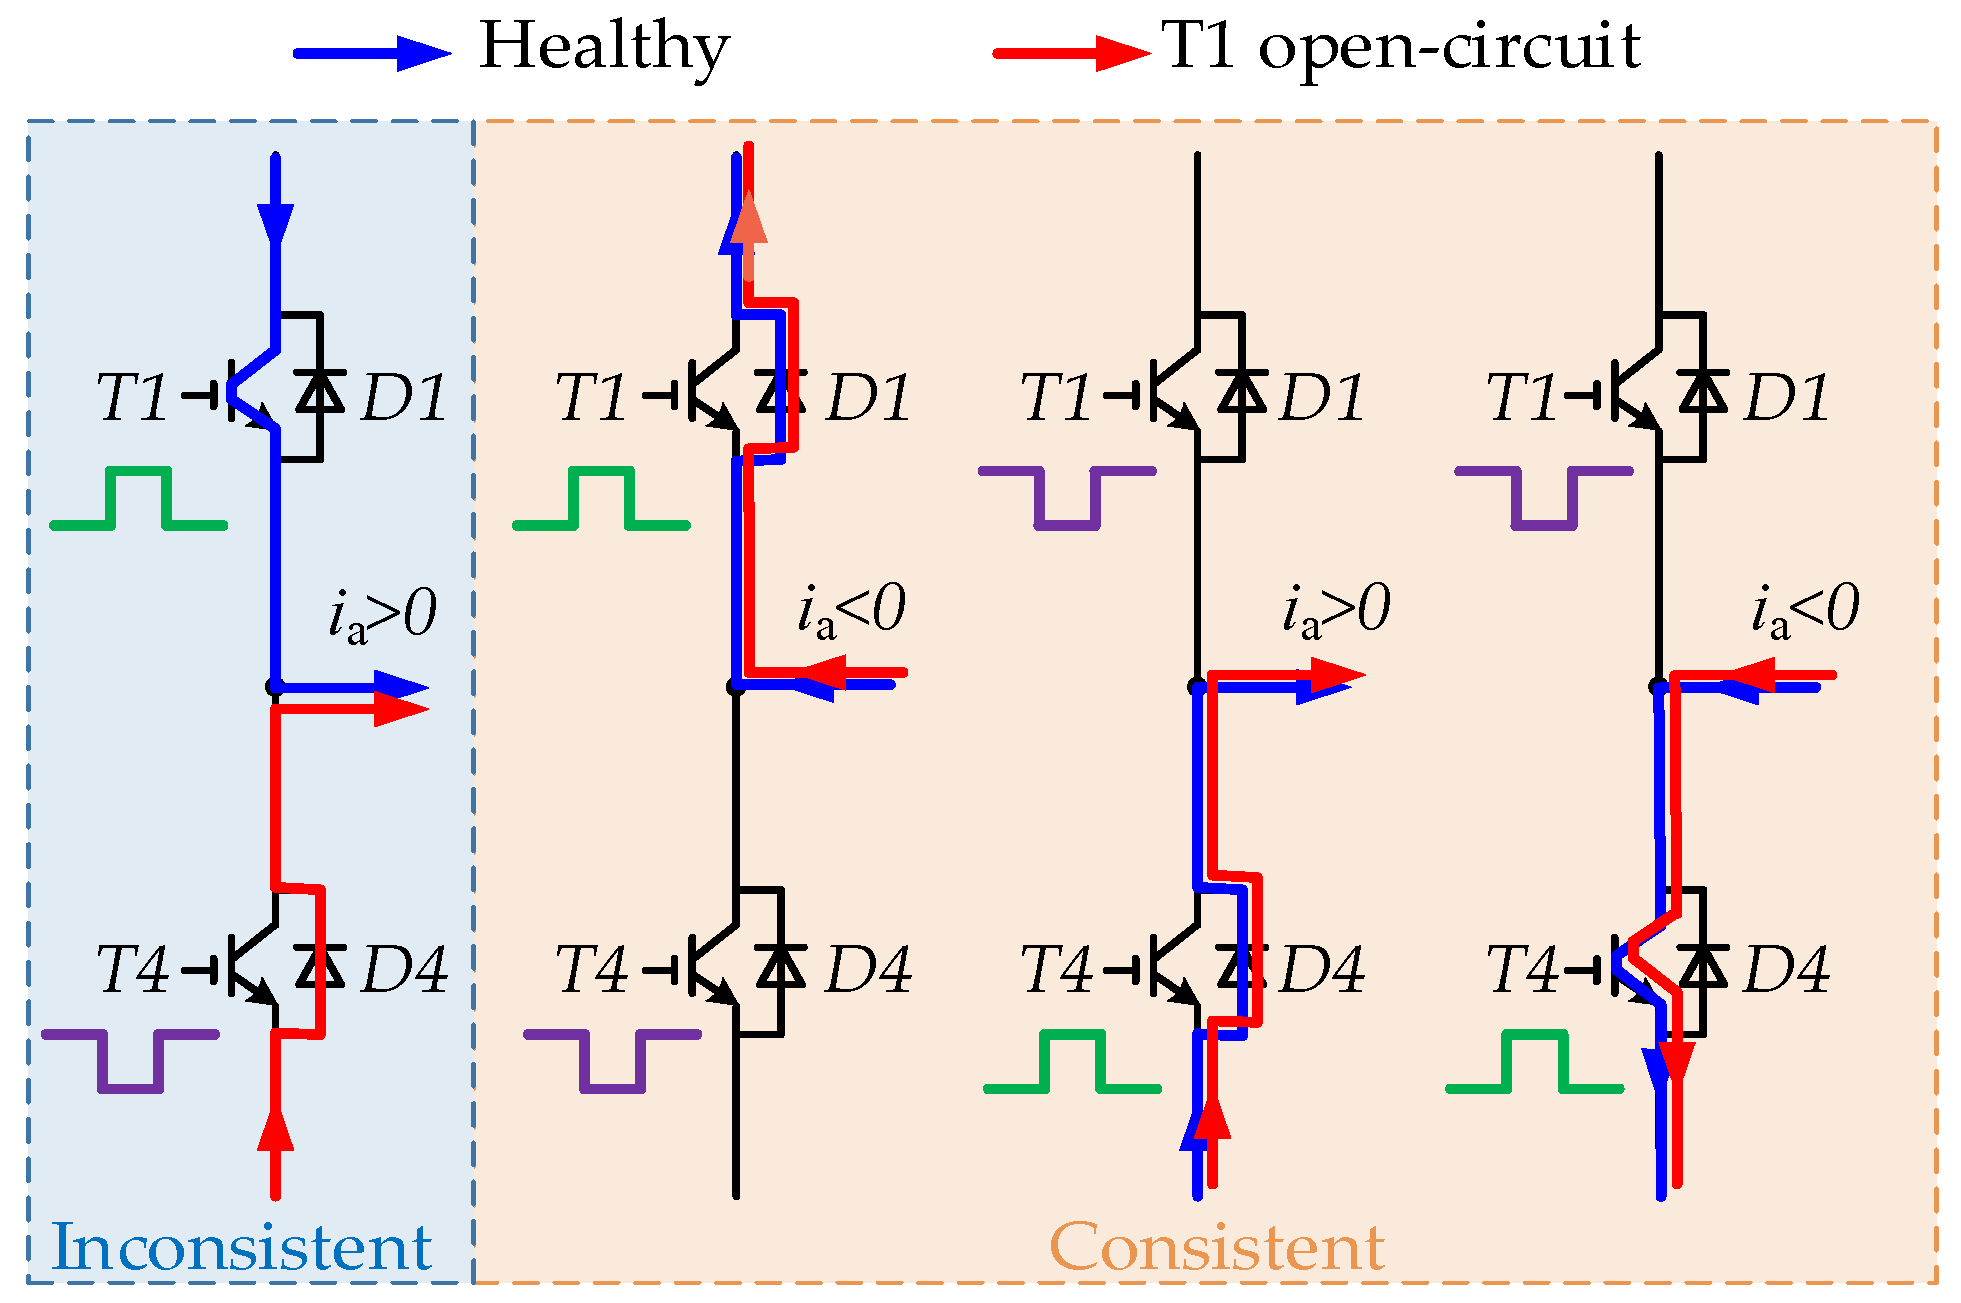
Figure 2 illustrates the current flow paths of the phase A bridge arm in normal and power switch T1 open-circuited fault conditions. Based on the switch status and current flow direction, the actual output voltage of the bridge arm can be determined. It can be observed that, in the healthy condition, the actual output voltage of the bridge arm is consistent with the conduction state of the power switch. Specifically, when the power switch is given a high level, the actual output voltage is ; when the power switch is given a low level, the actual output voltage is 0. However, when the power switch T1 experiences an open-circuit fault and the driving signal is high, the intended high output midpoint voltage of the bridge arm will be forced to a low output voltage due to the change in current flow path when the current flows out. This means that the output voltage of the motor cannot follow the reference voltage in this situation. Similar analysis reveals that the other three cases are not affected by T1 open-circuit fault. Therefore, it can be seen that the impact of a single power switch open-circuit on voltage residual is intermittent, mainly reflected in the fact that voltage residual will occur in the original working state of the faulty switch and disappear in other situations.
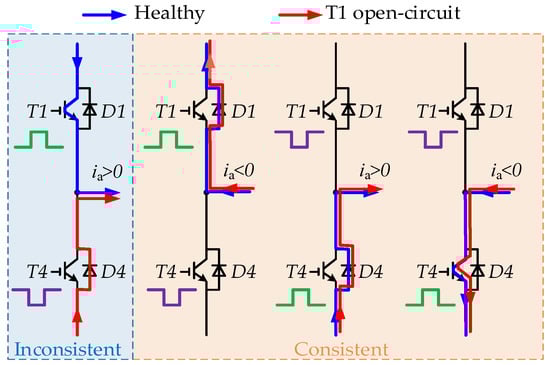
Figure 2.
Current flow path in healthy and T1 open-circuit fault conditions.
It should be noted that Figure 2 only considers the situation where the current is continuous. In case where the current is intermittent, the midpoint voltage of the bridge arm cannot be uniquely determined by the conduction state of the power switch. Instead, it depends on the conduction state of the freewheeling diodes D1 and D4. When the phase A current is 0, the forward voltage drop of the freewheeling diodes D1 and D4 can be expressed as [13]
where are the phase voltage; are the midpoint voltage of bridge arm; is the dc-link voltage; and and are the diode drop.
Since open-circuit fault only occurs in T1, the values of the midpoint voltage in the phase B and C bridge arms remain at 0 or . According to the voltage equation of the motor, the phase A voltage is mainly related to the anti-potential of phase A and the phase currents of phase B and C. By taking into account the operating modes of the phase B and C switching switches, the conduction state of the freewheeling diodes can be determined for different operating modes, which enables the value of the midpoint voltage to be obtained.
According to the relationship between the midpoint voltage and the phase voltage, as well as the equation for calculating voltage space vector, as shown in (2) and (3), the three-phase voltage and voltage space vector under faulty conditions can be obtained. Assuming a polarity of 1 for current flowing out of the inverter, a polarity of −1 for current flowing into the inverter and a polarity of 0 for intermittent current. The actual output voltage space vector of the inverter on the αβ plane after the fault can be determined, as shown in Figure 3. Due to the different current polarities, there are a total of 24 voltage space vectors under faulty conditions, compared to the eight voltage space vectors to under healthy conditions. Among them, the voltage space vectors , , , and are identical to the corresponding voltage space vectors , , and under healthy conditions, as shown in the voltage space vectors labeled in black text in the figure. However, the remaining voltage space vectors , , and are only identical to , , , and when the current polarity is negative, but not when it is positive, as shown in the voltage space vectors labeled in red text in the figure. Finally, when considering the case where the current polarity is zero, the voltage space vector is dynamic, and its value changes with the value of . The trajectory of the end of the voltage space vector is shown in the blue text in the figure.
where is the voltage sapce vector.
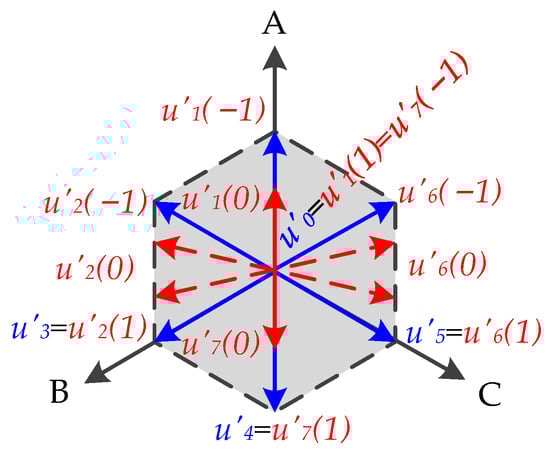
Figure 3.
Voltage space vector diagram when T1 open-circuit.
Under healthy conditions, assuming no effects of inverter switch delay and dead time, it can be seen that the reference voltage vectors are identical to the actual output voltage vector. However, under faulty conditions, the reference voltage vector and the actual output voltage vector are not completely consistent. According to the above analysis, the difference between the two contains both voltage and current information. Hence, analyzing the residual between them is crucial for differentiating and diagnosing open-circuit faults in power switches.
Table 1 provides the residual values between the reference voltage vector and the actual output voltage vector under different current polarities when there is an open-circuit fault in T1. It can be seen that the voltage residual mainly occurs when the current polarity is greater than or equal to zero. Furthermore, due to each power switch participating in the composition of four voltage vectors, accounting for half of the total number of voltage vectors, the voltage residual generated by a single power switch will be significant within half an electrical cycle.

Table 1.
Voltage residual with different current polarity.
2.2. Fault Diagnosis Principle
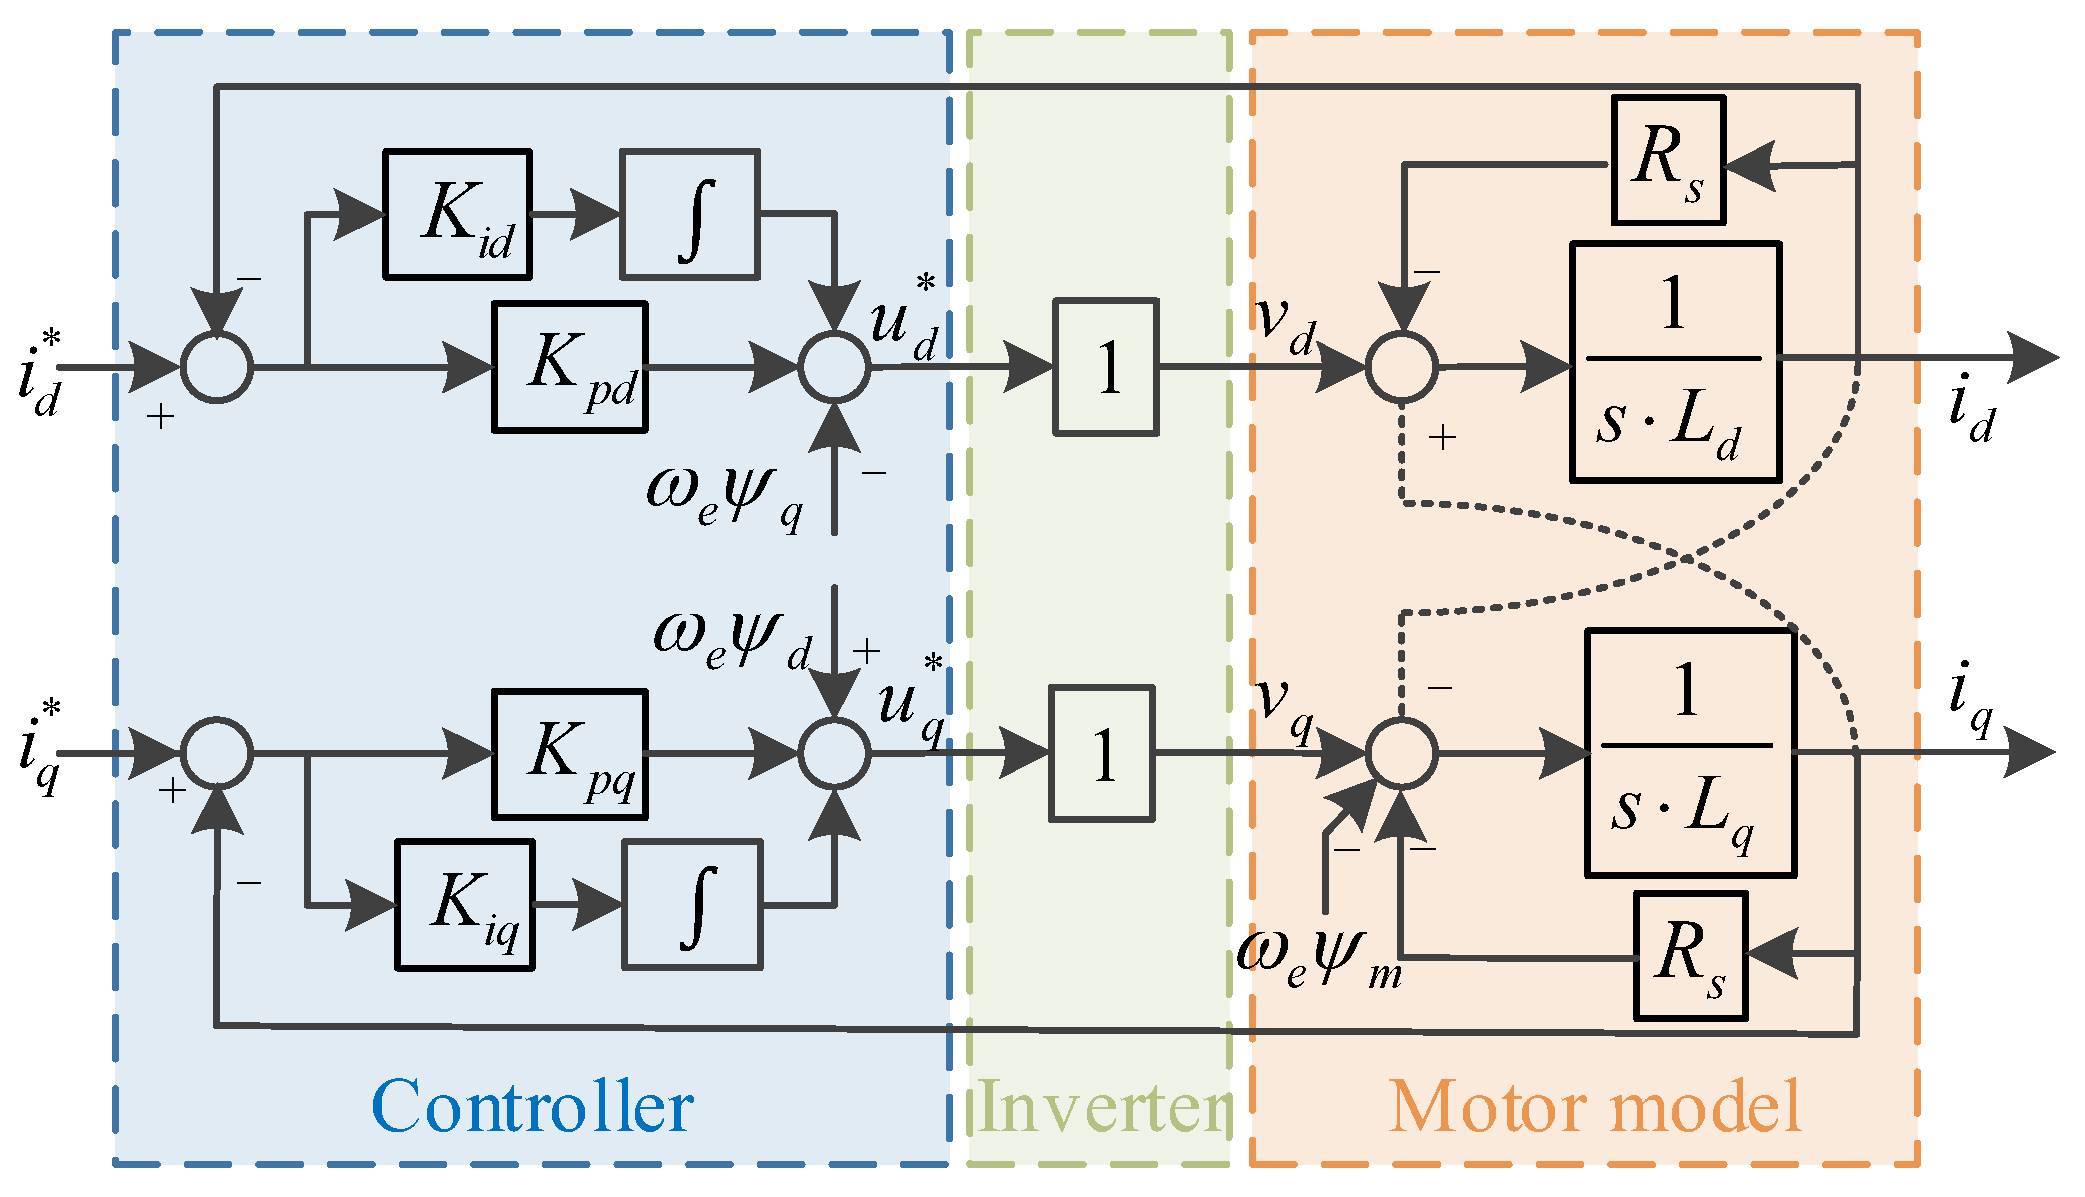
Due to the fact that there is a discrepancy between the reference voltage vector and the actual output voltage vector when an open-circuit fault occurs in the inverter. By comparing the residual between the two, it is possible to quickly and accurately detect the open-circuit fault. Figure 4 illustrates the traditional current control block diagram based on state feedback decoupling, which comprises three components: a PI controller, an inverter, and a motor model. It can be seen that the reference voltage vector can be obtained directly from the reference value output by the PI controller. Hence, the equation for the dq-axis reference voltage output from the current loop can be expressed as
where , , , and are the PI parameters of the dq-axis; and are the dq-axis flux linkages.
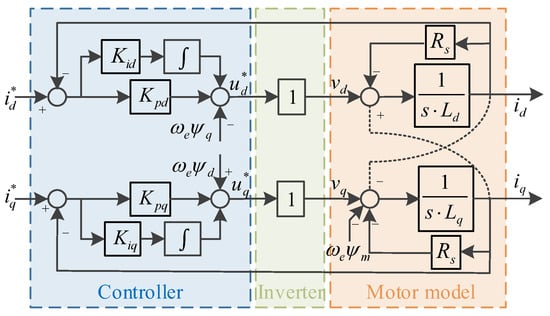
Figure 4.
Current controller block diagram.
The motor model can be used to observe the actual output voltage. By discretizing the dq-axis voltage equation of the motor using the backward Euler method [20], the actual output voltage in the dq-axis can be expressed as
where is the stator resistance, and are the dq-axis inductances, is the permanent magnet flux linkage, is the rotor electrical angular velocity.
The dq-axis voltage residuals, denoted by and , can be computed by subtracting the actual output voltage from the reference voltage. To account for voltage vector amplitude variation, the voltage residuals are normalized by the actual output voltage amplitude, as presented in Equation (6). Subsequently, the normalized three-phase voltage residuals, namely , , and , can be obtained using the inverse Park transformation.
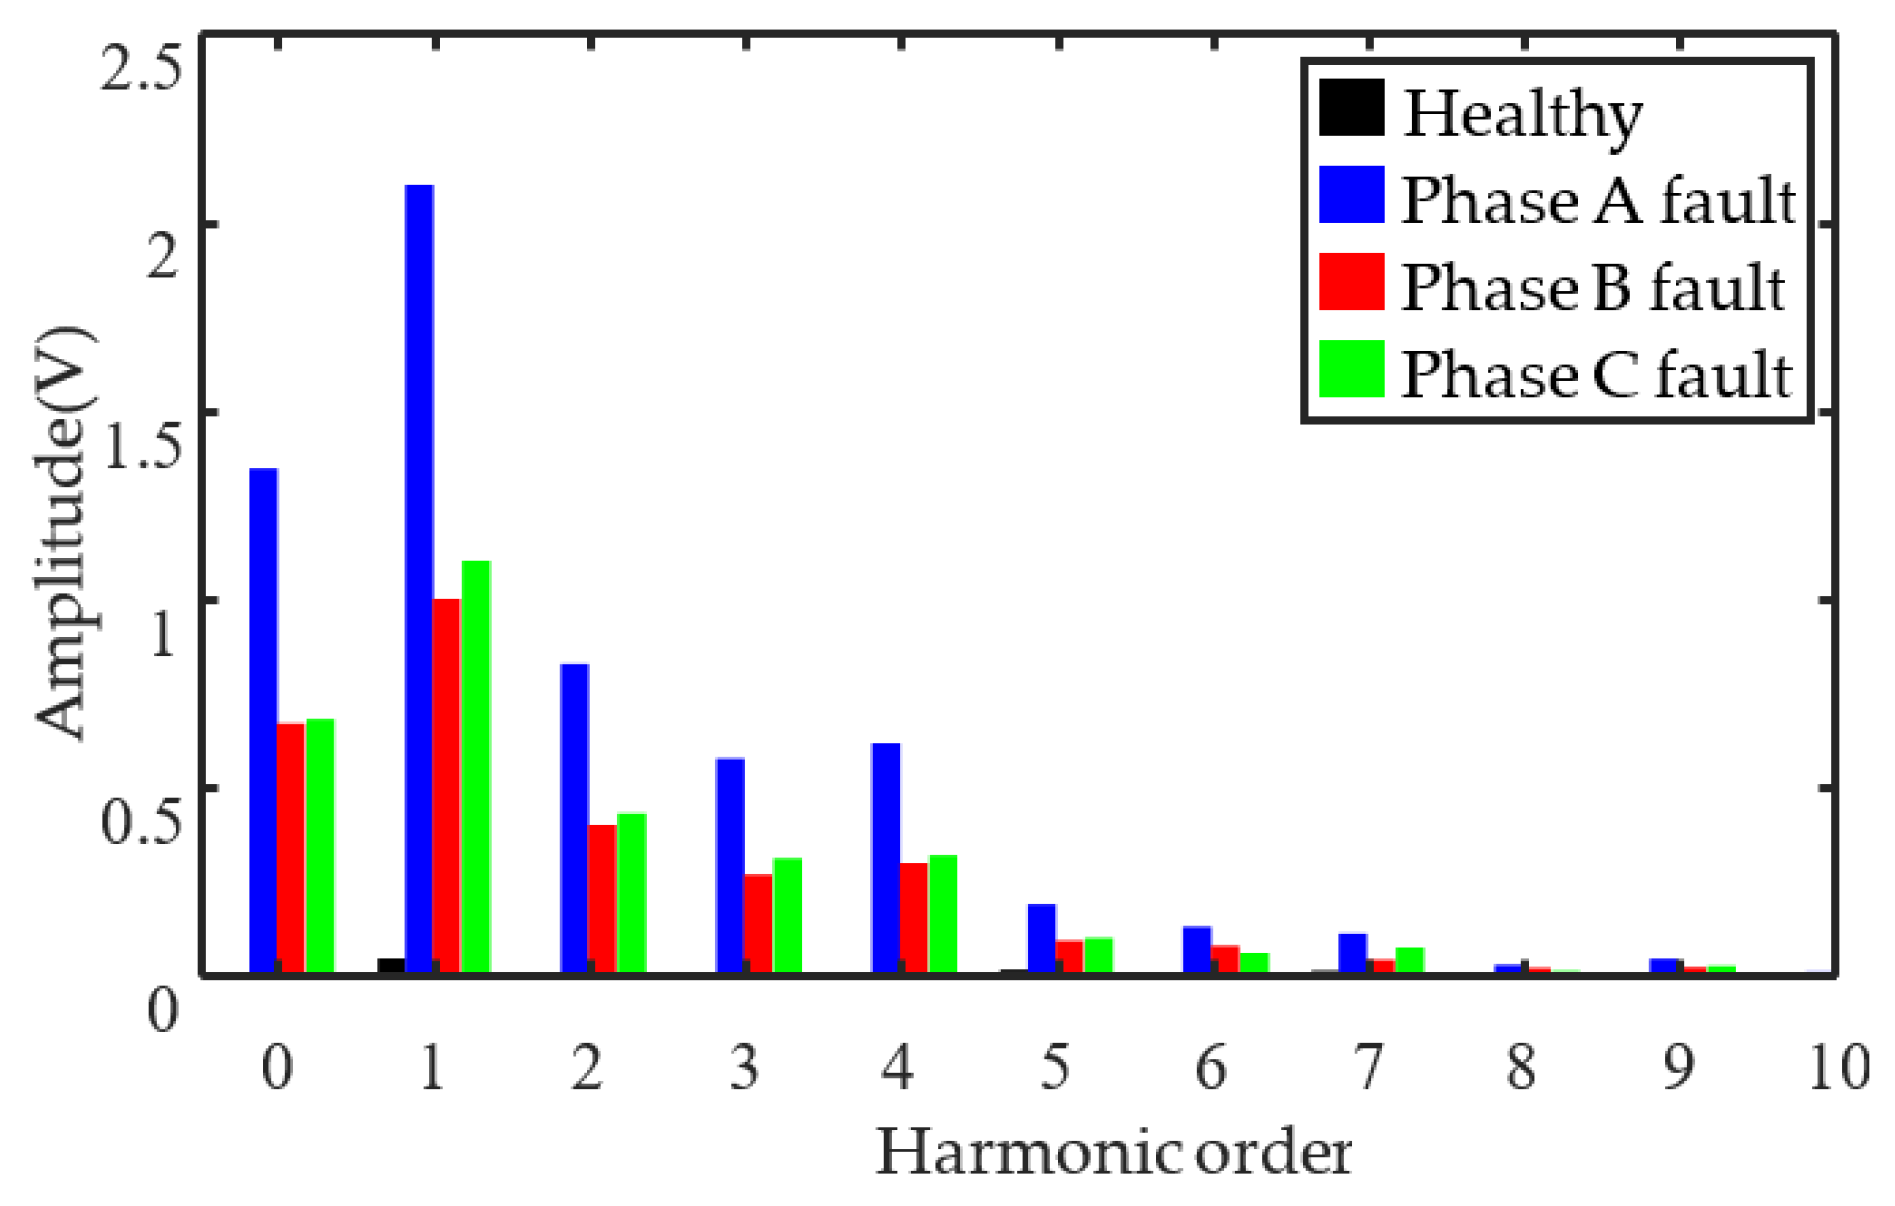
To identify the fault signal with the highest signal-to-noise ratio among the three-phase voltage residual components, the Fourier transform is applied to the three-phase voltage residual components obtained from the simulation. Figure 5 presents the FFT results of the three-phase residual voltage under healthy and fault conditions. Since the three-phase residual voltage spectrum is basically the same under healthy conditions, only one phase value is given. It is evident that, under healthy conditions, the primary low-order harmonic component of the residual voltage is the fundamental component. This is due to the fact that the observer is influenced by various factors, such as inaccurate parameters, limited current sampling frequency and inverter non-linearity, which prevents it from perfectly tracking the actual output voltage. Under faulty conditions, the most significant are the DC component, fundamental component and second harmonic component. Due to the fundamental signal susceptibility to observer parameters, it is unsuitable as a fault indication signal. Additionally, considering that the fault indication signal should have a higher signal-to-noise ratio, the DC component and second harmonic component of the residual are preferred. Hence, the fault indicator signal is constructed by taking the arithmetic square root of the DC component and second harmonic component, which can be written as
where and represent the DC component and second harmonic component of the residual signal, respectively.
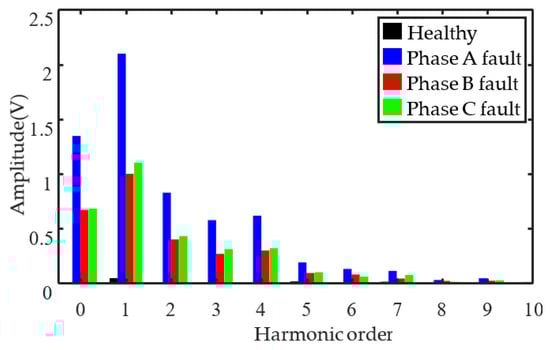
Figure 5.
FFT results of three-phase residual voltage.
If the value of the fault indicator exceeds the set threshold denoted as , it implies that an open-circuit fault has occurred. Conversely, if the value of the fault indicator is less than the threshold, it indicates that the system is operating normally. Therefore, the relationship can be expressed as:
An open-circuit fault in power switches leads to zero phase current within the corresponding cycle, which also affects the DC current component of the residual voltage. Hence, after diagnosing a single power switch open-circuit fault, the fault position can be further located by utilizing the polarity of the residual DC component for fault location. This can be written as (8), and the final fault query table can be obtained as shown in Table 2.
where is the threshold of the fault location indicator; is threshold, which is generally set to a slightly positive value above 0 to prevent false triggering.
Table 2.
Faulty location query.
Taking the open-circuit fault of power switch T1 as an example. If all fault indicators. , . and . exceed the threshold, it indicates that a switch open-circuit fault has occurred. In addition, the polarity of the residual DC current component needs to be queried. If outputs 1, and both output −1, the failed power switch can be identified as T1.
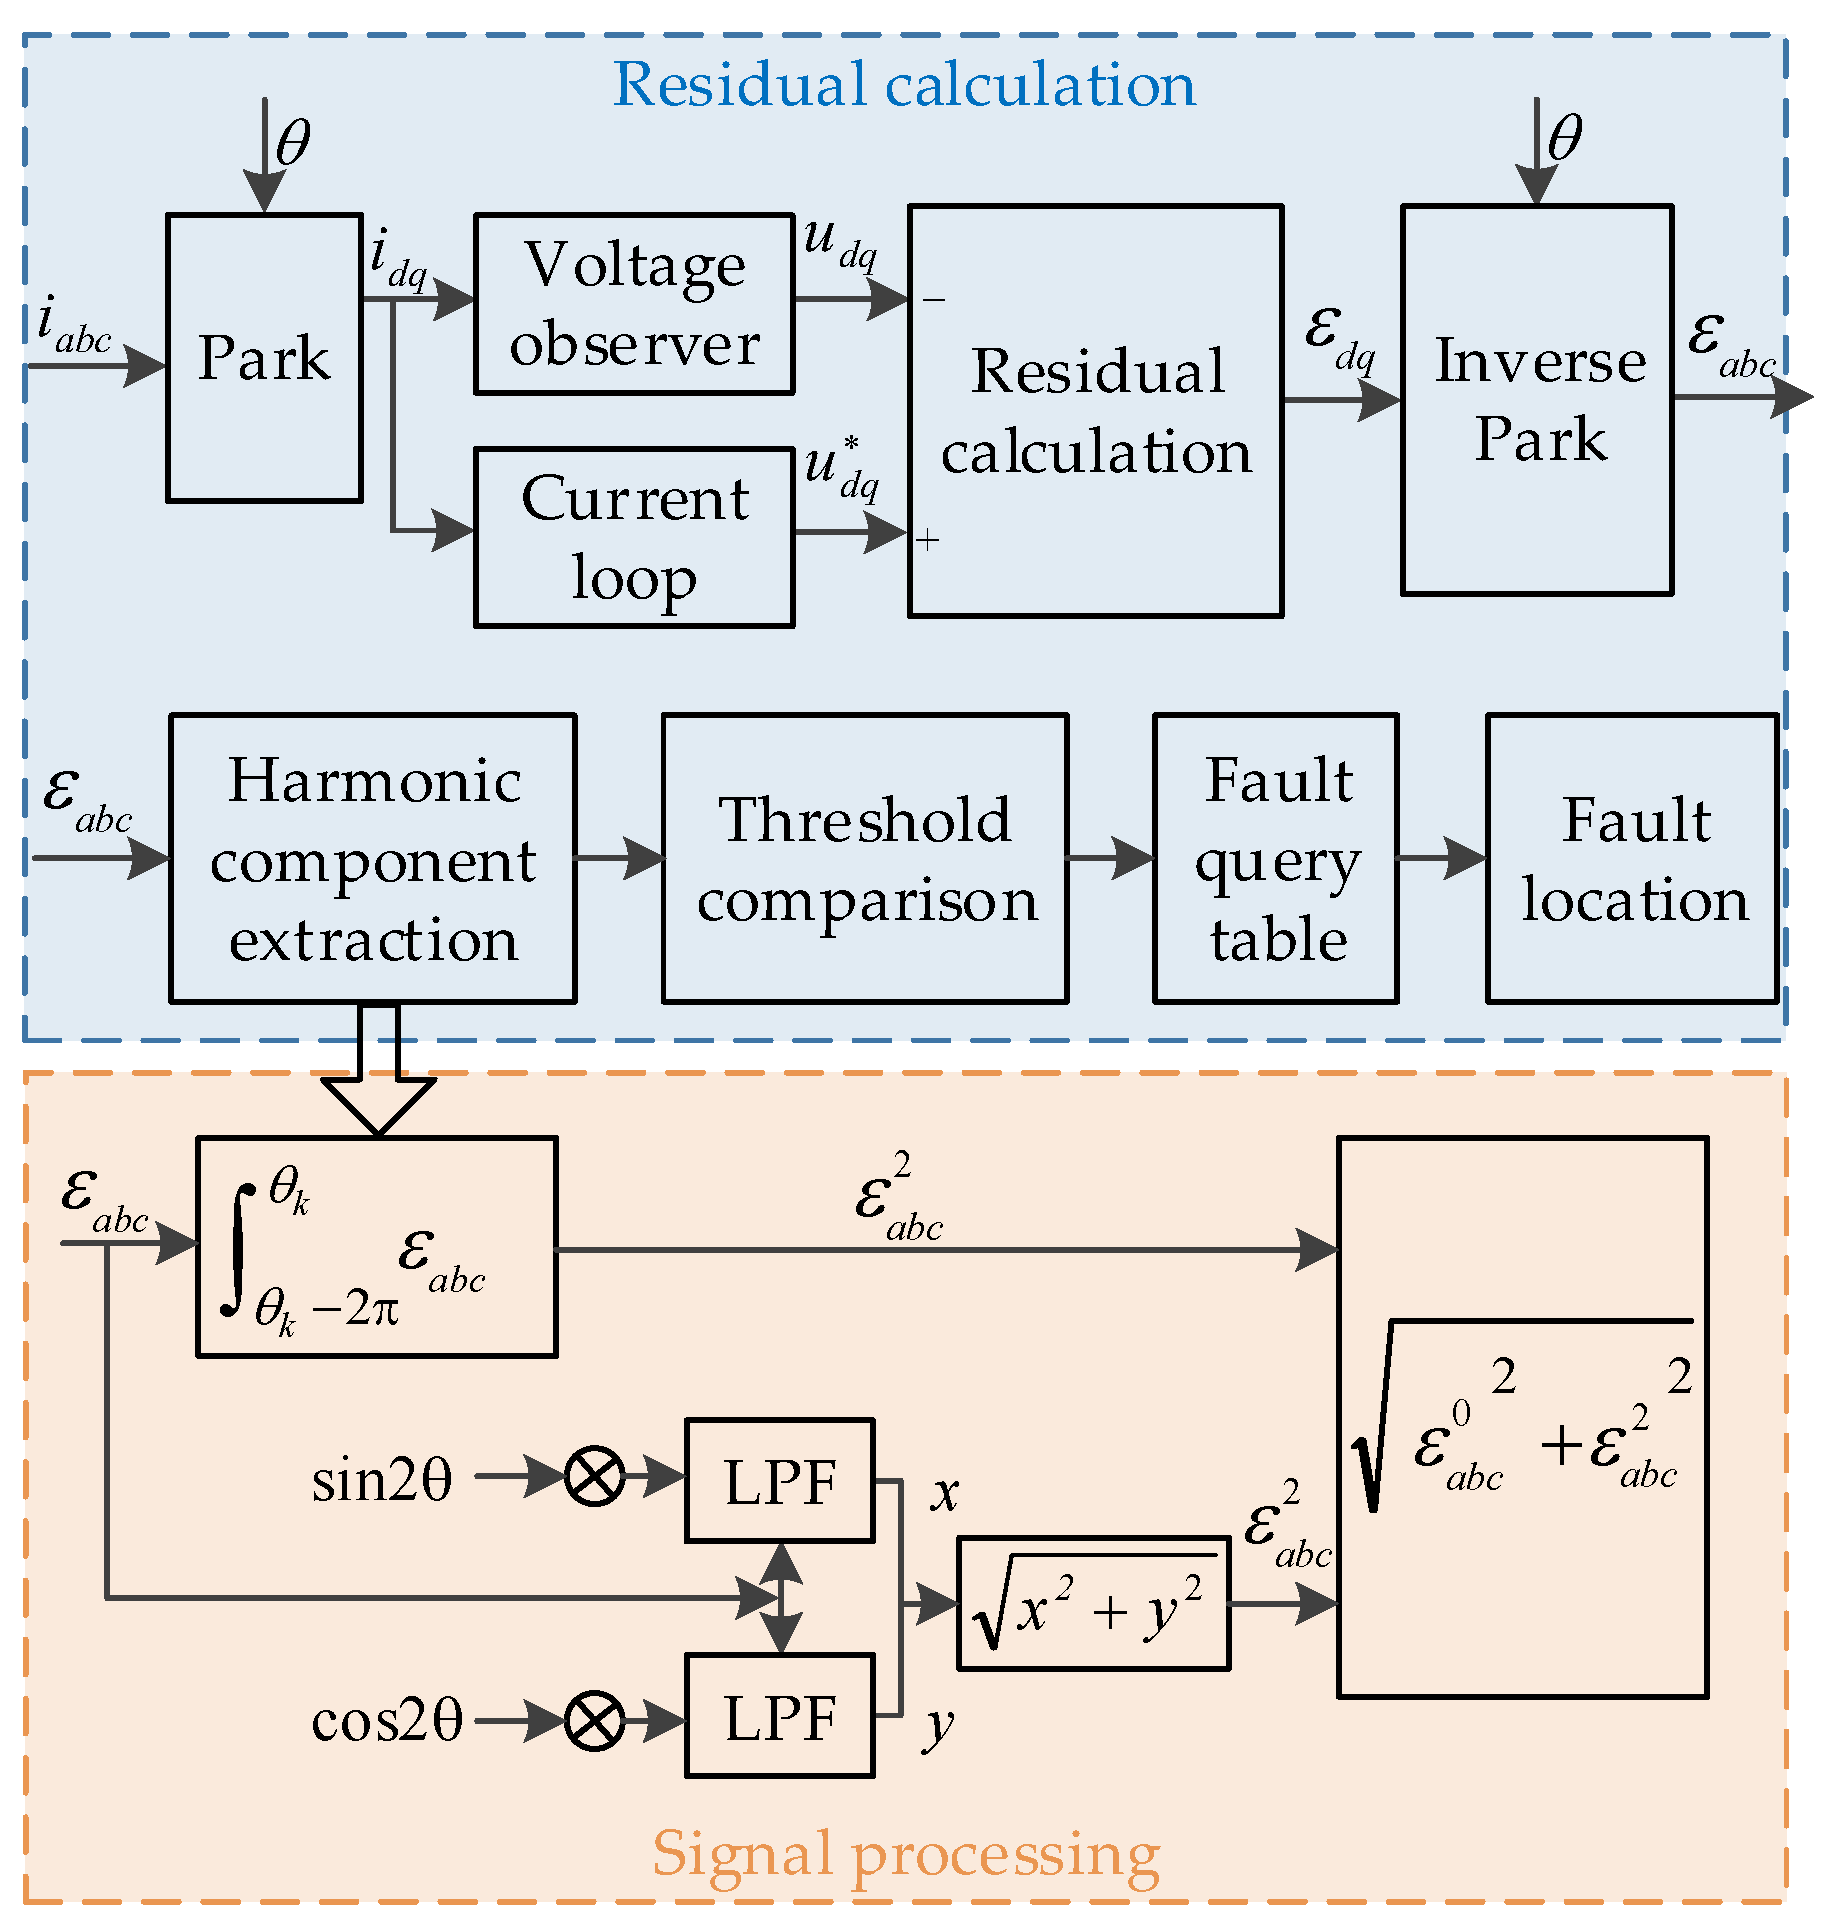
The overall fault diagnosis framework is depicted in Figure 6, which mainly includes two modules: residual calculation and signal processing. The residual calculation module primarily involves obtaining the actual output voltage and reference voltage, while the signal processing module is responsible for extracting the DC component and the second harmonic component from the residual voltage.
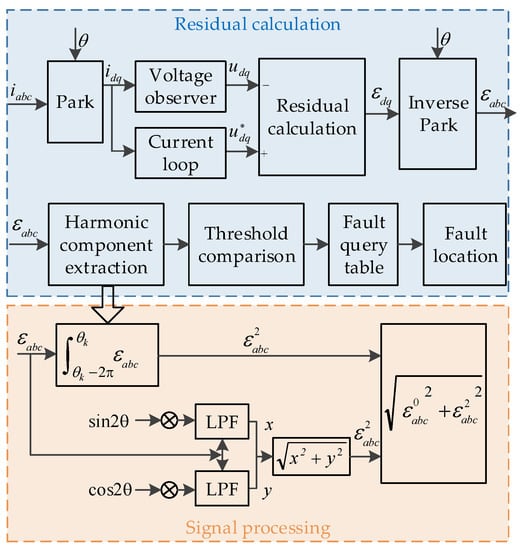
Figure 6.
Flowchart of fault diagnosis.
3. Simulation Results
To demonstrate the effectiveness of the fault diagnosis method proposed in this paper, a simulation model of a 5 kW three-phase PMSM drives was developed in Matlab/Simulink. The performance of the fault indicators under different fault modes were verified. The simulation results were obtained at the rated speed of 2000 rpm.
3.1. Single Switch Open-Circuit Fault
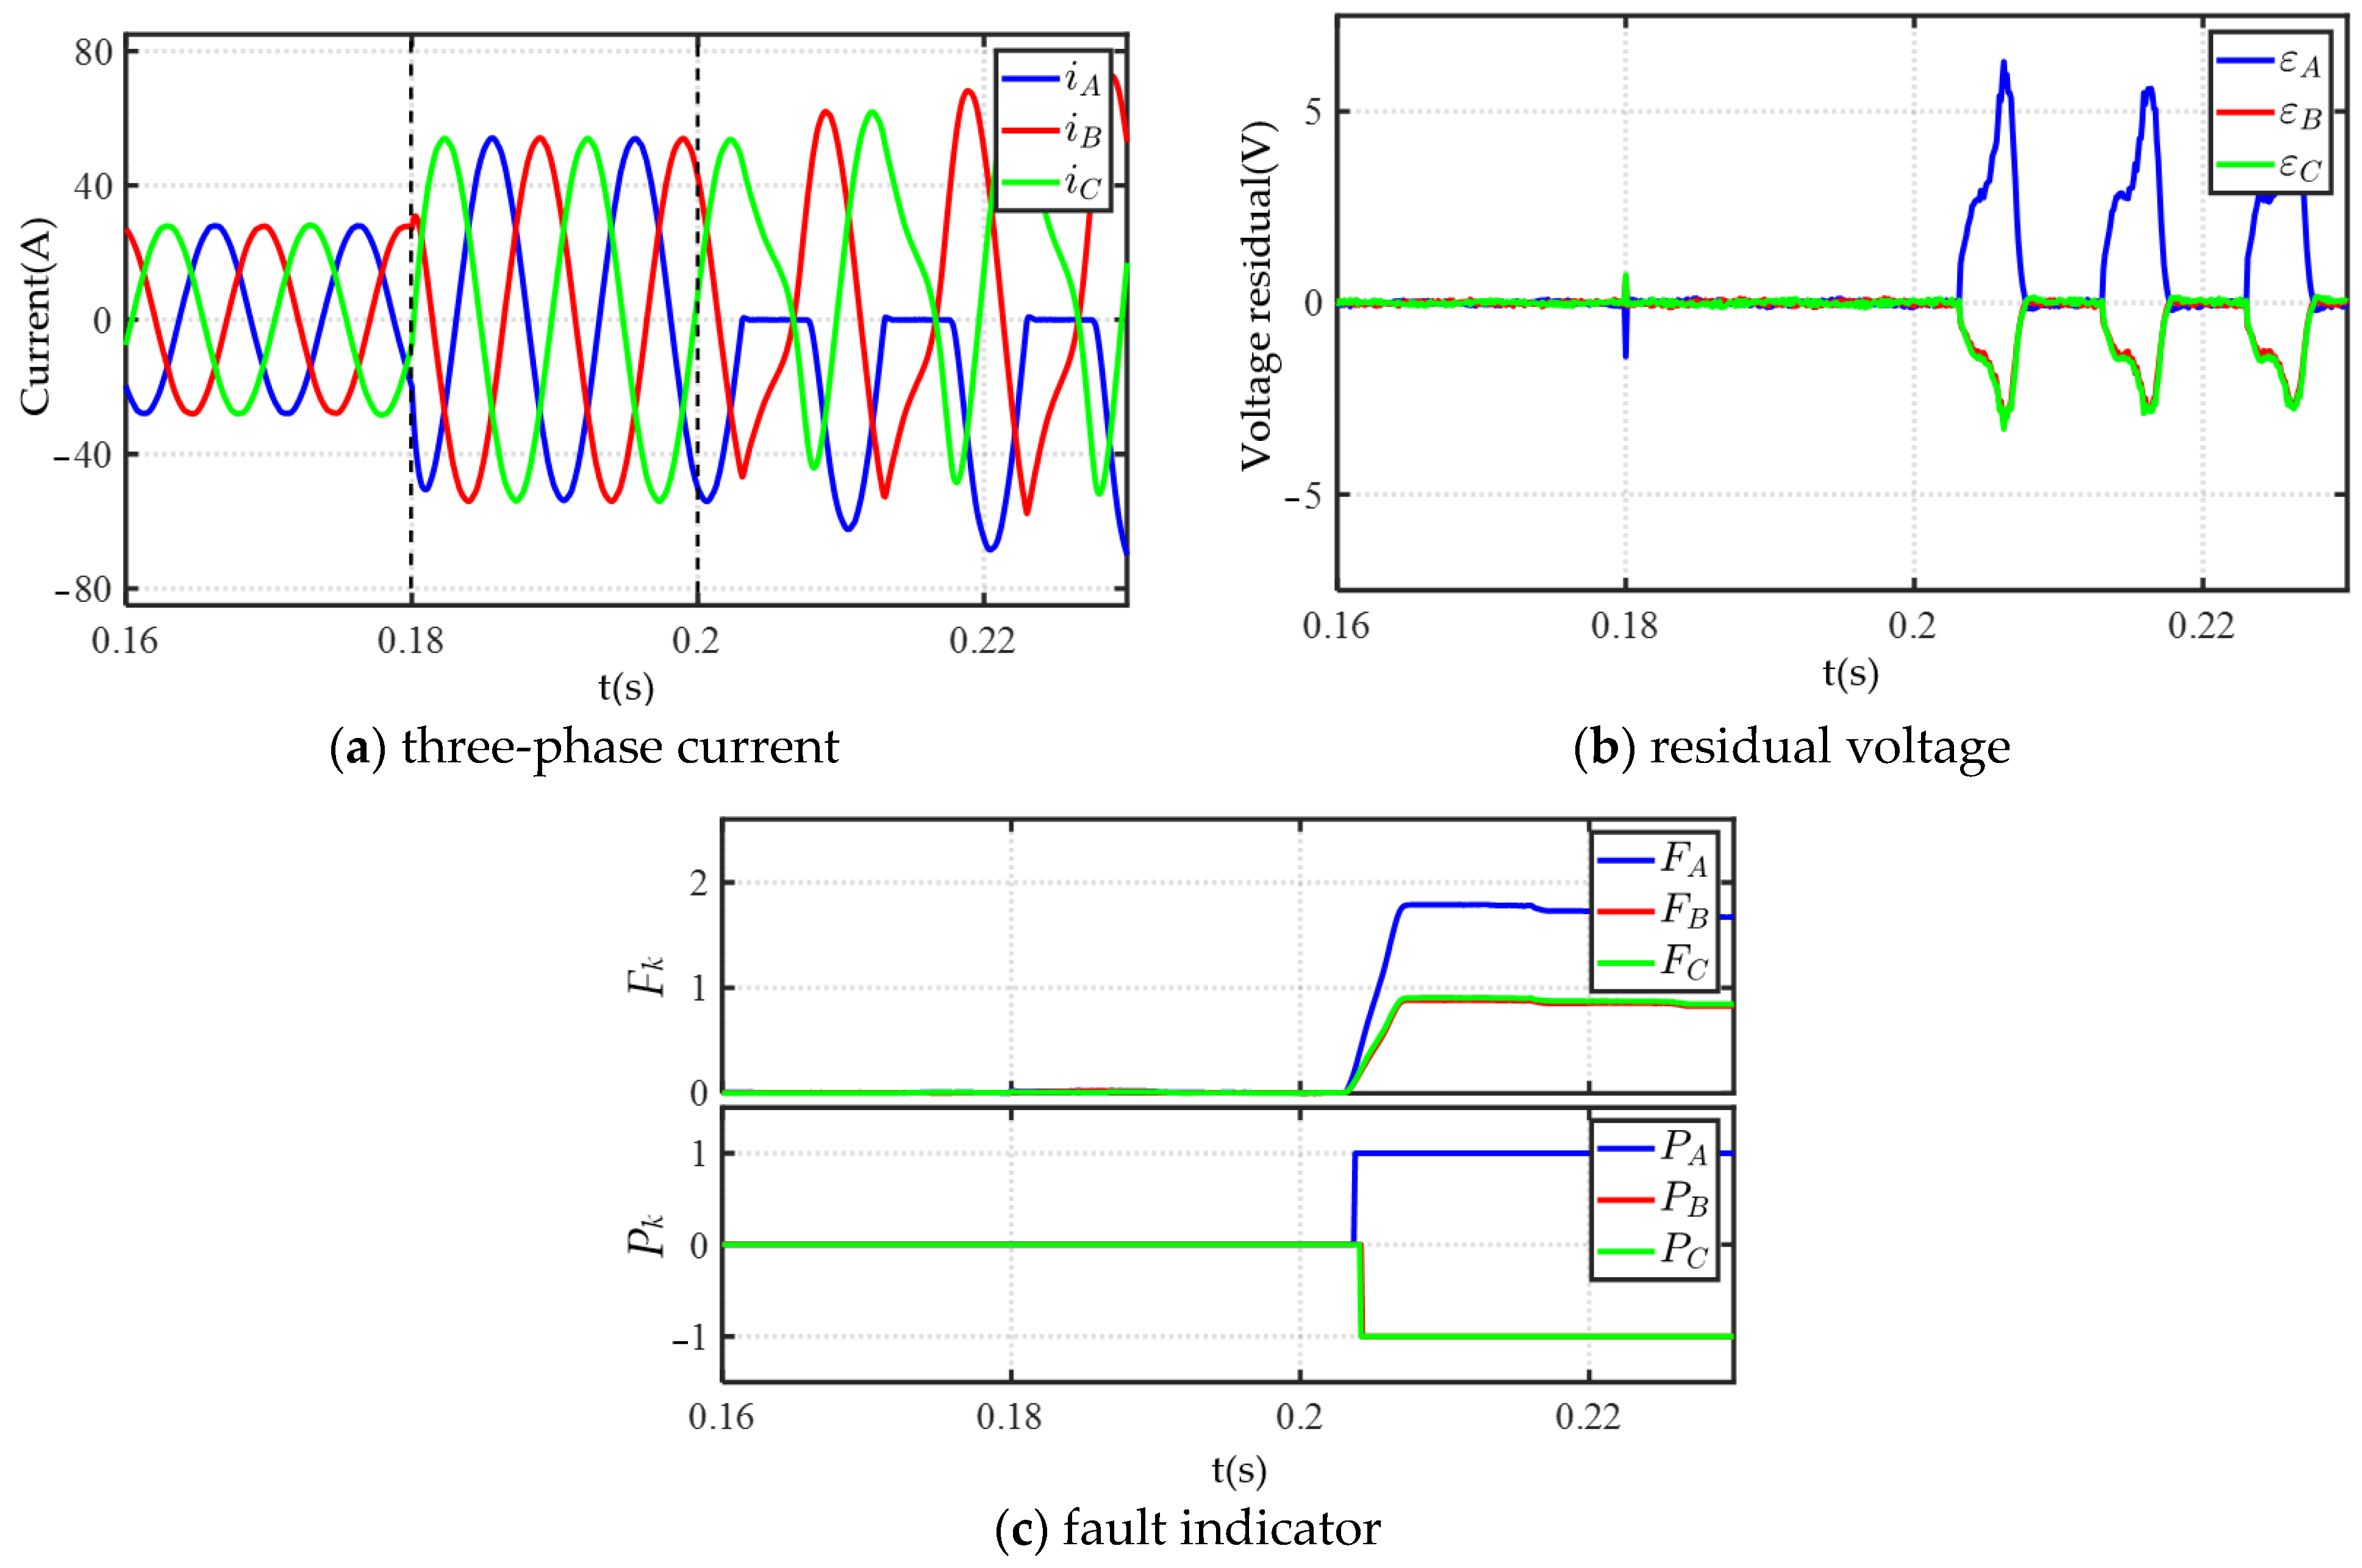
When power switch T1 open-circuit fault, the simulation results are illustrated in Figure 7. Initially, the current amplitude was 40 A. At t = 0.18 s, the current amplitude increased to 60 A. At this point, the three-phase residual voltage showed a transient fluctuation. However, it can be seen that the change in load did not cause a significant change in the fault indicator, indicating that the fault indicator signal would not be triggered. At t = 0.2 s, open-circuit occurred in T1. The phase A current was nearly zero during the positive half-cycle period, and the phases B and C currents were highly coupled, with equal amplitude and opposite polarity. During the negative half-cycle period, the fault phase current returned to normal but with an increased amplitude compared to before the fault. From the normalized three-phase residual voltage waveform presented in (b), it can be observed that the three-phase residual voltage was close to zero during the negative half-cycle period of phase A current. During the positive half-cycle period, due to the mismatch between the reference voltage vector and the actual output voltage vector, the three-phase voltage residual increased significantly. The voltage residual of phase A was positive, and the voltage residuals of phases B and C were negative and equal. It can be concluded that the fault indicator can quickly respond after the fault occurs, and the fault signal of phase A has the highest value. By combining the polarity of the residual DC current component and the fault query table, the fault can be quickly detected and the fault position can be accurately located.
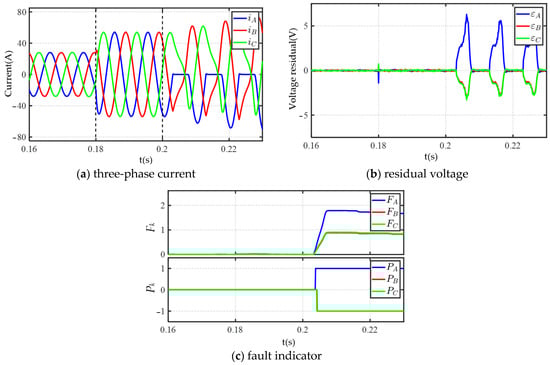
Figure 7.
Fault detection waveform.
3.2. The Influence of Observer Parameters on Fault Indicators
The fault diagnosis method proposed in this paper employs an observer to obtain the actual output voltage instead of voltage sensors. However, the observer parameters can affect the actual output three-phase voltage, making it necessary to analyze and study the impact of changes in the observer parameters. The key parameters that need to be predetermined are , , and . Here, the influence of and are mainly considered. The analysis of is similar to the .
3.2.1. The Influence of
Assuming that the resistance deviation is , then the deviation of dq-axis voltage, denoted as , , can be expressed as:
Since is a constant value, and are also constant under healthy conditions. It can be seen that the voltage residuals , , and obtained after the Park transformation only contain the fundamental component, and the DC component and second harmonic component are not affected. Therefore, the value of the fault indicators will not be affected, and the influence of resistance will not cause misdiagnosis. However, under faulty conditions, the distortion of the three-phase current leads to non-constant dq-axis currents. Consequently, both and are also non-constant. However, as long as does not have significant deviation, and are relatively small compared to and . Thus, the deviation of will not have a significant impact on the final diagnosis result.
Figure 8 illustrates the impact of 0.8 times and 1.2 times on fault indicators. It can be observed that the effect of various on fault indicator for both pre-fault and post-fault can be ignored. This indicates that the fault indicator has good robustness concerning the observer parameter .
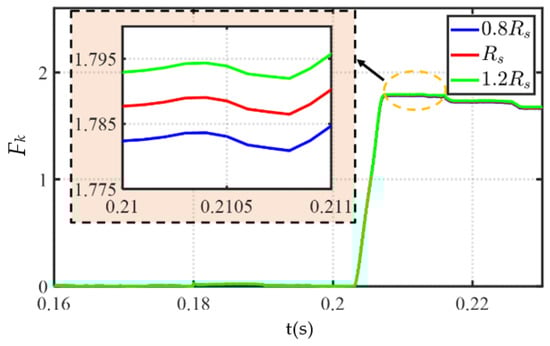
Figure 8.
Influence of different on fault indicator.
3.2.2. The Influence of
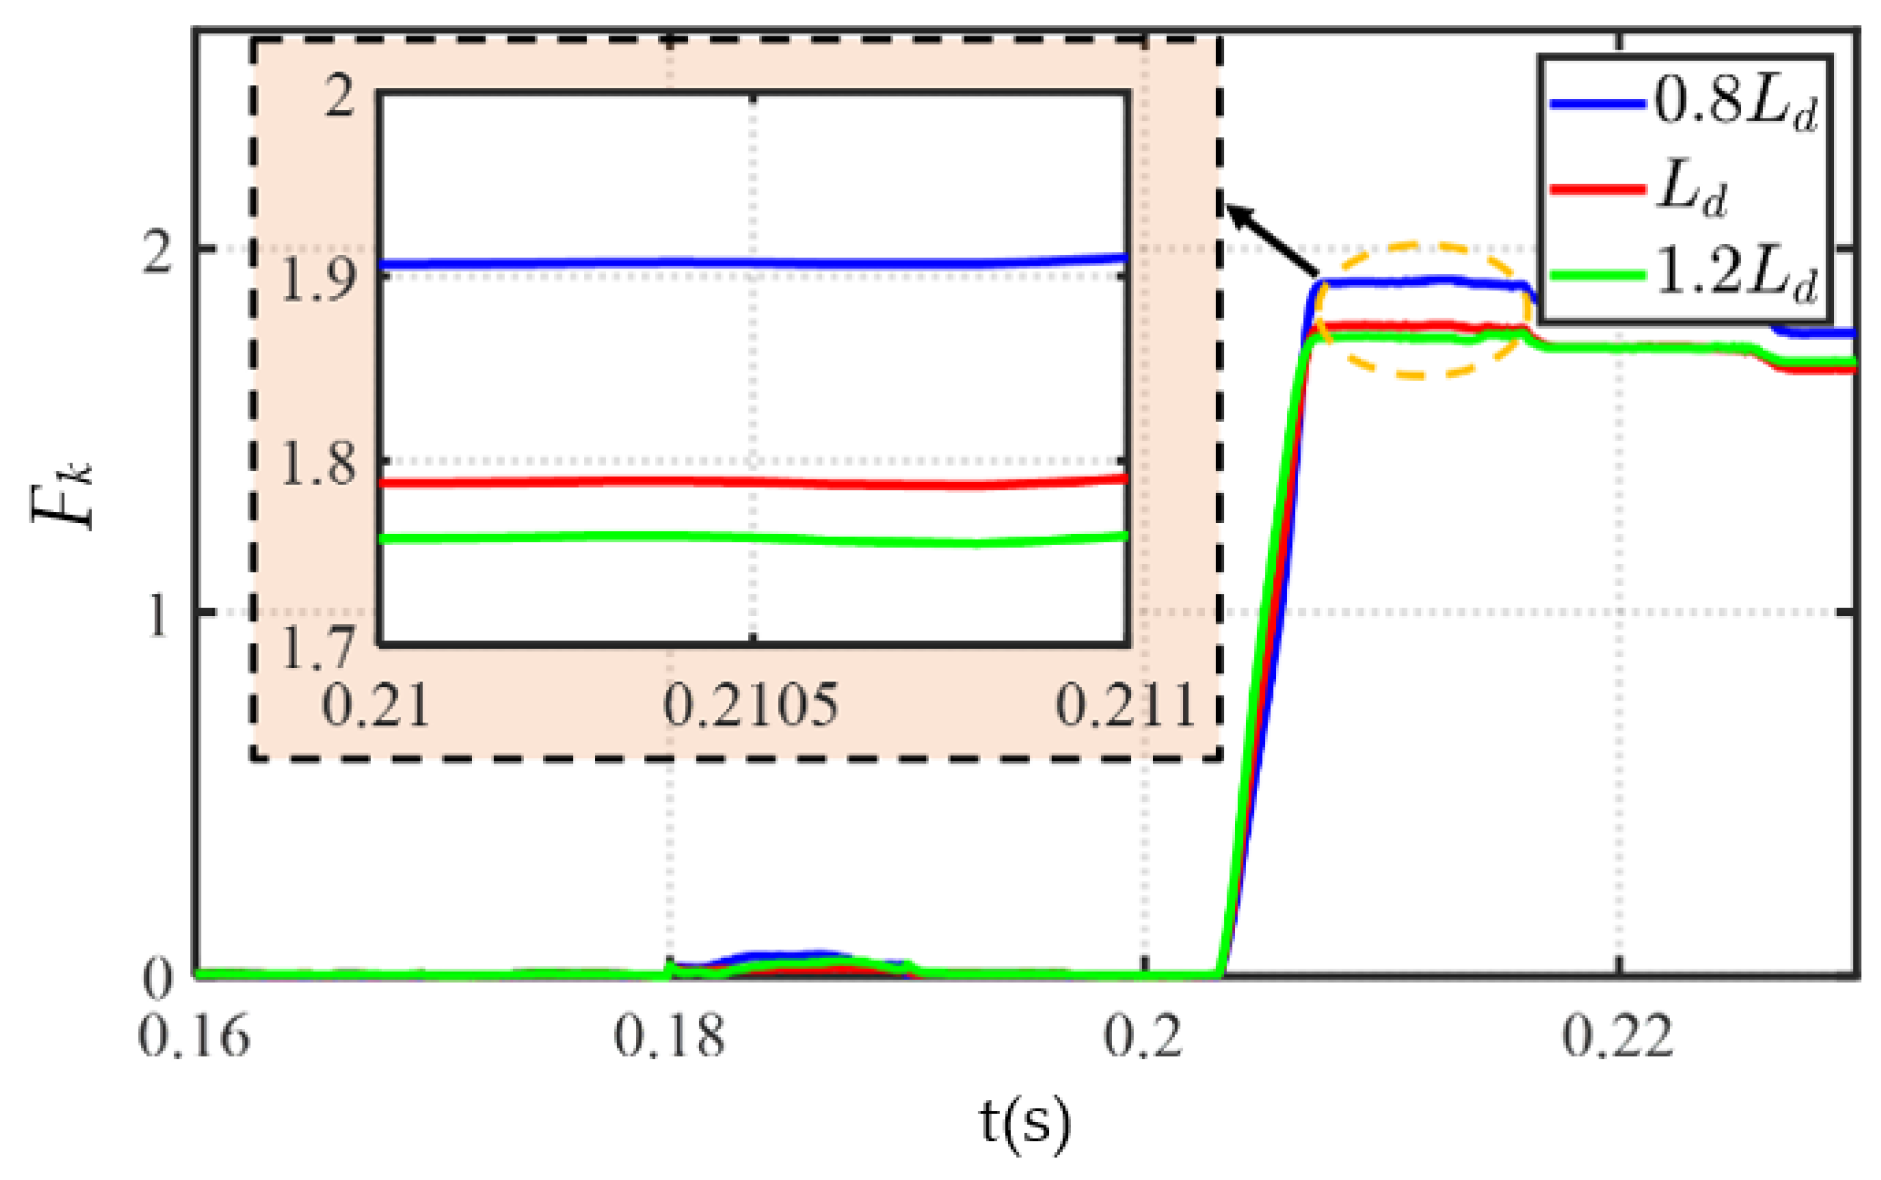
The impact of d-axis inductance also needs to be considered. Similarly, assuming that the deviation of the d-axis inductance is , then the dq-axis voltage deviation can be written as:
Similarly to the analysis of resistance, changes in inductance do not cause the malfunction of fault indicators. This is because compared to the voltage residual caused by open-circuit fault, the voltage residual caused by parameter malfunction is too small and mostly concentrated in the fundamental frequency. Figure 9 shows the influence of different on fault indicators amplitude both in the healthy and faulty conditions. From the simulation results, it can be observed that the accuracy and effectiveness of fault diagnosis method are almost not affected by .
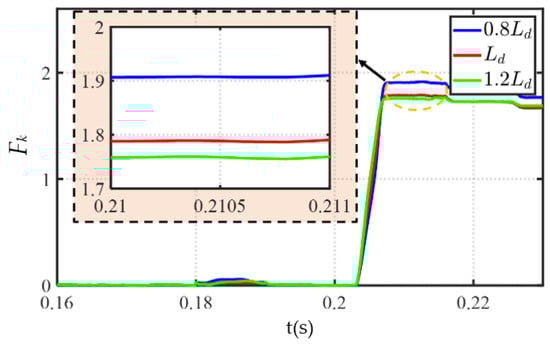
Figure 9.
Influence of different on fault indicator.
4. Experimental Results
To validate the effectiveness of the proposed inverter open-circuit fault diagnosis method, a triple-redundant PMSM experimental platform was constructed, as depicted in Figure 10. The experimental platform is mainly composed of a DC power source, a nine-phase controller, a dynamometer and a triple-redundant PMSM. The triple-redundant PMSM has three sets of three-phase winding units and is driven by independent inverters. Each winding unit is thermally, electrically, and physically isolated [21]. In the event of an open-circuit fault, the winding unit containing faulty phase can be quickly disconnected. Hence, the other two sets of three-phase winding units can continue to operate, ensuring that the system operates at a reduced capacity. During the experiments, the motor operates at the maximum torque per ampere (MTPA) point. The main parameters of the motor are presented in Table 3.
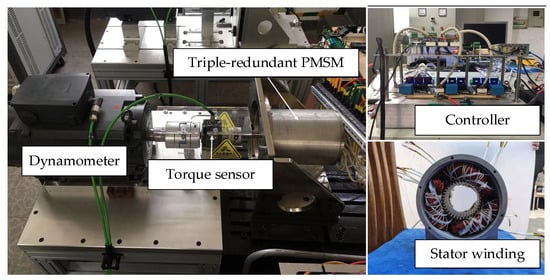
Figure 10.
Experimental platform of triple-redundant PMSM drives.
Table 3.
Leading parameters of the PMSM.
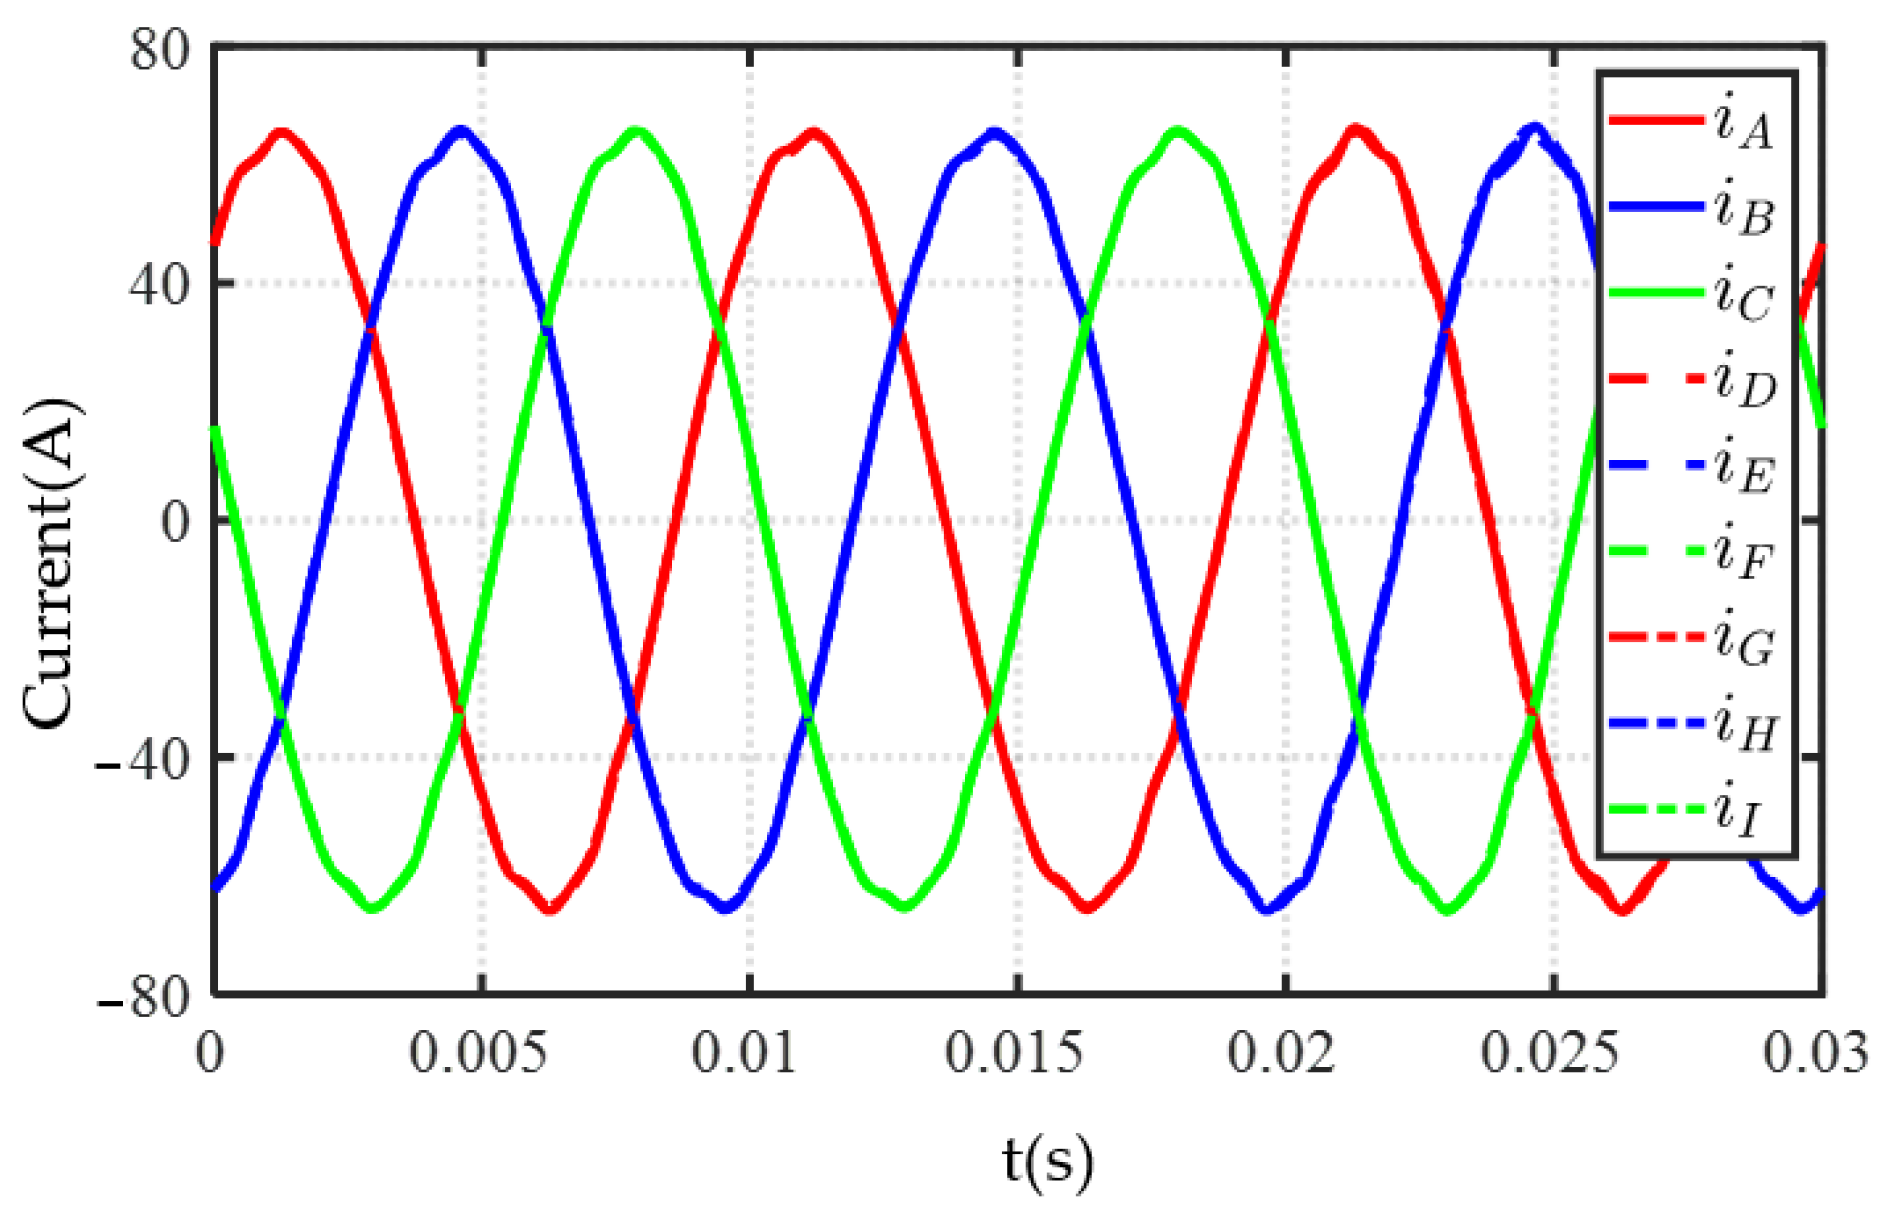
Under the rated load, the nine-phase current waveform is illustrated in Figure 11. After applying the same control strategy to the three sets of three-phase windings, the phase currents for the corresponding phases of the different winding units significantly overlap. Since the three sets of three-phase windings are entirely symmetrical, subsequent experiments primarily focus on one set of three-phase windings and the current waveforms for the other two sets of three-phase windings are not separately presented.
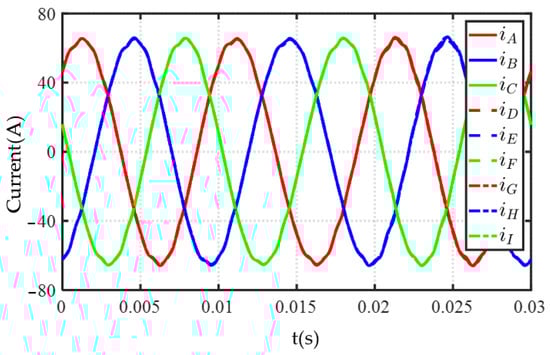
Figure 11.
The nine-phase current waveform in rated load.
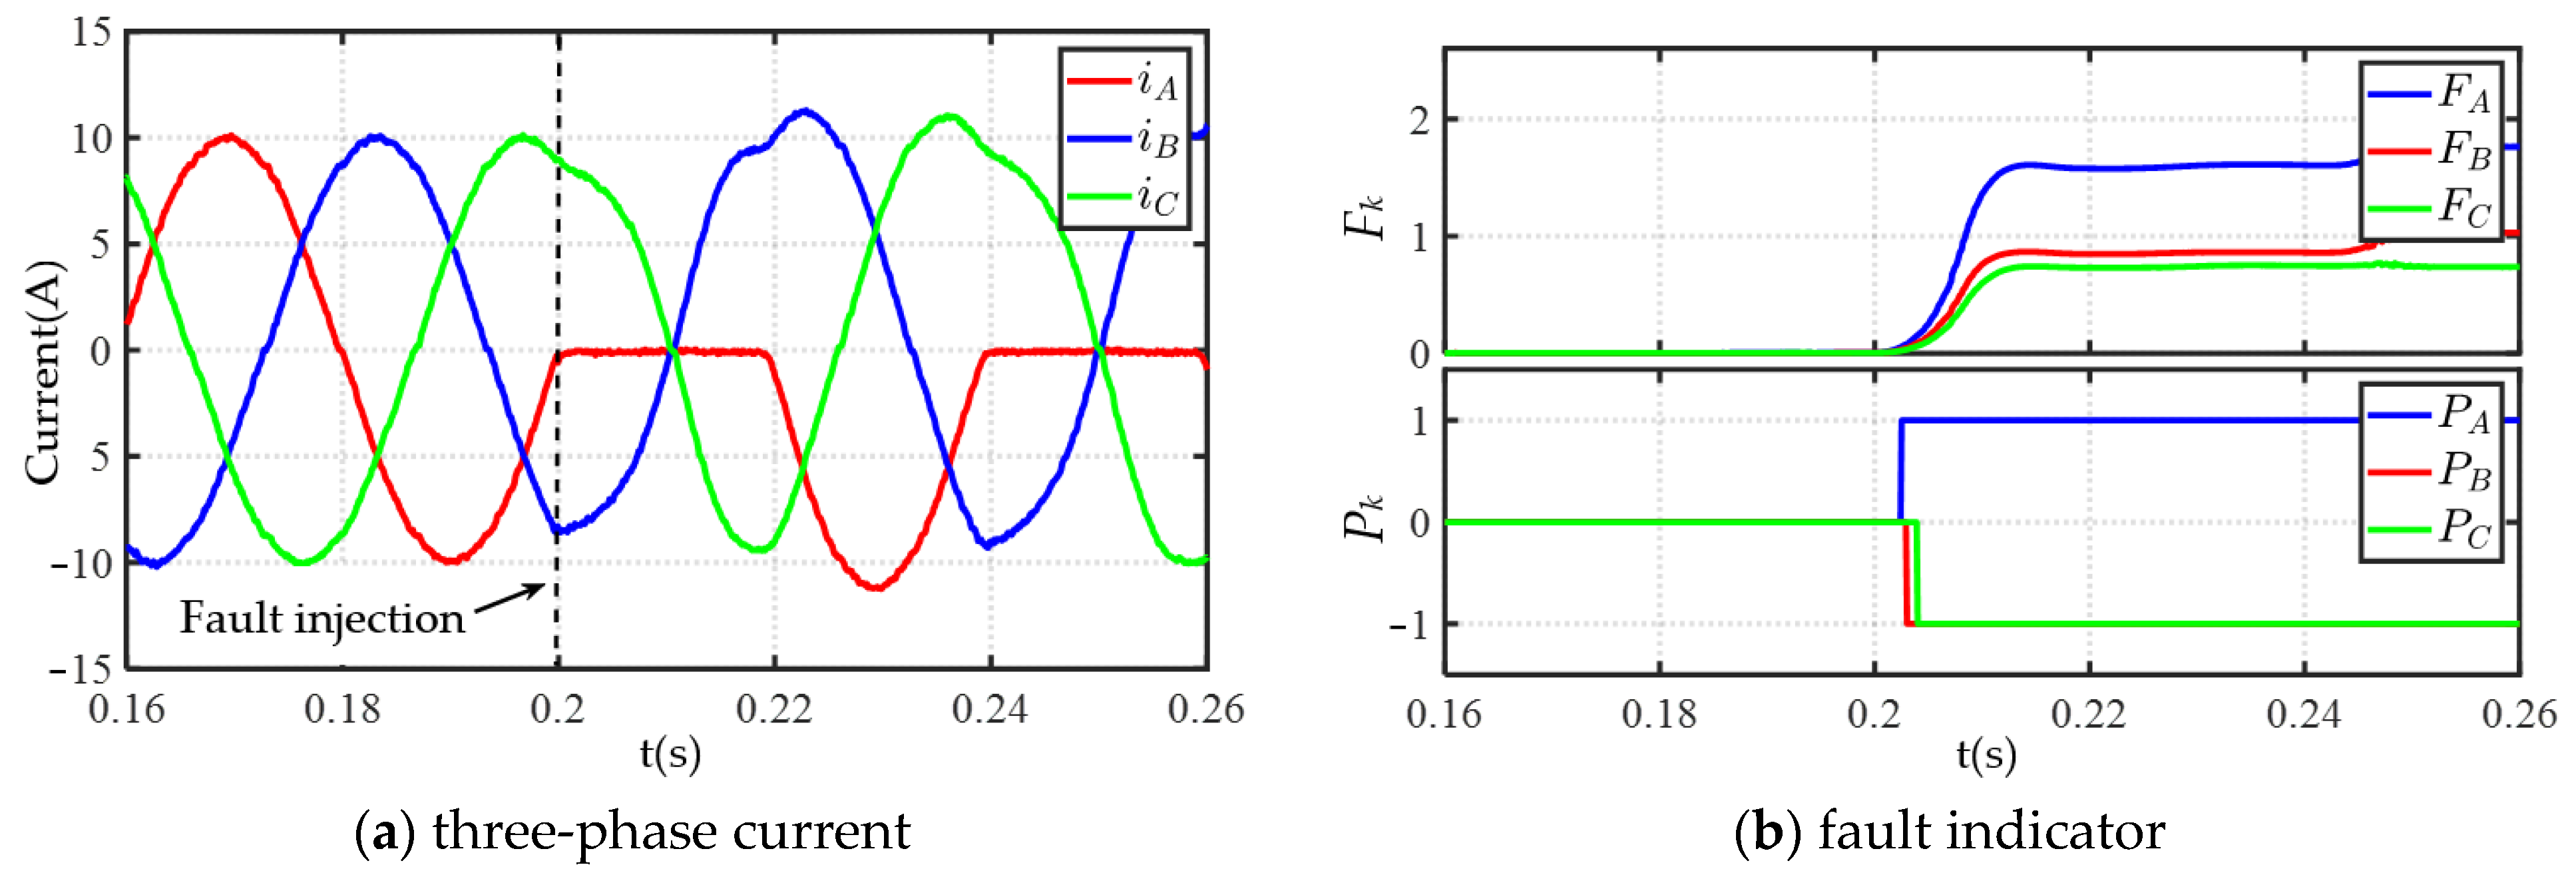
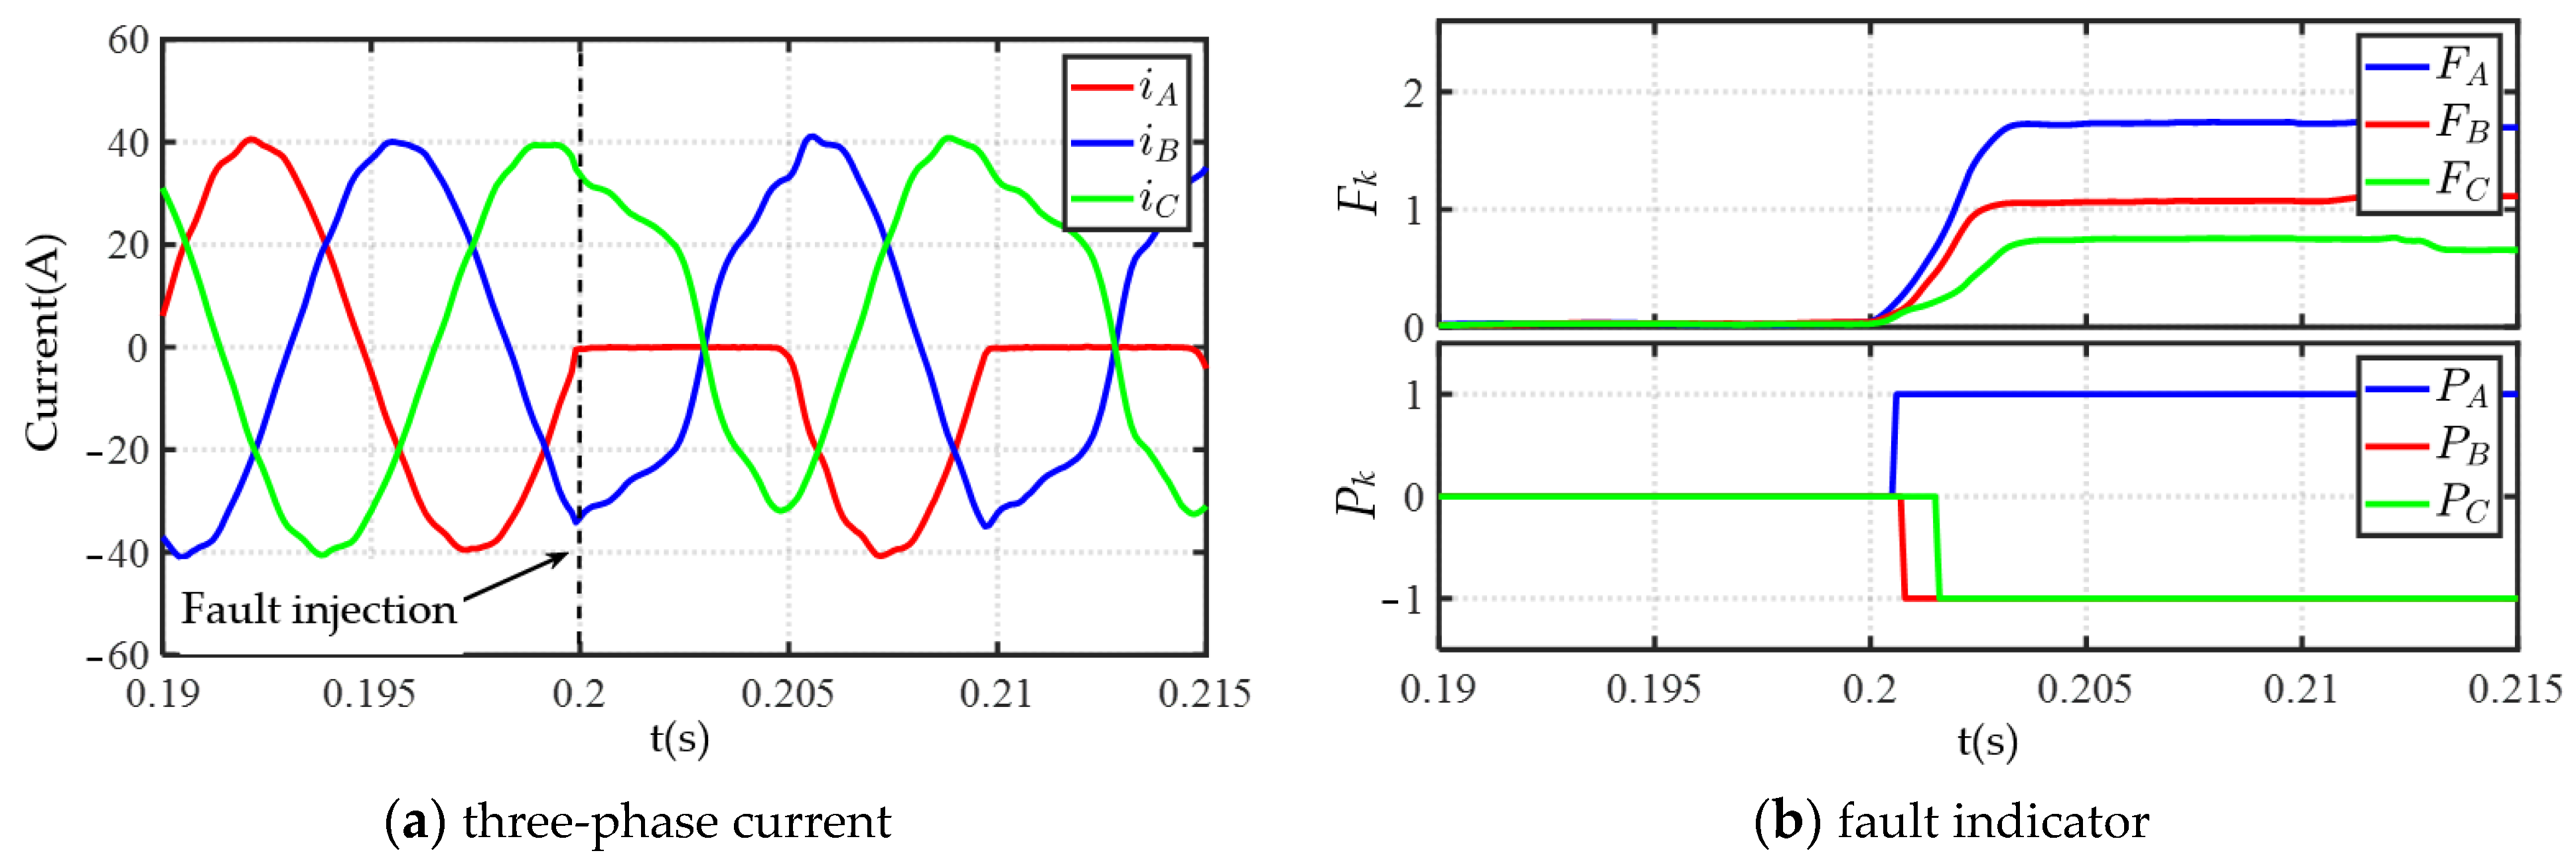
Taking the power switch T1 open-circuit fault as an example, the experiment waveforms under 500 rpm with 10 A load and 2000 rpm with 40 A load are shown in Figure 12 and Figure 13, respectively. At t = 0.2 s, the drive signal for power switch T1 was artificially turned off. The three-phase current is disturbed by the power switch open-circuit and the fault indicator will also rise quickly. Due to the highest fault indicator in phase A and the polarity of is 1, −1, −1, indicating open-circuit fault occurs in T1.
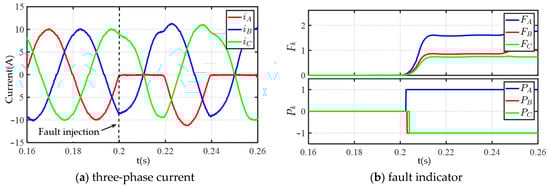
Figure 12.
Experimental waveform when the machine works at 500 rpm with 10 A load.
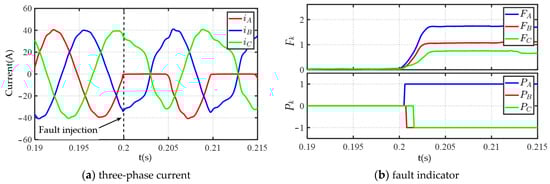
Figure 13.
Experimental waveform when the machine works at 2000 rpm with 40 A load.
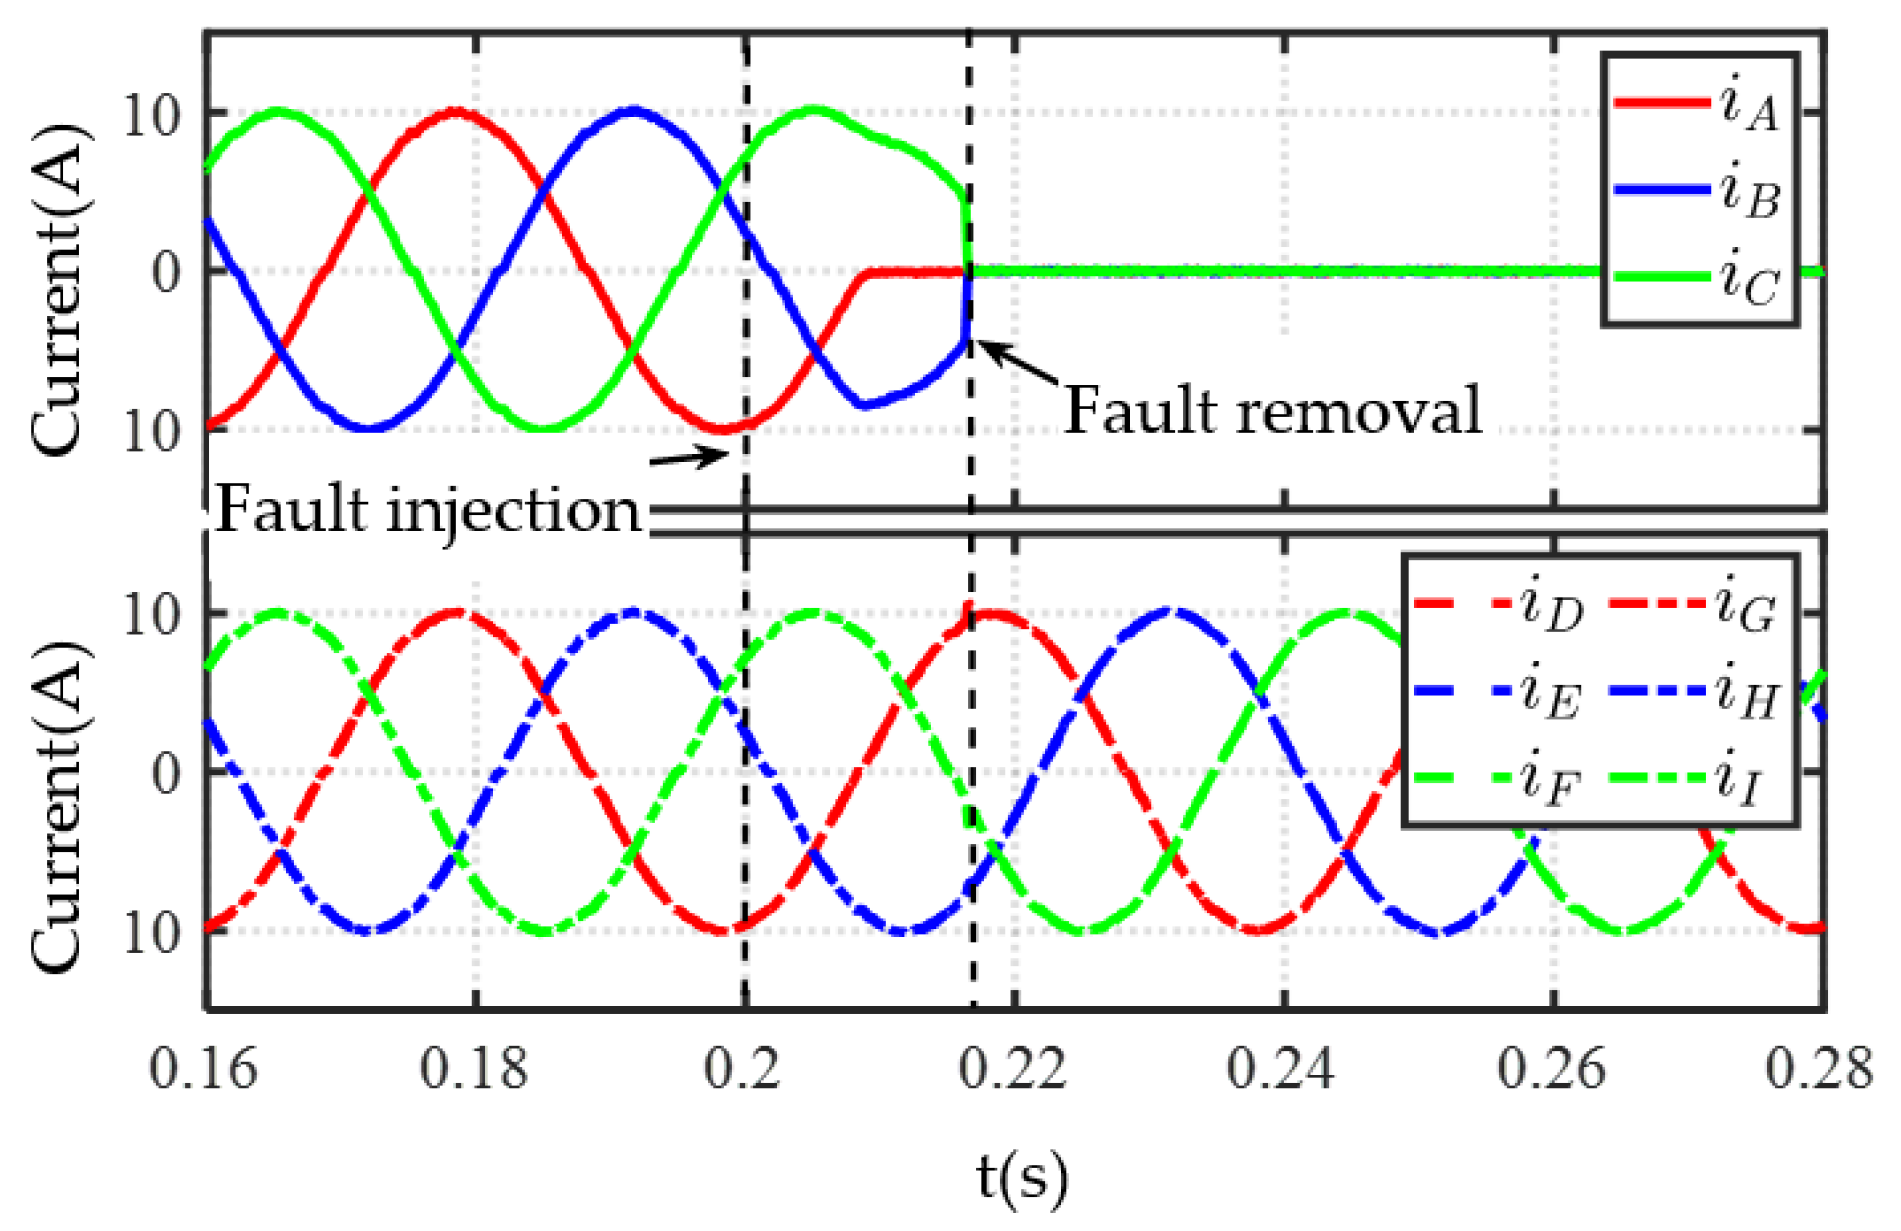
Based on the aforementioned experimental results, the experimental waveforms exhibit high consistency with the simulation results. Due to the normalization of the voltage residual, the fault indicator can respond quickly and remain stable even under low-speed and light-load conditions. After accurately identifying the faulty power switch via the fault query table, the control system will automatically removal the faulty three-phase winding and allow the other two sets of three-phase windings to continue operating without compromising system functionality. The nine-phase current waveforms during fault diagnosis and fault removal are shown in Figure 14, illustrating that the fault diagnosis and faulty winding removal under different load conditions are completed within one electrical cycle.
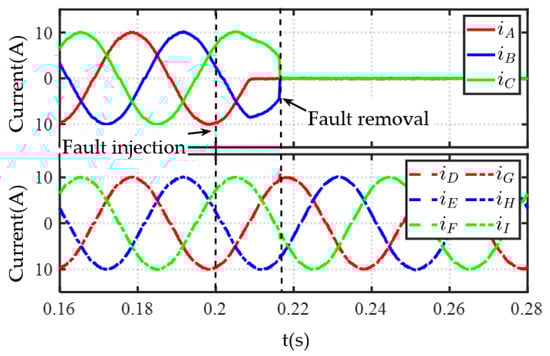
Figure 14.
Nine-phase current waveform during fault diagnosis and fault removal.
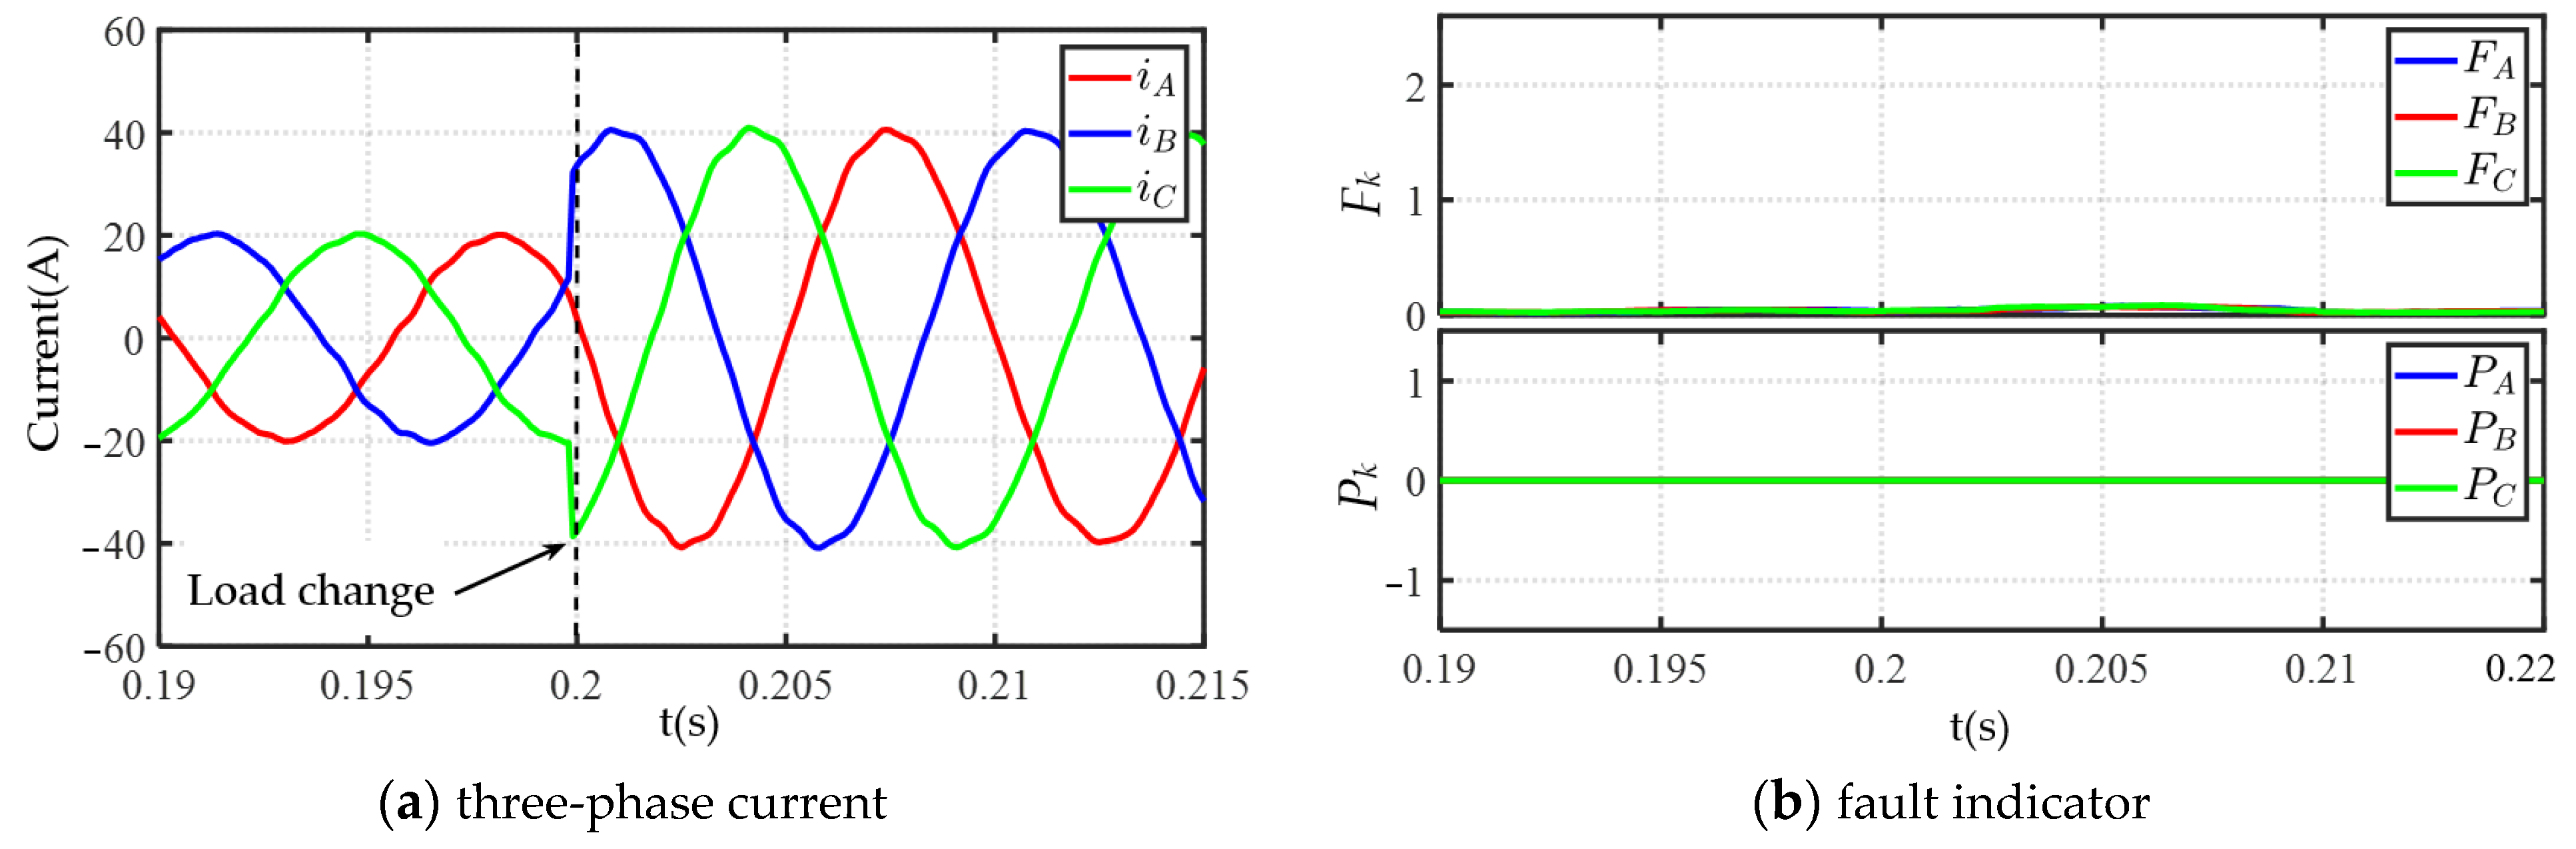
To further evaluate the robustness of the proposed fault indicator, loading experiments were also conducted, as depicted in Figure 15. It can be seen that despite the increase in three-phase current, the fault indicator basically remains constant, avoiding misdiagnosis and false triggering. Therefore, the proposed diagnosis method exhibits excellent robustness to load disturbance.
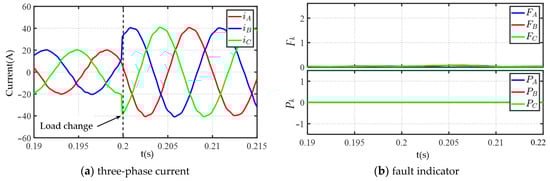
Figure 15.
Experimental waveform in variable load conditions.
Table 4 presents a comparison between the existing methods and the fault diagnosis method proposed in this paper. The results show that the fault diagnosis method proposed in this paper has the potential to be a robust, fast, and versatile approach.
Table 4.
Comparisons of proposed diagnosis method and the present methods.
5. Conclusions
This paper presents a novel fault diagnosis method for detecting a power switch open-circuit fault. The method analyzes the characteristic of the residual voltage after the fault occurs and constructs a fault indicator signal based on the DC component and second harmonic component of the residual voltage. The polarity of the DC component is used to determine the fault location. By utilizing the motor model and phase current to obtain the observed voltage, the need for additional voltage sensors is eliminated. Normalization of the residual voltages is used to eliminate the influence of the load changes on the diagnosis results, thereby improving the robustness of the diagnosis method. The problem of parameter mismatch has also been analyzed and resolved. Simulation and experimental results demonstrate that the proposed method offers fast diagnosis speed, high robustness, and low algorithm complexity.
Author Contributions
The supervision, review, and editing of the papers is mainly carried out by B.W. X.F. is responsible for the writing of the methodology, simulation verification, and experiments in the paper. R.W. is responsible for the experimental test and code validation. All authors have read and agreed to the published version of the manuscript.
Funding
This work was supported in part by Jiangsu Carbon Peak Carbon Neutralization Science and Technology Innovation Special Fund under Grant BE2022032-1; in part by the National Natural Science Foundation of China under Grant 51991382, and Grant 52277035; in part by the “SEU Zhishan Young Scholars” Program of Southeast University.
Data Availability Statement
No new data were created or analyzed in this study. Data sharing is not applicable to this article.
Conflicts of Interest
The authors declare no conflict of interest.
References
- Ni, Q.; Li, X.; Chen, Z.; Zhao, Z.; Lai, L.L. A Mechanism and Data Hybrid-Driven Method for Main Circuit Ground Fault Diagnosis in Electrical Traction System. IEEE Trans. Ind. Electron. 2023, 70, 12806–12815. [Google Scholar] [CrossRef]
- Guo, H.; Guo, S.; Xu, J.; Tian, X. Power Switch Open-Circuit Fault Diagnosis of Six-Phase Fault Tolerant Permanent Magnet Synchronous Motor System Under Normal and Fault-Tolerant Operation Conditions Using the Average Current Park’s Vector Approach. IEEE Trans. Power Electron. 2021, 36, 2641–2660. [Google Scholar] [CrossRef]
- Choi, J.-H.; Kim, S.; Yoo, D.S.; Kim, K.-H. A Diagnostic Method of Simultaneous Open-Switch Faults in Inverter-Fed Linear Induction Motor Drive for Reliability Enhancement. IEEE Trans. Ind. Electron. 2015, 62, 4065–4077. [Google Scholar] [CrossRef]
- Jlassi, I.; Estima, J.O.; El Khil, S.K.; Bellaaj, N.M.; Cardoso, A.J.M. A Robust Observer-Based Method for IGBTs and Current Sensors Fault Diagnosis in Voltage-Source Inverters of PMSM Drives. IEEE Trans. Ind. Appl. 2017, 53, 2894–2905. [Google Scholar] [CrossRef]
- Wang, X.; Wang, Z.; Xu, Z.; He, J.; Zhao, W. Diagnosis and Tolerance of Common Electrical Faults in T-Type Three-Level Inverters Fed Dual Three-Phase PMSM Drives. IEEE Trans. Power Electron. 2020, 35, 1753–1769. [Google Scholar] [CrossRef]
- Wang, X.; Wang, Z.; Gu, M.; Xiao, D.; He, J.; Emadi, A. Diagnosis-Free Self-Healing Scheme for Open-Circuit Faults in Dual Three-Phase PMSM Drives. IEEE Trans. Power Electron. 2020, 35, 12053–12071. [Google Scholar] [CrossRef]
- Zhou, X.; Sun, J.; Cui, P.; Lu, Y.; Lu, M.; Yu, Y. A Fast and Robust Open-Switch Fault Diagnosis Method for Variable-Speed PMSM System. IEEE Trans. Power Electron. 2021, 36, 2598–2610. [Google Scholar] [CrossRef]
- Lu, B.; Sharma, S.K. A Literature Review of IGBT Fault Diagnostic and Protection Methods for Power Inverters. IEEE Trans. Ind. Appl. 2009, 45, 1770–1777. [Google Scholar] [CrossRef]
- Huang, W.; Du, J.; Hua, W.; Lu, W.; Bi, K.; Zhu, Y.; Fan, Q. Current-Based Open-Circuit Fault Diagnosis for PMSM Drives with Model Predictive Control. IEEE Trans. Power Electron. 2021, 36, 10695–10704. [Google Scholar] [CrossRef]
- Xu, J.; Guo, S.; Guo, H.; Tian, X. A Novel Diagnostic Method for Single and Dual Power Switch Open-Circuit Faults of Six-Phase FTPMSM System Even in Fault Tolerant Operation. IEEE Trans. Power Electron. 2022, 37, 9777–9789. [Google Scholar] [CrossRef]
- Yan, H.; Xu, Y.; Zou, J.; Fang, Y.; Cai, F. A Novel Open-Circuit Fault Diagnosis Method for Volt-age Source Inverters with a Single Current Sensor. IEEE Trans. Power Electron. 2018, 33, 8775–8786. [Google Scholar] [CrossRef]
- Hang, J.; Shu, X.; Ding, S.; Huang, Y. Robust Open-Circuit Fault Diagnosis for PMSM Drives Using Wavelet Convolutional Neural Network With Small Samples of Normalized Current Vector Trajectory Graph. IEEE Trans. Ind. Electron. 2023, 70, 7653–7663. [Google Scholar] [CrossRef]
- An, Q.-T.; Sun, L.; Sun, L.-Z. Current Residual Vector-Based Open-Switch Fault Diagnosis of Inverters in PMSM Drive Systems. IEEE Trans. Power Electron. 2015, 30, 2814–2827. [Google Scholar] [CrossRef]
- Tang, H.; Li, W.; Wu, Z. Influence of Inverter Open Circuit Fault on Multiple Physical Quantities in the PMSM. IEEE Trans. Power Electron. 2023, 38, 901–916. [Google Scholar] [CrossRef]
- Estima, J.O.; Cardoso, A.J.M. A New Approach for Real-Time Multiple Open-Circuit Fault Diagnosis in Voltage-Source Inverters. IEEE Trans. Ind. Appl. 2011, 47, 2487–2494. [Google Scholar] [CrossRef]
- Li, Z.; Ma, H.; Bai, Z.; Wang, Y.; Wang, B. Fast Transistor Open-Circuit Faults Diagnosis in Grid-Tied Three-Phase VSIs Based on Average Bridge Arm Pole-to-Pole Voltages and Error-Adaptive Thresholds. IEEE Trans. Power Electron. 2018, 33, 8040–8051. [Google Scholar] [CrossRef]
- An, Q.-T.; Sun, L.-Z.; Zhao, K.; Sun, L. Switching Function Model-Based Fast-Diagnostic Method of Open-Switch Faults in Inverters without Sensors. IEEE Trans. Power Electron. 2011, 26, 119–126. [Google Scholar] [CrossRef]
- Jiang, C.; Liu, H.; Wheeler, P.; Wu, F.; Cai, Z.; Huo, J. A Novel Open-Circuit Fault Detection and Location for Open-End Winding PMSM Based on Differential-Mode Components. IEEE Trans. Ind. Electron. 2022, 69, 7776–7786. [Google Scholar] [CrossRef]
- Hang, J.; Zhang, J.; Cheng, M.; Ding, S. Detection and Discrimination of Open Phase Fault in Permanent Magnet Synchronous Motor Drive System. IEEE Trans. Power Electron. 2016, 31, 4697–4709. [Google Scholar] [CrossRef]
- Nemec, M.; Nedeljkovic, D.; Drobnic, K.; Ambrozic, V. Direct Current Control of a multi-pole synchronous machine. In Proceedings of the 2008 IEEE International Symposium on Industrial Electronics, Cambridge, UK, 30 June–2 July 2008; pp. 515–519. [Google Scholar]
- Wang, B.; Wang, J.; Sen, B.; Griffo, A.; Sun, Z.; Chong, E. A Fault-Tolerant Machine Drive Based on Permanent Magnet-Assisted Synchronous Reluctance Machine. IEEE Trans. Ind. Appl. 2018, 54, 1349–1359. [Google Scholar] [CrossRef]


Disclaimer/Publisher’s Note: The statements, opinions and data contained in all publications are solely those of the individual author(s) and contributor(s) and not of MDPI and/or the editor(s). MDPI and/or the editor(s) disclaim responsibility for any injury to people or property resulting from any ideas, methods, instructions or products referred to in the content. |
© 2023 by the authors. Licensee MDPI, Basel, Switzerland. This article is an open access article distributed under the terms and conditions of the Creative Commons Attribution (CC BY) license (https://creativecommons.org/licenses/by/4.0/).