Article

Numerical Study of a High-Temperature Latent Heat Thermal Energy Storage Device with AlSi12 Alloy

1
Global Energy Interconnection Research Institute Europe GmbH, 10623 Berlin, Germany
2
Jining Electric Power Supply Company, State Grid Shandong Electric Power Company, Jining 272000, China
3
Birmingham Center for Energy Storage, University of Birmingham, Birmingham B15 2TT, UK
*
Author to whom correspondence should be addressed.
Energies 2023, 16(15), 5729; https://doi.org/10.3390/en16155729
Submission received: 31 May 2023 / Revised: 15 July 2023 / Accepted: 21 July 2023 / Published: 31 July 2023
(This article belongs to the Special Issue Advances in Thermal Energy Storage and Applications)

Abstract

:
This paper explores the potential of thermal storage as an energy storage technology with cost advantages. The study uses numerical simulations to investigate the impact of adding porous material to the HTF side during solidification to improve the heat transfer effect of TES using AlSi 12 alloy as the phase-change material. The research also examines the effects of adding porous dielectric materials and increasing air velocity on the discharge temperature, discharge power, and discharge time of high-temperature phase-change energy storage systems. The study found that the temperature difference of the PCM (increased), solidification time (reduced more than 85%), the outlet temperature of the air, and heat discharge power of the LHS did not vary significantly across different porous materials (copper foam, nickel foam, and silicon carbide foam) added to the HTF tube. These findings offer important information for the design of high-temperature phase-change energy storage devices and can guide future developments in this field.

1. Introduction

Numerous countries across the globe have implemented and expanded renewable energy sources as a means of tackling climate challenges and promoting sustainable development [1]. However, one of the main problems with renewable energy generation is its intermittency [2], which leads to energy storage becoming an integral part of renewable energy systems [3]. Thermal energy storage (TES) is an important form of energy storage due to its lower cost compared to electrical energy storage. Thermal energy storage technologies include sensible heat storage (SHS), latent heat storage (LHS), and thermochemical energy storage (THS) [4]. LHS devices use phase-change materials (PCMs) as thermal energy storage media; as the PCMs phase change, thermal energy is stored in or released from the LHS device [5]. Thermal conductivity is a critical aspect of PCM-based LHS systems [6]. Three things are essential for LHS: firstly, suitable PCMs; secondly, suitable PCM containers; thirdly, the right heat exchanger. Therefore, for LHS, in addition to the selection of the heat exchange [7], improving the thermal conductivity of the PCM and optimising the structure of the LHS unit are also the main methods to improve the performance of the LHS [8].
Metal phase-change materials (mPCMs) have high thermal conductivity and high thermal storage density compared to other phase-change materials [9]. Due to the excellent thermal conductivity of phase-change materials (PCMs), no further enhancement of heat transfer is required within the PCM itself. The heat transfer between the PCM and the HTFs becomes the primary limiting factor for the power dissipation of PCM-based systems. Optimizing the structure of the LHS unit has the potential to further improve the heat transfer performance of LHS with mPCMs. However, there has been less research into the improved heat transfer of metallic PCMs with better thermal conductivity. Therefore, it is necessary to enhance the heat transfer performance between the PCM and the heat transfer fluid in order to improve the power dissipation capability of PCM-based materials.
Shell and tube heat exchangers are the most commonly used heat transfer devices for LHS [7]. Fragnito et al. [10] conducted an experimental and numerical study to investigate the thermal performance of a vertical shell and tube heat exchanger containing a biological phase-change material (PCM) connected to a water-chiller system. Equation (1) represents the basic principle of heat transfer, and the key to increasing the heat transfer rate lies in the three parameters K c h , A, and Δ t :
Φ = K c h A Δ t
where Φ is the heat transfer rate in W, K c h is the heat transfer coefficient between the hot and cold objects in W·m 2 · K 1 , A is the heat transfer area in m 2 , and Δ t is the temperature difference in heat transfer in K. For the LHS, the primary approach to enhance the heat transfer rate is to increase the thermal conductivity of the phase-change material (PCM), expand the heat transfer area, and improve the uniformity of the heat transfer process, as mentioned in Reference [11]. Much research has been done on enhancing the thermal conductivity of PCM, in which [12,13,14,15,16,17] is the addition of porous materials to PCM to improve the thermal conductivity of PCM. The most common method of increasing the convective heat transfer area is to use fins [18,19,20,21]. In addition to these two aspects, improving the uniformity of the heat transfer process will also improve the thermal conductivity of the LHS [22]. For enhancing the thermal conductivity of the LHS, porous materials are mainly added to the PCM side to improve the thermal conductivity of the PCM while increasing the heat transfer area. There has been relatively little research into enhancing heat transfer by adding porous materials to the HTF side to increase the heat transfer area. Moreover, most of the studies on enhancing heat transfer in LHS have focused on heating PCM with high-temperature fluid to observe the melting process of PCM, while this paper focuses on cooling PCM with low-temperature fluid to simulate the solidification process of PCM.
Therefore, this paper focuses on the addition of porous materials on the HTF side during the solidification of the phase-change metal Al-Si alloy to improve the heat transfer of TES with AlSi 12 alloy as the phase-change material. Combining experimental and numerical simulation methods is an efficient approach in the field of phase-change materials [23,24], as demonstrated by the research of Li et al. [25]. However, for phase-change materials such as Al-Si alloy, which has relatively high phase-change temperatures, conducting experiments becomes challenging. Numerical simulation is an important method for studying latent heat storage devices. Compared with experimental methods, it has the advantage of low cost, short time, and easy-to-adjust parameters [26]. In this study, we employed numerical simulations to investigate the effects of incorporating porous media materials and increasing the air velocity on the thermal performance of high-temperature phase-change energy storage systems. Specifically, we examined the impact of these factors on the outlet temperature, heat discharge power, and heat discharge time. The obtained results provide valuable insights for the design of high-temperature phase-change energy storage devices, offering guidance and direction for future developments.

2. Numerical Simulation

2.1. Physical Model

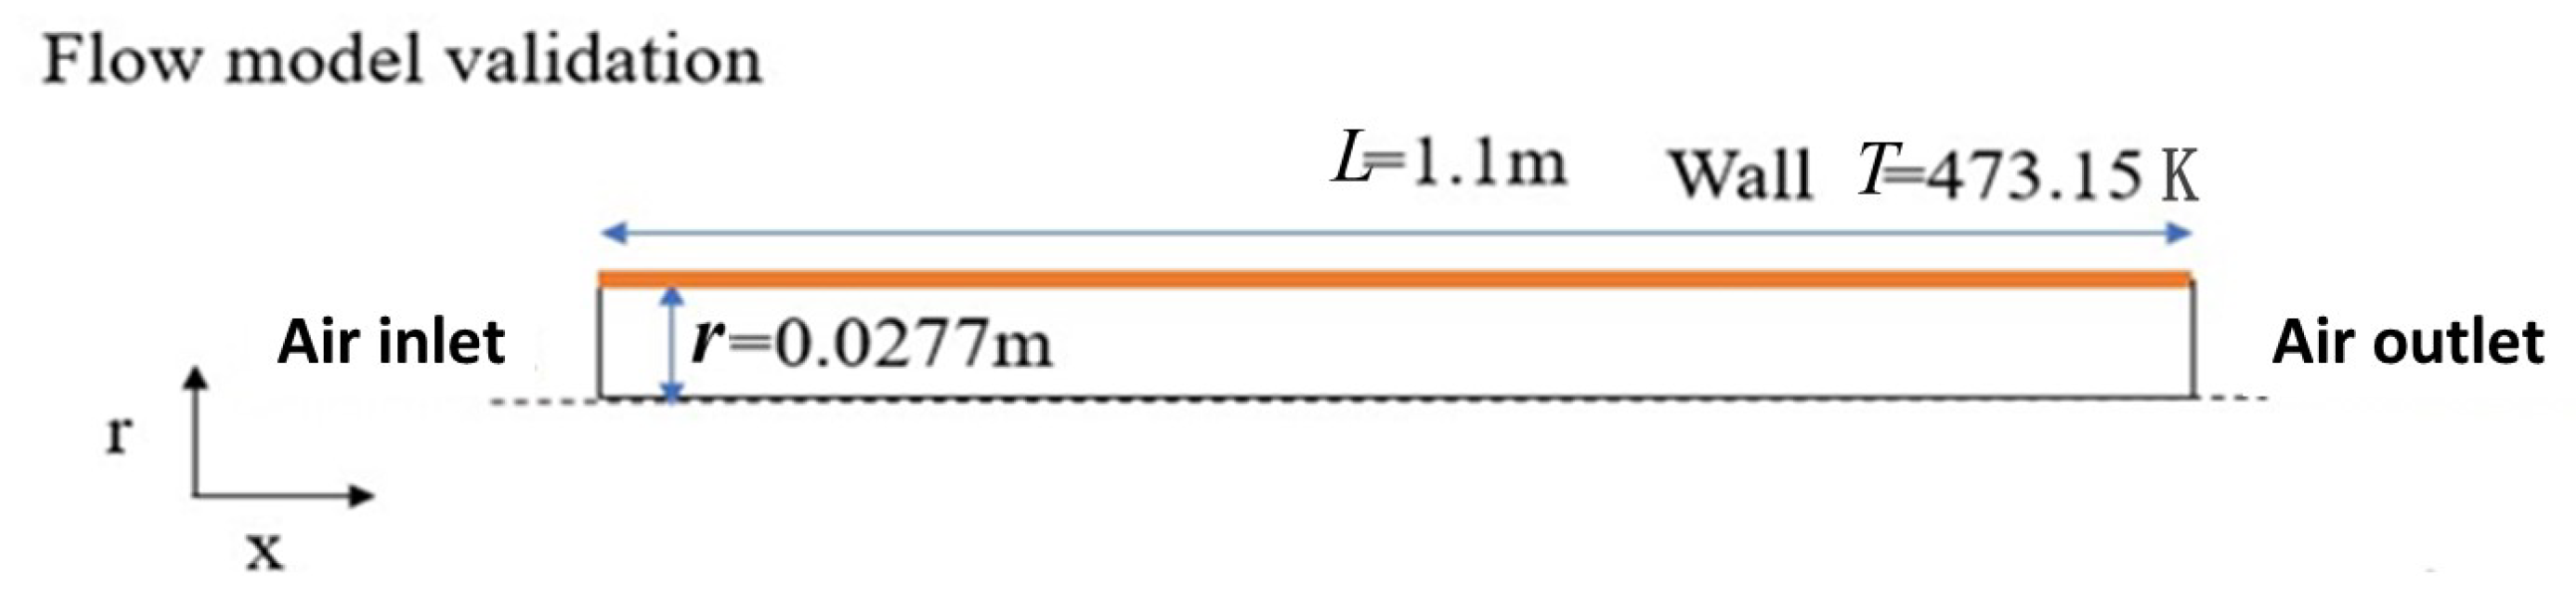
2.1.1. Dimensions of the Physical Model

This study simulates the solidification process of AlSi 12 alloy in a latent heat thermal energy storage (LHS) system, cooled by a low-temperature heat transfer fluid (HTF). As shown in Figure 1a, the heat exchanger section of the LHS has HTF air flowing inside a tube and the phase-change material (PCM) stored in a shell outside. HTF is injected at the top and exits at the bottom of the LHS. In the air tube, the porous material can be added to enhance the discharge performance of the LHS. A two-dimensional axisymmetric model is shown in Figure 1b,c with and without porous material. In the model, the LHS tube has a length ( L 1 ) of 0.2 m and a radius (R) of 0.1 m; the air tube has a length ( L 2 ) of 0.28 m and radius (r) of 0.0277 m.

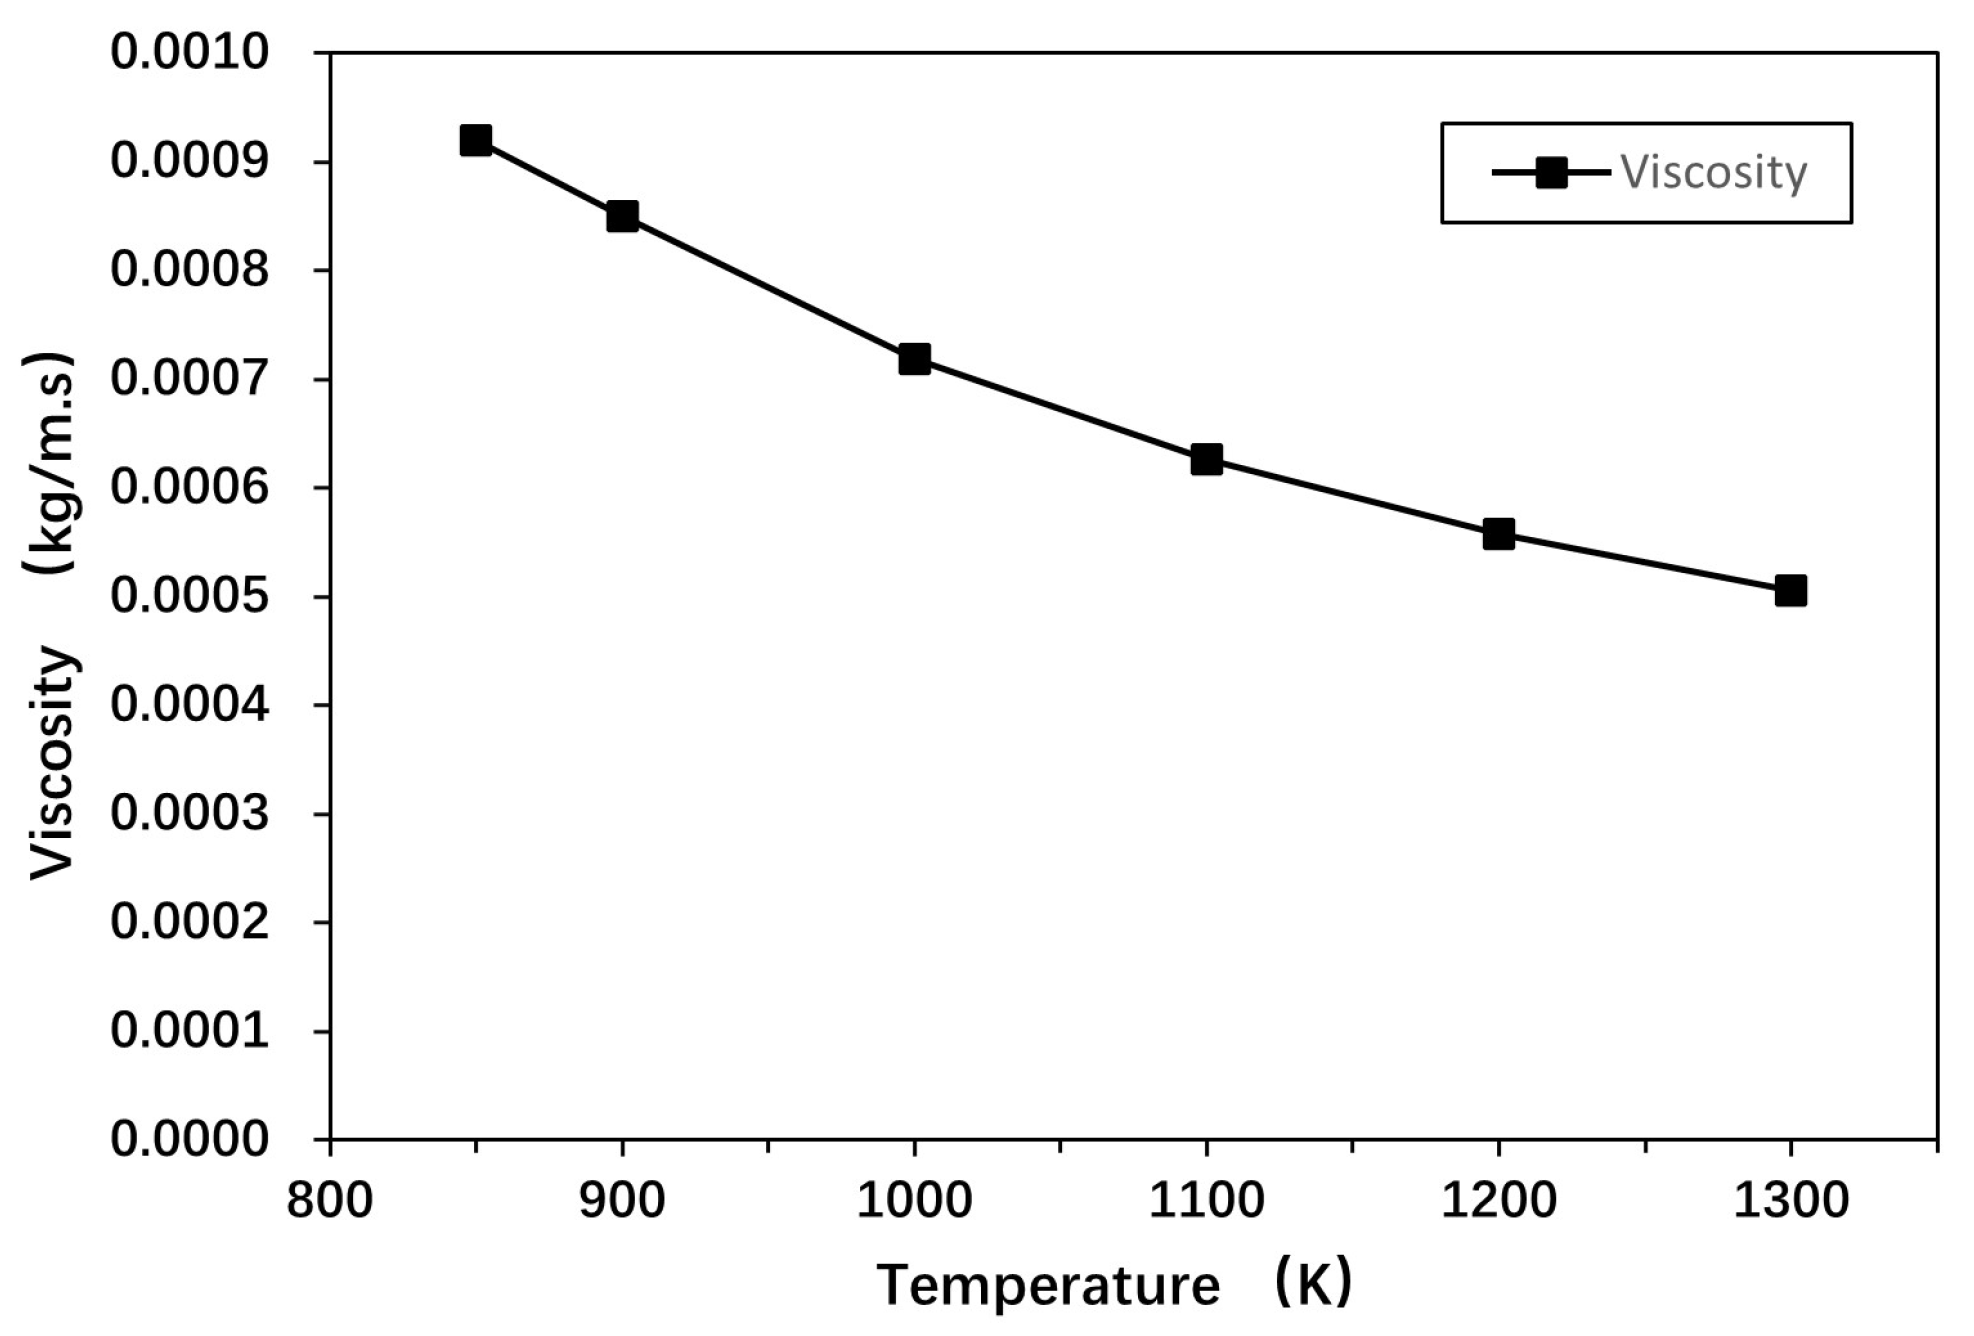
2.1.2. Physical Properties

AlSi 12 alloy is used as a PCM in this paper, and its physical property parameters are shown in Table 1 [27,28,29]. The viscosity of AlSi 12 alloy is obtained from the literature [29] and varied with temperature, as shown in Figure 2. In subsequent simulations, the temperature-dependent data are fitted as a function into fluent, which is described in detail in the next chapter. In the LHS, in addition to the PCM in the shell, there is also the HTF in the tube for heat transfer. Air is selected as the HTF in this paper. Due to the extensive operating temperature range of air, the property parameters of the air are treated as varying with temperature as Table 2 [30]. In this paper, the physical properties of porous materials are considered to be constant and more stable compared to the previous PCM and HTF. The selected porous materials for this study are made of copper, nickel, and silicon carbide, and their properties are presented in Table 3 and Table 4 [31].

2.2. Numerical Modeling

2.2.1. Numerical Model of the Heat Exchanger

The shell and tube heat exchanger of the LHS, which uses a two-dimensional axisymmetric model, as shown in Figure 3, is considered to be in an adiabatic environment. The outer walls of the heat exchanger of the LHS are, therefore, treated as adiabatic walls. For the inlet of the air tube, the velocity inlet is chosen. The air inlet temperature is selected as 298.15 K (25 ° C). For the outlet, the pressure outlet is selected and the coupled wall is chosen between the PCM and HTF. The initialisation temperature is 873.15 K (600 ° C). Grid cell size is 0.001 m. The time step is 1 s. Pressure-velocity coupling for forced convection in air is achieved by the semi-implicit method for pressure linked Equations (SIMPLE). The PRESTO scheme is used for the pressure correction equation.

2.2.2. Numerical Model of the HTF

A numerical study is conducted to examine the properties of air, including specific heat capacity, thermal conductivity, viscosity, and density. The results show that the specific heat capacity of air rises gradually with temperature, while the thermal conductivity and viscosity of air increase with temperature. However, the air density decreases with temperature. Equations (2)–(5) for each property as a function of air temperature are obtained by fitting polynomials:
c p , H T F ( T ) = 4.04 × 10 7 T 3 + 8.58 × 10 4 T 2 3.64 × 10 1 T + 1.05 × 10 3
λ H T F ( T ) = 1.37 × 10 11 T 3 14.80 × 10 8 T 2 + 1.03 × 10 4 T 5.63 × 10 4
μ H T F ( T ) = 1.53 × 10 14 T 3 4.37 × 10 11 T 2 6.88 × 10 8 T + 1.351 × 10 6
ρ H T F ( T ) = 4.57 × 10 9 T 3 + 1.04 × 10 5 T 2 8.50 × 10 3 T + 2.91

2.2.3. Numerical Model of PCM

Most of its parameters are entered into the numerical model, as shown in Table 1, and functions are used when dealing with viscosity and specific heat capacity. Equation (6) is used when working on the viscosity; when the temperature of the PCM is lowered to a certain range, it is treated as a solid and the viscosity is particularly high. The specific heat capacity is obtained by taking the specific heat of the solid PCM and adjusting it to the specific heat of the liquid PCM at two points, and Equation (7) is obtained:
μ pcm ( T ) = 0.000919 T if 273.15   K < T < 850   K 1 × 10 9 T 2 4 × 10 6 T + 0.0031 if 850   K < T < 1300   K
c p , pcm ( T ) = 1.27591 T + 657.6

2.2.4. Computational Setup

The simulations in this research were conducted using a high-performance workstation equipped with 128 CPUs and 512 GB RAM. This robust computing setup facilitated the efficient handling of the computational requirements inherent in our simulations. This research encompasses a grid sensitivity analysis, involving variations in the grid size from 0.5 mm to 3 mm. The results indicate that when the grid size is smaller than 1 mm, there is no significant change in the calculation outcomes. Consequently, to optimize calculation time, a grid size of 1 mm was adopted in this study. The computational time for each case varied, taking several days on average to complete the simulation. The duration depended on the complexity of the case and the specific parameters involved. Due to the significant gradients present, calculation time emerged as a critical consideration, necessitating several days for each case calculation. However, parallel calculations were employed for multiple cases, ensuring that the overall calculation time remained acceptable. Convergence was successfully achieved within each time step, with unscaled residuals of 10 6 for the mass, momentum, and energy equations. The initialization temperature was set at 873.15 K, while the grid cell size was 0.001 m, and the time step was 1 s. These choices were made to uphold accuracy, precision, and computational efficiency throughout the research.

2.3. Governing Equation

For HTF in an air tube without added porous media:
· ( ρ HTF V HTF ) + ρ HTF t = 0
( ρ HTF u HTF ) t + V HTF · ( ρ HTF u HTF ) = P HTF + μ HTF 2 u HTF ( ρ HTF ρ 0 ) g
( ρ HTF c p , HTF T HTF ) t + V HTF · ( ρ HTF c p , HTF T HTF ) = 2 ( λ HTF T HTF )
where Equation (8) is a continuity equation, Equation (9) is a momentum equation, and Equation (10) is an energy equation.
For the governing equation of PCM without the addition of porous material in the air tube, because the density variation of the PCM is ignored, the continuity equation can be simplified as:
· V PCM = 0
and when the natural convection is also ignored, the continuity momentum equation can be simplified as:
ρ PCM u PCM t + ρ PCM ( V PCM · u PCM ) = P PCM + μ PCM 2 u PCM + A s u PCM
where
A s = C ( 1 β ) 2 β 3 + ζ
where C is the mushy zone constant and ζ is a small number to avoid dividing by zero. The mushy zone constant in this study is 10 5 . The above equations denoted the source term for damping the velocity in solidified phase.
The energy model of the PCM is represented using an enthalpic approach:
t ( ρ PCM H ) + · ( V PCM ρ PCM H ) = · ( λ PCM T PCM )
where H is the enthalpy expression of the PCM, expressed as follows, and h represents the specific sensible heat of the PCM:
H = h + Δ H
h = h ref + T ref T c p , PCM d T
Δ H = β L
where Δ H represents the change in latent heat during the phase change of the PCM and is expressed in Equation (15), L is the latent heat of the PCM material, and β is the liquid-phase fraction of the PCM material. When the PCM temperature is higher than the solid phase temperature, the liquid-phase fraction of PCM is 1; when the PCM temperature is lower than the liquid-phase temperature, the liquid-phase fraction of PCM is 0; when the PCM temperature lies between the liquid and solid phases, the liquid-phase fraction of PCM is obtained by the temperature-dependent equation. In this study, the solidus temperature used is 575 ° C, and the liquidus temperature is 577 ° C.
β = 0 if T < T solidus 1 if T > T liquidus T T solidus T liquidus T solidus if T solidus < T < T liquidus
The porous material is added to the air tube during the strengthening of the LHS exothermic process. The governing equation under these conditions is presented. When adding porous material to an air tube, a local thermal non-equilibrium model is used due to the significant difference in physical properties between the air and the porous material. The governing equations for HTF when porous material has been added to the air tube.
( ε ρ H T F ) t + · ( ρ H T F V H T F ) = 0
1 ε ( ρ H T F u H T F ) t + 1 ε 2 V H T F · ( ρ H T F u H T F ) = P H T F + μ H T F ε 2 u H T F + S u ( ρ H T F ρ 0 ) g
S u = μ H T F K + ρ H T F C E K | V H T F | u
Equation (19) is the continuity equation for HTF with porous material, while Equation (20) is the momentum equation, in which S u is described as Equation (21).
The Darcy–Brinkman–Forchheimer model is used in this paper to describe the resistance to fluids generated by porous materials. Energy equation:
ϵ ( ρ H T F c p , H T F T H T F ) t + V H T F · ( ρ H T F c p , H T F T H T F ) = 2 ( λ H T F T H T F ) + S s f
S s f = h s f a s f ( T H T F T s )
The governing equations for porous materials is when porous material has been added to the air tube. Porous materials are solids, so the continuity and momentum equations are not involved for porous materials:
[ ( 1 ϵ ) ρ s c s T s ] t = · [ ( 1 ϵ ) λ s T s ] + h s f a s f ( T H T F T s )
where h s f is the fluid-to-solid heat transfer coefficient and a s f is the interfacial area density. They are the parameters that precede the heat exchange between a fluid and a solid in a porous material. When a local non-thermal equilibrium model is used, these two parameters must be specified. They are calculated according to Equations (25)–(27):
h s f = ( 2 + 1.1 R e d 0.6 P r 1 / 3 ) λ H T F d p
a s f = 6 ( 1 ϵ ) d p
R e d = ρ H T F u H T F d p μ H T F

2.4. Validation of Flow Models

In the LHS heat exchanger section, the inlet speed of the air is set at different inlet speeds. In this paper, the air inlet velocity is selected as 2, 4, 6, and 8 m/s. The HTF is turbulent at velocities of 2, 4, 6, and 8 m/s; different turbulence models can be chosen for the simulation of turbulence. Among the k- ω models, the SST k- ω model is the most commonly used. Among the k- ϵ models, the RNG k- ϵ model and the realized k- ϵ model are more commonly used. These two models are variations of the standard k- ϵ model and provide a more accurate and precise simulation of turbulence than the standard k- ϵ model. In this paper, three different turbulence models, i.e., the SST k- ω model, the RNG k- ϵ model, and the realized k- ϵ model, are compared in order to select the most suitable turbulence model. For the validation of the turbulence model, a pipe flow case was constructed, which is shown in Figure 4.
The model is a two-dimensional axisymmetric model. The length is 1.1 m, the radius is 0.0277 m, and the wall conditions are constant wall temperature of 473.15 K. The radius of the model is the same as the radius of the air tube in the heat exchanger of the LHS. The inlet is a velocity inlet and the outlet is a pressure outlet. The inlet velocities of the air are 2 m/s, 4 m/s, 6 m/s, and 8 m/s, respectively. The direction of gravity extends in the direction of the x-axis. The HTF of the model is air, which has the same properties as the air in the heat exchanger at the LHS mentioned earlier, using a variable materiality treatment. During the validation of the turbulence model, the steady-state solution is used.
In this paper, three different turbulence models are compared at different air inlet velocities by means of the Nusselt number. The value of the Nusselt number is derived from the empirical Equation (28) [32] and the defining Equations (29) and (30) for the Nusselt number, respectively. In the equations, d represents the characteristic length of the numerical model and is the diameter of the long air tube, L represents the tube length of the tube, Δ t represents the temperature difference between the wall of the tube and the average temperature of the air at the selected section, and t y represents the temperature gradient at the selected cross-section near the wall of the tube.
N u = 0.0214 R e 0.8 100 P r f 0.4 · 1 + d l 2 3 T H T F T w 0.45
N u = h H T F d λ H T F
h H T F = λ H T F Δ t t y
In this paper, four points near the thermostatic wall (473.15 K) at axial distances of 0.22 m, 0.44 m, 0.66 m, and 0.88 m are used to verify the Nusselt number. The results are shown in Figure 5. The three turbulence models SST k- ω model, RNG k- ϵ model, and realized k- ϵ model, are compared when the air inlet velocity is 2 m/s. When the SST k- ω model is used, the empirical value of the Nusselt number is greater than the simulated value of the Nusselt number. When the RNG k- ϵ model is used, the empirical value of the Nusselt number is smaller than the simulated value of the Nusselt number for all the sections taken. The difference between the two sets of Nusselt numbers becomes larger and larger as the tube length continues to increase. When realized k- ϵ model is used, the overall trend is similar to that of the RNG k- ϵ model.
The three models, k- ω SST, RNG k- ϵ , and realized k- ϵ , are also compared and analyzed at air inlet velocities of 4 m/s, 6 m/s, and 8 m/s. To ensure consistency in the choice of turbulence model, the RNG k- ϵ model is chosen.

2.5. Validation of the LTNE Model

The LTNE model is used when porous material is added to the HTF tube. According to the literature [33], the dimensionless numbers must satisfy the following conditions:
Pe = ρ HTF c p , HTF u HTF D λ HTF = 10
Bi = h sf a sf D 2 λ fe = 0.5
Da = K ϵ D 2 = 0.000001
ρ HTF ϵ C E u HTF D 2 ϵ K 1 / 2 = 1
ρ HTF u HTF D ϵ μ HTF = 10
λ fe λ se = 10
Therefore, the following physical parameters in Table 5 are selected. The initialization temperature is the temperature of the tube wall. D is the tube diameter.
The results of the radial temperature distribution simulation are shown in Figure 6. The data used for the “Values of Literature” in Figure 6 are referenced from [33].

3. Results and Discussion

3.1. Study of Heat Discharge through a Round Tube Heat Exchanger

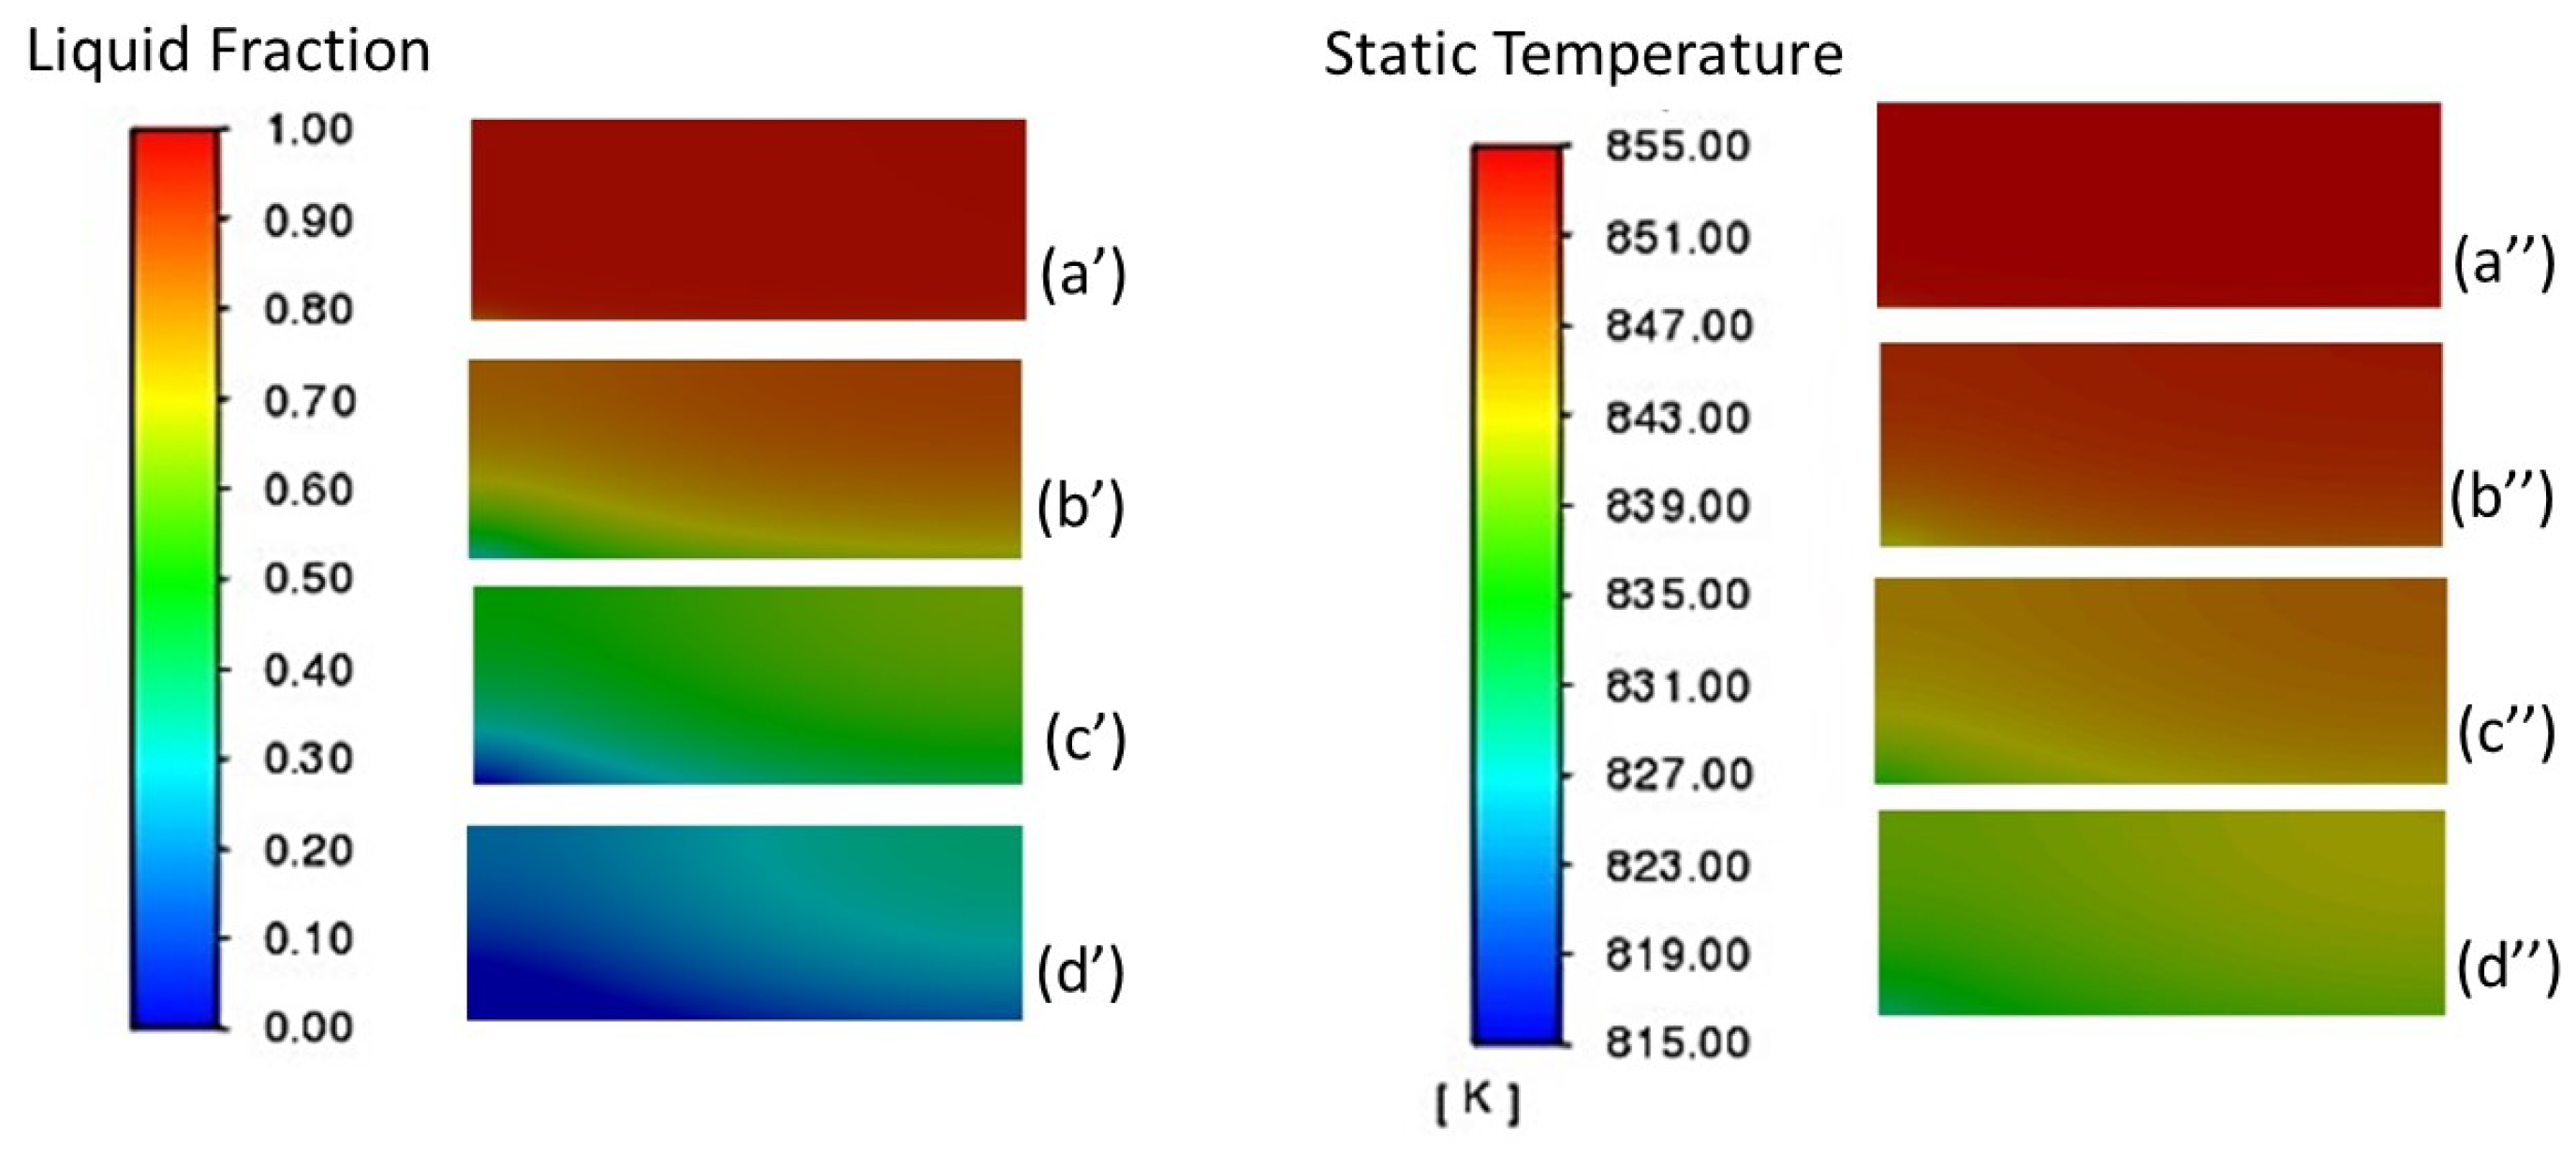
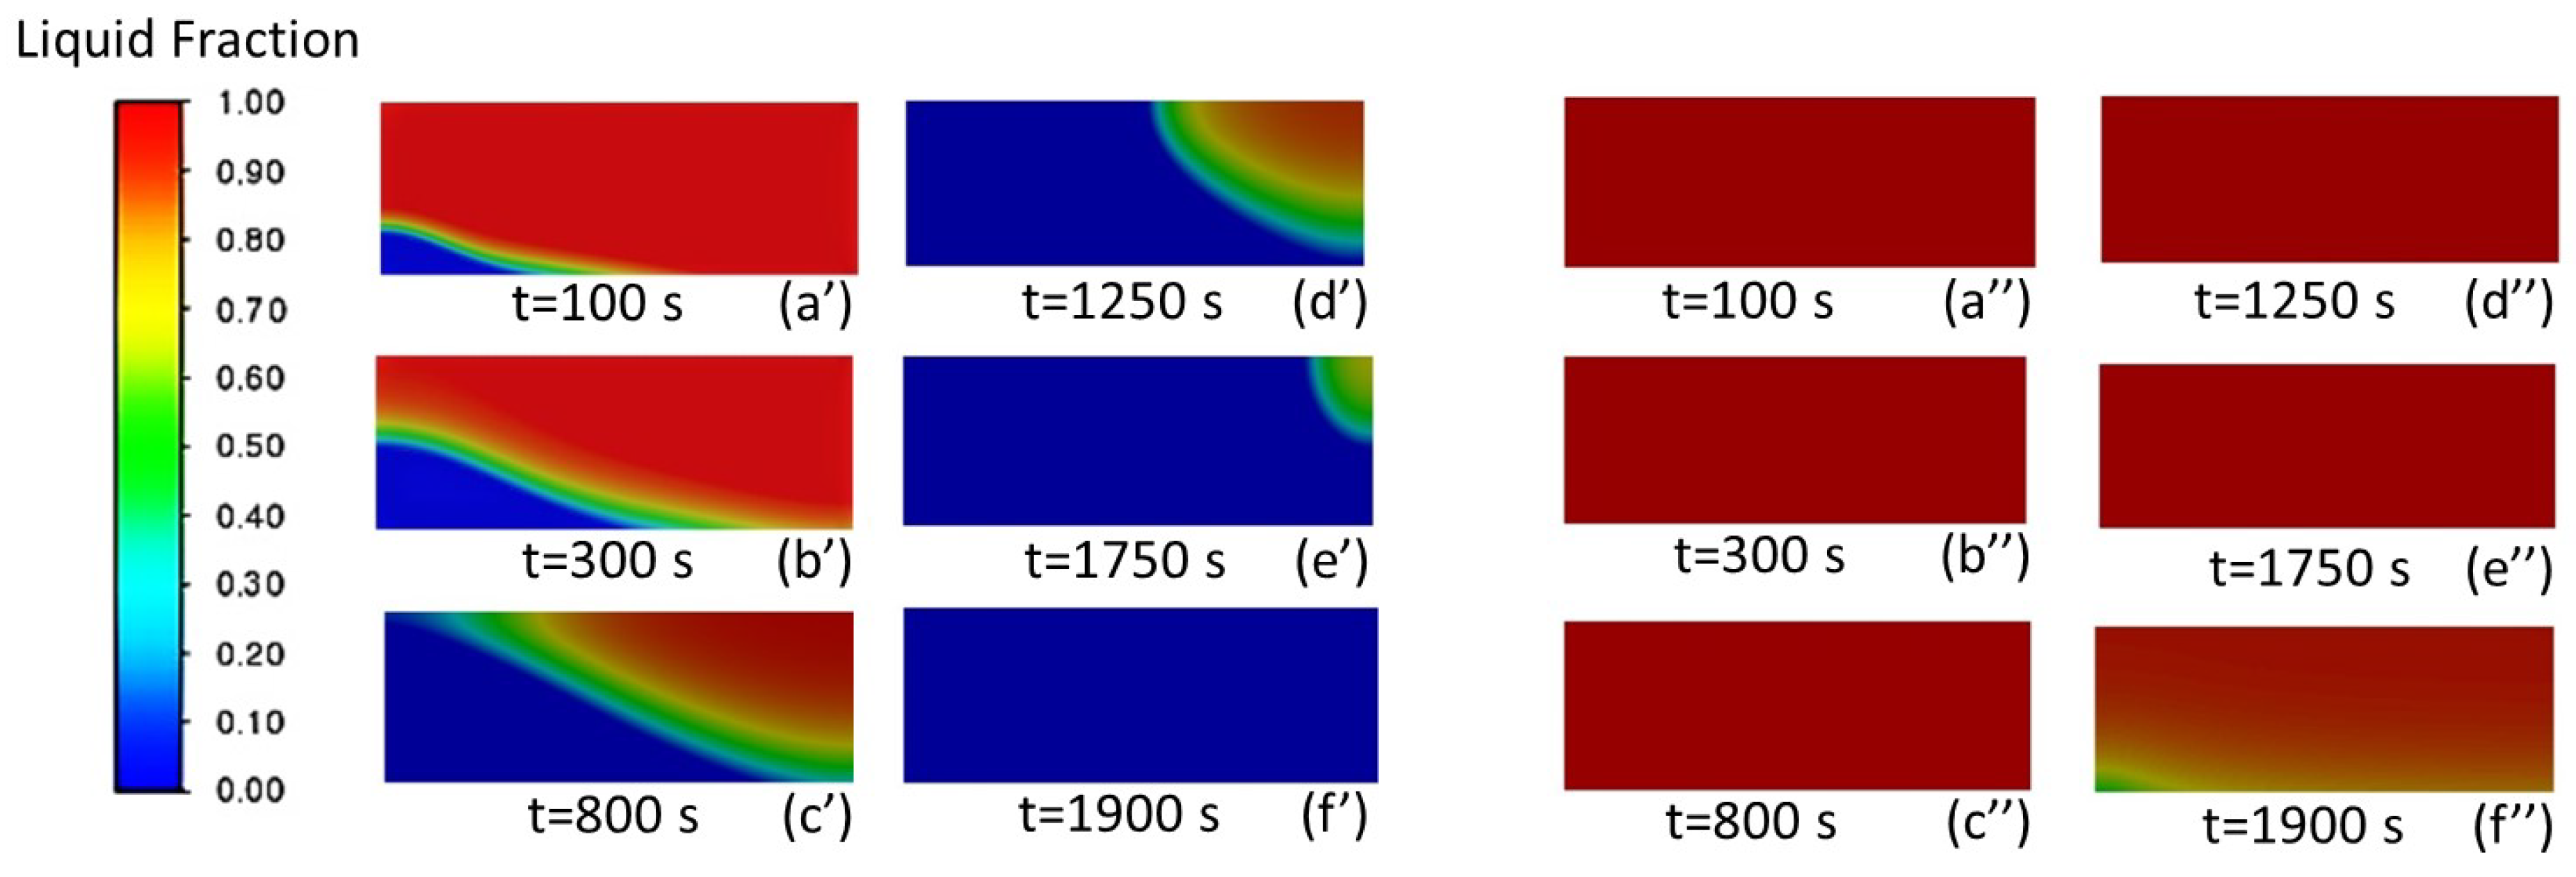
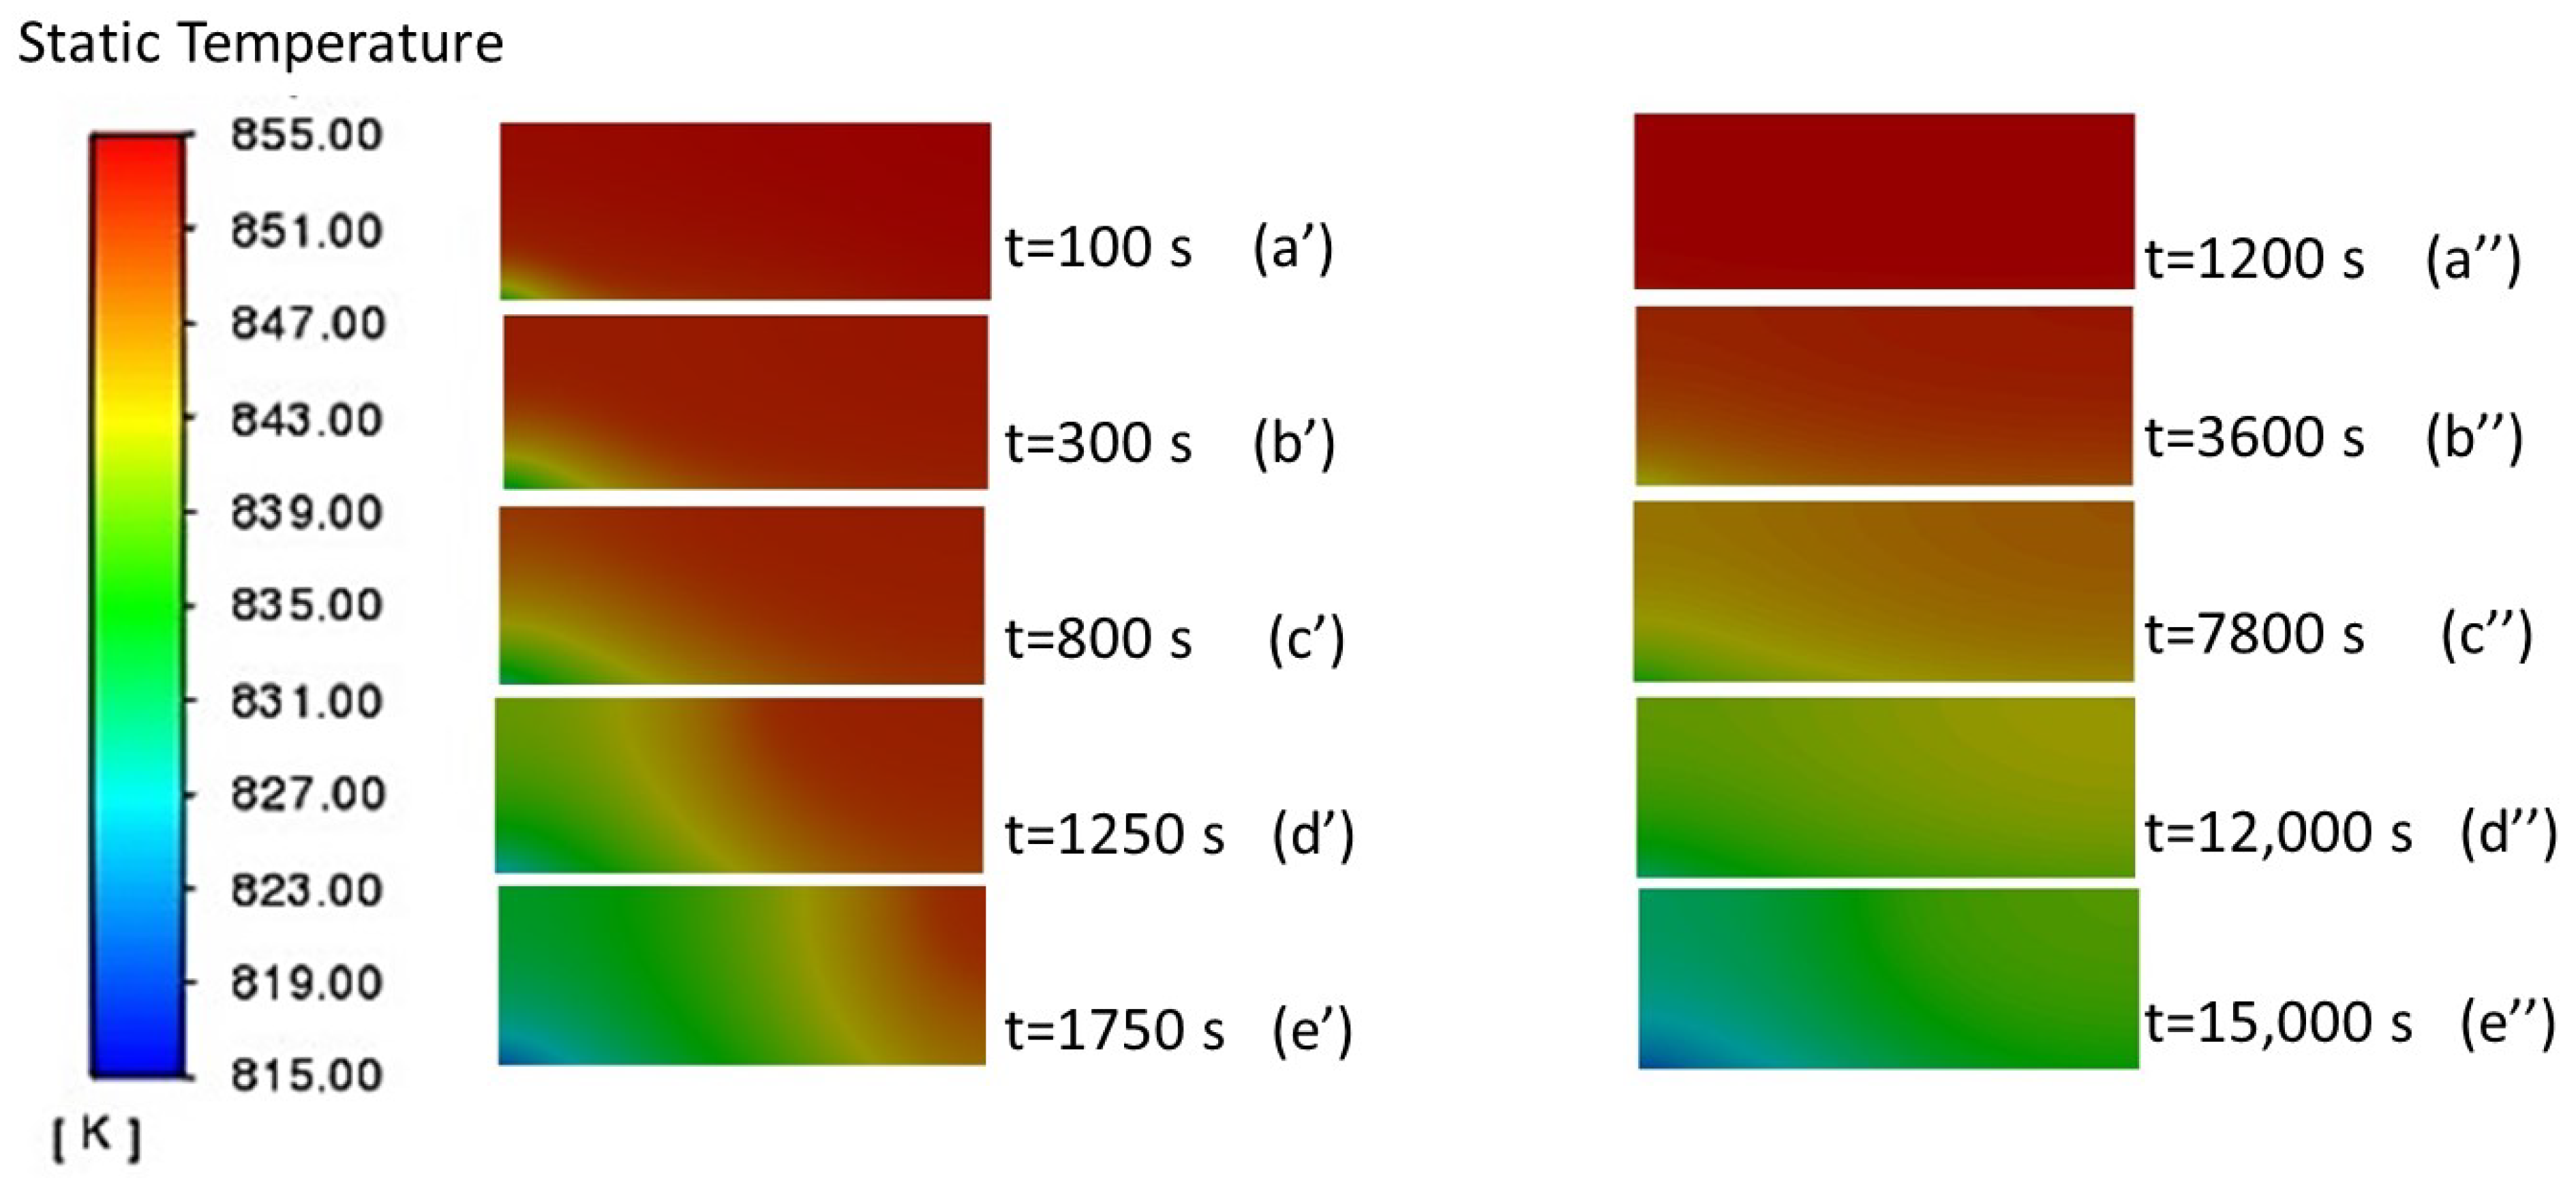
3.1.1. Analysis of the Liquid-Phase Fraction and Temperature Distribution of PCM

With an air inlet velocity is 4 m/s, the liquid-phase fraction of AlSi 12 alloy is shown in Figure 7. When the air inlet velocity is 4 m/s, the liquid-phase fraction of AlSi 12 alloy is almost entirely one at a flow time of 1200 s. As the flow time increases, the solid–liquid mixed AlSi 12 alloy with low liquid fractions is concentrated at the top and near the HTF tube. When the flow time is 7800 s, the liquid-phase fraction of the top AlSi 12 alloy is still clearly stratified and the part near the HTF tube is completely solidified. The AlSi 12 alloy at the bottom is still in a solid–liquid mixture, with a liquid-phase fraction between 0.4 and 0.6. When the flow time is 12,000 s, the proportion of completely solidified AlSi 12 alloy at the top increases, and the rest of the AlSi 12 alloy remains in a solid–liquid mixture, with the liquid-phase fraction falling from 0.1 to 0.3.
When no porous material is added to the HTF tube and the air inlet velocity is 4 m/s, there is little difference in the liquid-phase fraction within the AlSi 12 alloy during solidification. The solidification process takes place simultaneously in the axial and radial directions. The AlSi 12 alloy near the top of the HTF tube solidified more quickly than the AlSi 12 alloy at other locations. The AlSi 12 alloy at the top near the HTF tube is close to the air inlet for better heat exchange with the air.
When the air inlet velocity is 4 m/s, the temperature of AlSi 12 alloy is shown in Figure 7. At an air inlet velocity of 4 m/s and a flow time of 1200 s, the temperature distribution of the AlSi 12 alloy is uniform. At a flow time of 3600 s, the temperature of the top AlSi 12 alloy near the HTF tube dropped significantly. When the flow time is 7800 s, the overall temperature of the AlSi 12 alloy drops; the top part of the AlSi 12 alloy near the HTF tube has a lower temperature. When the flow time is 12,000 s, there is almost no temperature difference in the top AlSi 12 alloy. The temperature of the bottom AlSi 12 alloy near the HTF tube is the same as that of the top AlSi 12 alloy, while the temperature of the bottom AlSi 12 alloy away from the HTF tube is higher. Only the top part of the AlSi 12 alloy near the HTF tube has a lower temperature. With an air inlet velocity of 4 m/s and no porous material added to the HTF tube, the temperature change of the AlSi 12 alloy is similar to the change in its liquid-phase fraction, which also occurs in the axial and radial directions.
The liquid-phase fractions of AlSi 12 alloys at air inlet velocities 4 m/s and 8 m/s are shown in Figure 8. When the flow time is 1200 s, the liquid-phase fraction of the AlSi 12 alloy is almost one at an air inlet velocity of 4 m/s. However, at an air inlet velocity of 8 m/s, the liquid-phase fraction of the Al-Si alloy already changes. When the flow time is 3600 s, the liquid-phase fraction of the AlSi 12 alloy with an air inlet velocity of 8 m/s is significantly lower compared to the liquid-phase fraction with an air inlet velocity of 4 m/s. The AlSi 12 alloy is fully solidified near the air inlet at an air inlet velocity of 8 m/s. When the flow time is 3600 s, most of the AlSi 12 alloy has been completely solidified in air at an inlet velocity of 8 m/s. The increase in air inlet velocity significantly accelerates the solidification process of AlSi 12 alloys. When the air inlet velocity increases, the solidification of the AlSi 12 alloy still takes place simultaneously in the axial and radial directions. The increase in air inlet velocity has little effect on the tendency of the AlSi 12 alloy to solidify. The slower melting observed in the points at the lower-left corner is attributed to the cold fluid entering from that point. This behavior can be observed and explained in more detail in Figure 3, where the flow patterns and directions are depicted.
The temperature of the AlSi 12 alloy at air inlet velocities 4 m/s and 8 m/s is shown in Figure 9. At an air inlet velocity of 4 m/s and flow time of 1200 s, there is almost no temperature difference within the temperature of the AlSi 12 alloy. When the air inlet velocity is 8 m/s and the flow time is 1200 s, a temperature difference occurs in the AlSi 12 alloy. The lower temperatures are concentrated in the top part of the AlSi 12 alloy near the HTF tube. As the flow time increases, the comparison of temperature of the AlSi 12 alloy at different air inlet velocities is more pronounced. At an air inlet velocity of 8 m/s, the overall temperature of the AlSi 12 alloy is lower, and the temperature of the AlSi 12 alloy near the top of the HTF tube is even lower. When the air inlet velocity increases, the temperature drop of the AlSi 12 alloy accelerates. When the air inlet velocity increases, the change in temperature of the AlSi 12 alloy is still axial and radial. The increase in air inlet velocity does not change the trend of temperature change.
The solidification process and the temperature drop of the AlSi 12 alloy take place both axially and radially. The increase in air inlet velocity accelerates the solidification and temperature drop of the aluminum–silicon alloy, without changing the trend of the liquid-phase fraction and temperature change.

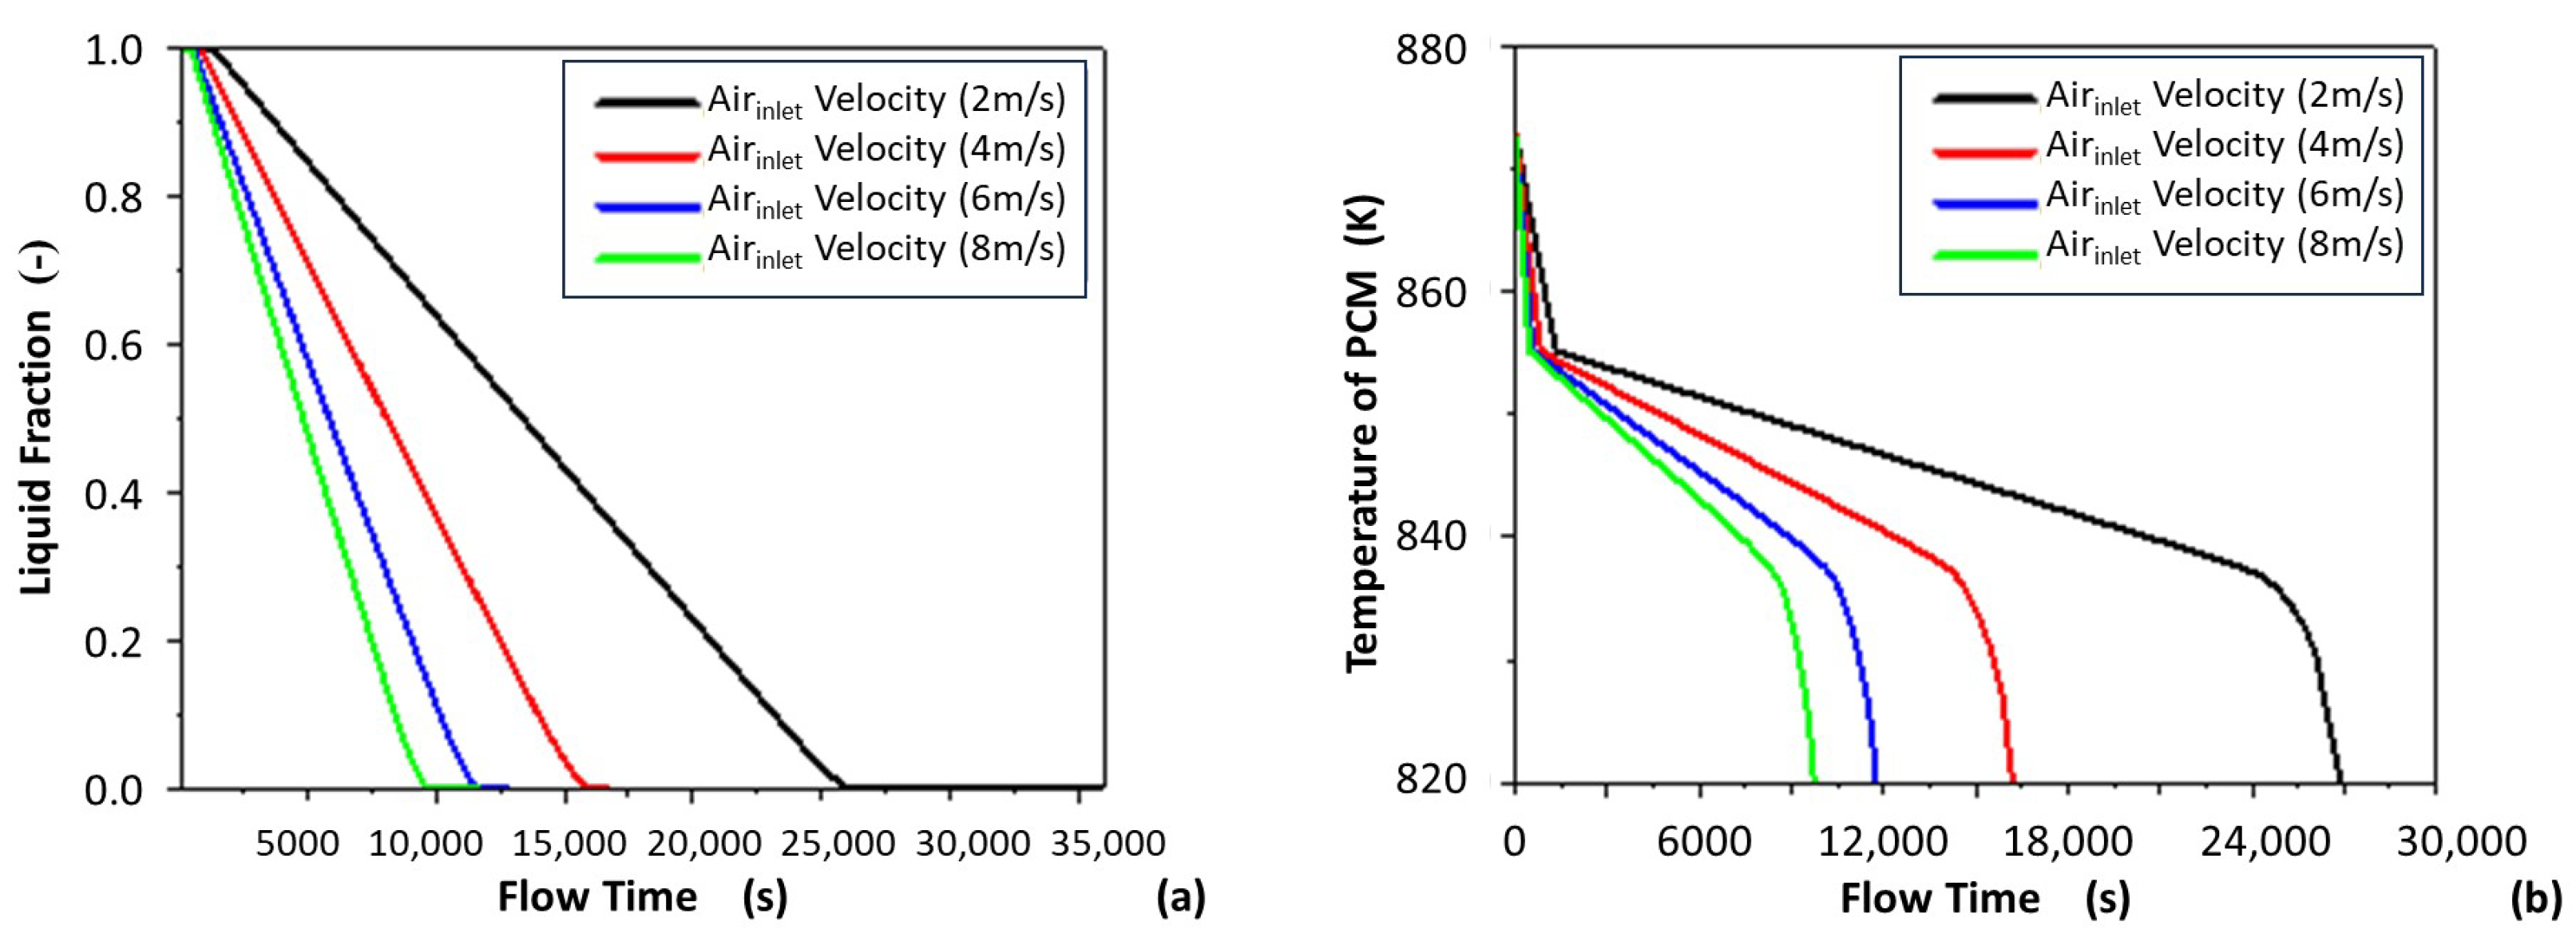
3.1.2. Effect of Air Inlet Velocity on the Solidification Speed of PCM

The liquid-phase fraction of an AlSi 12 alloy at different air inlet velocities is shown in Figure 10a. At an air inlet velocity of 2 m/s, the AlSi 12 alloy starts to solidify at 1220 s and solidifies completely at 26,120 s. When the air inlet velocity is 4 m/s, the solidification of the AlSi 12 alloy takes place in the time period from 810 s to 15,930 s. When the air inlet velocity is 6 m/s, this time period is from 570 s to 11,650 s. When the air inlet velocity is 8 m/s, this time period is from 460 s to 9690 s. When the air inlet velocity is increased, the AlSi 12 alloy solidification time decreases significantly. When the air inlet velocity is increased from 2 m/s to 4 m/s, the solidification time is reduced by 39.3%. A 26.7% reduction in solidification time is observed when the air inlet velocity is increased from 4 m/s to 6 m/s, and a 16.7% reduction in solidification time is observed when the air inlet velocity is increased from 6 m/s to 8 m/s. When the air inlet speed is increased from 4 m/s to 8 m/s, the time required for the solidification process is reduced by 39.0%.

3.1.3. Average Temperature of PCM

The temperature change of the PCM when no porous material is added to the HTF tube is shown in Figure 10b. The temperature trend of the PCM is consistent as the air inlet velocity changes. The temperature of the PCM starts to drop rapidly at the beginning, before the AlSi 12 alloy starts to solidify, when the liquid-phase fraction of the AlSi 12 alloy is 1. When the liquid-phase fraction of the AlSi 12 alloy changes and it starts to solidify, the temperature change of the AlSi 12 alloy slows down. At the end of the solidification process, the temperature of the AlSi 12 alloy falls faster again. When the air inlet velocity changes, the solidification process of the AlSi 12 alloy remains in the similar temperature range. However, when the air inlet velocity increases, the duration of the solidification temperature band of the AlSi 12 alloy decreases. This proves that the temperature of the AlSi 12 alloy coincides with the liquid-phase fraction of the AlSi 12 alloy. As the air inlet velocity increases, the solidification process time decreases and the temperature of the AlSi 12 alloy decreases at a faster rate.

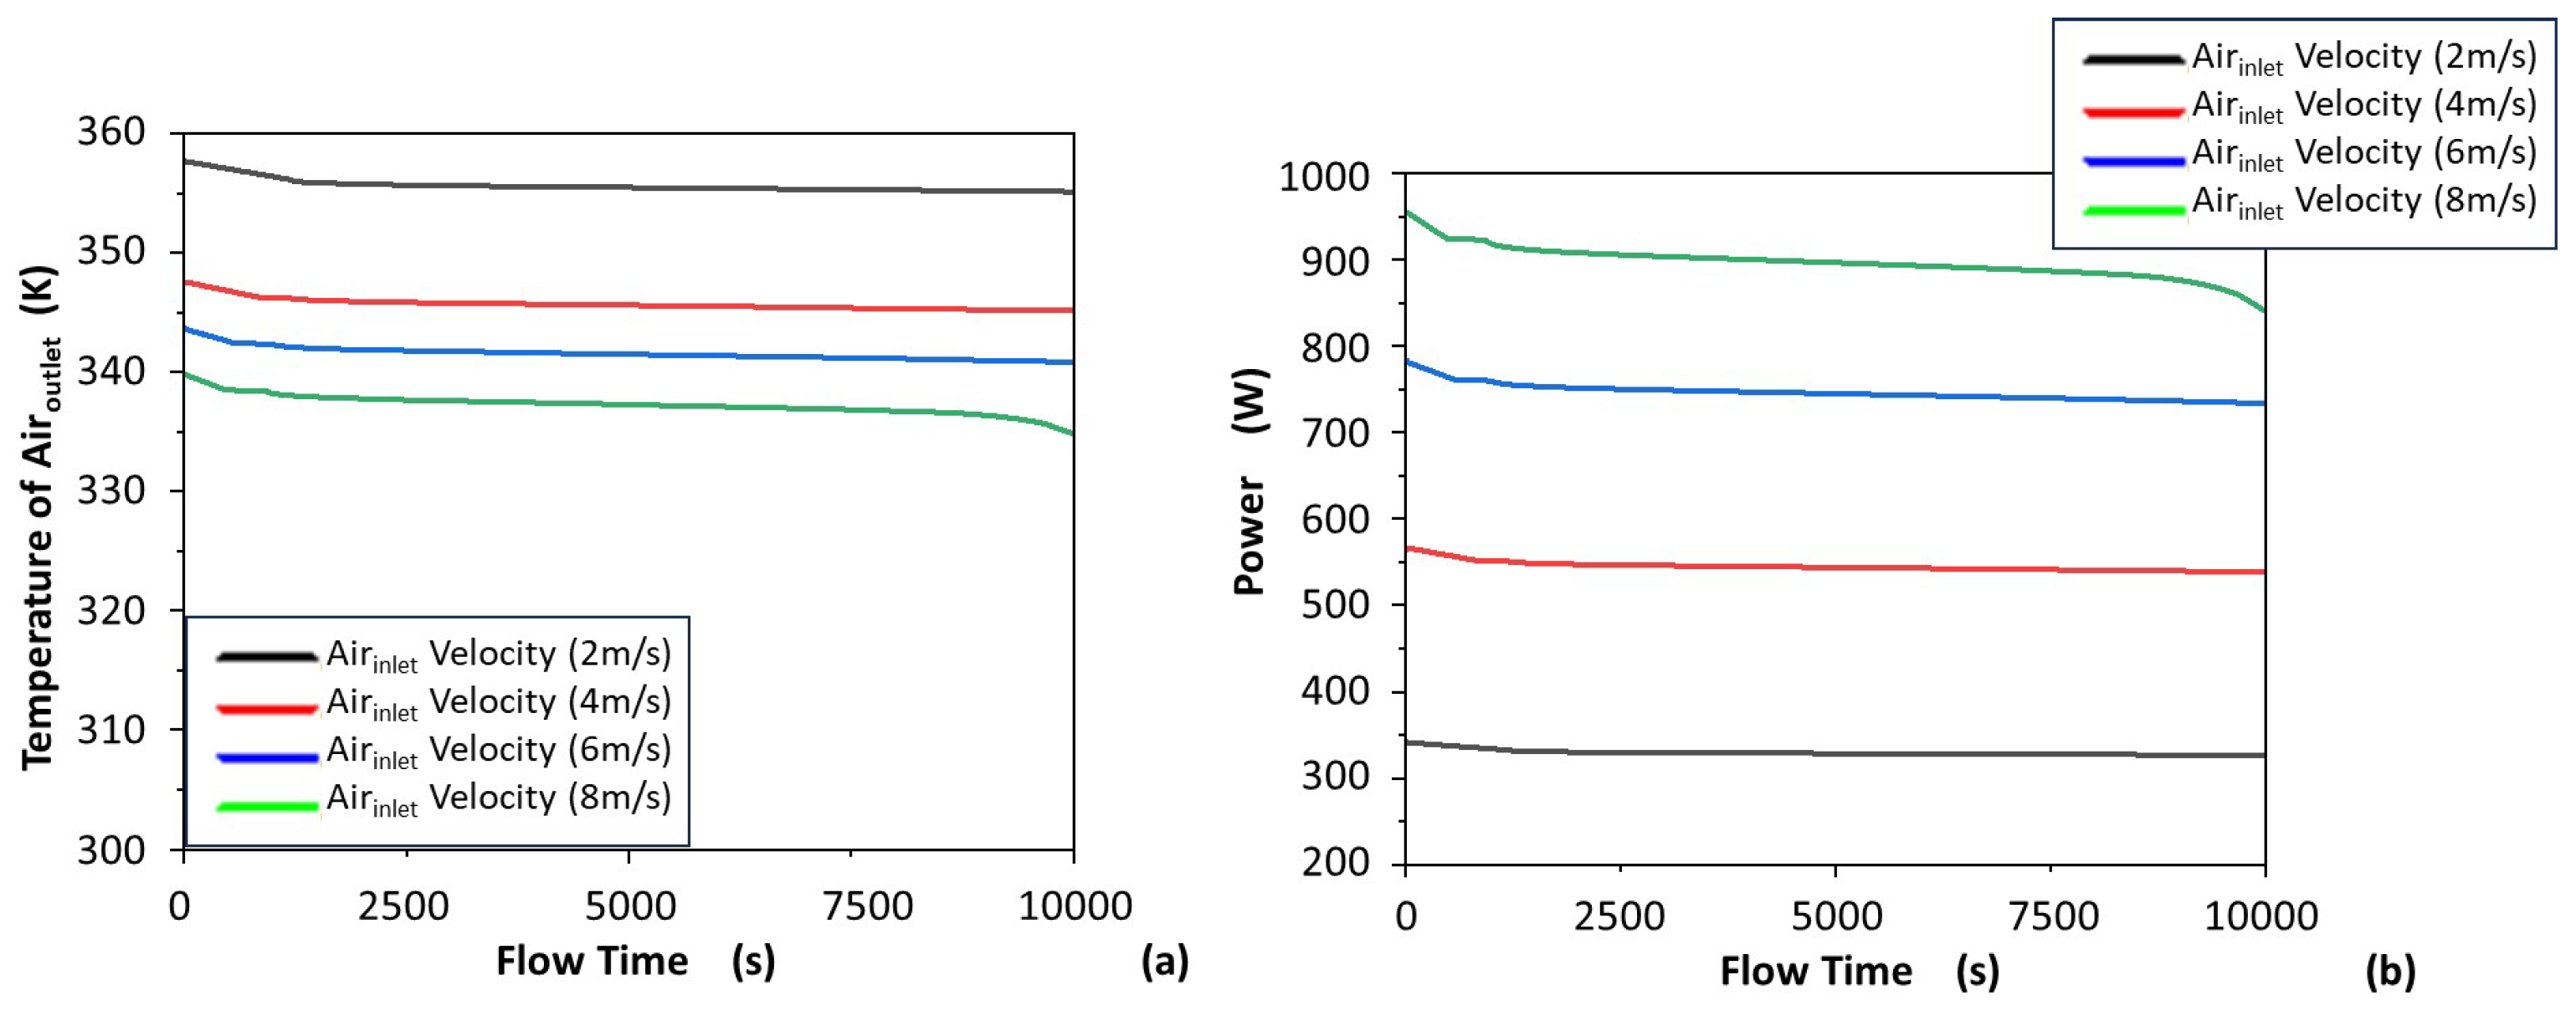
3.1.4. Air Outlet Temperature and Heat Discharge Power

The air outlet temperature in the pure air tube at different air inlet velocities is shown in Figure 11a. The air out temperature is highest at an air inlet velocity of 2 m/s. At an air inlet velocity of 8 m/s, the air outlet temperature is the lowest. As the air inlet velocity increases, the air outlet temperature decreases. The heat discharge power of the LHS in a pure air tube at different air inlet velocities is shown in Figure 11b. The discharge power of the LHS is lowest when the air inlet velocity is 2 m/s and highest when the air inlet velocity is 8 m/s. The discharge power of the LHS is highest when the air inlet velocity is 8 m/s. An increase in air inlet velocity leads to a decrease in air outlet temperature. Since the air inlet temperature is constant, an increase in the air inlet velocity also leads to an increase in the mass flow rate of the air. For the changes in the discharge power of the LHS in this paper, the increase in mass flow rate is the dominant factor.

3.2. Analysis of the Addition of Nickel Foam to HTF Tubes

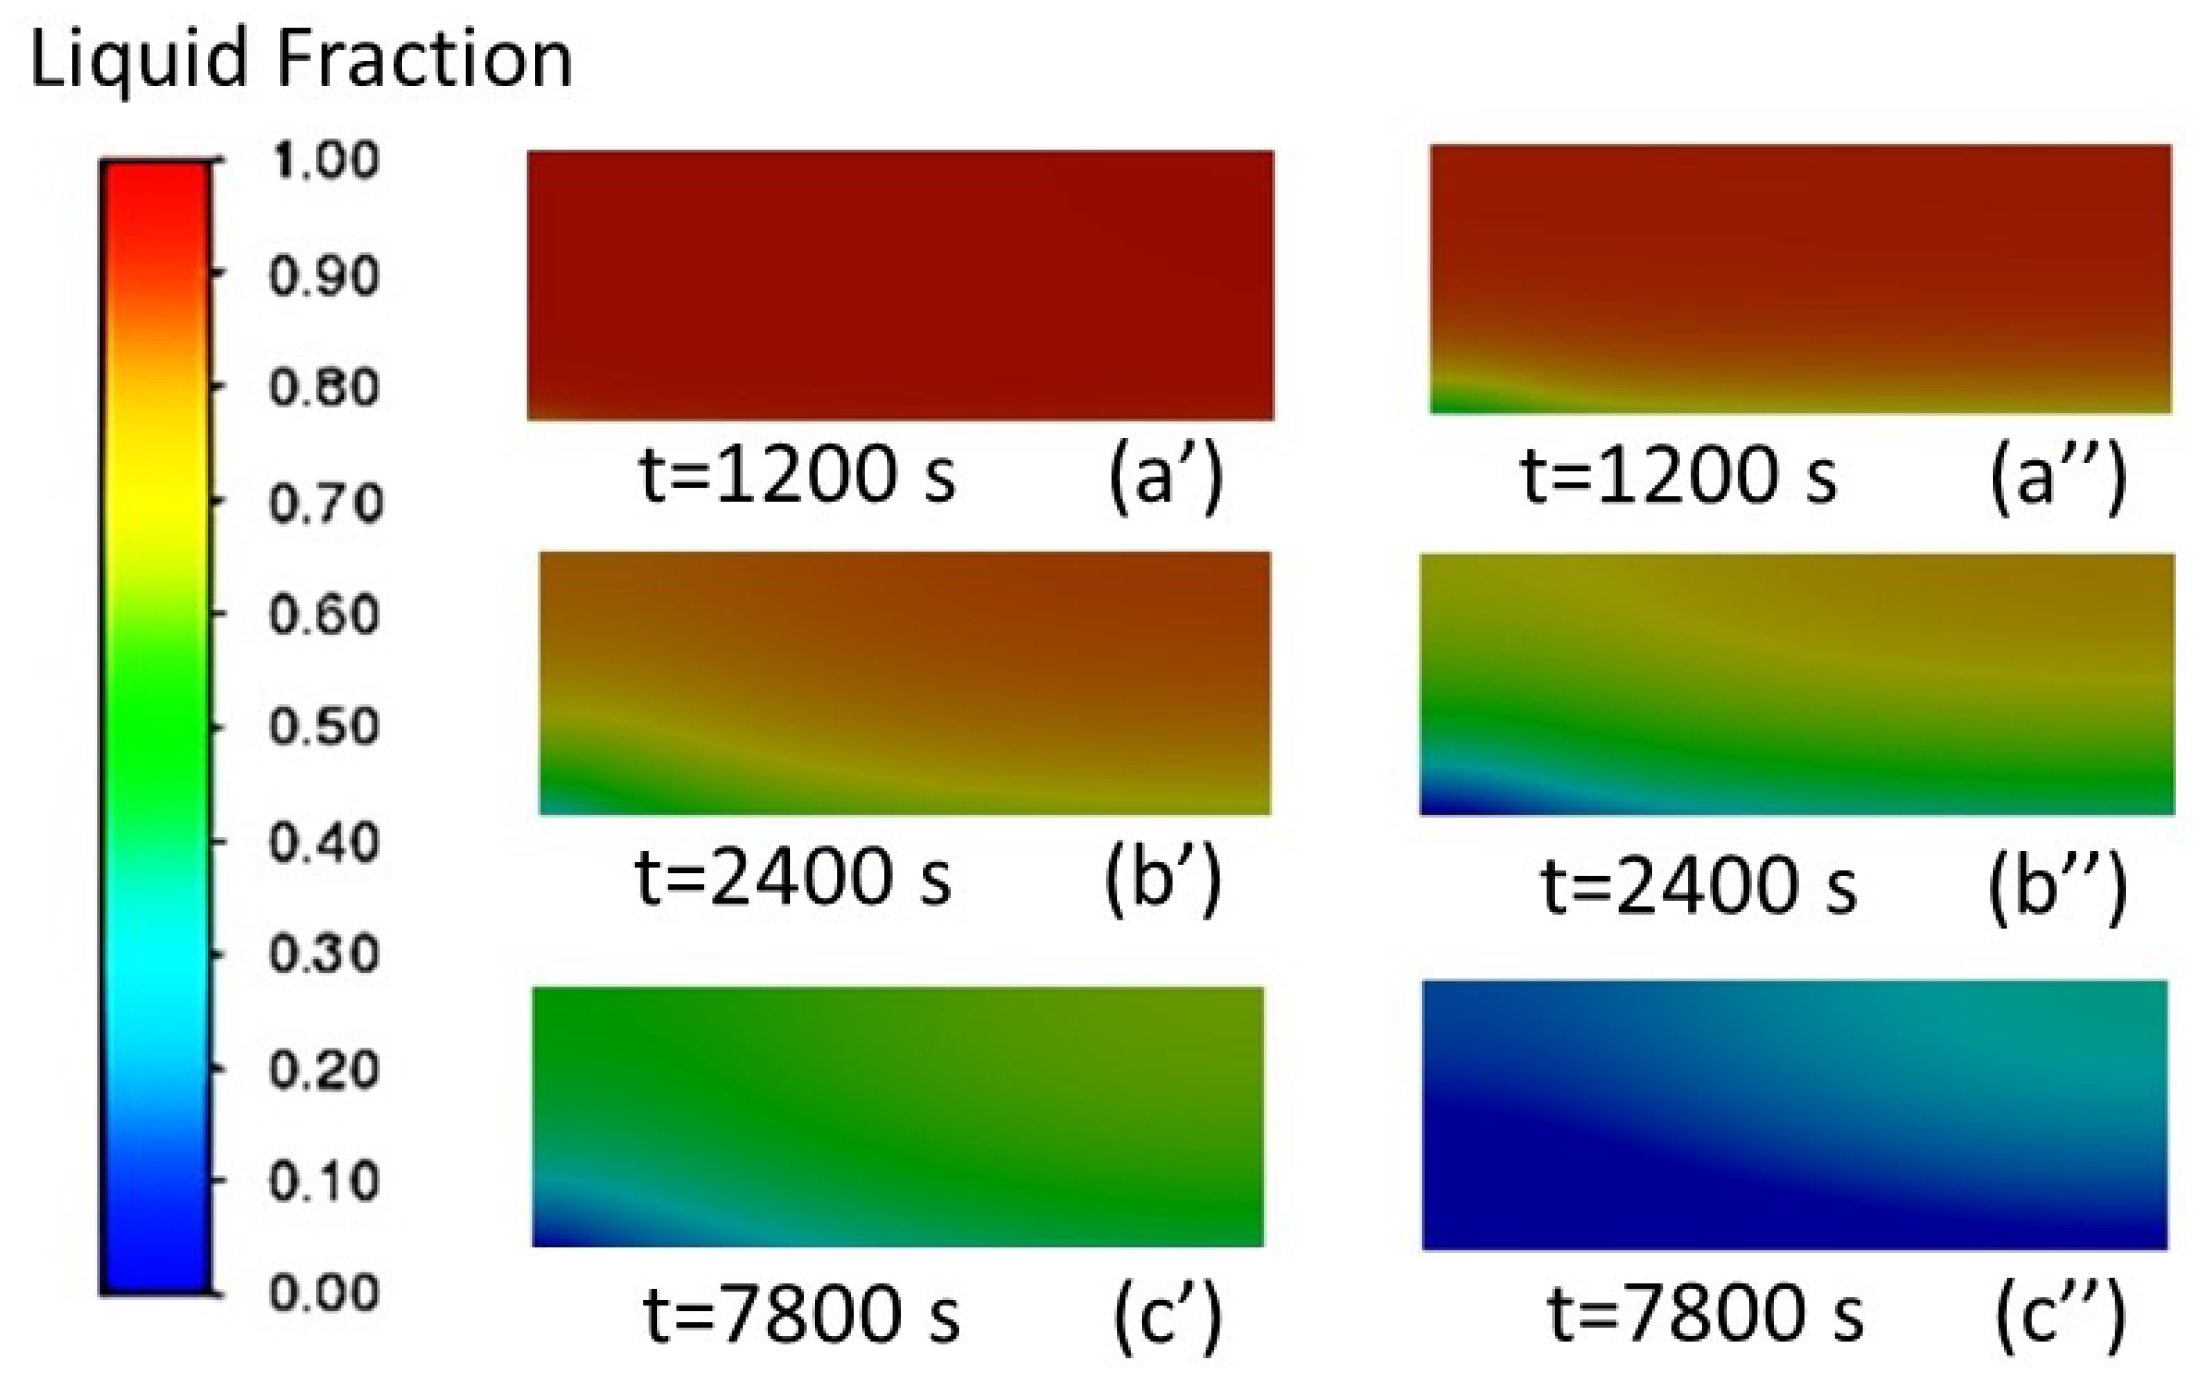
3.2.1. Analysis of the Liquid-Phase Fraction and Temperature Distribution of PCM

When nickel foam is added to the HTF tube, a solid–liquid boundary appears in the solidification process due to the rapid solidification of the AlSi 12 alloy and the insufficient thermal conductivity of the AlSi 12 alloy. When nickel foam is added to the HTF tube, the liquid-phase fraction of AlSi 12 alloy at an air inlet velocity of 4 m/s is shown in Figure 12. At a flow time of 100 s, the top part of the AlSi 12 alloy near the HTF tube is completely solidified, while the rest of the AlSi 12 alloy is still solid. At a flow time of 300 s, the fully solidified part of the top AlSi 12 alloy solidifies continuously, while the bottom AlSi 12 alloy remains almost unchanged. At a flow time of 800 s, the top AlSi 12 alloy is almost completely solidified, while the bottom AlSi 12 alloy is only solid–liquid mixed in the part near the HTF tube. At a flow time of 1250 s, the portion of the AlSi 12 alloy that is completely solidified in the longitudinal direction increases, while the portion of the AlSi 12 alloy at the bottom near the HTF tube is completely solidified and the portion away from the HTF tube is still in a solid–liquid mixture. When the HTF tube is not filled with porous material, the liquid-phase fraction changes relatively slowly. It was not until the flow time was 1900 s that a significant change in the liquid-phase fraction occurs. When nickel foam is added to the HTF tube and the flow time is 1900 s, the AlSi 12 alloy has completely solidified. When the HTF tube is filled with nickel foam, the solidification process takes place mainly in the axial direction. After the top AlSi 12 alloy has solidified completely, the bottom AlSi 12 alloy is then completely solidified. The addition of nickel foam to the HTF tube accelerates the solidification process of the AlSi 12 alloy and changes the trend of the liquid-phase fraction.
The temperature of the AlSi 12 alloy at an air inlet velocity of 4 m/s when the HTF tube is filled with nickel foam is shown in Figure 13. When the flow time is 100 s, almost no temperature difference between aluminum and silicon alloys. Only the temperature of the AlSi 12 alloy near the air inlet is lower. At a flow time of 300 s, The temperature of the top AlSi 12 alloy near the HTF tube drops significantly, while the temperature of the bottom AlSi 12 alloy remains the same. As the flow time increases, the temperature of the AlSi 12 alloy decreases along the axial direction. When nickel foam is not added to the HTF tube, the temperature of the AlSi 12 alloy decreased in the axial and radial directions. The addition of nickel foam to the HTF tube causes the temperature of the AlSi 12 alloy to drop rapidly, causes the temperature difference of the AlSi 12 alloy to increase, and changes the trend of temperature drop so that the temperature drop is mainly along the axial direction.
The addition of nickel foam reduces the solidification time of the AlSi 12 alloy, accelerates the temperature drop of the AlSi 12 alloy, and causes an increase in the temperature difference of the AlSi 12 alloy. When nickel foam is added to the HTF tube, the tendency of the solidification of the AlSi 12 alloy and the temperature drop are changed. Changes in the liquid-phase fraction and temperature occur along the axial direction.

3.2.2. Liquid Fraction of PCM

The LHS heat transfer efficiency is greatly increased when the nickel foam is added to the HTF tube; the solidification process time of the AlSi 12 alloy is reduced. The liquid-phase fraction at different air inlet velocities when porous nickel foam is added to the HTF tube is shown in Figure 14a. At an air inlet velocity of 2 m/s, the solidification process takes 3220 s when the porous nickel foam is added to the HTF tube. At an air inlet velocity of 4 m/s, the solidification process lasts 1890 s. At an air inlet velocity of 6 m/s, it takes 1430 s. At an air inlet velocity of 8 m/s, the solidification time is 1210 s. When nickel foam was added to the air tube, the solidification time of the AlSi 12 alloy was reduced by 41.3% when the air inlet velocity was increased from 2 m/s to 4 m/s and by 24.3% when the air inlet velocity was increased from 4 m/s to 6 m/s. The solidification time of the AlSi 12 alloy is reduced by 24.3% when the air inlet velocity is increased from 4 m/s to 6 m/s. When the air inlet speed was increased from 6 m/s to 8 m/s, the solidification time of the AlSi 12 alloy was reduced by 15.38%. The addition of nickel foam reduces the solidification time of PCM by 87% compared to a pure air tube at an air inlet velocity of 2 m/s. At air inlet velocities of 4 m/s, 6 m/s, and 8 m/s, the addition of nickel foam reduced the solidification time of PCM by 87.5%, 87.1%, and 86.9%, respectively.

3.2.3. Average Temperature of PCM

The temperature change of the AlSi 12 alloy when nickel foam is added to the HTF tube is shown in Figure 14b. The graph shows that the temperature trend of the AlSi 12 alloy is very different when the porous material nickel foam is added to the HTF tube than when the porous material is not added to the HTF tube. When porous material is added to the air tube, the temperature of the AlSi 12 alloy does not have a distinct phase-change temperature range. The above phenomenon is caused by the fast solidification rate of AlSi 12 alloys and the short solidification process time.

3.3. Air Outlet Temperature and Discharge Power

When nickel metal foam is added to the HTF tube, the air outlet temperature is shown in Figure 14c. The outlet temperature of the air is highest at an air inlet velocity of 2 m/s and lowest at an air inlet velocity of 8 m/s. This is consistent with the air outlet temperature in a pure air tube. The air passing through the HTF tube with nickel foam has a higher exit temperature compared to the pure air tube.
The heat discharge power of the LHS when nickel metal foam is added to the HTF tube is shown in Figure 14d. The air outlet temperature is lowest and the LHS discharge power is highest at an air inlet velocity of 8 m/s before a flow time of 1500 s. The mass flow rate of the air is the dominant factor in power. As the flow time increases, the effect of air exit temperature on power increases. The addition of porous material enhances the heat transfer effect of the LHS and increases the discharge power of the LHS compared to a pure air tube without the addition of porous material.
Figure 14. (a) Liquid fraction of PCM when nickel metal foam is added to the HTF tube. (b) Temperature of PCM when nickel metal foam is added to the HTF tube. (c) Air outlet temperature in HTF tubes when nickel metal foam is added to the HTF tube. (d) Discharge power in HTF tubes when nickel metal foam is added to the HTF tube.
Energies 16 05729 g014
In Figure 14d, the overlapping of curves at certain points can be explained as follows. Initially, the phase-change material (PCM) is at the same temperature across all cases. As the wind speed increases, the heat transfer coefficient also increases, resulting in higher heat output power. However, the total heat storage capacity of the PCM remains constant. Consequently, as the heat release power increases, the temperature of the PCM decreases rapidly, as illustrated in Figure 14b. This leads to lower temperatures in cases with higher heat release power at the same moment. The heat release power is determined using Equation (37):
Q = h H T F · A · ( T P C M T A i r )
where h H T F represents the convective heat transfer coefficient between the PCM and the surrounding air. Although h H T F is larger for cases with higher wind speeds, the temperature difference ( T P C M T A i r ) decreases due to the declining PCM temperature. As a result, in the later stage of the heat release process, cases with higher wind speeds exhibit a slower decrease in exothermic power, which explains the observed overlap of the curves. A similar situation can also explain the following Figure 15.

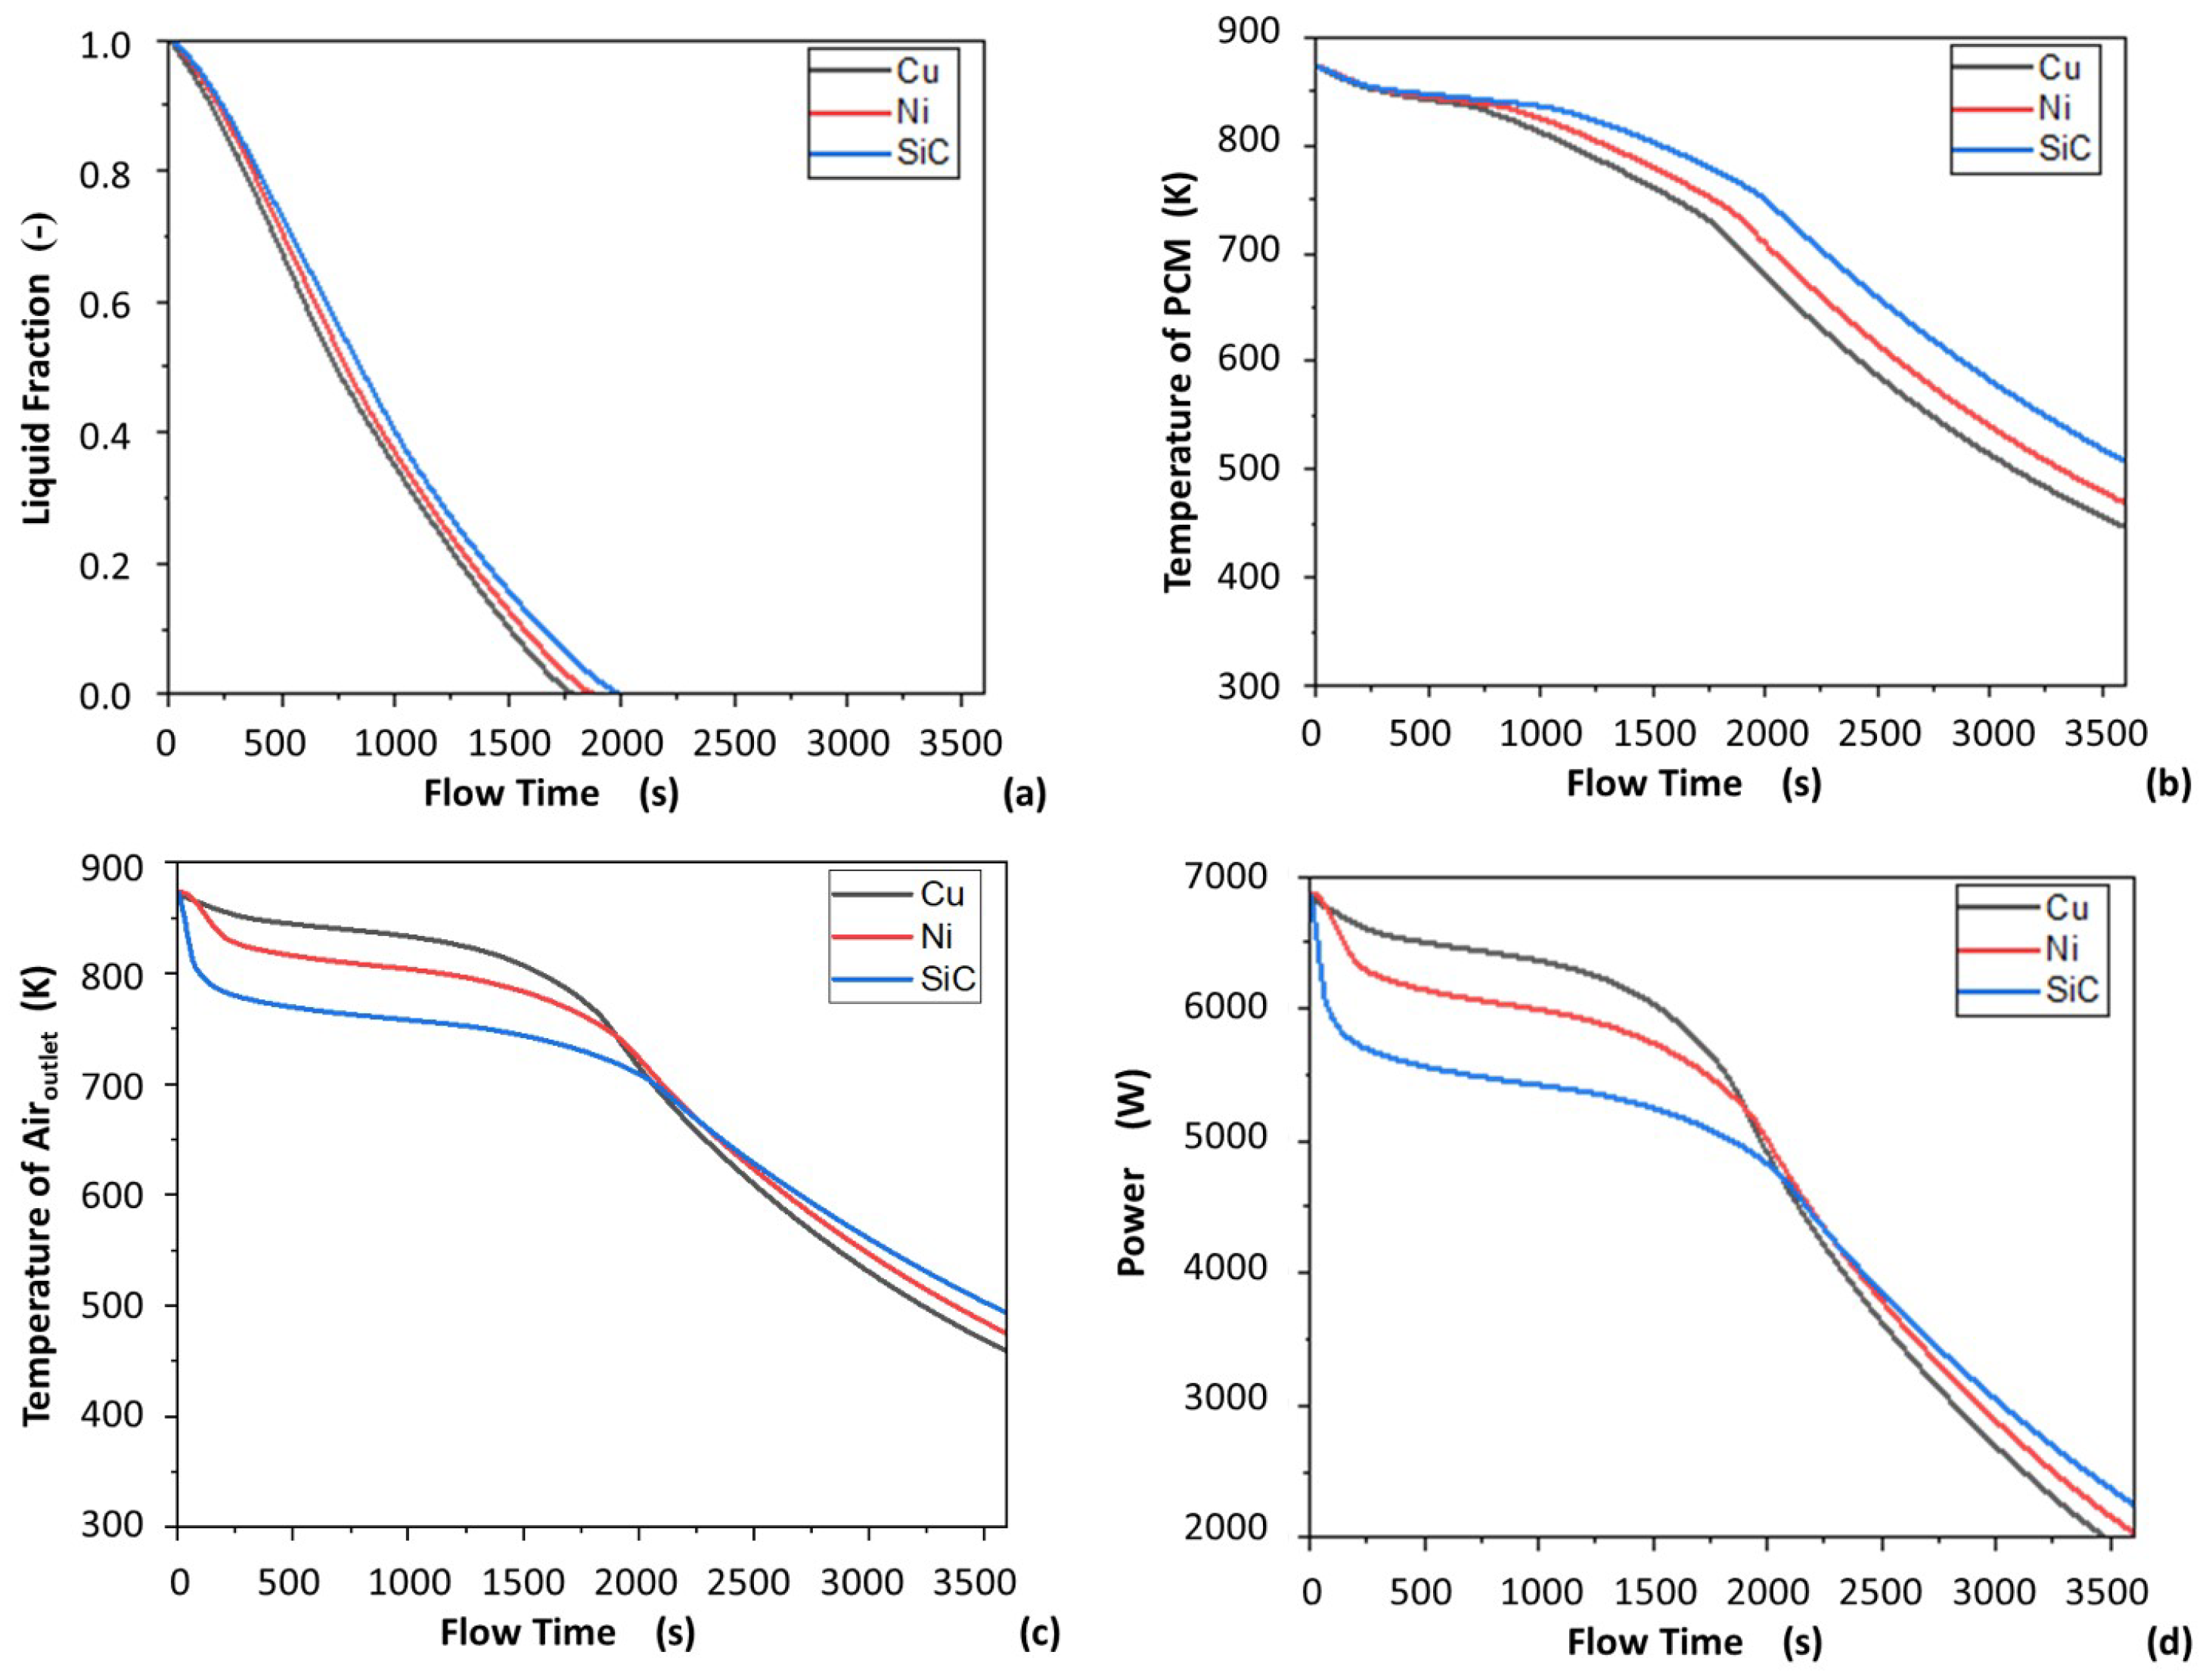
3.4. Comparison of Added Nickel Foam, Copper Foam, and Silicon Carbide Foam

Three porous materials, copper foam, nickel foam, and silicon carbide foam, have been added to the HTF. As shown in Figure 15a,b, the solidification time of the PCM has also been significantly reduced. The discharge power and air outlet temperature of the LHS have been significantly increased by the addition of porous materials in Figure 15c,d. The performance of the three porous materials in terms of heat transfer enhancement is similar and the physical properties of the porous material have little influence on the heat transfer enhancement.

4. Conclusions

A model of a high-temperature latent heat storage device using an AlSi 12 alloy is developed to study the solidification state, solidification time, and air outlet temperature of PCM during solidification. This study included:
  • Validation of the flow model and LTNE model to ensure simulation accuracy.
  • Investigation of the effects of air inlet velocity and the addition of porous materials on an LHS device.
  • Increasing the air inlet velocity, which accelerates the solidification and temperature drop of the AlSi 12 alloy.
  • Solidification of PCM occurring in axial and radial directions without porous material in HTF tube.
  • Increasing the air inlet velocity, which was shown to not change direction of solidification and temperature drop.
  • Increasing the air inlet velocity, which was shown to lead to decreased air outlet temperature and increased heat discharge power.
  • Addition of porous material, which accelerates the solidification process and temperature drop of PCM, reducing the solidification time by more than 85%.
  • Increasing outlet temperature of air and heat discharge power of LHS with the addition of porous material.
  • Addition of porous material, which increases the temperature difference of PCM.
  • Addition of porous material, causing solidification and temperature drop of PCM to occur in the axial direction.
  • Copper foam, nickel foam, and silicon carbide foam were shown to have similar effects on the LHS device, while minimal variation was shown in PCM temperature, solidification time, air exit temperature, and discharge power between different porous materials in the HTF tube.
  • The segmented calculation approach was shown to reduce the computing time.
In the realm of energy conservation and emissions reduction, thermal storage stands as a crucial energy storage technology, offering cost advantages and significant research potential. This paper focuses on enhancing the heat transfer efficiency of thermal energy storage (TES) systems utilizing AlSi 12 alloy as the phase-change material. The approach involves incorporating porous materials on the heat transfer fluid (HTF) side during the solidification process, and numerical simulations are employed to investigate its impact. The study specifically examines the effects of adding porous dielectric materials and increasing air velocity on the thermal performance of high-temperature phase-change energy storage systems. Key parameters analyzed include discharge temperature, discharge power, and discharge time. Interestingly, the introduction of different porous materials (such as copper foam, nickel foam, and silicon carbide foam) into the HTF tube has minimal influence on the temperature of the phase-change material, solidification time, air outlet temperature, and heat discharge power of the latent heat storage (LHS) system. These findings carry significant implications for the design of high-temperature phase-change energy storage devices. By understanding the limited impact of different porous materials on crucial performance factors, researchers and engineers can optimize the design process. Moreover, the study provides valuable guidance and direction for future developments in this field, opening avenues for further advancements in the design and optimization of thermal energy storage systems. Such improvements hold the potential to enhance the efficiency and effectiveness of energy storage, contributing to the overall goals of sustainable energy utilization and environmental preservation.

Author Contributions

Software, G.Q.; Resources, P.Z., Y.L. (Yang Li) and Y.L. (Yongliang Li); Writing—original draft, C.; Writing—review & editing, G.Q. All authors have read and agreed to the published version of the manuscript.

Funding

This studywas funded by the research and development project of State Grid Corporation of China under the grant number: 5419-202158300A-0-0-00, project: Research on metallic composite phase-change material and heat storage module design.

Conflicts of Interest

The authors declare no conflict of interest.

Abbreviations

The following abbreviations are used in this manuscript:
CFDcomputational fluid dynamics
CSPconcentrating solar power
HTFheat transfer fluid
LHSconstant current constant voltage
LNTElocal non-thermal equilibrium
LTElocal thermal equilibrium
mPCMmetallic phase-change material
PCMphase-change material
SIMPLEsemi-implicit method for pressure linked equations
SHSsensible heat storage
TESthermal energy storage
THSthermochemical heat storage
The following symbols are used in this manuscript:
SymbolMeaningUnit
Aheat transfer aream 2
A S additional term in momentum equation-
a sf interfacial area densitym 1
B i Biot number-
Cmushy zone constant-
C E drag coefficient m 1
c s specific heat capacity of porous materialsJ·kg 1 ·K 1
c p , HTF specific heat capacity of HTFJ·kg 1 ·K 1
c p , PCM specific heat capacity of PCMJ·kg 1 ·K 1
c pl the average specific heat of the liquid phaseJ·kg 1 ·K 1
c ps the average specific heat of the solid phaseJ·kg 1 ·K 1
D a Darcy number-
d p pore diameterm
ddiameter of air tubem
fmelt fraction-
ggravitational accelerationm·s 2
Henthalpy of PCMJ/kg
hspecific sensible heat of the PCMJ·kg 1
h HTF convective heat transfer coefficient of HTFW·m 2 ·K 1
h ref reference enthalpyJ·kg 1
h sf fluid-to-solid heat transfer coefficientW·m 2 ·K 1
Kpermeabilitym 2
K ch heat transfer coefficient between cold and heat objectsW·m 2 ·K 1
Llatent heat of the PCMJ·kg 1
L 1 length of the air tube in LHSm
L 2 length of the LHS tubem
lair tube lengthm
mthe mass of PCMkg
N u Nusselt number-
P HTF pressure of HTFPa
P e Peclet number-
P PCM pressure of PCMPa
P r Prandtl Number-
Q s heat capacity of the LHSJ
Rradius of the LHS tubem
R e d Reynolds number-
rradius of the air tube in LHSm
S sf , S u source term-
T HTF temperature of HTFK
T liquidus liquid-phase temperature of PCMK
T in fluid inlet temperatureK
T PCM temperature of PCMK
T solidus solid phase temperature of PCMK
T s temperature of porous materialsK
T w temperature of wallK
t f the final temperatureK
t i the initial temperatureK
t m the melting temperatureK
u HTF velocity of HTFm·s 1
u PCM velocity of PCMm·s 1
V HTF velocity vector of HTFm·s 1
V PCM velocity vector of PCMm·s 1
β liquid fraction of PCM-
ε porosity-
ζ small constant in additional term of momentum equation-
ρ HTF density of HTFkg·m 3
ρ PCM density of PCMkg·m 3
μ HTF dynamic viscosity of HTFkg·m 1 ·s 1
μ PCM dynamic viscosity of PCMkg·m 1 ·s 1
λ HTF thermal conductivity of HTFW·m 1 ·K 1
λ PCM thermal conductivity of PCMW·m 1 ·K 1
λ fe effective thermal conductivity of fluidW·m 1 ·K 1
λ se effective thermal conductivity of solidW·m 1 ·K 1
Φ heat transfer rateW
Δ H change in latent heat during the phase change of the PCMJ·kg 1
Δ t temperature differenceK

References

  1. Inglesi-Lotz, R. The impact of renewable energy consumption to economic growth: A panel data application. Energy Econ. 2016, 53, 58–63. [Google Scholar] [CrossRef] [Green Version]
  2. Gowrisankaran, G.; Reynolds, S.S.; Samano, M. Intermittency and the value of renewable energy. J. Political Econ. 2016, 124, 1187–1234. [Google Scholar] [CrossRef] [Green Version]
  3. Sarbu, I.; Sebarchievici, C. A comprehensive review of thermal energy storage. Sustainability 2018, 10, 191. [Google Scholar] [CrossRef] [Green Version]
  4. Nazir, H.; Batool, M.; Osorio, F.J.B.; Isaza-Ruiz, M.; Xu, X.; Vignarooban, K.; Phelan, P.; Kannan, A.M. Recent developments in phase change materials for energy storage applications: A review. Int. J. Heat Mass Transf. 2019, 129, 491–523. [Google Scholar] [CrossRef]
  5. Tao, Y.B.; He, Y.L. A review of phase change material and performance enhancement method for latent heat storage system. Renew. Sustain. Energy Rev. 2018, 93, 245–259. [Google Scholar] [CrossRef]
  6. Fan, L.; Khodadadi, J.M. Thermal conductivity enhancement of phase change materials for thermal energy storage: A review. Renew. Sustain. Energy Rev. 2011, 15, 24–46. [Google Scholar] [CrossRef]
  7. Saari, J. Heat Exchanger Dimensioning; Lappeenranta University of Technology: Lappeenranta, Finland, 2010. [Google Scholar]
  8. Tao, Y.B.; Liu, Y.K.; He, Y.L. Effects of PCM arrangement and natural convection on charging and discharging performance of shell-and-tube LHS unit. Int. J. Heat Mass Transf. 2017, 115, 99–107. [Google Scholar] [CrossRef]
  9. Fernandez, A.I.; Barreneche, C.; Belusko, M.; Bruno, J.C.; Bristow, D.; Tadeo, F. Considerations for the use of metal alloys as phase change materials for high temperature applications. Sol. Energy Mater. Sol. Cells 2017, 171, 275–281. [Google Scholar] [CrossRef] [Green Version]
  10. Fragnito, A.; Bianco, N.; Iasiello, M.; Mauro, G.M.; Mongibello, L. Experimental and numerical analysis of a phase change material-based shell-and-tube heat exchanger for cold thermal energy storage. J. Energy Storage 2022, 56, 105975. [Google Scholar] [CrossRef]
  11. Faraj, K.; Khaled, M.; Faraj, J.; Hachem, F.; Castelain, C. A review on phase change materials for thermal energy storage in buildings: Heating and hybrid applications. J. Energy Storage 2021, 33, 101913. [Google Scholar] [CrossRef]
  12. Zhao, C.Y.; Wu, Z.G. Heat transfer enhancement of high temperature thermal energy storage using metal foams and expanded graphite. Sol. Energy Mater. Sol. Cells 2011, 95, 636–643. [Google Scholar] [CrossRef]
  13. Liang, W.; Zhang, G.; Sun, H.; Chen, P.; Zhu, Z.; Li, A. Graphene–nickel/n-carboxylic acids composites as form-stable phase change materials for thermal energy storage. Sol. Energy Mater. Sol. Cells 2015, 132, 425–430. [Google Scholar] [CrossRef]
  14. Zhang, P.; Ma, F.; Xiao, X. Thermal energy storage and retrieval characteristics of a molten-salt latent heat thermal energy storage system. Appl. Energy 2016, 173, 255–271. [Google Scholar] [CrossRef]
  15. Siahpush, A.; O’brien, J.; Crepeau, J. Phase change heat transfer enhancement using copper porous foam. In Proceedings of the ASME Summer Heat Transfer Conference, Jacksonville, FL, USA, 10–14 August 2008; American Society of Mechanical Engineers: New York, NY, USA, 2008. [Google Scholar]
  16. Meng, Z.N.; Zhang, P. Experimental and numerical investigation of a tube-in-tank latent thermal energy storage unit using composite PCM. Appl. Energy 2017, 190, 524–539. [Google Scholar] [CrossRef]
  17. Wang, Z.; Zhang, Z.; Jia, L.; Yang, L. Paraffin and paraffin/aluminum foam composite phase change material heat storage experimental study based on thermal management of Li-ion battery. Appl. Therm. Eng. 2015, 78, 428–436. [Google Scholar] [CrossRef]
  18. Mat, S.; Al-Abidi, A.A.; Sopian, K.; Sulaiman, M.Y.; Mohammad, A.T. Enhance heat transfer for PCM melting in triplex tube with internal-external fins. Energy Convers. Manag. 2013, 74, 223–236. [Google Scholar] [CrossRef]
  19. Stritih, U. An experimental study of enhanced heat transfer in rectangular PCM thermal storage. Int. J. Heat Mass Transf. 2004, 47, 2841–2847. [Google Scholar] [CrossRef]
  20. Nithyanandam, K.; Pitchumani, R. Analysis and optimization of a latent thermal energy storage system with embedded heat pipes. Int. J. Heat Mass Transf. 2011, 54, 4596–4610. [Google Scholar] [CrossRef]
  21. Hemati, R.; Veysi, F.; Qaderi, A. Experimental investigation of the simultaneous effect of using phase change material/plate-fin heat sink on thermal performance of a power supply unit. Sustain. Energy Technol. Assess. 2022, 52, 102009. [Google Scholar] [CrossRef]
  22. Tao, Y.B.; He, Y.L.; Liu, Y.K.; Tao, W.Q. Performance optimization of two-stage latent heat storage unit based on entransy theory. Int. J. Heat Mass Transf. 2014, 77, 695–703. [Google Scholar] [CrossRef]
  23. Kolsi, L.; Hussein, A.K.; Hassen, W.; Ben Said, L.; Ayadi, B.; Rajhi, W.; Labidi, T.; Shawabkeh, A.; Ramesh, K. Numerical Study of a Phase Change Material Energy Storage Tank Working with Carbon Nanotube-Water Nanofluid under Ha’il City Climatic Conditions. Mathematics 2023, 11, 1057. [Google Scholar] [CrossRef]
  24. Ouri, H.; Selimefendigil, F.; Bouterra, M.; Omri, M.; Alshammari, B.M.; Kolsi, L. MHD hybrid nanofluid convection and phase change process in an L-shaped vented cavity equipped with an inner rotating cylinder and PCM-packed bed system. Alex. Eng. J. 2023, 63, 563–582. [Google Scholar] [CrossRef]
  25. Li, Q.; Qiao, G.; Mura, E.; Li, C.; Fischer, L.; Ding, Y. Experimental and numerical studies of a fatty acid based phase change dispersion for enhancing cooling of high voltage electrical devices. Energy 2020, 198, 117280. [Google Scholar] [CrossRef]
  26. Wang, C.; Zhu, Y. Experimental and Numerical Studies on Phase Change Materials. In Phase Change Materials and Their Applications; IntechOpen: London, UK, 2018. [Google Scholar]
  27. Nikanorov, S.P.; Volkov, M.P.; Gurin, V.N.; Burenkov, Y.A.; Derkachenko, L.I.; Kardashev, B.K.; Regel, L.L.; Wilcox, W.R. Structural and Mechanical Properties of Al–Si Alloys Obtained by Fast Cooling of a Levitated Melt. Mater. Sci. Eng. A 2005, 390, 63–69. [Google Scholar] [CrossRef]
  28. Schmitz, J.; Hallstedt, B.; Brillo, J.; Egry, I.; Schick, M. Density and Thermal Expansion of Liquid Al–Si Alloys. J. Mater. Sci. 2012, 47, 3706–3712. [Google Scholar] [CrossRef]
  29. Assael, M.J.; Mihailidou, E.K.; Brillo, J.; Stankus, S.V.; Wu, J.T.; Wakeham, W.A. Reference correlation for the density and viscosity of eutectic liquid alloys Al+ Si, Pb+ Bi, and Pb+ Sn. J. Phys. Chem. Ref. Data 2012, 41, 033103. [Google Scholar] [CrossRef] [Green Version]
  30. Dry Air—Thermodynamic and Physical Properties. Available online: https://www.engineeringtoolbox.com/dry-air-properties-d_973.html (accessed on 21 January 2023).
  31. Chen, X. Investigation on Forced Convection and Coupled Heat Transfer with High Temperature Radiation in Cellular Porous Material. Ph.D. Thesis, Harbin Institute of Technology, Harbin, China, 2016. [Google Scholar]
  32. Yang, Q.; Tao, W. Heat Transfer, 3rd ed.; Higher Education Press: Beijing, China, 1998. [Google Scholar]
  33. Khashan, S.A.; Al-Amiri, A.M.; Al-Nimr, M.A. Assessment of the local thermal non-equilibrium condition in developing forced convection flows through fluid-saturated porous tubes. Appl. Therm. Eng. 2005, 25, 1429–1445. [Google Scholar] [CrossRef]
Figure 1. (a) Three-dimensional view of the heat exchanger of the LHS. (b) Two-dimensional axisymmetric view of the heat exchanger of the LHS without porous material. (c) Two-dimensional axisymmetric view of the heat exchanger of the LHS with porous material.
Energies 16 05729 g001
Figure 2. Dynamic viscosity diagram of AlSi 12 alloy [29].
Energies 16 05729 g002
Figure 3. Two-dimensional axisymmetric numerical model of the heat exchanger of the LHS.
Energies 16 05729 g003
Figure 4. Numerical model for turbulence model validation.
Energies 16 05729 g004
Figure 5. Comparison of the Nusselt number for air inlet velocity of 2 m/s: (a) SST k- ω model, (b) RNG k- ε model, and (c) realized k- ε model. Schemes follow the same formatting.
Energies 16 05729 g005
Figure 6. Comparison of the Nusselt number for an air inlet velocity of 6 m/s: (a) Fluid dimensionless temperature X = 0.2 D , (b) Solid dimensionless temperature X = 0.2 D .
Energies 16 05729 g006
Figure 7. Liquid-phase fraction of PCM when no porous material is added, and the air inlet velocity is 4 m/s: (a ) Flow time 1200 s, (b ) Flow time 3600 s, (c ) Flow time 7800 s, (d ) Flow time 12,000 s. Temperature of PCM when no porous material is added, and the air inlet velocity is 4 m/s: (a ) Flow time 1200 s, (b ) Flow time 3600 s, (c ) Flow time 7800 s, (d ) Flow time 12,000 s.
Energies 16 05729 g007
Figure 8. Liquid phase fraction of PCM when no porous material is added, and the air inlet velocity is 4 m/s: (a ) flow time 1200 s, (b ) flow time 3600 s, (c ) flow time 7800 s; when the air inlet velocity is 8 m/s: (a ) flow time 1200 s, (b ) flow time 3600 s, (c ) flow time 7800 s.
Energies 16 05729 g008
Figure 9. Temperature of PCM when no porous material is added, and the air inlet velocity is 4 m/s: (a ) flow time 1200 s, (b ) flow time 3600 s, (c ) flow time 7800 s; when the air inlet velocity is 8 m/s: (a ) flow time 1200 s, (b ) flow time 3600 s, (c ) flow time 7800 s.
Energies 16 05729 g009
Figure 10. (a) Liquid fraction of PCM without added porous material in HTF tubes. (b) Temperature of PCM without added porous material in HTF tubes.
Energies 16 05729 g010
Figure 11. (a) Air outlet temperature in HTF tubes without added porous material. (b) Discharge power in HTF tubes without added porous material.
Energies 16 05729 g011
Figure 12. Liquid phase fraction of PCM when nickel foam is added and the air inlet velocity is 4 m/s: (a ) flow time 100 s, (b ) flow time 300 s, (c ) flow time 800 s, (d ) flow time 1250 s, (e ) flow time 1750 s, (f ) flow time 1900 s. Liquid-phase fraction of PCM when no porous material is added and the air inlet velocity is 4 m/s: (a ) flow time 100 s, (b ) flow time 300 s, (c ) flow time 800 s, (d ) flow time 1250 s, (e ) flow time 1750 s, (f ) flow time 1900 s.
Energies 16 05729 g012
Figure 13. Temperature of PCM when nickel foam is added and the air inlet velocity is 4 m/s: (a ) flow time 100 s, (b ) flow time 300 s, (c ) flow time 800 s, (d ) flow time 1250 s, (e ) flow time 1750 s. Temperature of PCM when no porous material is added and the air inlet velocity is 4 m/s: (a ) flow time 1200 s, (b ) flow time 3600 s, (c ) flow time 7800 s, (d ) flow time 12,000 s, (e ) flow time 15,000 s.
Energies 16 05729 g013
Figure 15. (a) Liquid phase fraction of AlSi 12 alloy at air inlet velocity of 4 m/s when HTF tubes are added with porous materials: copper foam, nickel foam, silicon carbide foam. (b) Temperature of PCM at air inlet velocity of 4 m/s when HTF tubes are added with porous materials: copper foam, nickel foam, silicon carbide foam. (c) Air outlet temperature of AlSi 12 alloy at air inlet velocity of 4 m/s when HTF tubes are added with porous materials: copper foam, nickel foam, silicon carbide foam. (d) Discharge power of AlSi 12 alloy at air inlet velocity of 4 m/s when HTF tubes are added with porous materials: copper foam, nickel foam, silicon carbide foam.
Energies 16 05729 g015
Table 1. Physical properties of AlSi 12 [27,28,29].
PropertiesUnitValue
Density at 298.15 K (25 ° C)kg·m 3 2642
Density at Liquidus Temperaturekg·m 3 2460
Cp (Specific Heat) at Solid 298.15 K (25 ° C)J·kg 1 ·K 1 1038
Cp (Specific Heat) at LiquidJ·kg 1 ·K 1 1741
Thermal Conductivity, solidW·m 1 ·K 1 180
Thermal Conductivity, liquidW·m 1 ·K 1 70
Thermal Expansion CoefficientK 1 0.000131
Pure Solvent Melting HeatJ·kg 1 470,000
Melting Temperature ° C576
Table 2. Physical properties of air [30].
T (K) ρ H T F (kg·m 3 ) c p , H T F (J·kg 1 ·K 1 ) λ H T F (W·m 1 ·K 1 )
2751.2841003.80.02428
3001.1771004.90.02624
3251.0861006.30.02816
3501.0091008.20.03003
3750.94131010.60.03186
4000.88241013.50.03365
4500.78441020.60.0371
5000.7061029.50.04041
5500.64181039.80.04357
6000.58831051.10.04661
6500.5431062.90.04954
7000.504310750.05236
7500.470610870.05509
8000.44121098.70.05774
8500.41531110.10.0603
9000.39221120.90.06276
Table 3. Physical properties of raw materials for porous materials [31] 1.
Raw Materials for Porous MaterialsDensity (kg·m 3 )Specific Heat Capacity (J·kg 1 ·K 1 )Thermal Conductivity (W·m 1 ·K 1 )
Copper8930386398
Nickel890044491.4
Silicon carbide3210124480
1 Reproduced with permission from Chen 2016 [31].
Table 4. Physical properties of porous materials [31] 1.
Porous MaterialsPermeability (m 2 )Drag Coefficient (m 1 )Pore Diameter (m)Porosity
Copper foam1.092 × 10 7 451.880.0010470.9
Nickel foam7.345 × 10 8 659.20.0010070.87
Silicon carbide foam2.369 × 10 7 515.20.0018510.88
1 Reproduced with permission Chen 2016 [31].
Table 5. Parameters for LTNE model validation.
Physical PropertiesUnitValue
λ H T F W·m 1 ·K 1 10
λ s W·m 1 ·K 1 99
c p , H T F J·kg 1 ·K 1 1000
ρ H T F kg·m 3 1
μ H T F kg·m 1 ·K 1 1.01 × 10 2
ε -0.99
u H T F m·s 1 1
Dm0.1
Km 2 9.9 × 10 9
C E m 1 1.02 × 10 4
h s f W·m 2 ·K 1 99
a s f m 1 5
λ f e W·m 1 ·K 1 9.9
λ s e W·m 1 ·K 1 0.99
Disclaimer/Publisher’s Note: The statements, opinions and data contained in all publications are solely those of the individual author(s) and contributor(s) and not of MDPI and/or the editor(s). MDPI and/or the editor(s) disclaim responsibility for any injury to people or property resulting from any ideas, methods, instructions or products referred to in the content.

