
Multi-Performance Characterization of a Modular Wooden House

 ,
,  ,
,  ,
,  ,
,
Abstract
:1. Introduction
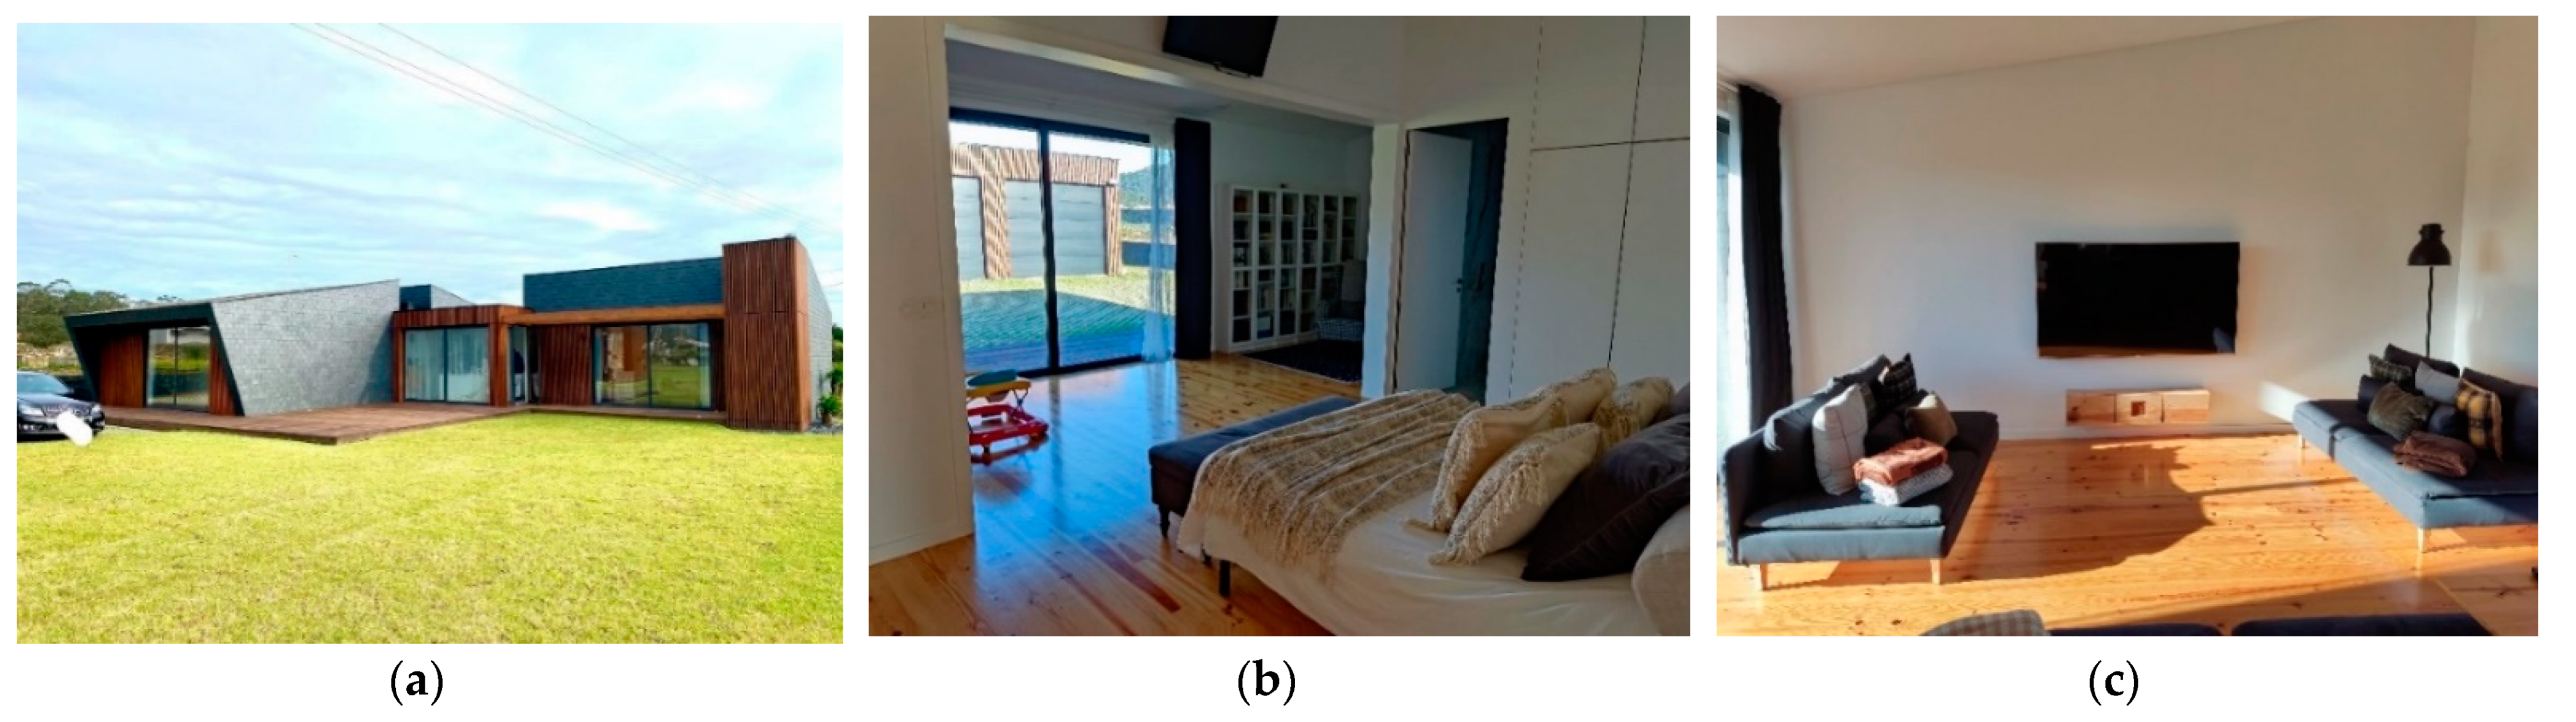
2. Case Study
2.1. Modular Wooden House
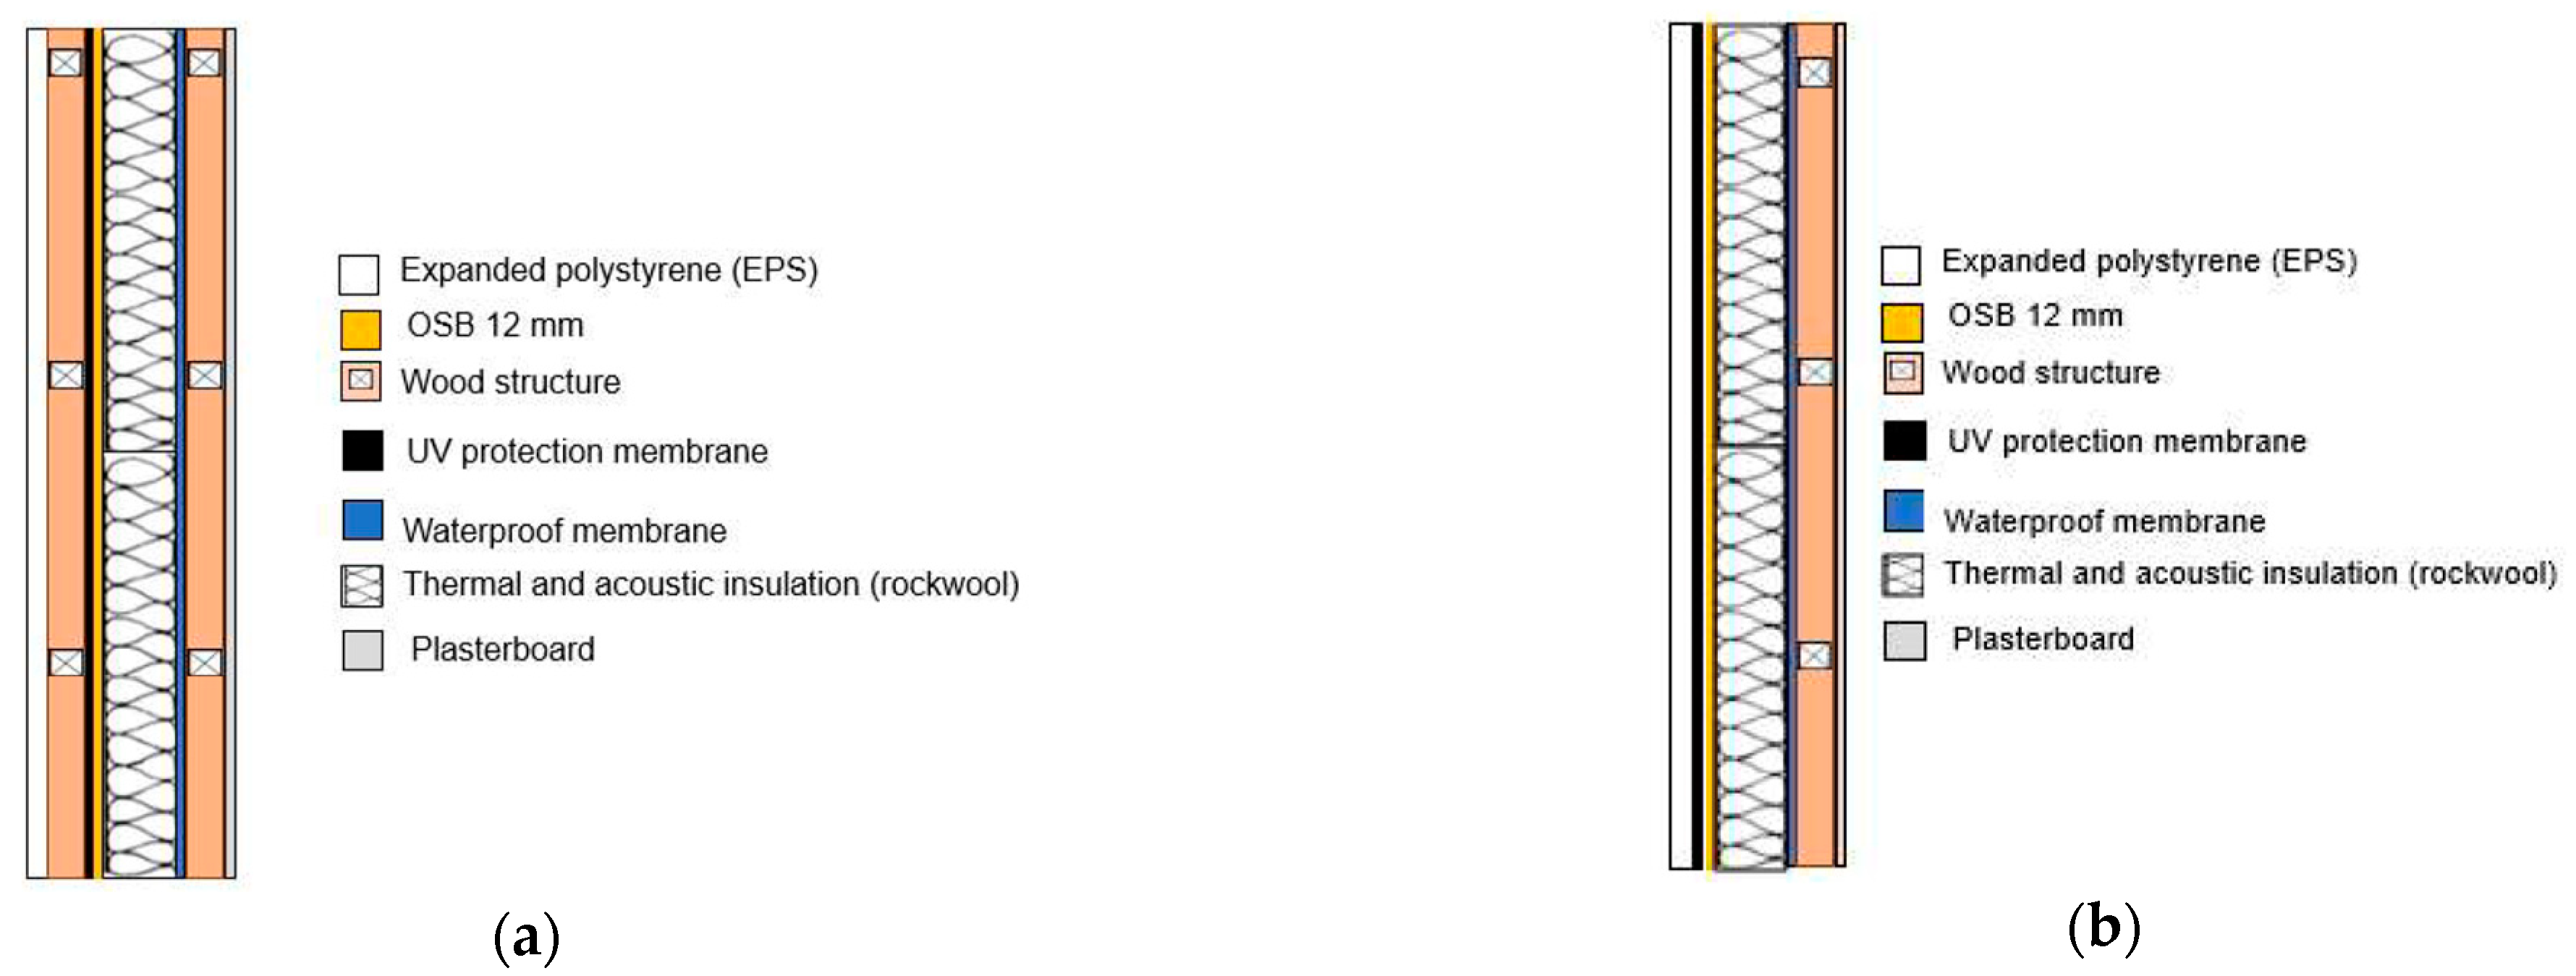
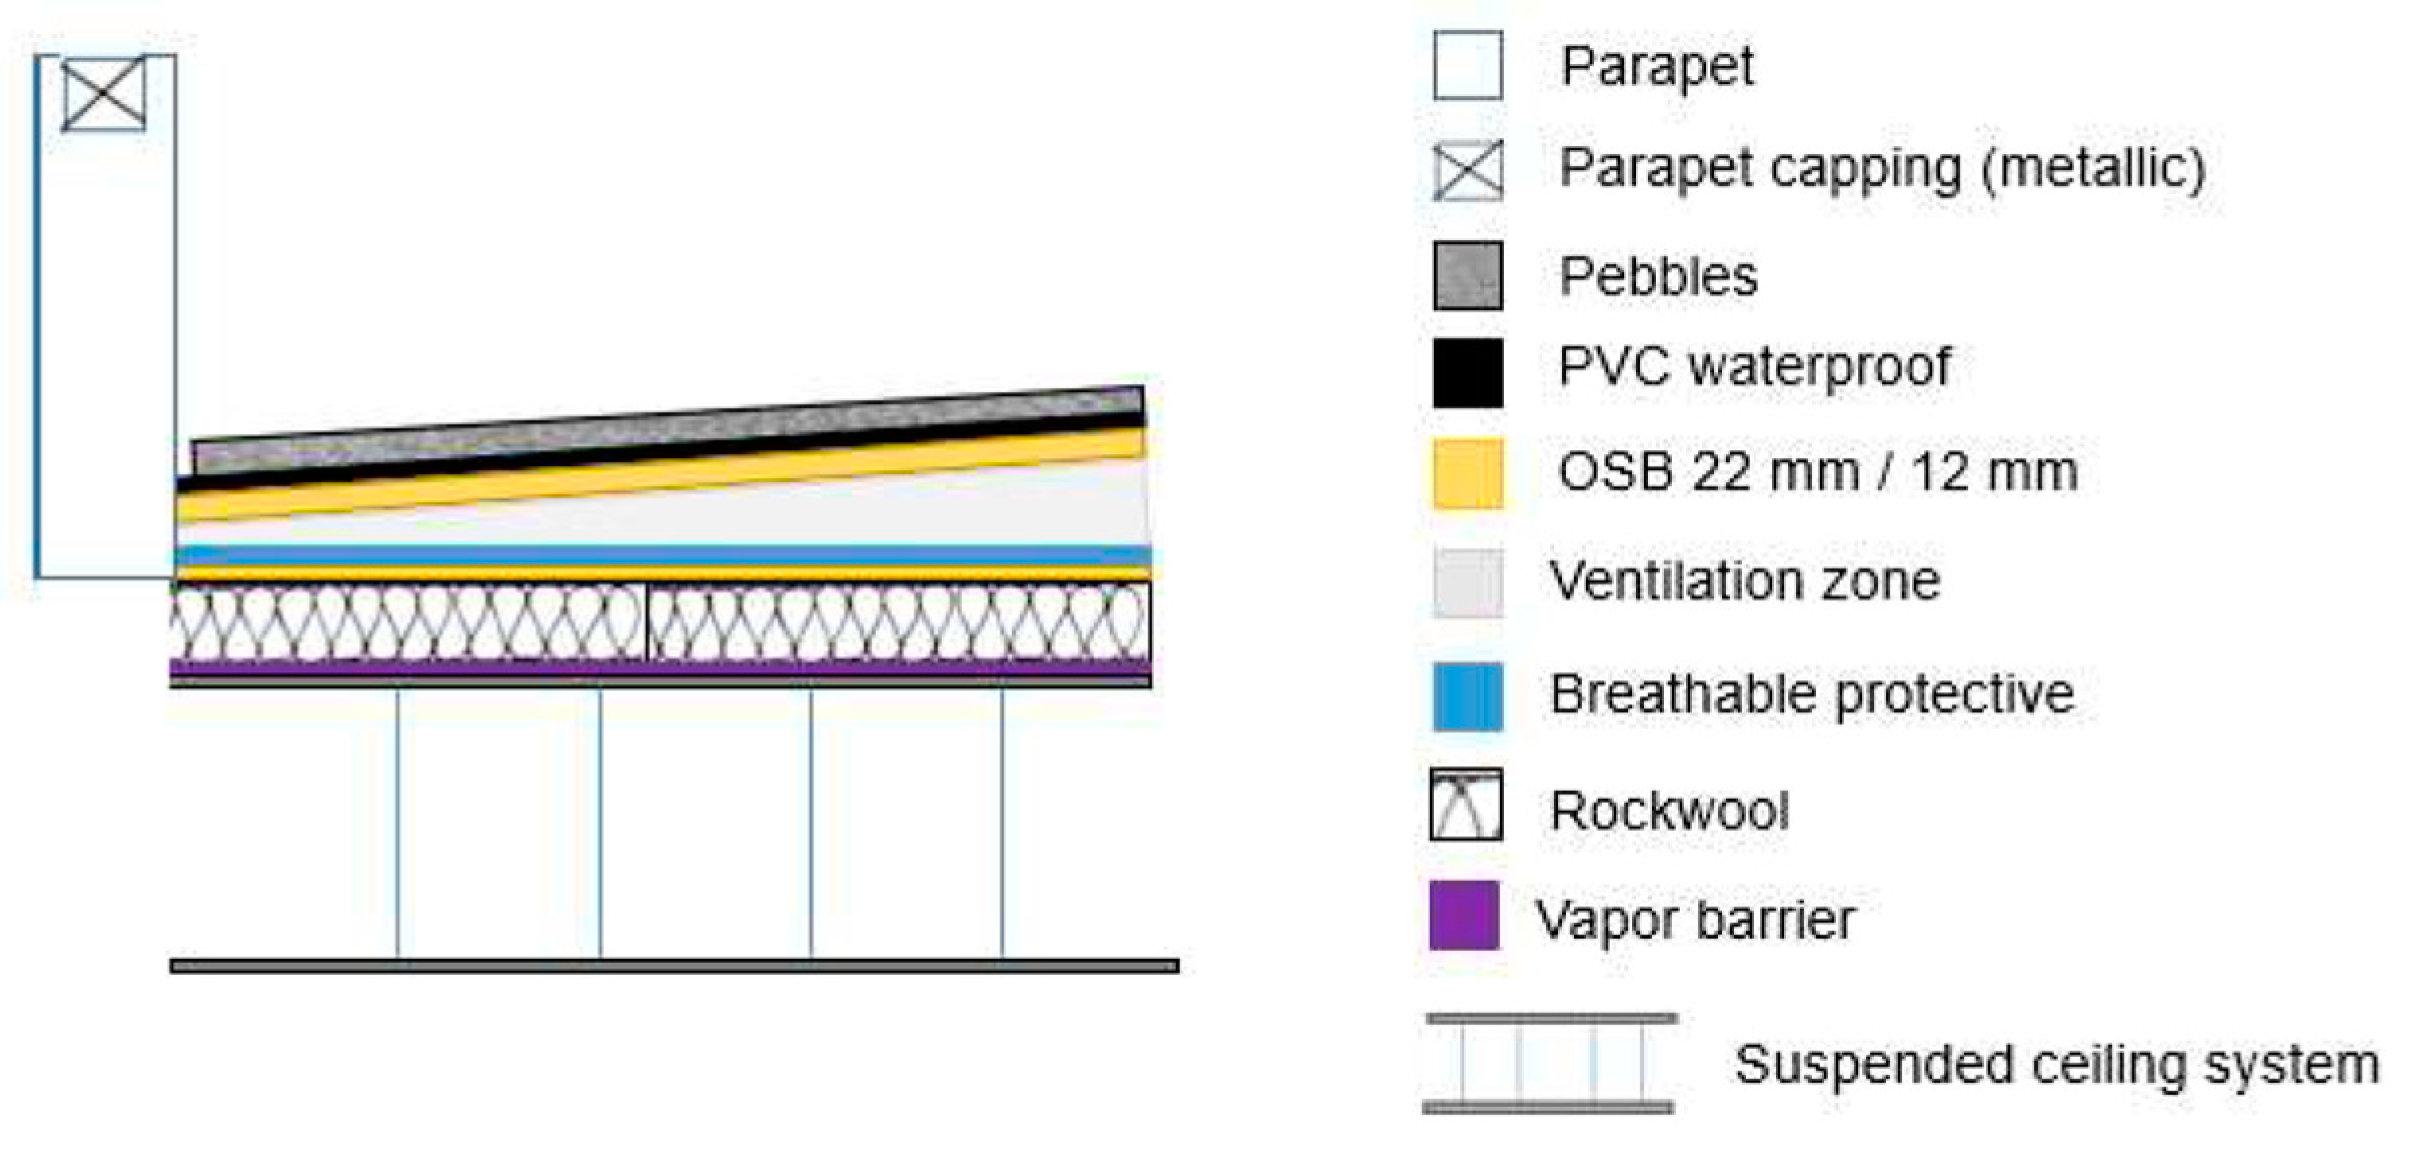
2.2. Constructive Solutions
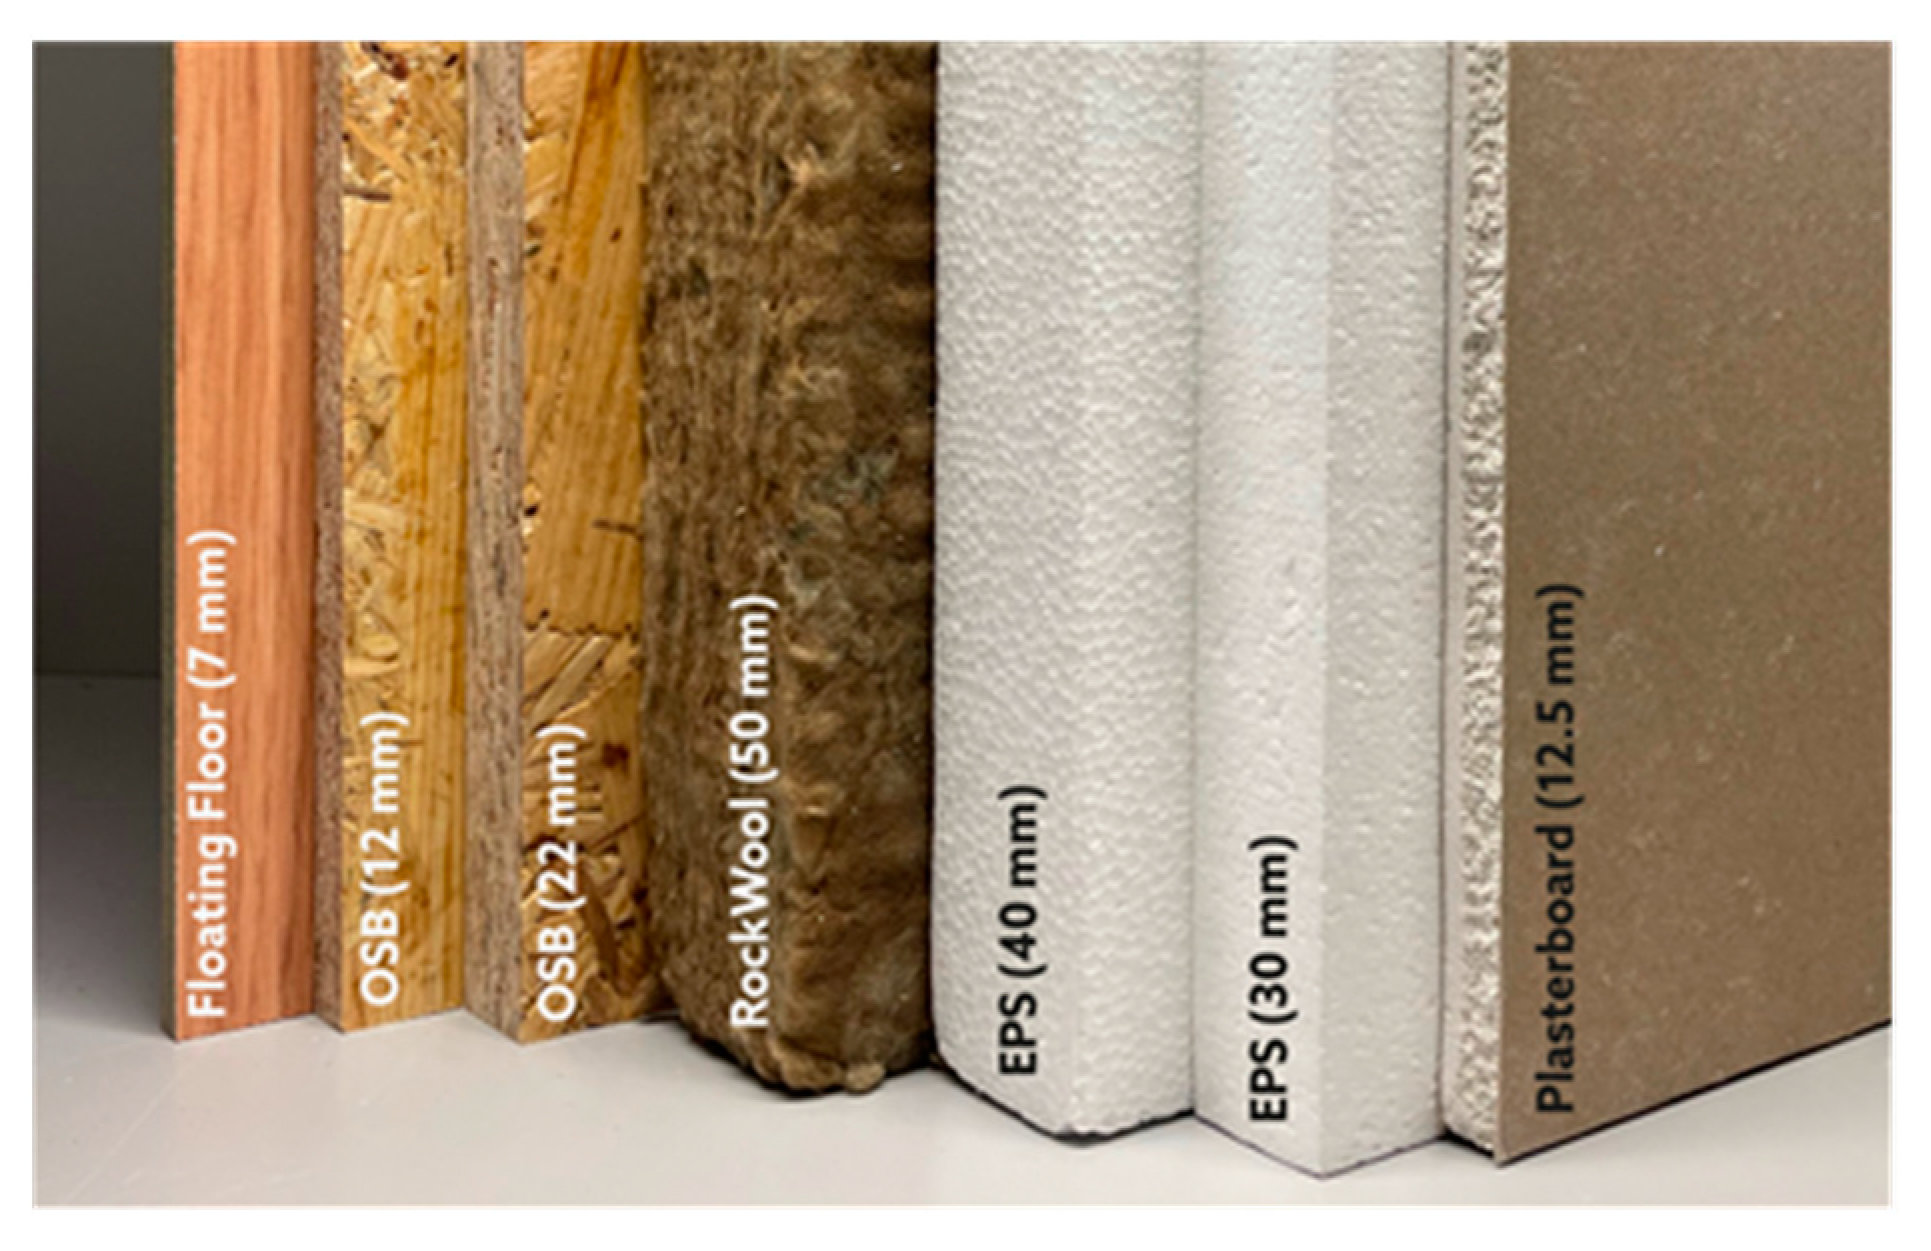
2.3. Materials Characterization

| Material | Thickness (mm) | MC (%) | D (kg/m3) | TS (%) | IB (N/mm2) | BS (N/mm2) | |
|---|---|---|---|---|---|---|---|
| OSB | 11.97 ± 0.03 | 7.4 ± 12.1 | 644 ± 30 | 12.1 ± 2.3 | 0.71 ± 0.06 | Major axis | 31.3 ± 3.6 |
| Minor axis | 19.1 ± 1.6 | ||||||
| OSB | 22 | Major axis | 30.25 ± 5.4 | ||||
| Minor axis | 17.7 ± 1.6 | ||||||
| EN 300 [18] (Type OSB/3) | >10 to <18 | 15 | 0.32 | Major axis | 20 | ||
| Minor axis | 10 | ||||||
| EN 300 [18] (Type OSB/3) | >18 to <22 | 12 | 0.4 | Major axis | 26 | ||
| Minor axis | 14 | ||||||
| Flooring HDF | 6.97 ± 0.01 | 6.2 ± 0.1 | 966 ± 9 | 0.3 | 1.7 | 53.0 ± 1.1 | |
| EN 622-5 [33] (type MDF.HLS) | >6 to <9 | 12 | 0.8 | 32 | |||
| Thermowood® | 26.85 ± 0.07 | 8.0 ± 0.6 | 561 ± 12 | 1.3 ± 0.1 | 47.9 ± 6.1 | ||
| Wood CL4 | 28± 0.01 | 10.7 ± 0.0 | 438 ± 19 | - | - | 67.8 ± 2.8 | |
| Material | Formaldehyde Emission (mg/m2 h) | Formaldehyde Content (mg/100 g Oven Dry Board) | Classification EN 13986+A1 [15] |
|---|---|---|---|
| Flooring–HDF | 0.6 ± 0.04 | E1 | |
| OSB (12 mm) | 0.6 ± 0.07 | E1 |
| Material | Equilibrium Moisture Content (20 °C; 65% RH) | Density (kg/m3) | Shrinkage (%) from Green to Oven-Dry Moisture Content | ||
|---|---|---|---|---|---|
| Tangential | Radial | Volumetric | |||
| Thermowood® | 7.9 ± 0.0 | 550 ± 12 | 5.6 ± 0.3 | 3.5 ± 0.1 | 9.3 ± 0.2 |
| Pinus sylvestris (non-treated) | 12 | 550 | 7.5 | 4.0 | 13.4 |
| Wood CL4 | 10.7 ± 0.0 | 438 ± 19 | 8.0 ± 0.0 | 3.7 ± 0.3 | 11.9 ± 0.3 |
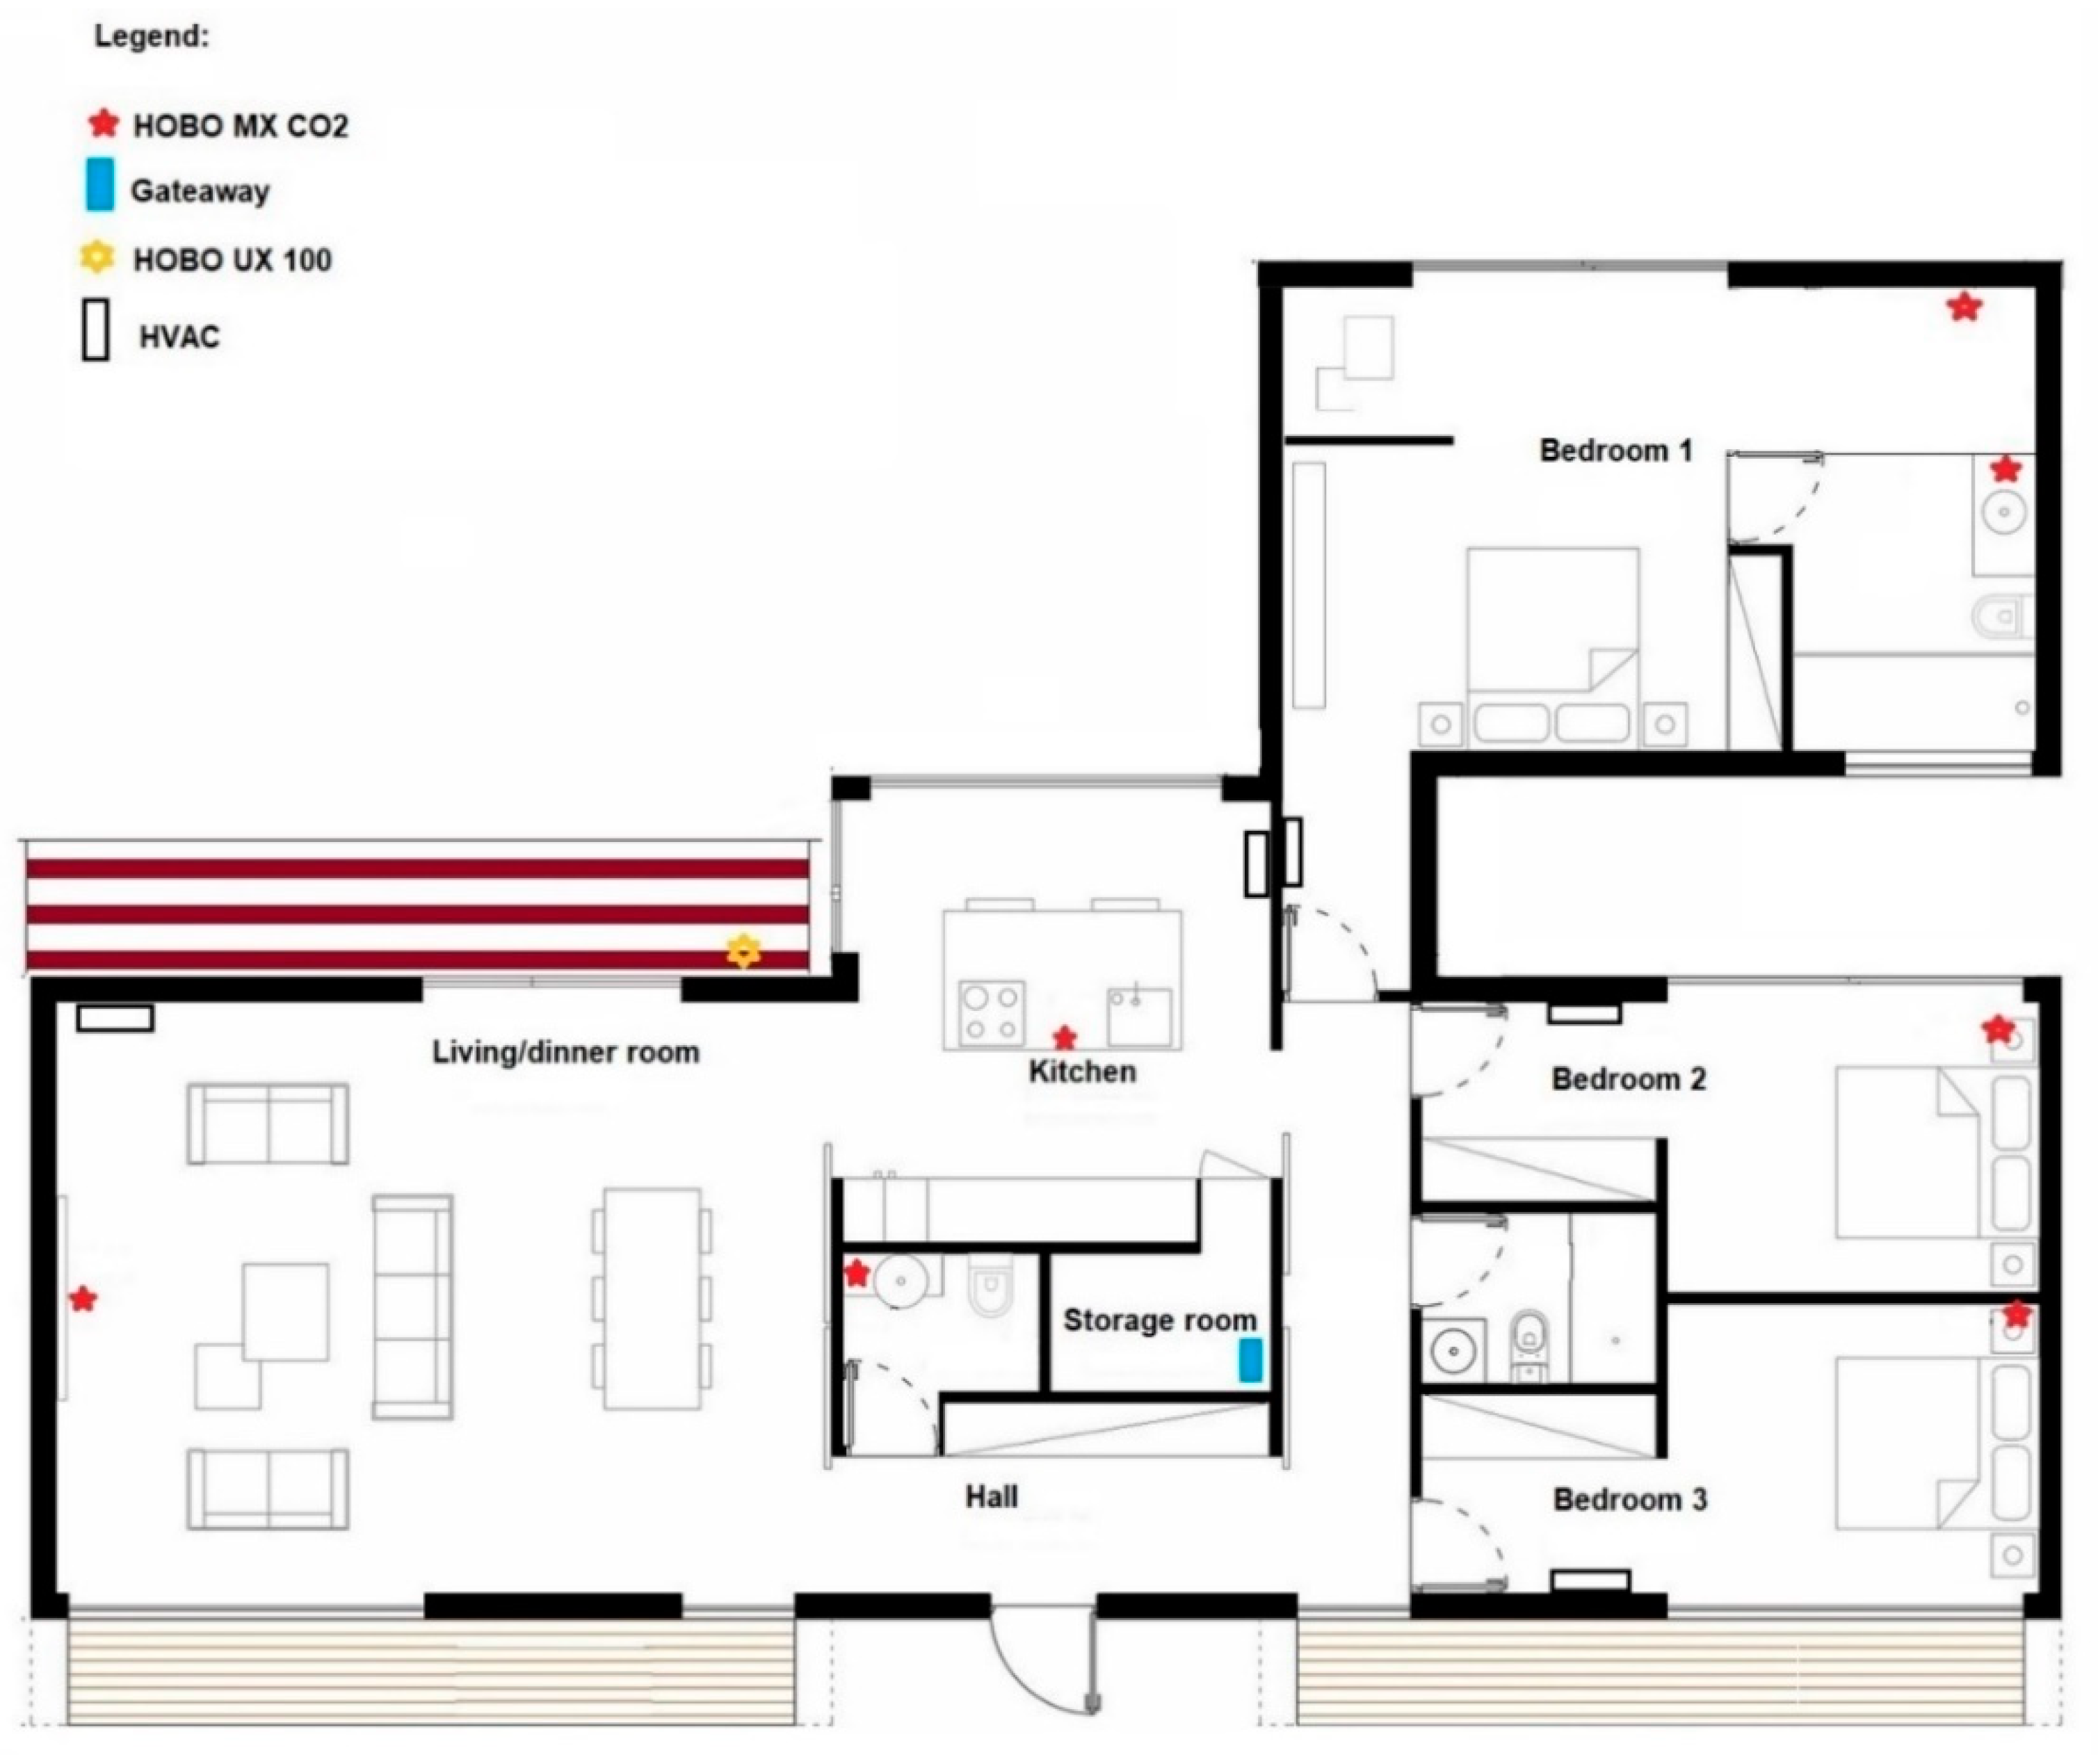
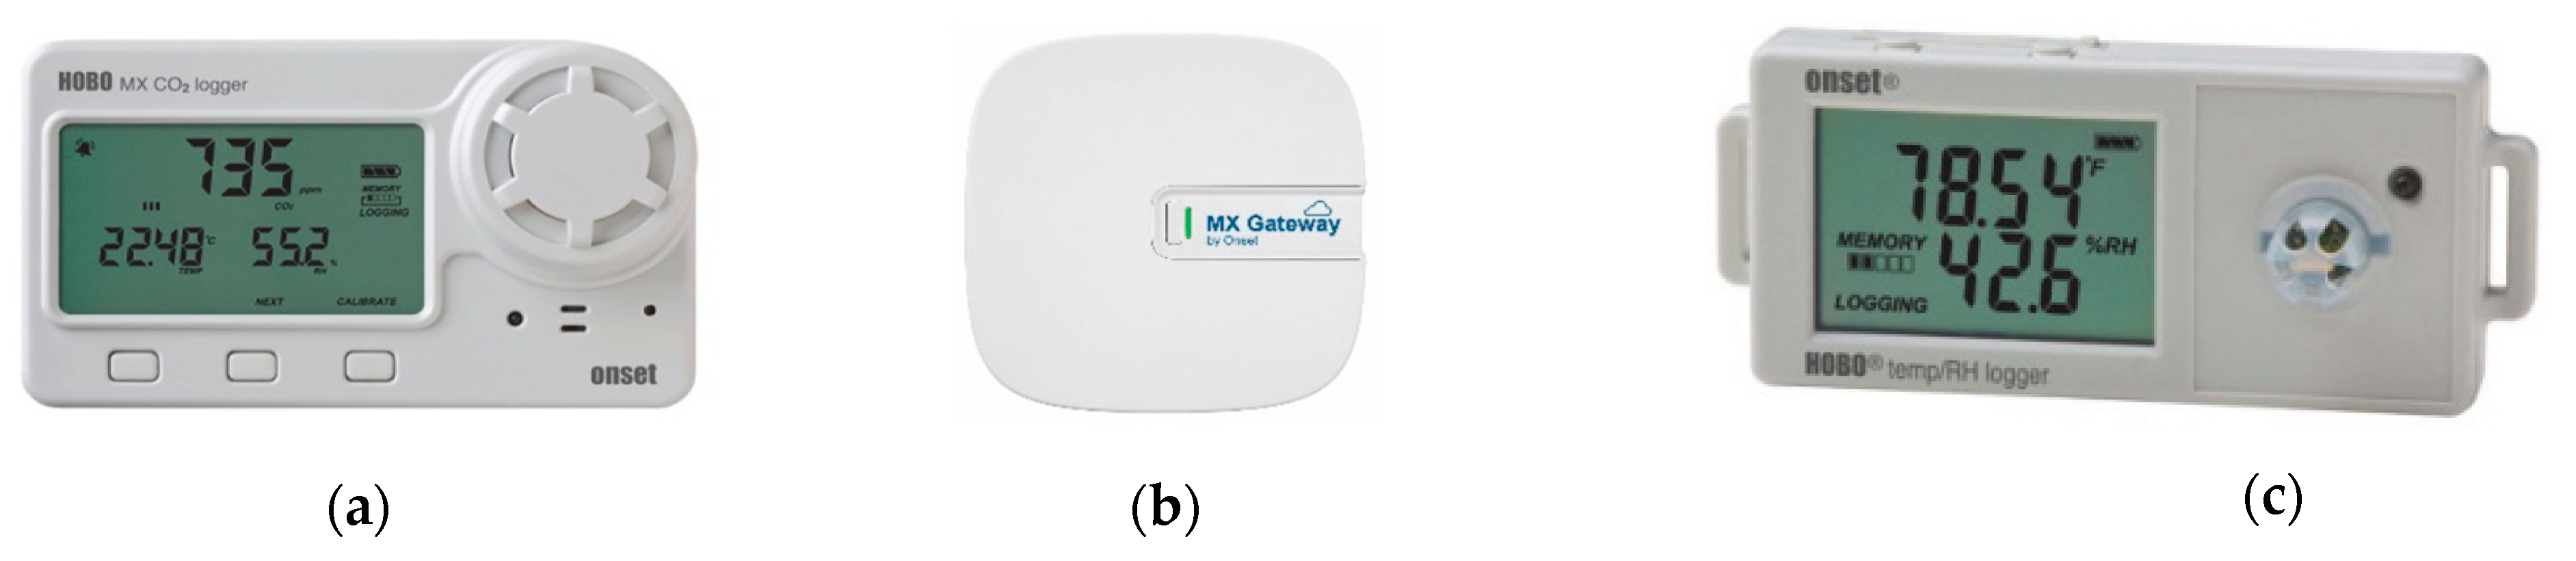
2.4. Monitoring Plan
2.5. Numerical Simulation
3. Results and Discussion
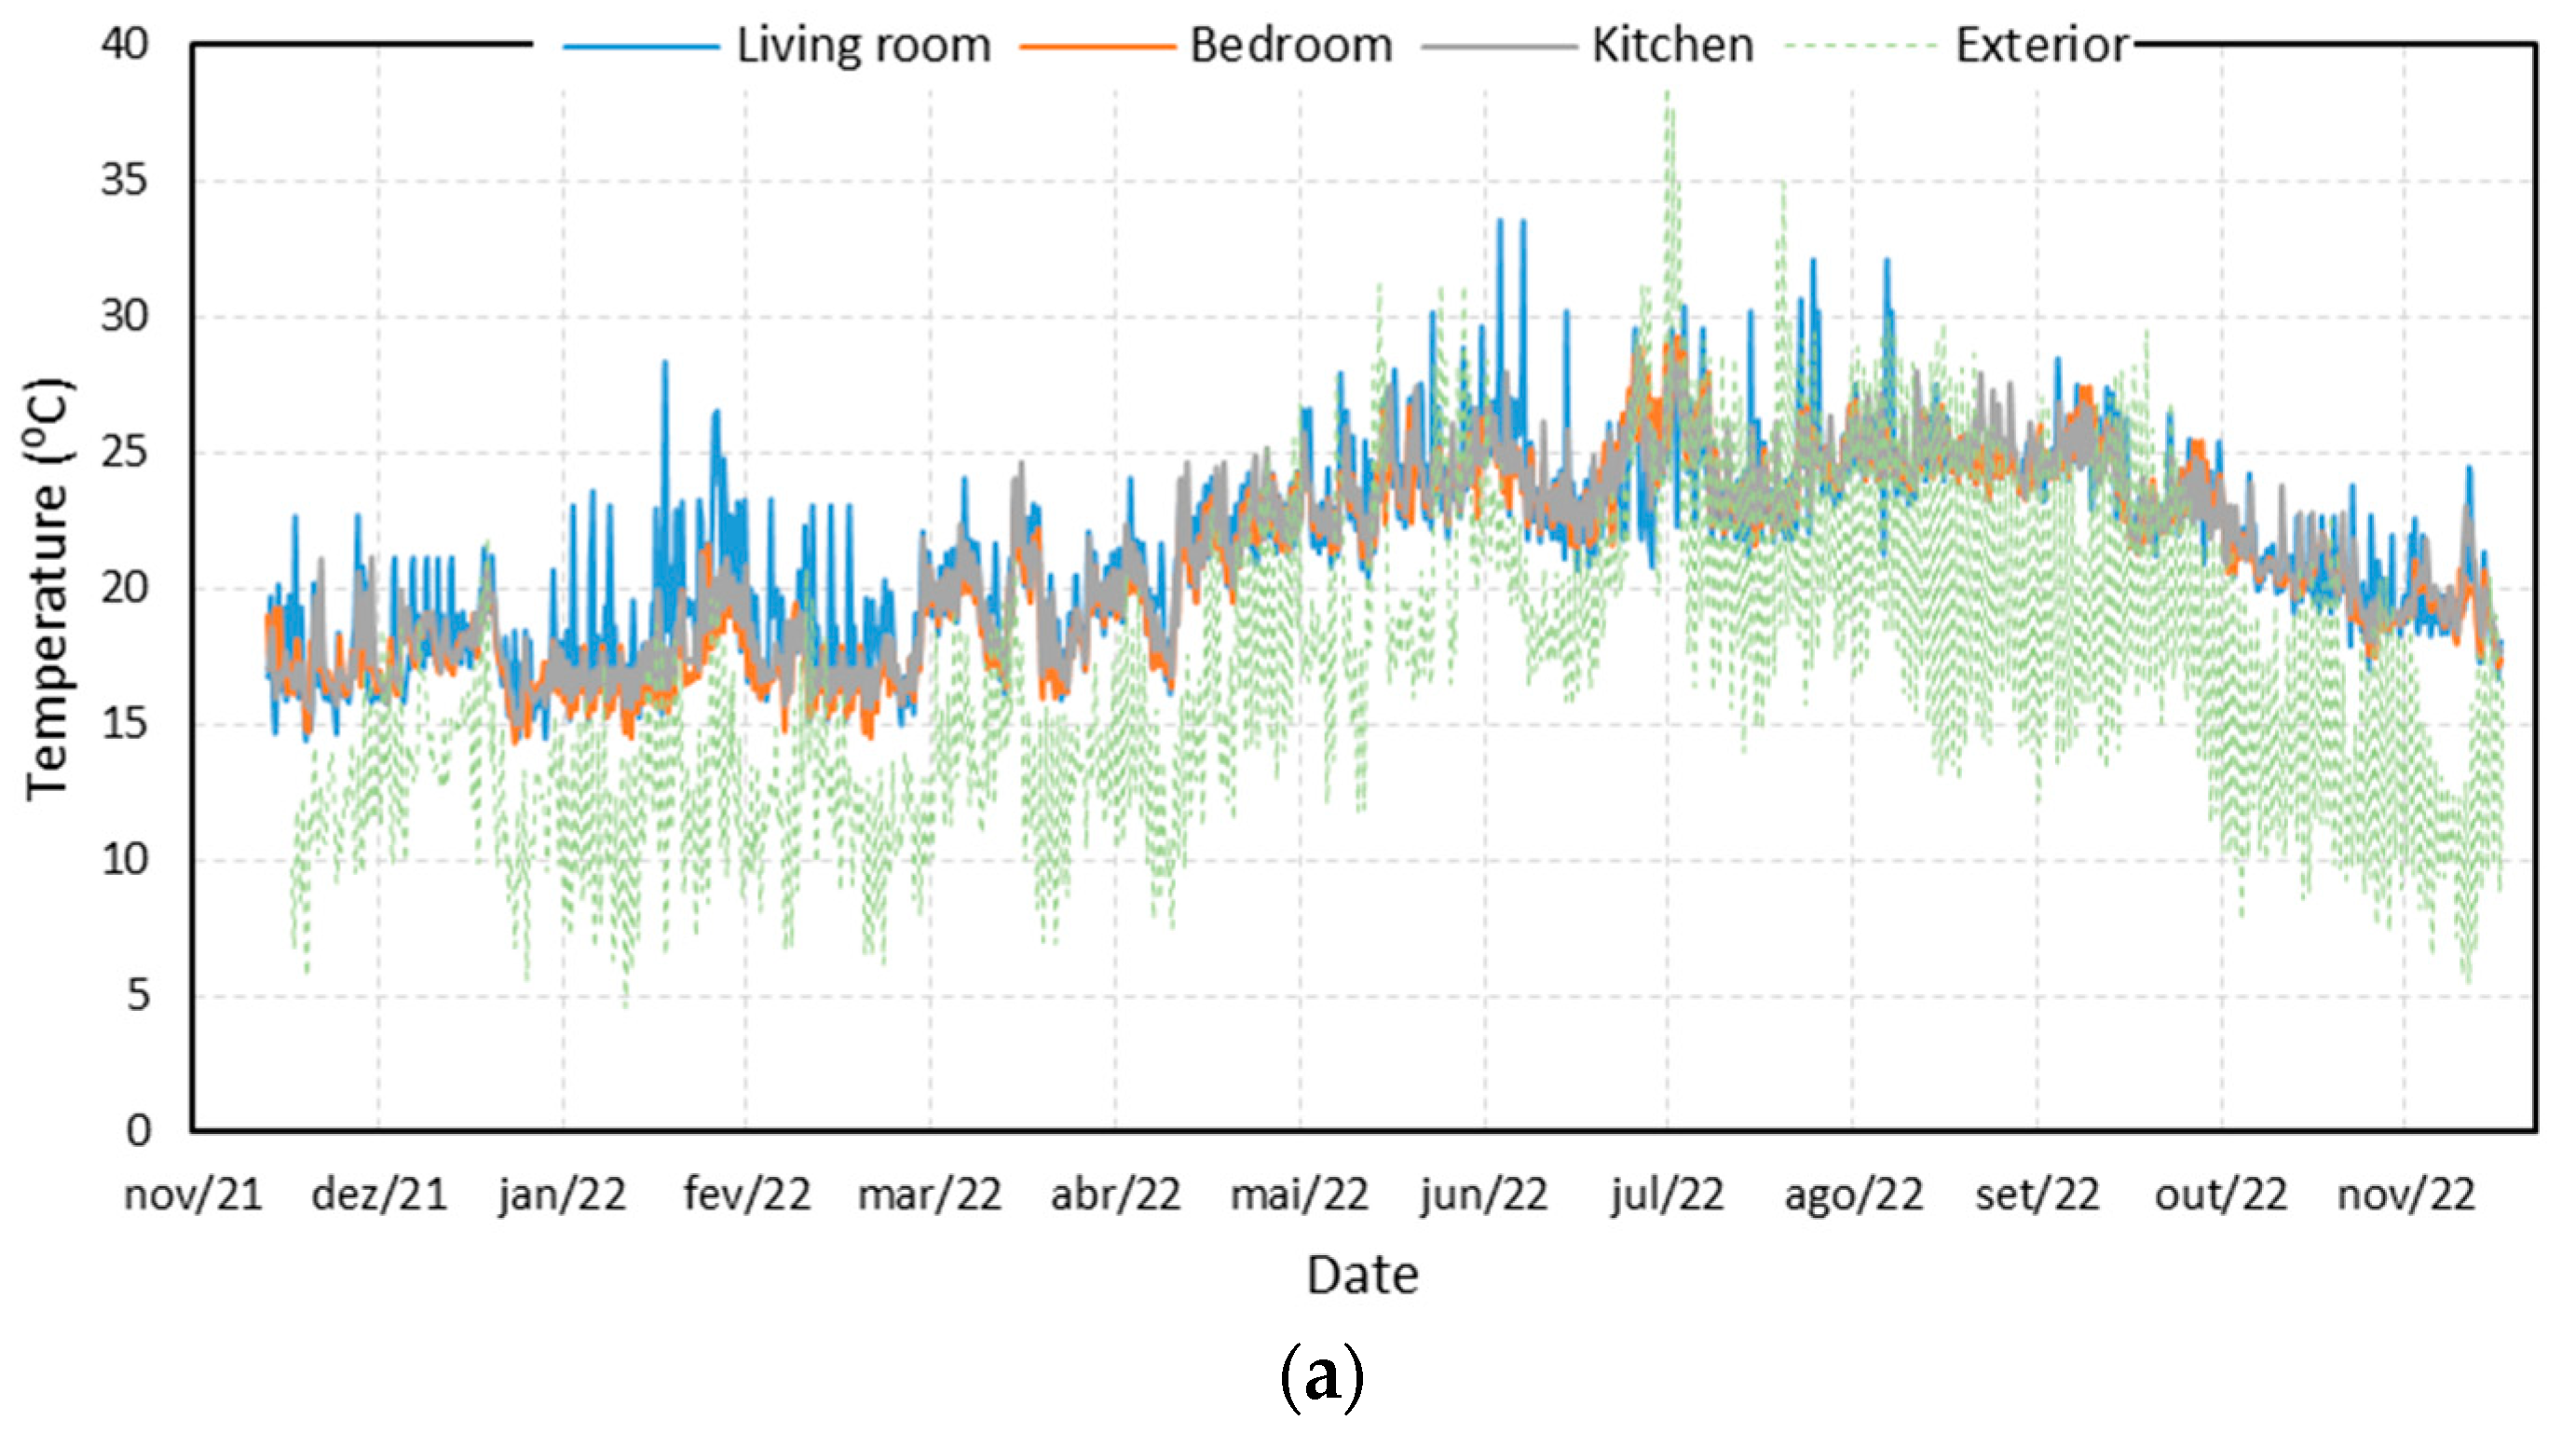
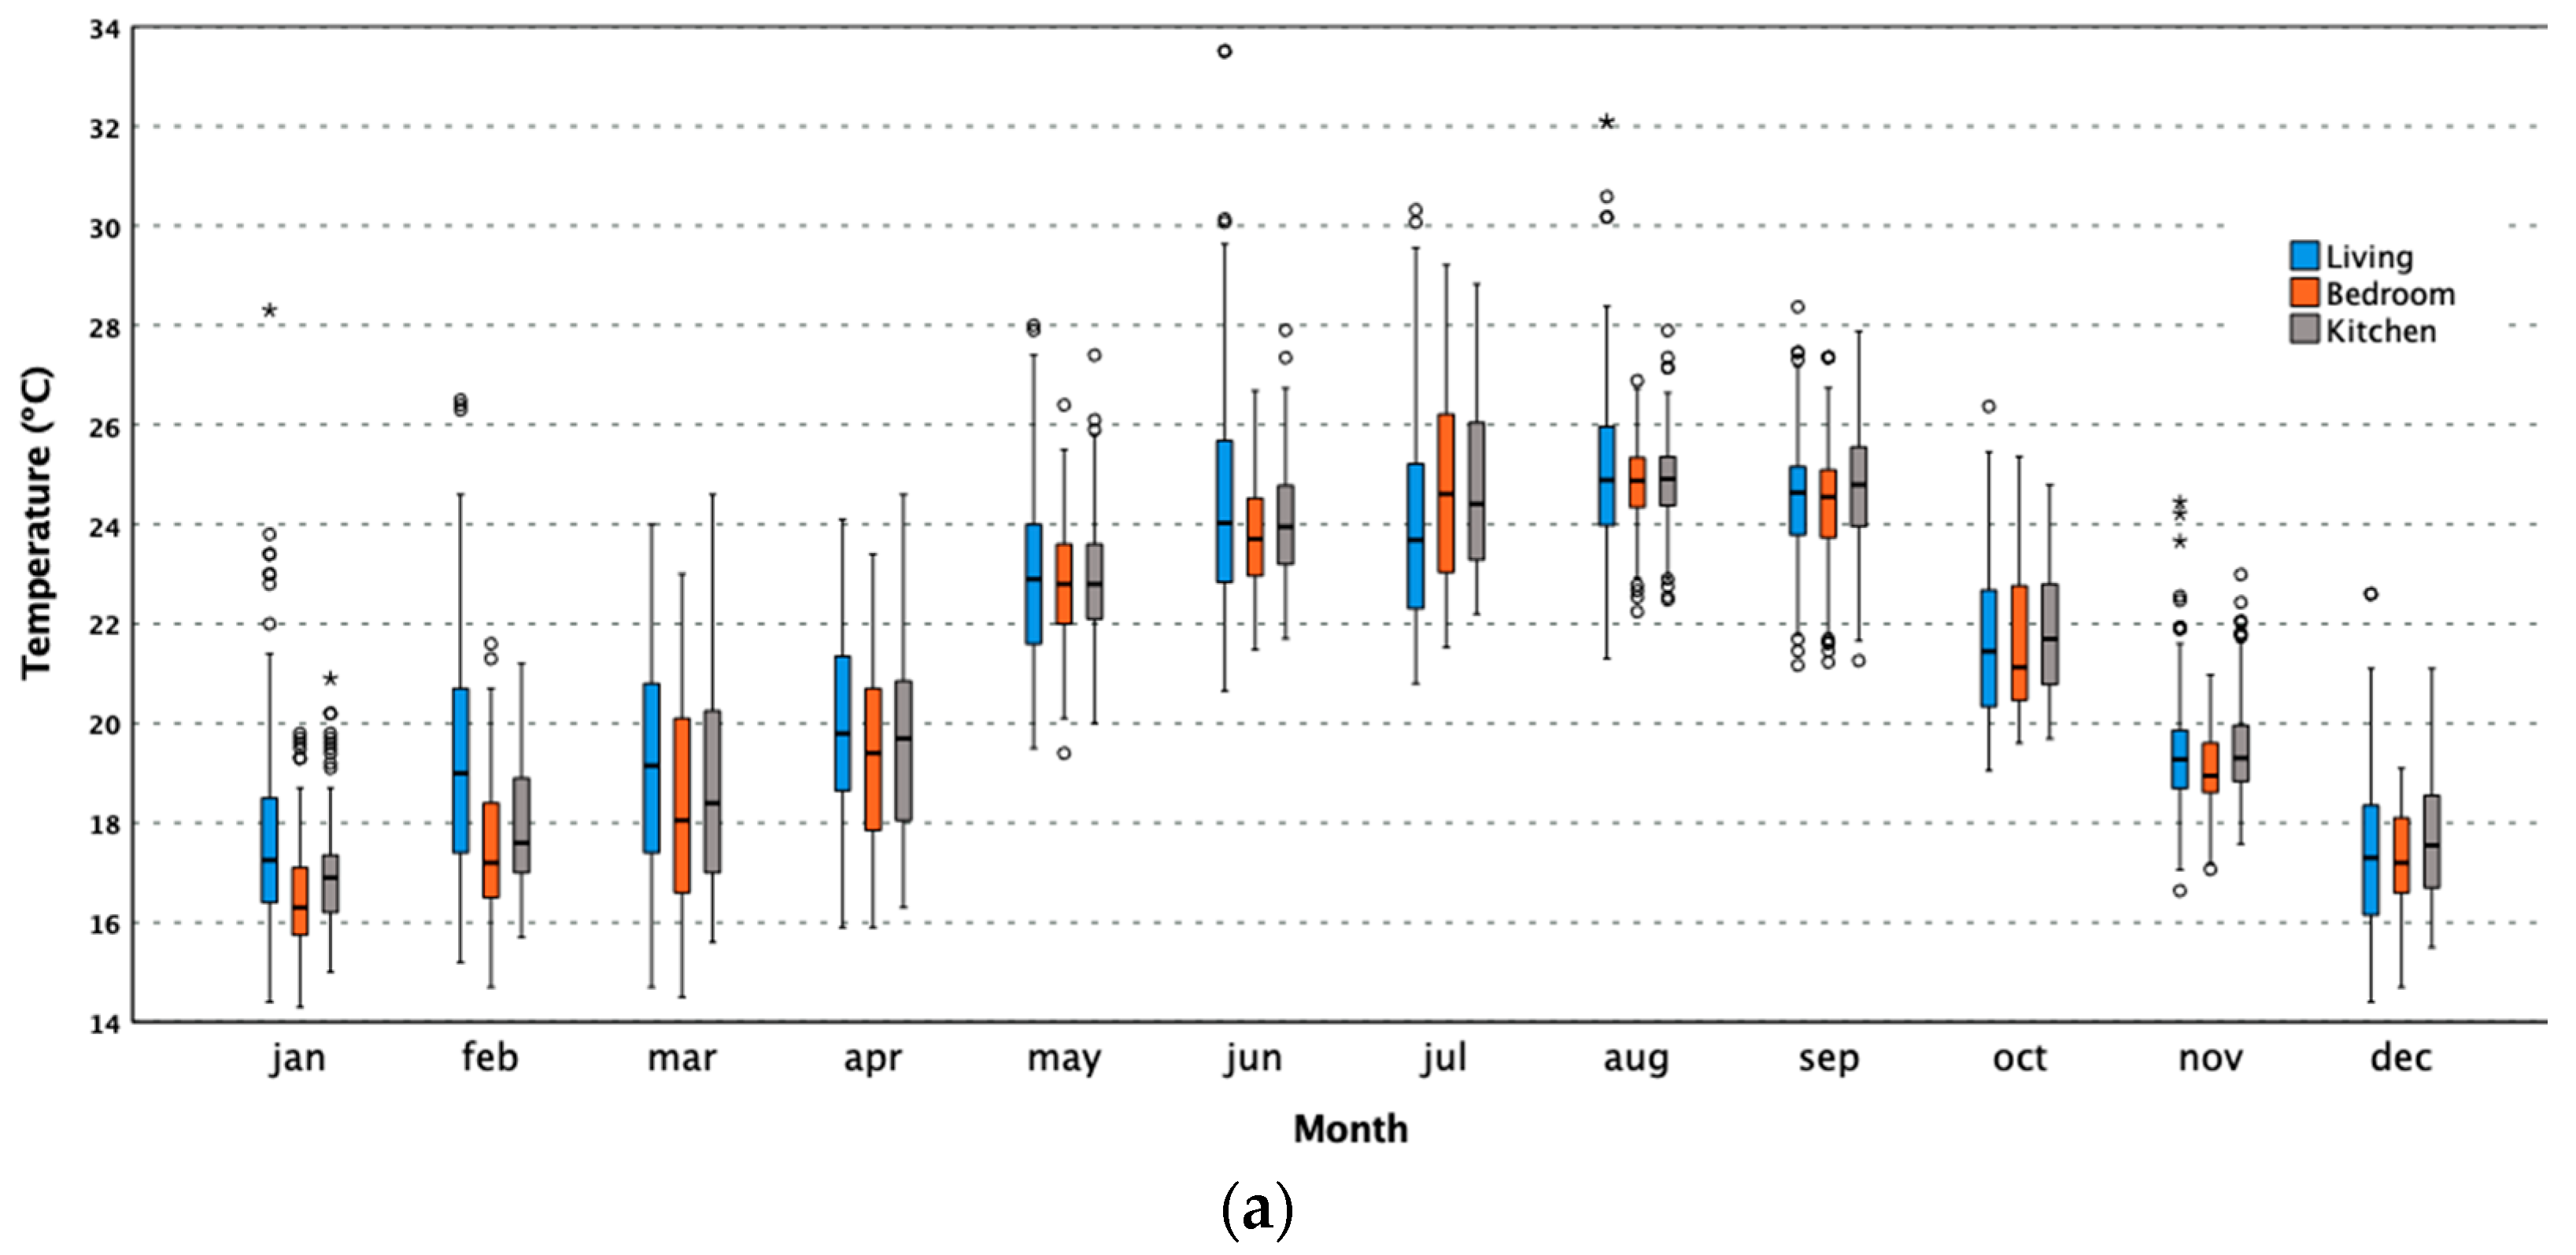
3.1. Temperature and Relative Humidity
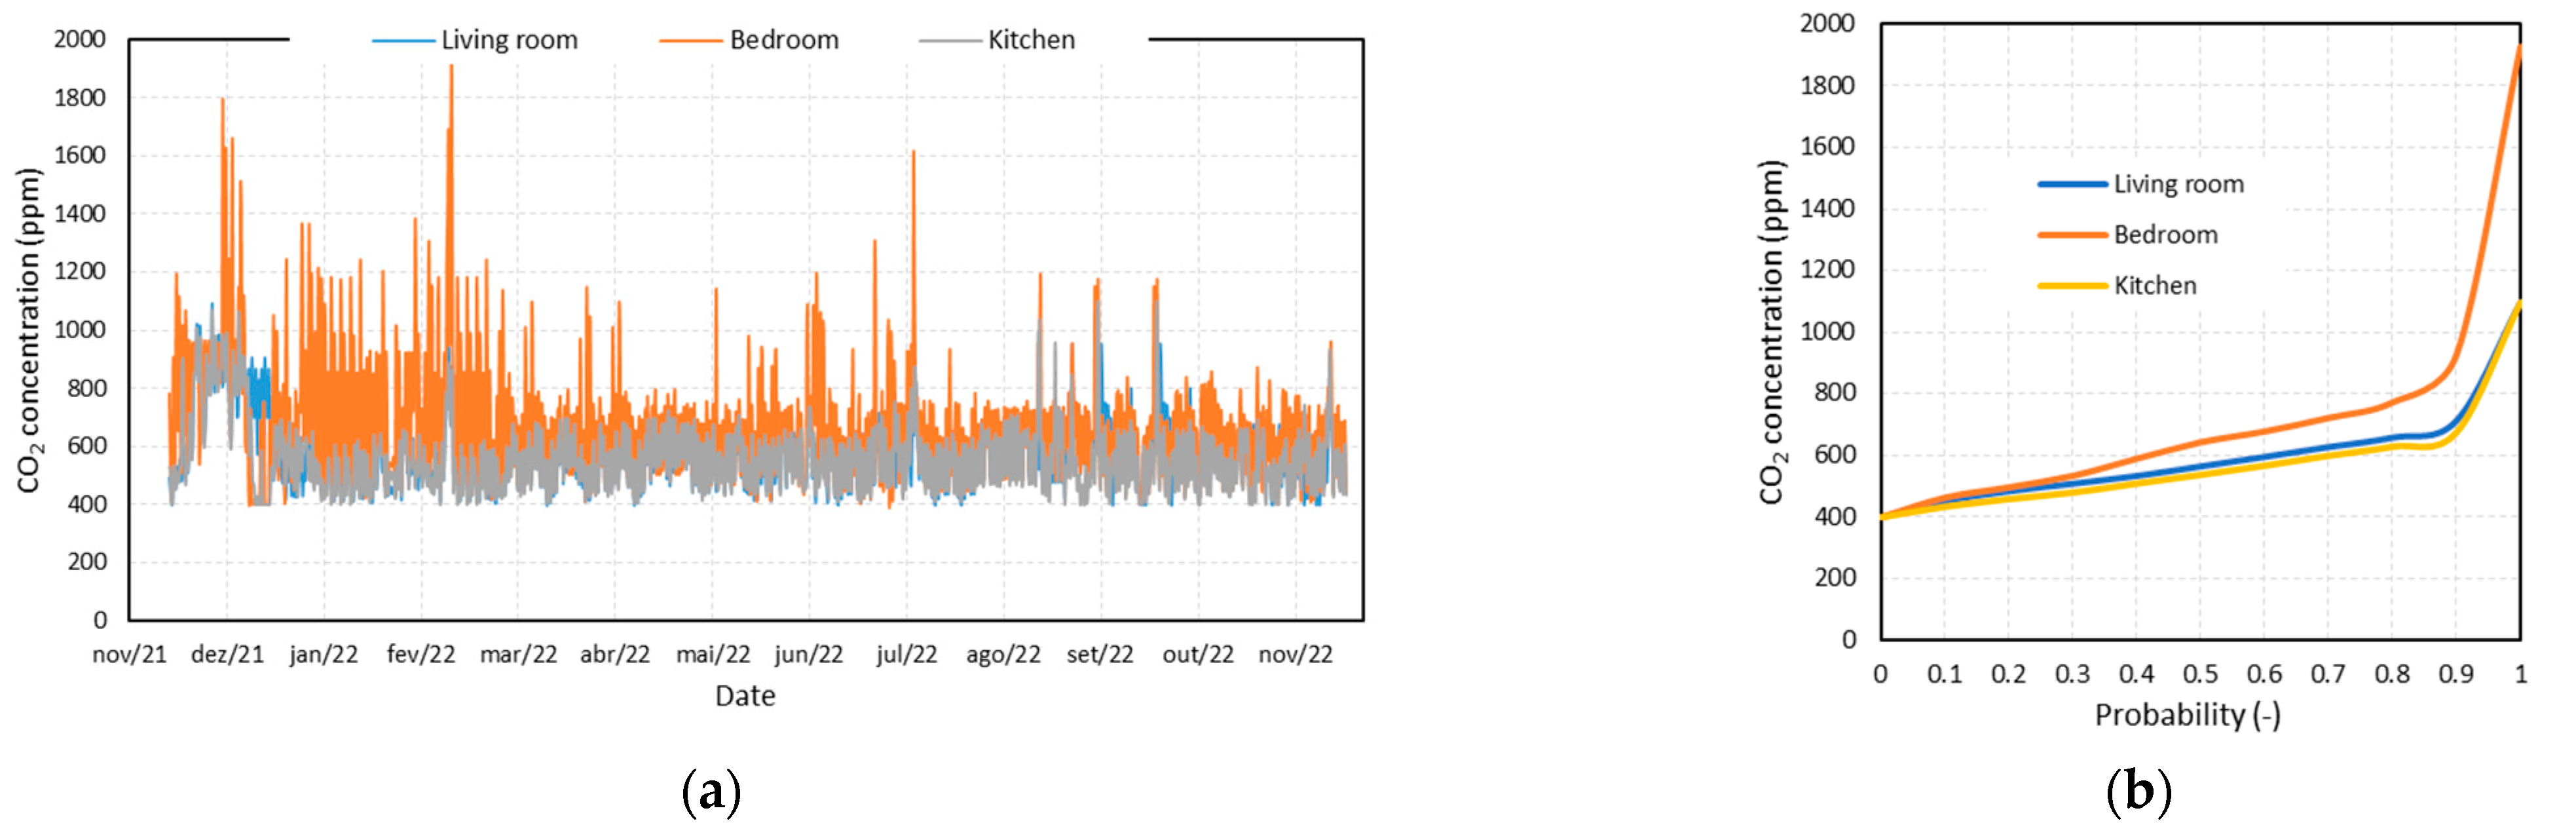
3.2. CO2 Concentration
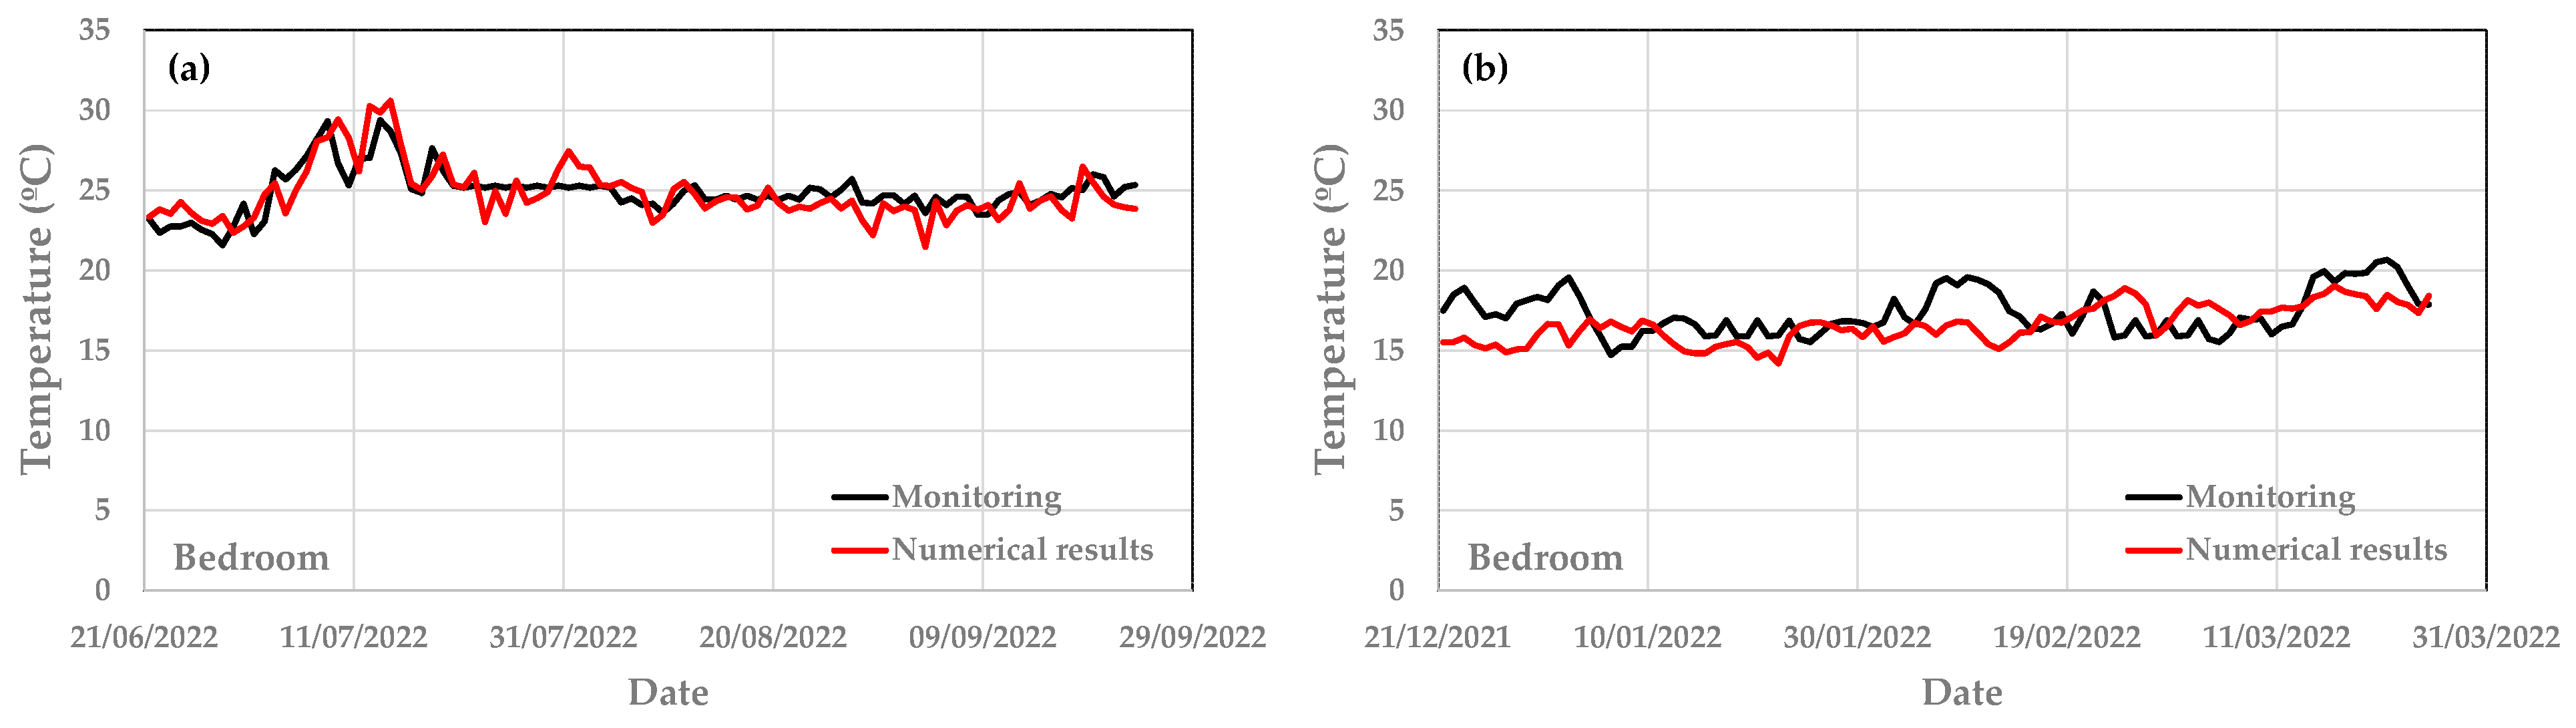
3.3. Numerical Results and Real Data Collected
3.4. Thermal Comfort
4. Conclusions
- The thermal conductivity of EPS, rock wool, OSB, the floating floor, and plaster wood were determined, and the results showed that the thermal conductivity of EPS and rock wool were the lowest, with values close to 0.03 W/(m2K). For wood-based panels (OSB and floating floor in HDF), the results were slightly lower than the reference values indicated in the international standards, for a similar density;
- Additionally, OSB, flooring HDF, Thermowood®, and wood CL4 samples were tested to determine density, moisture content, internal bond strength, bending strength, and thickness swelling over 24 h. The obtained values comply with the specifications for OSB or HDF surfaced with melamine. Additionally, both materials have low formaldehyde content and emission, and can be classified as E1;
- There is a clear alignment between outdoor and indoor temperature conditions throughout the monitoring period;
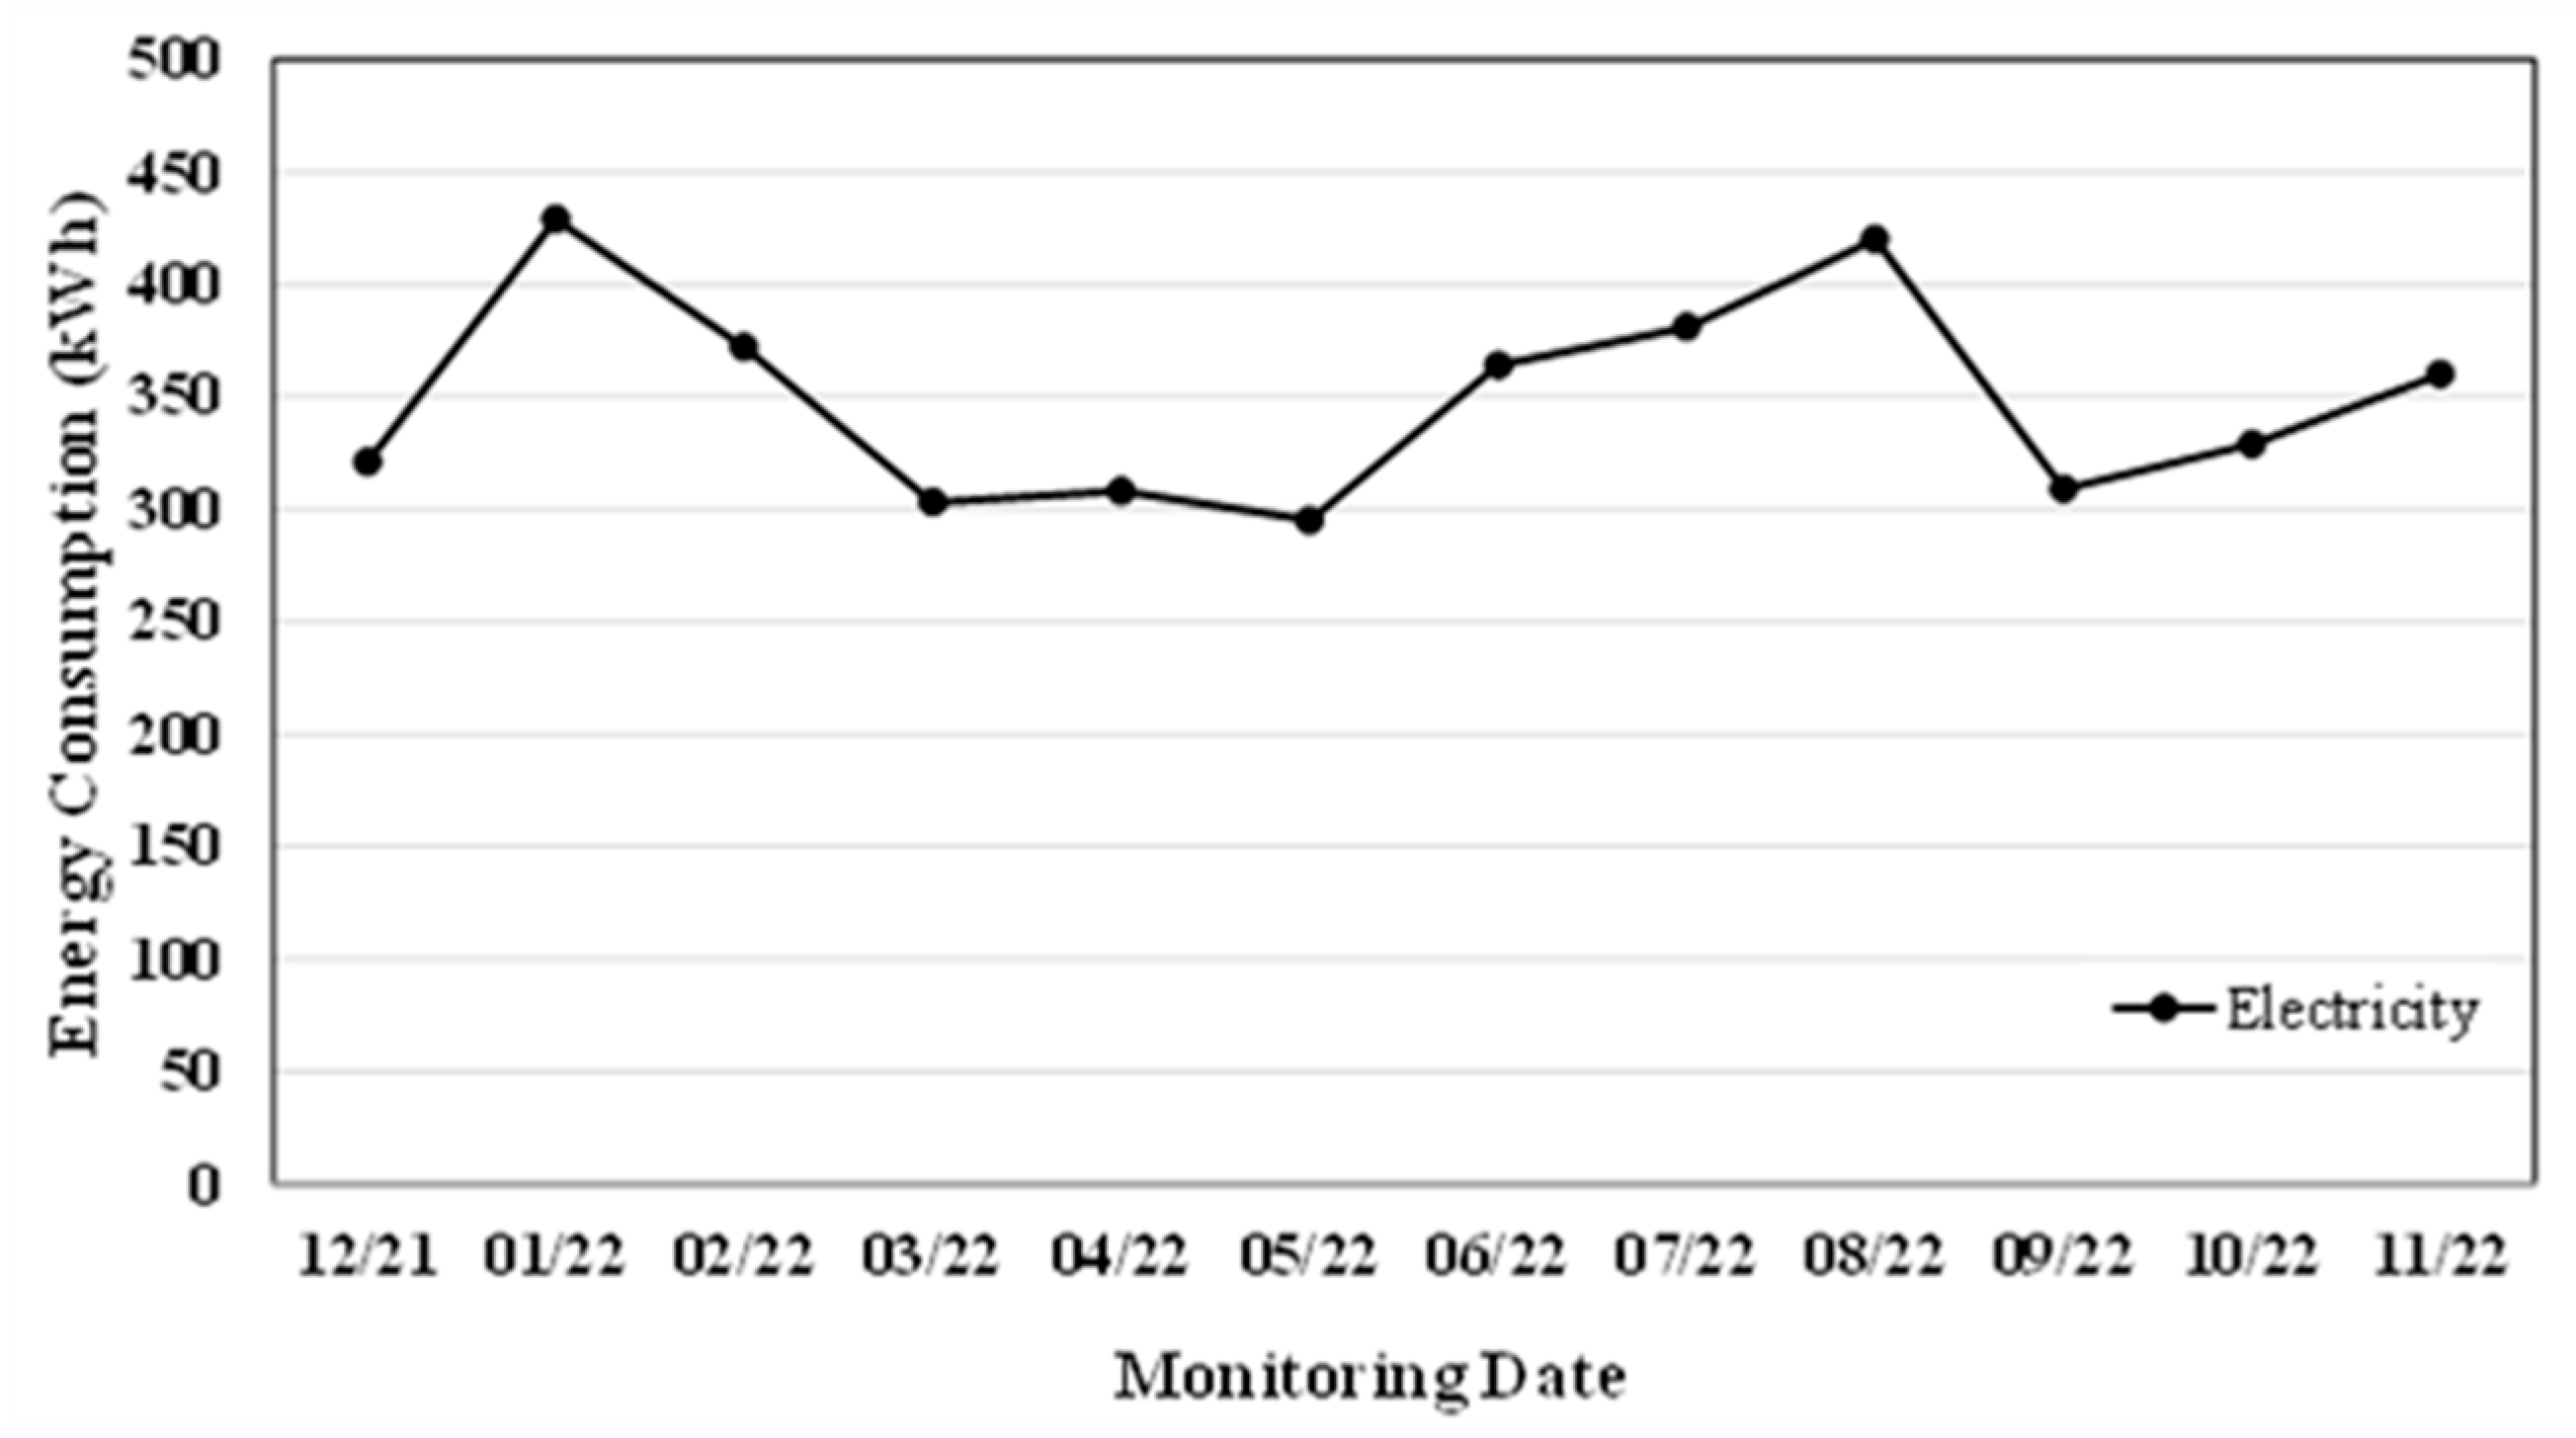
- The use of the heating system occurred intermittently and punctually, in specific compartments, probably as an immediate response to situations of thermal discomfort;
- The results of CO2 concentration monitoring indicate adequate air renewal rates, except for some periods in the bedroom, during the night;
- The application of the adaptive comfort model proposed in the EN 16798-2 standard resulted in a percentage of time in discomfort due to overcooling ranging between 31.3% and 38.6%. However, most of these periods may correspond to times when there is no occupancy of these spaces. Overheating is not a problem in this house, as only in the living room was the registered temperature higher than the upper comfort limit, and only for a very limited period of time (approximately 1%).
Author Contributions
Funding
Institutional Review Board Statement
Informed Consent Statement
Data Availability Statement
Acknowledgments
Conflicts of Interest
References
- Ferdous, W.; Bai, Y.; Ngo, T.D.; Manalo, A.; Mendis, P. New advancements challenges and opportunities of multi-storey modular buildings—A state-of-the-art review. Eng. Struct. 2019, 183, 883–893. [Google Scholar]
- Lacey, A.W.; Chen, W.; Hao, H.; Bi, K. Structural response of modular buildings—An overview. J. Build. Eng. 2018, 16, 45–56. [Google Scholar] [CrossRef] [Green Version]
- Kasperzyk, C.; Kim, M.-K.; Brilakis, I. Automated re-prefabrication system for buildings using robotics. Autom. Constr. 2017, 83, 184–195. [Google Scholar] [CrossRef] [Green Version]
- Boyd, N.; Khalfan, M.M.A.; Maqsood, T. Off-site construction of apartment buildings. J. Archit. Eng. 2013, 19, 51–57. [Google Scholar] [CrossRef]
- Fathieh, A.; Mercan, O. Seismic evaluation of modular steel buildings. Eng. Struct. 2016, 122, 83–92. [Google Scholar] [CrossRef]
- Fifield, L.J.; Lomas, K.J.; Giridharan, R.; Allinson, D. Hospital wards and modular construction: Summertime overheating and energy efficiency. Build. Environ. 2018, 141, 28–44. [Google Scholar] [CrossRef]
- Steinhardt, D.A.; Manley, K. Adoption of prefabricated housing—The role of country context. Sustain. Cities Soc. 2016, 22, 126–135. [Google Scholar] [CrossRef] [Green Version]
- Srisangeerthanan, S.; Hashemi, M.J.; Rajeev, P.; Gad, E.; Fernando, S. Numerical study on the effects of diaphragm stiffness and strength on the seismic response of multi-story modular buildings. Eng. Struct. 2018, 163, 25–37. [Google Scholar] [CrossRef]
- Pons, O. Assessing the sustainability of prefabricated buildings. In Eco-Efficient Construction and Building Materials; Woodhead Publishing: Cambridge, UK, 2014; pp. 434–456. [Google Scholar]
- Li, Y.; Zhang, X. Web-based construction waste estimation system for building construction projects. Autom. Constr. 2013, 35, 142–156. [Google Scholar] [CrossRef]
- Lee, W.H.; Kim, K.W.; Lim, S.H. Improvement of floor impact sound on modular housing for sustainable building. Renew. Sustain. Energy Rev. 2014, 29, 263–275. [Google Scholar] [CrossRef]
- Tam, V.W.Y.; Gao, X.F.; Tam, C.M.; Chan, C.H. New approach in measuring water absorption of recycled aggregates. Constr. Build. Mater. 2008, 22, 364–369. [Google Scholar] [CrossRef] [Green Version]
- Ni, S.; Zhu, N.; Zhang, Z.; Hou, Y.; Li, S. The operational performance of net zero energy wooden structure building in the severe cold zone: A case study in Hailar of China. Energy Build. 2022, 257, 111788. [Google Scholar] [CrossRef]
- Yue, K.; Liang, B.; Liu, J.; Li, M.; Pu, Y.; Lu, W.; Han, Z.; Li, Z. Fire resistance of light wood frame walls sheathed with innovative gypsum-particle composite: Experimental investigations. J. Build. Eng. 2022, 45, 103576. [Google Scholar] [CrossRef]
- EN 13986+A1; Wood-Based Panels for Use in Construction—Characteristics, Evaluation of Conformity and Marking. CEN—European Committee for Standardization: Brussels, Belgium, 2015.
- Karacabeyli, E.; Douglas, B. CLT Handbook, U.S. ed.; FPInnovations: Pointe-Claire, QC, Canada, 2013. [Google Scholar]
- Espinoza, O.; Trujillo, V.; Mallo, M.; Buehlman, U. Cross-laminated timber: Status and research needs in Europe. BioResources 2016, 11, 281–295. [Google Scholar] [CrossRef]
- EN 300; Oriented Strand Boards (OSB)—Definitions, Classification and Specifications. CEN—European Committee for Standardization: Brussels, Belgium, 2000.
- Sandberg, D.; Kutnar, A.; Mantanis, G. Wood modification technologies—A review. iForest Biogeosci. For. 2017, 10, 895–908. [Google Scholar] [CrossRef] [Green Version]
- Aza-Medina, L.C.; Palumbo, M.; Lacasta, A.M.; González-Lezcano, R.A. Characterization of the thermal behavior, mechanical resistance, and reaction to fire of totora (Schoenoplectus californicus (C.A. Mey.) Sojak) panels and their potential use as a sustainable construction material. J. Build. Eng. 2023, 69, 105984. [Google Scholar] [CrossRef]
- Mamani, T.; Herrera, R.F.; Rivera, F.M.L.; Atencio, E. Variables That Affect Thermal Comfort and Its Measuring Instruments: A Systematic Review. Sustainability 2022, 14, 1773. [Google Scholar] [CrossRef]
- EN 12667; Thermal Performance of Building Material and Products—Determination of Thermal Resistance by Means of Guarded Hot Plate and Heat Flow Meter Methods—Products of High and Medium Thermal Resistance. iTeh Standards: Etobicoke, ON, Canada, 2001.
- EN 323; Wood-Based Panels—Determination of Density. CEN—European Committee for Standardization: Brussels, Belgium, 1993.
- EN 322; Wood-Based Panels—Determination of Moisture Content. CEN—European Committee for Standardization: Brussels, Belgium, 1993.
- EN 319; Particleboards and Fibreboards—Determination of Tensile Strength Perpendicular to the Plane of the Board. iTeh Standards: Etobicoke, ON, Canada, 1993.
- EN 310; Wood-Based Panels—Determination of Modulus of Elasticity in Bending and of Bending Strength. CEN—European Committee for Standardization: Brussels, Belgium, 1993.
- EN 317; Particleboards and Fibreboards—Determination of Swelling in Thickness after Immersion in Water. CEN—European Committee for Standardization: Brussels, Belgium, 1993.
- EN ISO 12460-5; Wood Based Panels—Determination of Formaldehyde Content—Part 5: Extraction Method Called the Perforator Method. CEN—European Committee for Standardization: Brussels, Belgium, 2015.
- EN ISO 12460-3:2020; Wood Based Panels—Determination of Formaldehyde Release—Part 3: Gas Analysis Method. ISO: Geneva, Switzerland, 2020.
- NP 616; Timbers: Determination of density, Instituto Português da Qualidade. LNEC: Lisboa, Portugal, 1973.
- NP 615; Timbers: Determination of shrinkage, Instituto Português da Qualidade. LNEC: Lisboa, Portugal, 1975.
- Carvalho, A. Madeiras Portuguesas—Estrutura Anatómica, Propriedades, Utilizações; Direcção Geral de Florestas: Lisboa, Portugal, 1996; Volume II, 415p. [Google Scholar]
- EN 622-5; Fibreboards—Specifications—Part 5: Requirements for Dry Process Boards (MDF). CEN—European Committee for Standardization: Brussels, Belgium, 2009.
- EN 16798-2; Energy Performance of Buildings—Ventilation for Buildings—Part 2: Interpretation of the Requirements in EN 16798-1—Indoor Environmental input Parameters for Design and Assessment of Energy Performance of Buildings Addressing Indoor Air Quality, Thermal Environment, Lighting and Acoustics. CEN—European Committee for Standardization: Brussels, Belgium, 2019.
- Roque, E.; Vicente, R.; Almeida, R.M.S.F. Opportunities of Light Steel Framing towards thermal comfort in southern European climates: Long-term monitoring and comparison with the heavyweight construction. Build. Environ. 2021, 200, 107937. [Google Scholar] [CrossRef]
- Roque, E.; Vicente, R.; Almeida, R.M.S.F. Indoor Thermal Environment Challenges of Light Steel Framing in the Southern European Context. Energies 2021, 14, 7025. [Google Scholar] [CrossRef]


| Dimension of Specimens (mm3) | Thermal Conductivity (W/(m2 K) | Average Thermal Conductivity (W/m2 K) | |
|---|---|---|---|
| EPS | 300 × 300 × 40 | 0.0352 | 0.0367 ± 0.0015 |
| 0.0367 | |||
| 0.0382 | |||
| EPS | 300 × 300 × 30 | 0.0364 0.0378 0.0392 | 0.0378 ± 0.0014 |
| Rock wool | 300 × 300 × 50 | 0.0336 0.0348 0.0363 | 0.0349 ± 0.0014 |
| OSB | 300 × 300 × 22 | 0.0984 0.1006 0.1030 | 0.1007 ± 0.0023 |
| OSB | 300 × 300 × 12 | 0.1033 0.1057 0.1082 | 0.1057 ± 0.0025 |
| Floating floor (HDF) | 300 × 300 × 7 | 0.1301 0.1334 0.1365 | 0.1333 ± 0.0032 |
| Plaster wood | 300 × 250 × 12.5 | 0.1528 0.1535 0.1544 | 0.1536 ± 0.0008 |
| Hourly Time | Presence Rate | Heating Setpoint (°C) | Heating Setback (°C) | Cooling Setpoint (°C) | Cooling Setback (°C) | |
|---|---|---|---|---|---|---|
| Weekdays | 19:00–7:00 | 1.0 | 18 | 14 | 26 | 30 |
| 8:00–18:00 | 0.6 | |||||
| 9:00–17:00 | 0.4 | |||||
| 10:00–16:00 | 0.0 | |||||
| Weekends | 19:00–7:00 | 1.0 | 18 | 14 | 26 | 30 |
| 8:00–9:00 | 0.9 | |||||
| 10:00–15:00 | 0.5 | |||||
| 16:00–18:00 | 0.6 |
| %OCh | ADI_w (°C) | %OHh | ADI_s (°C) | |
|---|---|---|---|---|
| Living room | 31.3 | 1.53 | 1.1 | 1.74 |
| Bedroom | 38.6 | 1.66 | 0.0 | 0.00 |
| Kitchen | 34.4 | 1.46 | 0.0 | 0.00 |
Disclaimer/Publisher’s Note: The statements, opinions and data contained in all publications are solely those of the individual author(s) and contributor(s) and not of MDPI and/or the editor(s). MDPI and/or the editor(s) disclaim responsibility for any injury to people or property resulting from any ideas, methods, instructions or products referred to in the content. |
© 2023 by the authors. Licensee MDPI, Basel, Switzerland. This article is an open access article distributed under the terms and conditions of the Creative Commons Attribution (CC BY) license (https://creativecommons.org/licenses/by/4.0/).
Share and Cite
Delgado, J.M.P.Q.; Almeida, R.M.S.F.; Matos, A.M.; Barreira, E.; Carvalho, L.; Martins, J.; Ferreira, N.; Guimarães, A.S. Multi-Performance Characterization of a Modular Wooden House. Energies 2023, 16, 5795. https://doi.org/10.3390/en16155795
Delgado JMPQ, Almeida RMSF, Matos AM, Barreira E, Carvalho L, Martins J, Ferreira N, Guimarães AS. Multi-Performance Characterization of a Modular Wooden House. Energies. 2023; 16(15):5795. https://doi.org/10.3390/en16155795
Chicago/Turabian StyleDelgado, João M. P. Q., Ricardo M. S. F. Almeida, Ana M. Matos, Eva Barreira, Luísa Carvalho, Jorge Martins, Nuno Ferreira, and Ana S. Guimarães. 2023. "Multi-Performance Characterization of a Modular Wooden House" Energies 16, no. 15: 5795. https://doi.org/10.3390/en16155795