Article

Pack-Level Modeling and Thermal Analysis of a Battery Thermal Management System with Phase Change Materials and Liquid Cooling

1
School of Mechanical Engineering, Beijing Institute of Technology, Beijing 100081, China
2
China Automotive Engineering Research Institute Co., Ltd., Chongqing 401122, China
3
Faculty of Engineering, University of Nottingham, Nottingham NG7 2RD, UK
*
Author to whom correspondence should be addressed.
Energies 2023, 16(15), 5815; https://doi.org/10.3390/en16155815
Submission received: 14 June 2023 / Revised: 24 July 2023 / Accepted: 2 August 2023 / Published: 4 August 2023
(This article belongs to the Section J: Thermal Management)

Abstract

:
Electric vehicles are seen as the prevailing choice for eco-friendly transportation. In electric vehicles, the thermal management system of battery cells is of great significance, especially under high operating temperatures and continuous discharge conditions. To address this issue, a pack-level battery thermal management system with phase change materials and liquid cooling was discussed in this paper. A dynamic electro-thermal coupled model for cells, the enthalpy–porosity model for phase change materials, and the k-ε model for the coolant flow were used. Various parameters, such as ambient temperatures, discharge rates, components of phase change materials, inlet mass flow rates, and temperatures of the coolant were considered. The results indicated that a battery thermal management system with both phase change materials and liquid cooling is more effective than the one with only liquid cooling. The phase change material with a mass fraction of 10% expanded graphite in paraffin wax had a favorable performance for the battery thermal management system. Additionally, increasing the mass flow rate or decreasing the flow temperature of the coolant can reduce the maximum temperature of the battery pack. However, the former can limit the maximum temperature difference, while the latter will deteriorate the temperature uniformity. The present work may shed light on the design of battery thermal management systems in the electric vehicle industry.

1. Introduction

In the field of transportation, the widespread implementation of electric vehicles (EVs) has become crucial in efforts to address global issues. These issues include air pollution, climate change, and the diminishing reserve of fossil fuels [1]. Generally, EVs are powered by lithium-ion batteries (LIBs). However, LIB performance is highly dependent on temperature, with a desirable working temperature range from 15 °C to 35 °C [2]. During winter, low ambient temperatures can strongly reduce the actual capacity of LIBs, while high ambient temperatures during summer months can increase thermal runaway risk [3]. As a result, the development of effective battery thermal management (BTM) technology is crucial for ensuring the stability and reliability of LIBs during seasonal changes [4,5].
Various BTM systems have been proposed to prevent thermal runaway at high temperatures, including air cooling, liquid cooling (LC), heat pipe cooling, and phase change cooling [6]. Forced-air cooling is a prevalent cooling technique employed in numerous applications, including the cooling of battery packs in affordable vehicles. This method involves utilizing a cooling fan to circulate ambient air through the battery to achieve an ideal cooling effect [7]. Although forced-air cooling is a cost-effective approach, it has limitations such as restricted cooling efficiency, high noise level, and a negative impact on the vehicle’s aerodynamic performance. Consequently, LC has emerged as a more viable alternative to forced-air cooling due to its superior cooling capacity and reduced operational noise. This has led to its widespread adoption in modern vehicle designs [8]. Zhao et al. [9] developed a novel method for cooling cylindrical cells using narrow channel cooling cylinders. The results indicated that batteries’ maximum temperature can be limited to 40 °C. Sheng et al. [10] proposed LC equipment with two inlets and two outlets for EVs. The device could effectively optimize the temperature uniformity of an LIB cell. Compared to LC systems, heat pipe cooling technology offers better thermal management performance, higher energy efficiency, and smaller size [11,12]. However, the reliability and cost of heat pipe cooling technology still need further exploration and investigation.
Phase change cooling can effectively reduce battery temperature by utilizing the latent heat of the phase change materials (PCMs) [13,14]. It has been recognized as a prospective solution due to its stronger capacity compared to air cooling, uncomplicated structure compared to LC, and more flexible shape compared to heat pipe cooling [15]. However, despite the potential benefits of PCMs, their cooling effectiveness may deteriorate during repeated charge and discharge cycles. This deterioration occurs due to two primary factors. Firstly, the low thermal conductivity of PCMs, such as pure paraffin wax (PW), does not meet the demands of rapid operating condition changes found in EVs. To alleviate this challenge, researchers have proposed the utilization of materials with higher thermal conductivities, such as expanded graphite (EG) [16], metal foams [17], and carbon fibers [18], to enhance the heat exchange of PCMs. Secondly, the inadequate heat transfer coefficient of PCMs can result in heat accumulation during successive cycles, leading to a sharp decrease in the cooling efficiency of the cell and elevating the likelihood of thermal runaway.
To neutralize the limitations of PCMs, a hybrid approach, using both phase change heat transfer and forced-convection-air or -liquid cooling can be adopted in BTM system. Ling et al. [19] utilized phase change cooling in conjunction with air cooling and found that the battery’s temperature can be limited to 46 °C at the 2C discharge rate due to the phase change process. Lebrouhi et al. [20] developed a 0D numerical model to simulate the BTM system using PCM and LC. However, this method cannot obtain the internal temperature distribution of the coolant and the PCM. For the computational fluid dynamics (CFD) method, Song et al. [21] designed a BTM system that combines PCM and LC with a constant battery heat source. A comparison between the hybrid system and the single PCM or LC system was performed in detail. Akbarzadeh et al. [22] designed a novel liquid cooling plate (LCP) with the PCM inside for the BTM system, adopting a simplified heat source and the k-ε turbulence model for the coolant flow. The result showed that the intervention of the PCM can significantly reduce the battery’s thermal loss in low-temperature environments. Liu et al. [23] proposed a BTM system using a silica gel composite PCM and LC. Three connection modes of the LC pipeline were numerically investigated, and the k-ε model was used. The simulation results indicated that the 3-inlet/3-outlet LC mode had the best thermal management effect for the battery.
The BTM system combining PCM and LC has been frequently discussed at the modular level, ignoring the impact of the adjacent modules’ interaction on the system. In this paper, a BTM system utilizing composite PCM and LC for a battery pack was proposed. A dynamic electro-thermal coupled model for the battery cell, an enthalpy–porosity model for the PCMs, and the k-ε model for the coolant flow were used. On this basis, the impacts of ambient temperature, discharge rate, PCM components, inlet mass flow rate, and coolant temperature were numerically studied.

2. Models and Methodologies

2.1. Physical Model Description

The schematic of a novel BTM system is depicted in Figure 1. This system includes a battery pack, PCM, LCP, and thermal pad. The whole system is packed in an aluminum module shell. Specifically, the battery pack comprises nine battery modules, with each battery pack consisting of 12 prismatic battery cells. The cells are surrounded by the PCM, which is composed of PW and EG mixed in proper proportions. The physical properties of various EG mass fractions are described in Table 1. The bottom of the battery and the PCM is an aluminum LCP that has an inlet and an outlet on one side and a hollow interior for coolant flow. The performance differences of LCPs with various structures have been discussed in our previous work, and this paper directly adopts the optimized cooling plate structure for use in research [24]. Compared with the conventional cooling plate structure, this design has better cooling efficiency. A 2 mm-thick silicone thermal pad is settled in the middle of the battery and cooling plate to eliminate the air gap and reduce thermal contact resistance. The specific physical parameters of the BTM system are shown in Table 2.
To reduce physical model complexity in simulation and ensure computational efficiency, reasonable assumptions are made. These assumptions are as follows:
(1)
The heat generation part of the battery cell is retained, with the shell and positive/negative tabs being ignored. Additionally, the heat generation of each battery cell is uniform [25].
(2)
The thermal conductivity of the battery material is anisotropic, meaning that it varies in different directions. Additionally, the density, thermal conductivity, and specific heat of all materials are independent of temperature.
(3)
Based on the simplification of the battery model, it is considered that the filling height of the PCM is as high as the heat-generating part of the battery cell.
(4)
The liquid PCM is an incompressible Newtonian fluid and its natural convection is ignored because heat conduction plays an absolute role in the heat transfer process [26].
(5)
The radiation in the heat transfer process is negligible.
Table 1. Thermophysical properties of composite PCMs [27].
Mass Fraction
of EG
(%)
Density
(kg·m−3)
Specific Heat
(J·kg−1·k−1)
Thermal Conductivity
(W·m−1·k−1)
Latent Heat
(kJ·kg−1)
Melting
Temperature (°C)
090025600.322632–36
592824771.5421532–36
1095823942.9720332–36
1599023114.4819232–36
20102522286.2418132–36
Table 2. Physical parameters of the BTM system.
The ParameterValueUnits
Battery Cell [28]
Size148.3 × 26.7 × 98mm
The distance between the adjacent battery cell4mm
Density2519Kg·m−3
Specific heat1022.8J·kg−1·k−1·
Thermal conductivity in the y-direction1.062W·m−1·k−1
Thermal conductivity in the x/z-direction22.4459W·m−1·k−1
Electrolyte materialLiPF6-
Cathode materialGraphite-
Nominal capacity50Ah
Nominal voltage3.65V
PCM
Density928kg·m−3
Specific heat2477J·kg−1·k−1·
Thermal conductivity1.54W·m−1·k−1
Latent heat215,000J·kg−1
Phase change temperature32°C
Liquid Cooling Equipment
Size of LCP1426 × 366 × 10mm
Density of aluminum2700kg·m−3
Specific heat of aluminum903J·kg−1·k−1
Thermal conductivity of aluminum238W·m−1·k−1
Density of water998.2kg·m−3
Specific heat of water4182J·kg−1·k−1·
Thermal conductivity of water0.6W·m−1·k−1
Kinematic viscosity of water0.001kg·m−1·s−1
Thermal Pad
Size1374 × 366 × 2mm
Density1130kg·m−3
Specific heat1320J·kg−1·k−1·
Thermal conductivity2W·m−1·k−1

2.2. Numerical Methods

2.2.1. Battery Thermal Model

In the simulation, the temperature distribution of the battery cell was obtained by solving the energy equation as follows [29]:
ρ b c b T t = k b T + q b
where T is the cell temperature and t is time. ρb, cb, and kb are the density, specific heat, and thermal conductivity of the cell, respectively. qb is the heat generation rate in the unit volume of the cell, which can be expressed as follows [30,31]:
q b = 1 V b I b U U ocv + I b T d U ocv d T = I b 2 V b R ohm + R polar + I b T V b d U ocv d T = I b 2 V b R ( SOC , T , I b ) + I b T V b i = 1 n d i SOC i 1
where Vb is the cell volume, Ib is the cell current in discharging process, Uocv is the open-circuit voltage of the cell, and Rohm and Rpolar are the ohmic resistance and polarization resistance of the cell, respectively. d is a constant coefficient.
The qb is related to the state of charge (SOC), temperature, and discharging current of the cell. Thus, it is necessary to calibrate the heat production rate of the cell via testing. In this paper, a dynamic electro-thermal coupled model of heat generation for the cell was used [28]. Through experimental validation, this model was found to have an average relative error of 5.87%, which was reasonable for this simulation.

2.2.2. PCM Model

The total heat absorbed by the PCM can be calculated as the sum of the sensible and latent heat [32]:
Q = T i T m m c p , s d T + m Δ H + T m T f m c p , l d T = m c p , s T m T i + Δ H + c p , l T f T m
where m is the mass of PCM, ΔH is the latent heat capacity, and cp,s and cp,l separately denote the solid and liquid specific heat of PCM. Ti, Tm, and Tf stand for the initial, melting, and final temperatures, respectively. In this study, cp,s and cp,l are the same value and can be concluded as cp, i.e., the specific heat of PCM [33].
For the heat transfer process of the PCM, the enthalpy–porosity method [34] in ANSYS Fluent is adopted to perform the simulation in this paper. The energy equation of the enthalpy–porosity method can be expressed as follows:
ρ p H t + ρ p v p H = k p T
H = h + Δ H = h ref + T ref T c p d T + L p h l
where ρp and kp denote the density and thermal conductivity of PCM, respectively. vp is the velocity vector of the liquid PCM. H and h are total enthalpy and sensible enthalpy, respectively. href and Tref are enthalpy and temperature at reference conditions referring to the physical environment, respectively. Liquid fraction Lp is the fraction of the PCM in liquid form, and hl is the latent heat of PCM.
The partially solidified region of PCM is regarded as a porous medium according to the enthalpy–porosity method. The porosity in PCM is set equal to Lp. The decrease in porosity means the intensification of solidification, which also means a decrease in fluid velocity. Thus, a momentum sink is formed for the reduced porosity in the mushy zone:
S = 1 L p 2 L p 3 + ε A mush v p
where ε is a small constant of 10−3 to prevent division by zero. Amush is the mushy zone constant of 105 to control the velocity variation rate of the liquid PCM [35].

2.2.3. Liquid Cooling Model

In this paper, water was chosen as the cooling medium and considered to be an incompressible Newtonian fluid. At the middle section of the flow channel in the LCP, the calculated Reynolds number ranged from 3570 to 8925 when the inlet mass flow rate qm ranged from 0.1 kg·s−1 to 0.25 kg·s−1. In addition, the turbulence was increased because of the divergence and convergence of the channel, as shown in Figure 2. Thus, the Navier–Stokes equations with the k-ε model were adopted for simulation [36,37].
The conservation equations for the continuity, momentum, and energy terms are respectively as follows:
ρ w t + ρ w v w = 0
v w t + v w v w = 1 ρ w p + η 2 v w
T w t + v w T w = k w ρ w c w 2 T w
where ρw, cw, kw, and η denote the density, specific heat, thermal conductivity, and kinematic viscosity of water, respectively. The vw is the velocity vector, p is the static pressure, and Tw is the temperature of the water.
The thermal pad is the same as the LCP where only thermal conductivity is considered, which can be expressed as follows:
ρ t c t T t = k t T
ρ l c l T t = k l T
where ρt, ct, and kt denote the density, specific heat, and thermal conductivity of the thermal pad, respectively. ρl, cl, and kl are the density, specific heat, and thermal conductivity of the LCP, respectively.

2.2.4. Initial and Boundary Conditions

The initial temperature of the BTM system was set as the ambient temperature, which was 30 °C. The inlet mass flow rate and temperature were controlled to 0.1 kg/s and 25 °C separately by external circulation, which was not considered in this model. The outlet flow of the coolant was set as the pressure outlet. Each contact surface between the different regions was arranged as a coupled wall. The surrounding and the top faces of PCM were set with 2 mm aluminum thickness, as in the shell of the battery pack. A natural convection condition between the shell and the ambient air can be governed as follows:
k s T n = h nat T s T a
where hnat is the natural convective heat transfer coefficient of air with the value of 5 W·m−2·K−1 [38,39], ks denotes the shell’s thermal conductivity, and Ts and Ta stand for the shell and ambient temperature, respectively. n refers to the wall-normal direction.
The governing equations of the BTM system proposed in this paper are solved by the finite volume method. The setting of the initial and boundary conditions is conducted in ANSYS Fluent. The discretization of the physical model is processed in Fluent meshing.

2.2.5. Mesh Independence Verification

The poly-hexcore mesh was set in the BTM system. Element counts of 0.93, 2.88, 3.94, 5.07, 7.12, and 9.35 million were selected to analyze the maximum temperature of the battery pack (Tb_max) and the average temperature of the 5% EG PCM (Tp_ave) for mesh independence verification. The 1C discharge rate of the battery pack was applied in this process. The result of mesh independence verification is shown in Figure 3. The relative errors of the Tb_max and Tp_ave are within 0.1% when the element number is larger than 5.07 million. Considering the calculation accuracy and time, the BTM system with 5.07 million mesh elements is appropriate for use in the subsequent simulations. The view of the final mesh is presented in Figure 4.

3. Results and Discussions

3.1. Performance Comparison of Different BTM Patterns

The primary function of the PCM is to mitigate the heating rate of the batteries. While the LC system is intended to dissipate the heat generated during battery operation. In this section, two different patterns of the BTM system were proposed. These were a traditional BTM system with LC, and a composite BTM system with combined PCM with LC. The only difference in simulation between the two BTM systems is that the traditional design uses air instead of PCM.
Figure 5 displays the battery pack’s maximum temperature and temperature difference at the ambient temperature of 30 °C for different discharge rates. In Figure 5a,b, the maximum temperature and temperature difference of the battery pack remain stable after a brief surge when the battery’s discharge rate is 1C. This indicates that the LC system can adequately meet heat dissipation requirements at this time. Meanwhile, the 1C discharging curves of the two BTM systems almost coincide, indicating that the cooling abilities of the systems are similar under this condition. Notably, the mentioned surge results from the simulation’s assumption that the initial temperature of the coolant equals the ambient temperature, restricting the capacity of the LC system before a cooling cycle is entirely established. When the discharge rate reaches 2C, the maximum temperature and temperature difference of the battery pack keep increasing due to the rising battery heat generation rate. The cooling effect of the two systems significantly differs at this point. Compared with the traditional BTM system, the composite system can reduce the maximum temperature and temperature difference of the battery pack by 6.14 °C and 4.43 °C at the terminal of 2C discharge, respectively.
Figure 6 illustrates the battery pack’s maximum temperature and temperature difference at the ambient temperature of 40 °C, and we see that the PCM completely lost its heat storage capacity. Thus, the cooling effect of the composite BTM system deteriorates as shown in Figure 6a,b. Specifically, relative to the traditional system, the maximum temperature and temperature difference of the pack for the composite system increased by 3.72 °C and 3.68 °C at the end of 1C discharge, respectively. This was because the PCM was solidifying and releasing heat. However, during the 2C discharge, the PCM’s large heat capacity still aided in reducing the maximum temperature and temperature difference of the composite system compared to the traditional system, which are 45.06 °C and 15.93 °C, respectively.
In conclusion, when the battery discharge rate is 1C, the intervention of PCM will slightly deteriorate the battery pack’s temperature characteristics if the ambient temperature is higher than the PCM’s melting temperature of 32–36 °C. When the battery discharge rate is 2C, the addition of PCM will lower the maximum temperature of the battery during the discharge process. The battery pack’s temperature uniformity is also improved. The composite BTM system with PCM and LC proposed in this paper has demonstrated superiority over the traditional LC BTM systems.

3.2. Thermal Effects of the Mass Fraction of EG in PCM

Mixing EG with different mass fractions in PW can significantly change the thermophysical properties of PCM. In this section, the effect of five different mass fractions of EG in PCM (pure PW, 5%, 10%, 15%, and 20%) was simulated. Figure 7a,b, respectively, indicate the maximum temperature and temperature difference of the battery pack with various mass fractions of EG in PCM, at 2C discharge and at the ambient temperature of 30 °C. Figure 7a illustrates that the maximum temperature of the pack during 2C discharge is reduced when PW is mixed with 5%, 10%, 15%, or 20% EG. The respective maximum temperatures are 49.55 °C, 48.59 °C, 49.24 °C, and 49.31 °C. This suggests that adding a certain amount of graphite to pure paraffin can enhance the PCM’s thermal storage performance. During the phase transition stage (300–1200 s), the maximum temperature is similarly reduced for the three EG mass fractions. However, during the later stage (1200–1800 s), the use of 10% EG PCM results in the lowest maximum cell temperature, which suggests that a higher mass fraction of EG in the PCM does not necessarily lead to a better thermal storage effect. Figure 7b depicts the impact of paraffin wax-based PCM with various EG mass fractions on the cell’s temperature difference during 2C discharge. The pure PW retains the cell temperature difference at a minimum of 11.25 °C, whereas 5%, 10%, 15%, and 20% EG of PCM increase the temperature difference to 13.55 °C, 13.17 °C, 13.62 °C, and 13.64 °C, respectively. This is due to pure PW’s low thermal conductivity, which enhances thermal insulation between the battery cell and its surroundings. By combining the information from Figure 7a,b, it can be concluded that the 10% EG PCM offers the optimal solution. This not only minimizes the maximum cell temperature but also keeps the temperature difference minimal (except for pure PW).
Figure 8 displays the average temperature (Tp_ave) and the liquid fraction (Lp) of PCM with different mass fractions of EG at the end of cell 2C discharge. Tp_ave can reflect the heat storage potential of PCM. With the addition of EG, the thermal conductivity of PCM increases significantly, and the heat generated by the cells is absorbed by PCM more quickly. This results in a decrease in temperature, thus reducing the heat production of the cells. However, if EG is added in excess, the mass of the PCM decreases, thus weakening the PCM’s ability to absorb heat through the phase change process. Specifically, the 10% EG PCM demonstrates the lowest average temperature of 43.43 °C, indicating that it offers a suitable temperature gradient for the subsequent battery heat dissipation. In contrast, the liquid fraction of pure PW is the smallest at 84.37%, which can be attributed to its maximum latent heat. The liquid fraction of 20% EG PCM is the largest at 97.68%, indicating that its heat storage potential is almost depleted, and it is struggling to utilize the phase change process to absorb heat from the battery. At the same time, the 10% EG PCM still retains a 92.99% liquid fraction, which sustains a certain heat storage capacity. By considering the analysis of Figure 7 and Figure 8, it can be concluded that the ideal mass fraction ratio for EG in PCM is 10%, which will be adopted in the subsequent analysis.

3.3. Thermal Performance of the Battery Pack with PCM and Liquid Cooling

3.3.1. Influences of the Inlet Mass Flow Rate and Temperature of Coolant

Figure 9 illustrates the relationship between the maximum battery pack temperature and discharge time for various water mass flow rates qm at various flow temperatures. It indicates that both increasing the mass flow rate or decreasing the coolant flow temperature can reduce the maximum temperature of the battery pack during the 2C discharge process. In addition, the maximum temperature curve for each battery shows a rapid rise within the first 200 s of discharge for the establishment of a cooling cycle. Once the cycle is fully built, the cell’s temperature rise will be significantly suppressed. Moreover, the inflection point of the maximum cell temperature will occur earlier as the mass flow rate increases.
Specifically, as shown in Figure 9a, when the flow temperature is 25 °C and the mass flow rate is 0.1 kg/s, the maximum temperature of the battery will continue to rise slowly. This indicates that the LC system does not suppress the sustained heating of the battery pack, and that the cooling capacity needs to be enhanced at this time. However, when the mass flow rate reaches 0.15 kg/s, 0.2 kg/s, or 0.25 kg/s, the maximum temperature of the battery pack will decrease continuously after a brief rise. This means that the performance of the LC system is sufficient. The latter trend can also be summarized from Figure 9b–d. In addition, the comparative results between the maximum temperature of the battery pack at the terminal of 2C discharge and the initial temperature of 40 °C are listed in Table 3. They show that some combinations of mass flow rate and temperature can reduce the maximum temperature of the battery pack below the ambient temperature. At 25 °C and 0.1 kg/s inlet flow, the maximum temperature of the battery pack is 5.26 °C higher than the ambient temperature; while at 10 °C and 0.25 kg/s inlet flow, it is 4.46 °C lower. It is worth noting that the reduction in the maximum temperature of the battery slows down to around 36 °C owing to some heat being released during the solidification process of the PCM. This offsets some of the cooling capacity of the LC system. In general, by adjusting the flow temperature and mass flow rate of coolant, the performance of the LC system can be improved and the maximum temperature of the battery is significantly reduced.
Figure 10 shows the maximum temperature difference of the battery pack during the 2C discharge process. It is clear that raising the mass flow rate can lower the battery pack’s temperature difference. However, deep cooling at the bottom of the cells will cause the temperature difference to rise if the flow temperature is lowered. For example, compared with the inlet flow of 15 °C and 0.1 kg/s, an inlet flow of 20 °C and 0.25 kg/s can decrease the maximum temperature of the battery more efficiently while also decreasing the maximum temperature difference by 4.60 °C. Therefore, controlling the inlet temperature to below 20 °C while increasing the mass flow rate is an ideal LC control logic in this model, although it does not consider the energy consumption of lowering the inlet temperature or raising the mass flow rate.

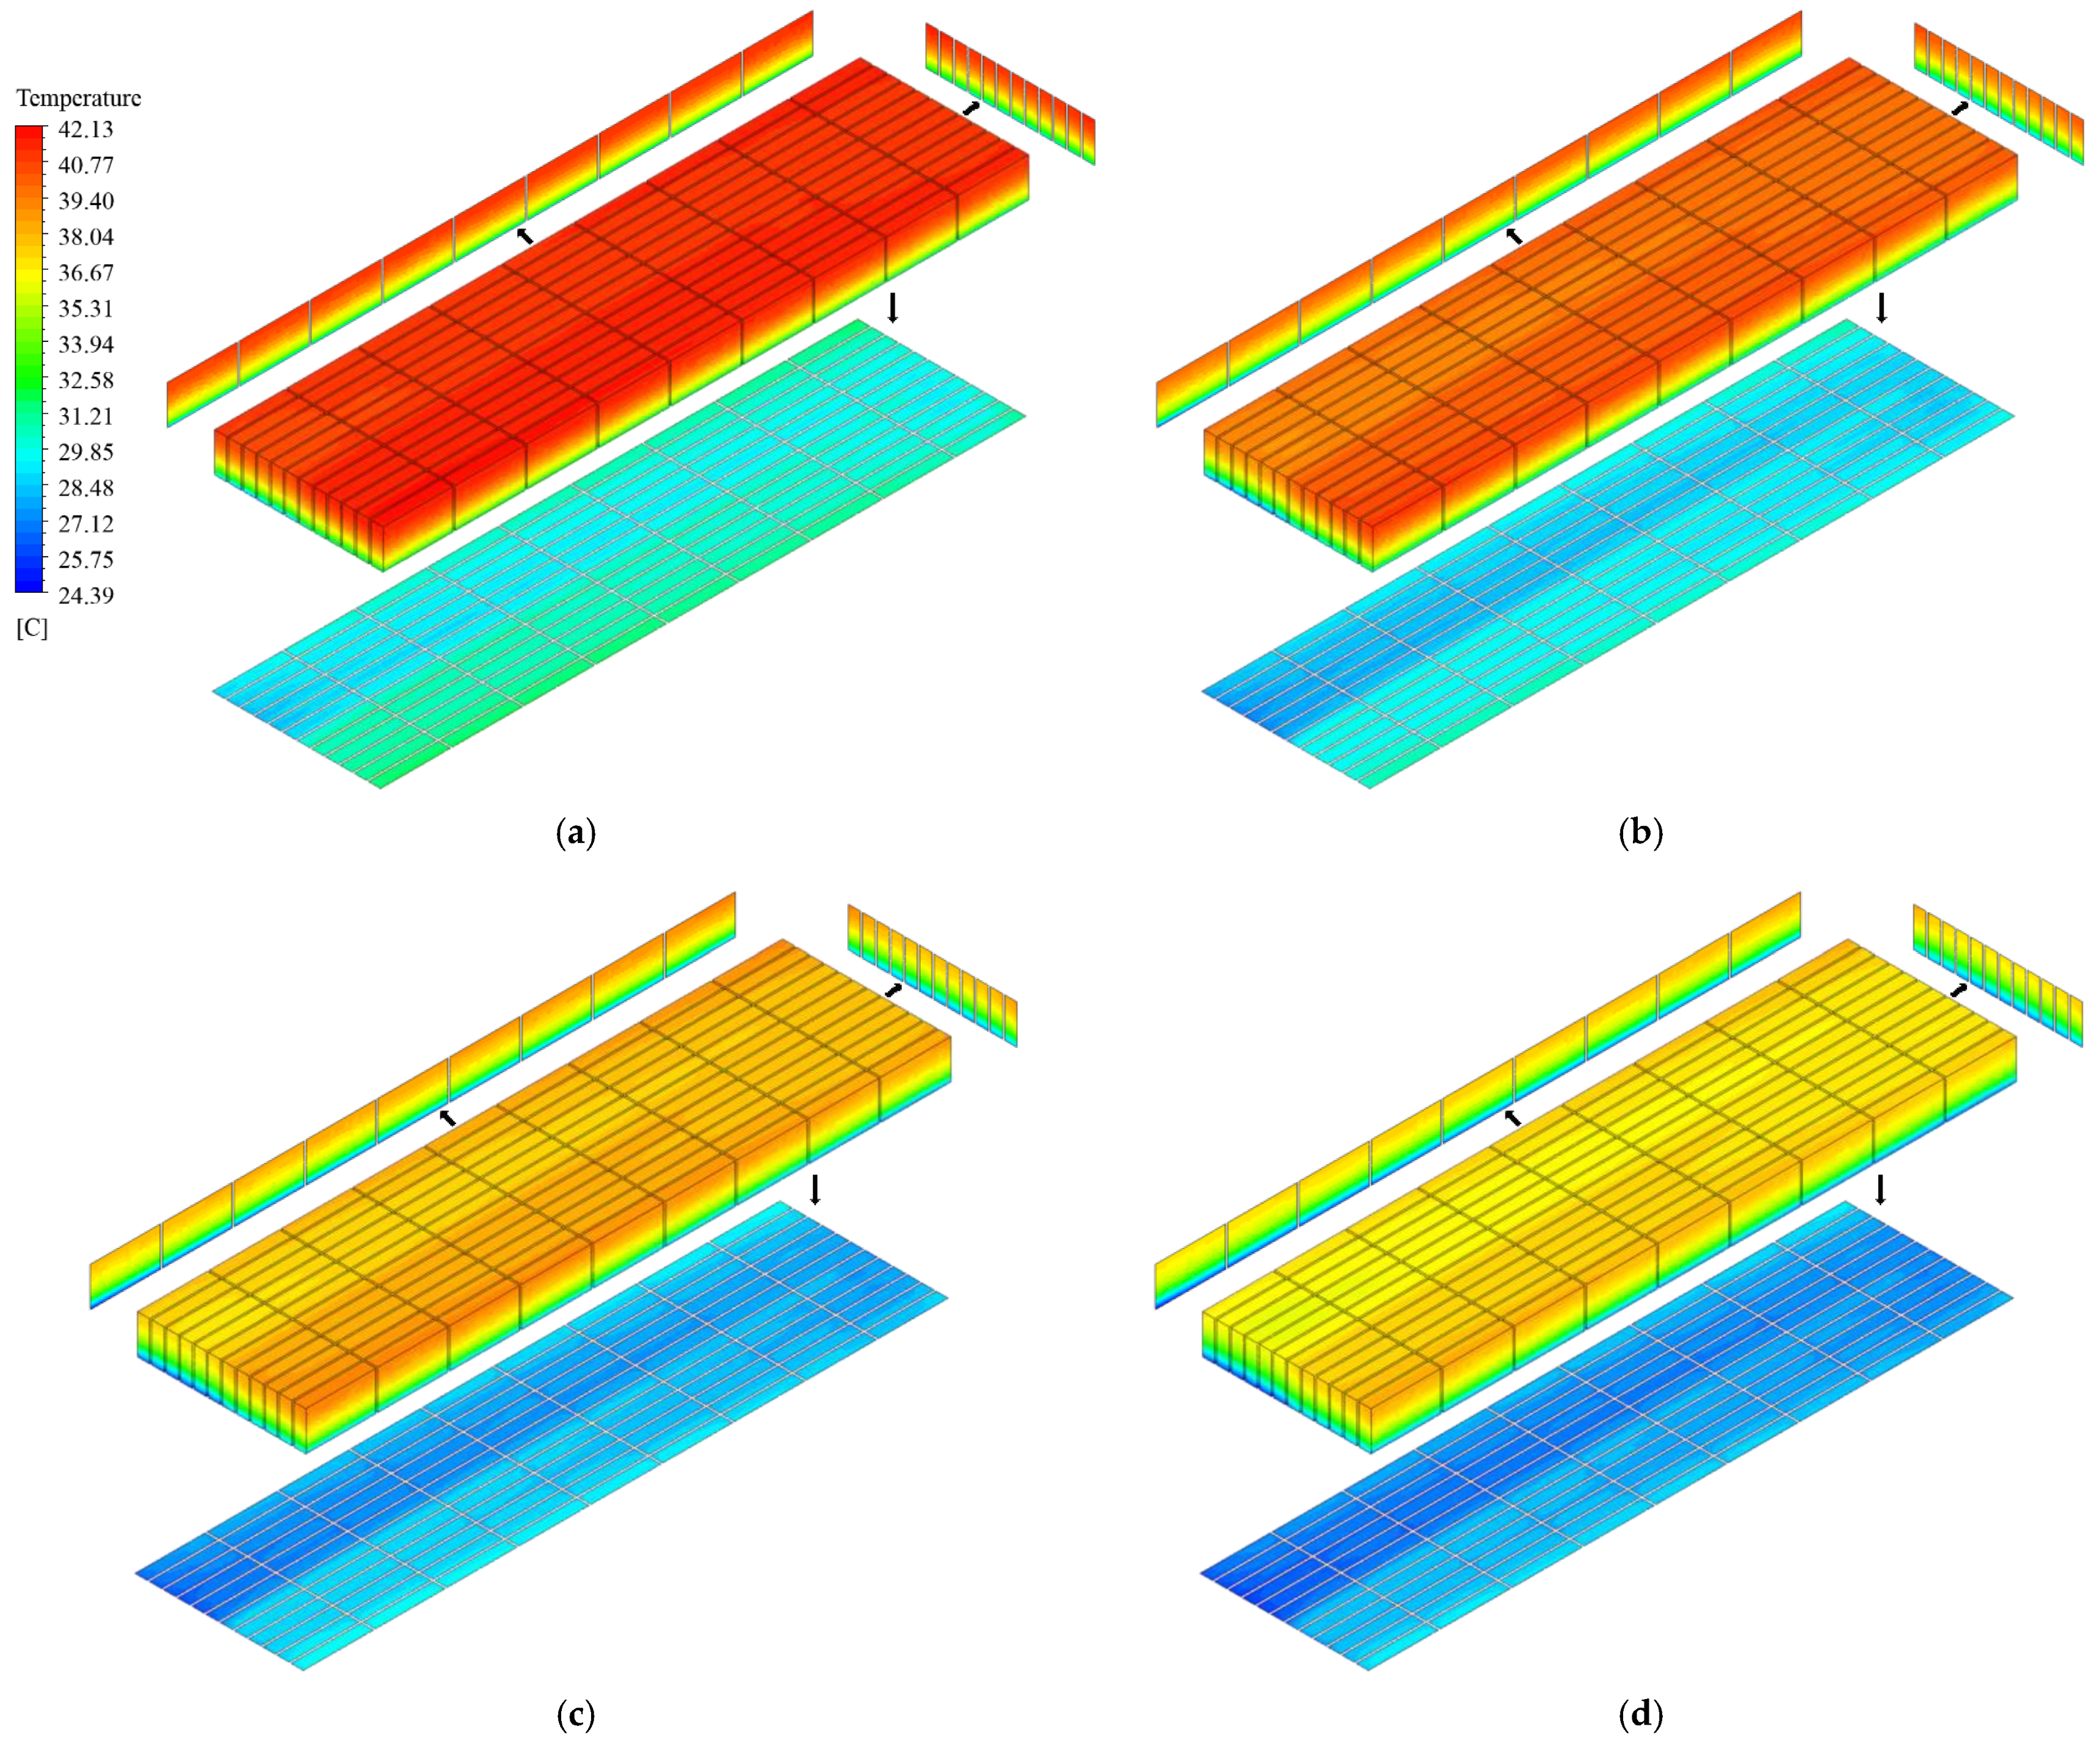
3.3.2. Temperature Distribution of the Battery Pack

Figure 11 depicts the battery pack’s temperature distribution during continuous discharge at 2C using the PCM and LC with 20 °C and 0.25 kg/s inlet flow at a 40 °C ambient temperature. In the first 300 s of discharge, as shown in Figure 11a, the temperature at the top of the battery pack is evenly distributed at its highest point. This is because the LC cycle has just been established and the cooling effect is limited. Meanwhile, the temperature at the bottom is about 12 °C lower than that that at the top because it is closer to the LCP. Additionally, there are obvious temperature differences along the coolant flow direction. The coolant inlet area has the lowest temperature, and the outflow area has a 3 °C higher temperature than the inlet due to the coolant’s rising temperature during the heat exchange process, which deteriorates the heat transfer.
When the battery is discharged for 600 s, as shown in Figure 11b, the temperature at the battery top starts to vary from the previous reading at 300 s. The area near the coolant inlet at the top is cooler, while the area near the coolant outlet is warmer by about 2 °C. Despite the temperature non-uniformity in the horizontal plane of the pack, the pack’s top remains significantly hotter than the bottom. It is easy to see that the arrangement of the inlet, outlet, and channel of the LCP greatly influenced the battery temperature distribution. Figure 11c,d have the same temperature distribution pattern as Figure 11b and are only numerically different, indicating that the temperature distribution pattern is highly approximate once the LC cycle is fully established. The role of the PCM here is equivalent to that of a thermal tank that absorbs the cooling capacity from the LC system. This is because the PCM is fully liquefied and has no heat storage capacity at a 40 °C ambient temperature. After the LC system is restored, the PCM will contribute significantly to the temperature control of the battery pack. To summarize the findings from Figure 11, the highest temperature of the battery pack is located farthest away from the coolant outlet in the vertical direction, while the area with the lowest temperature is close to the inlet during the cooling process.

4. Conclusions

This paper evaluated the thermal performance of a BTM system that integrated PCM and LC using numerical methods. A pack-level model, including the battery pack, the composite PCM, the thermal pad, and the LCP was built. A dynamic electro-thermal model of heat generation for the prismatic cell was adopted. We used the enthalpy–porosity model for PCMs and the k-ε model for the coolant flow. Further, a parametric analysis was carried out on the influences of various parameters on the BTM system. The parameters included the cell’s discharge rate, the ambient temperature, the mass fraction of EG in PCM, the inlet mass flow rate, and the temperature of the coolant in the liquid cooling equipment. The main conclusions are presented below:
(1)
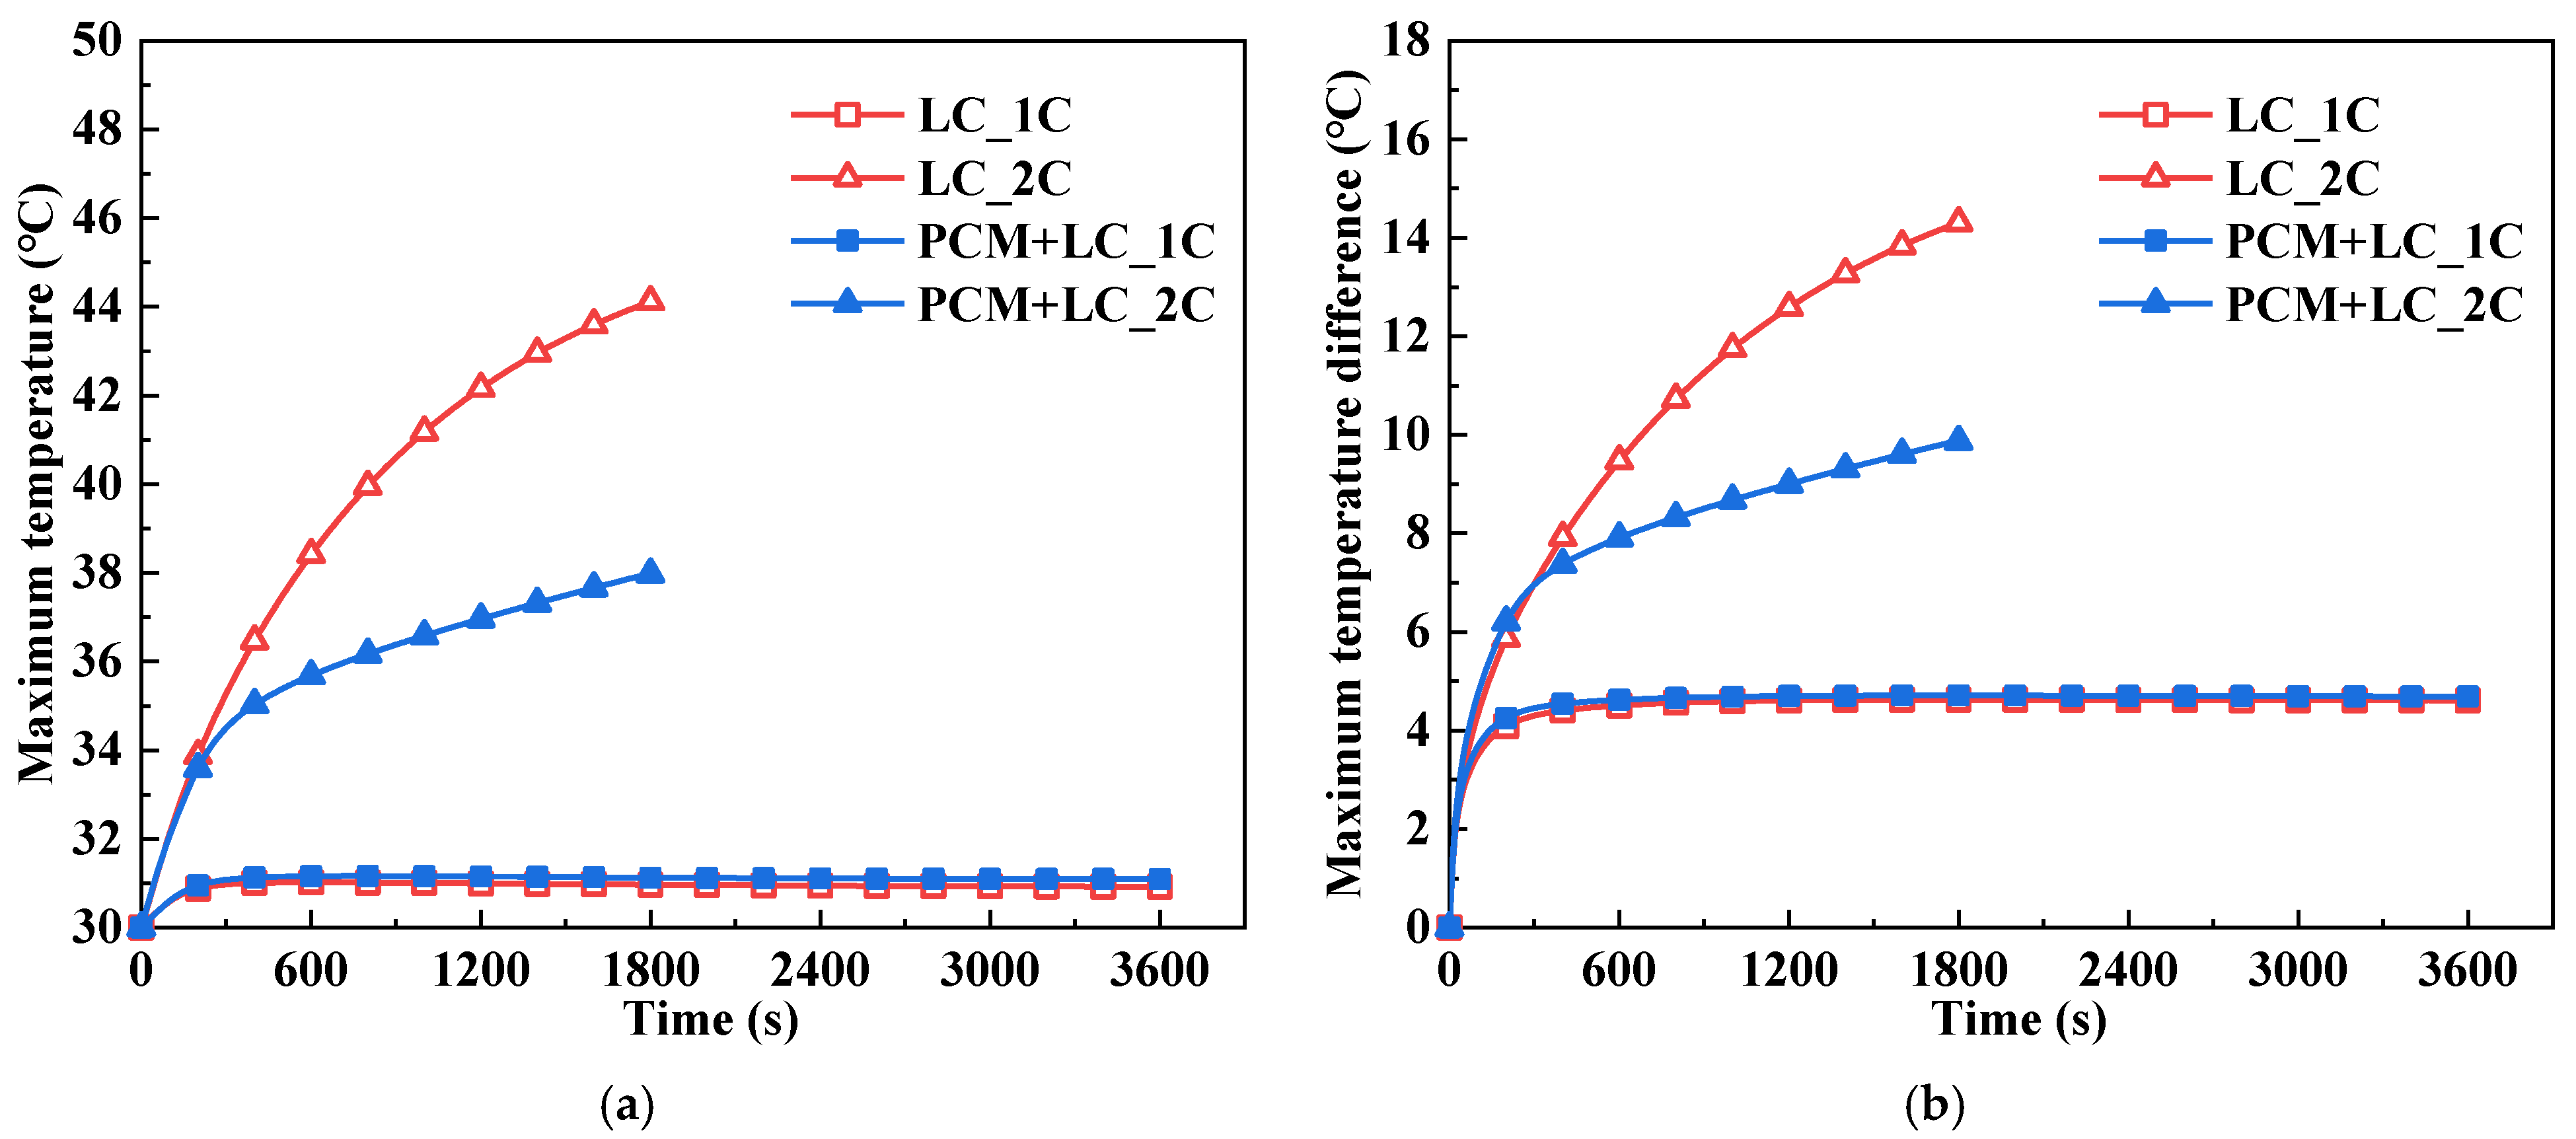
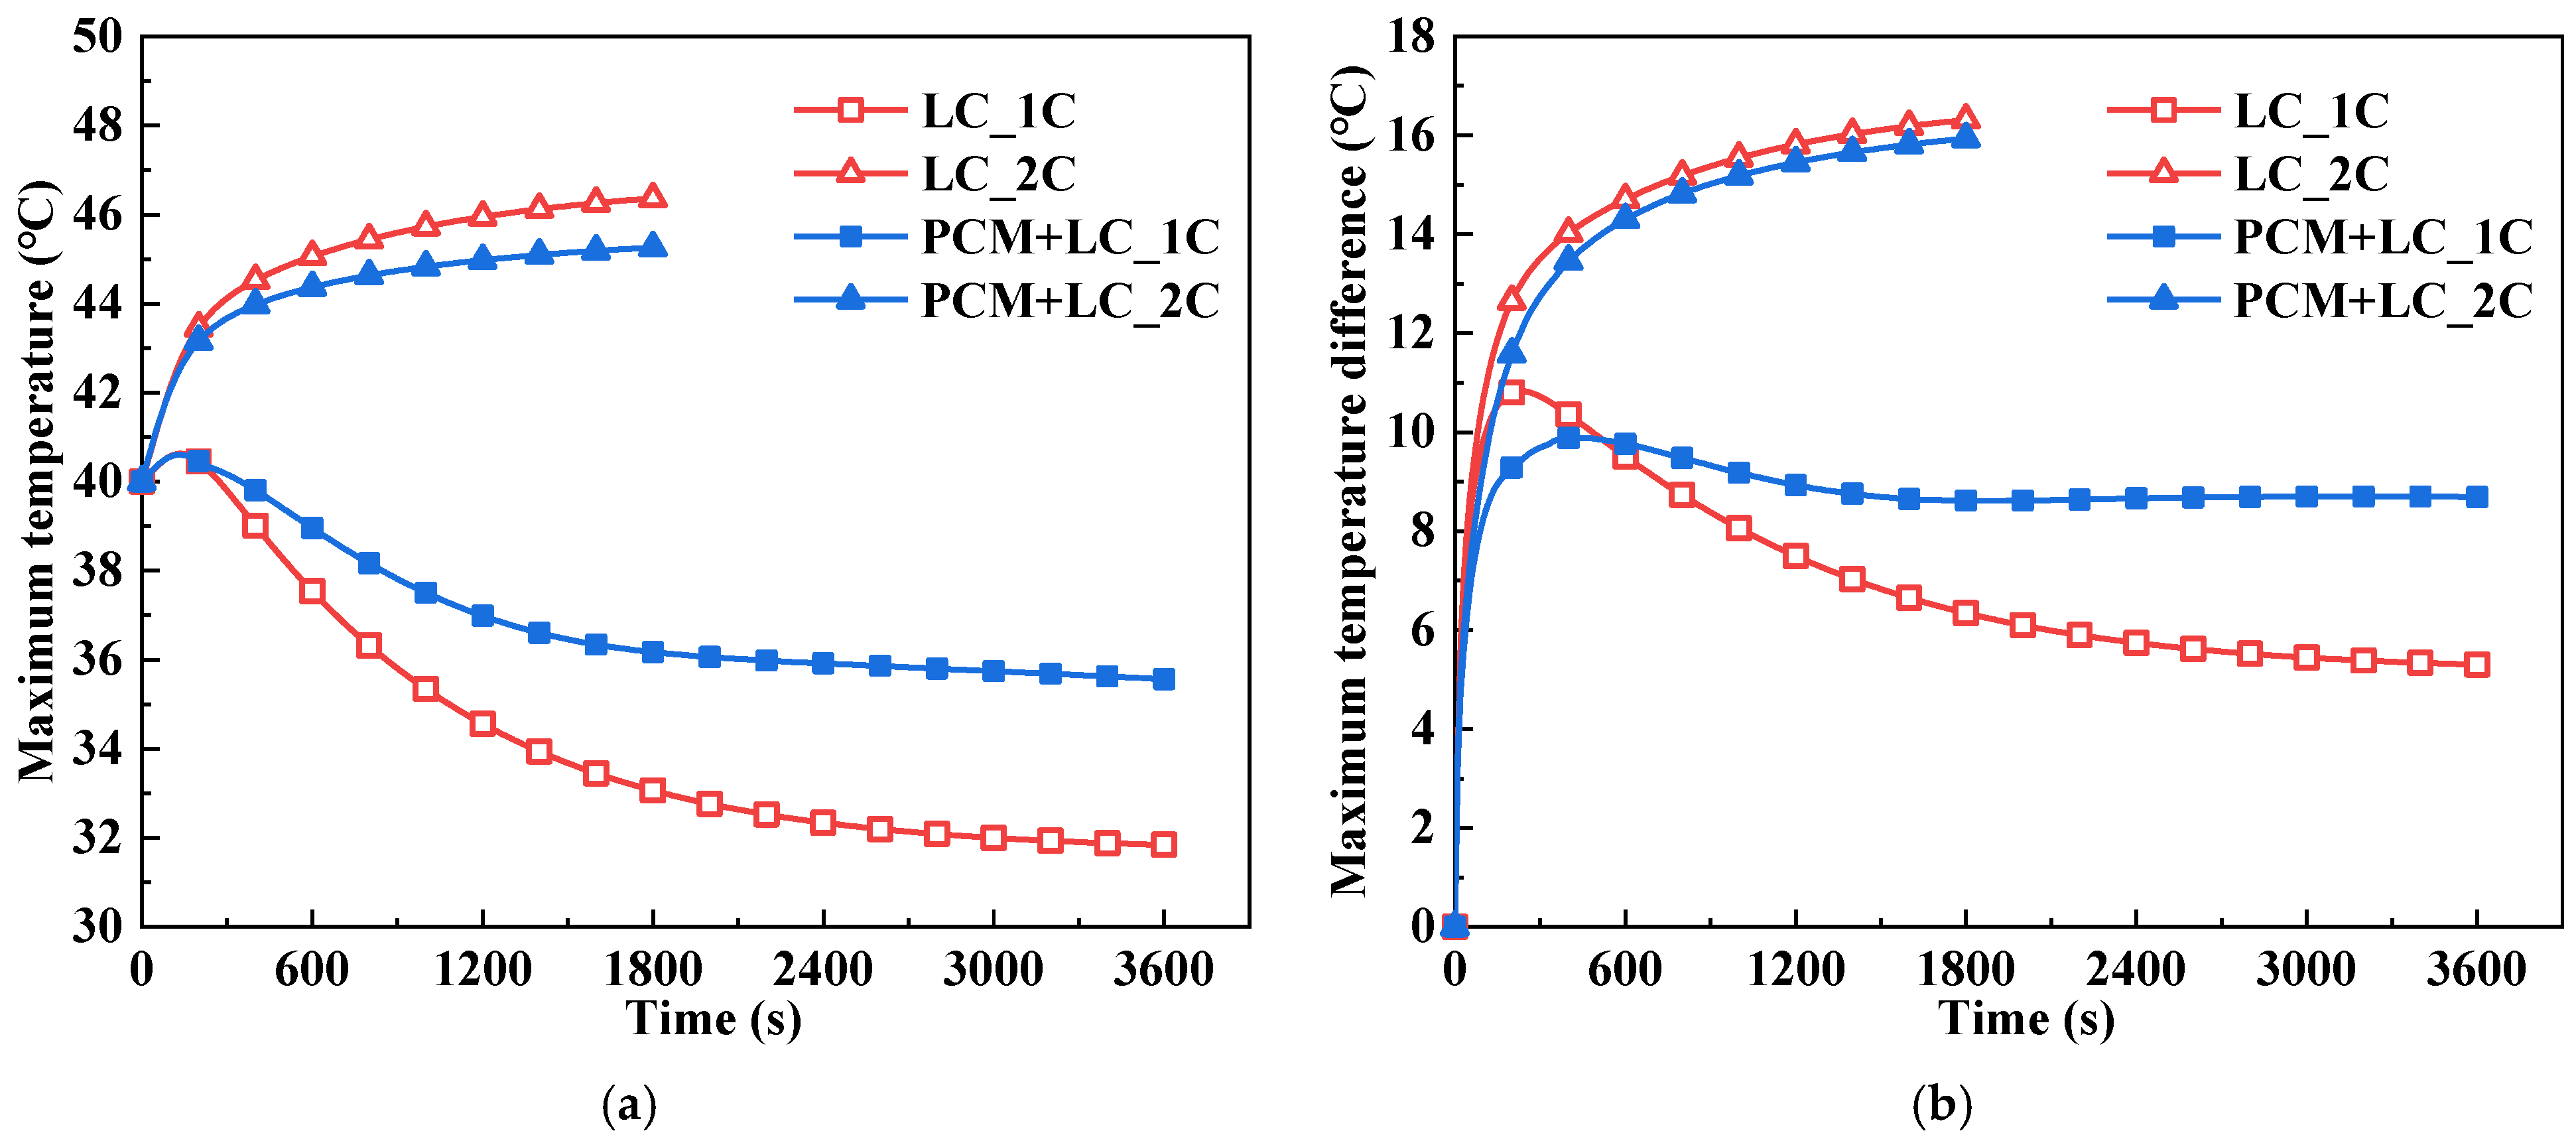
Compared with the traditional BTM system using LC, the proposed composite BTM system with PCM and LC can reduce the battery pack’s maximum temperature and temperature difference after full 2C discharge at the ambient temperatures of both 30 °C and 40 °C. For the discharge process of 1C, the BTM performance of the two systems is similar at a 30 °C ambient temperature. This is because the battery heat production is relatively low and the PCM’s melting temperature of 32–36 °C is not reached. When the ambient temperature is 40 °C, the PCM cannot absorb heat and thus utilize the phase change process because the ambient temperature is higher than the melting temperature of the PCM. Besides, the heat load on the system has increased due to the PCM, resulting in poorer temperature characteristics for the composite system than the traditional system during the 1C discharge process.
(2)
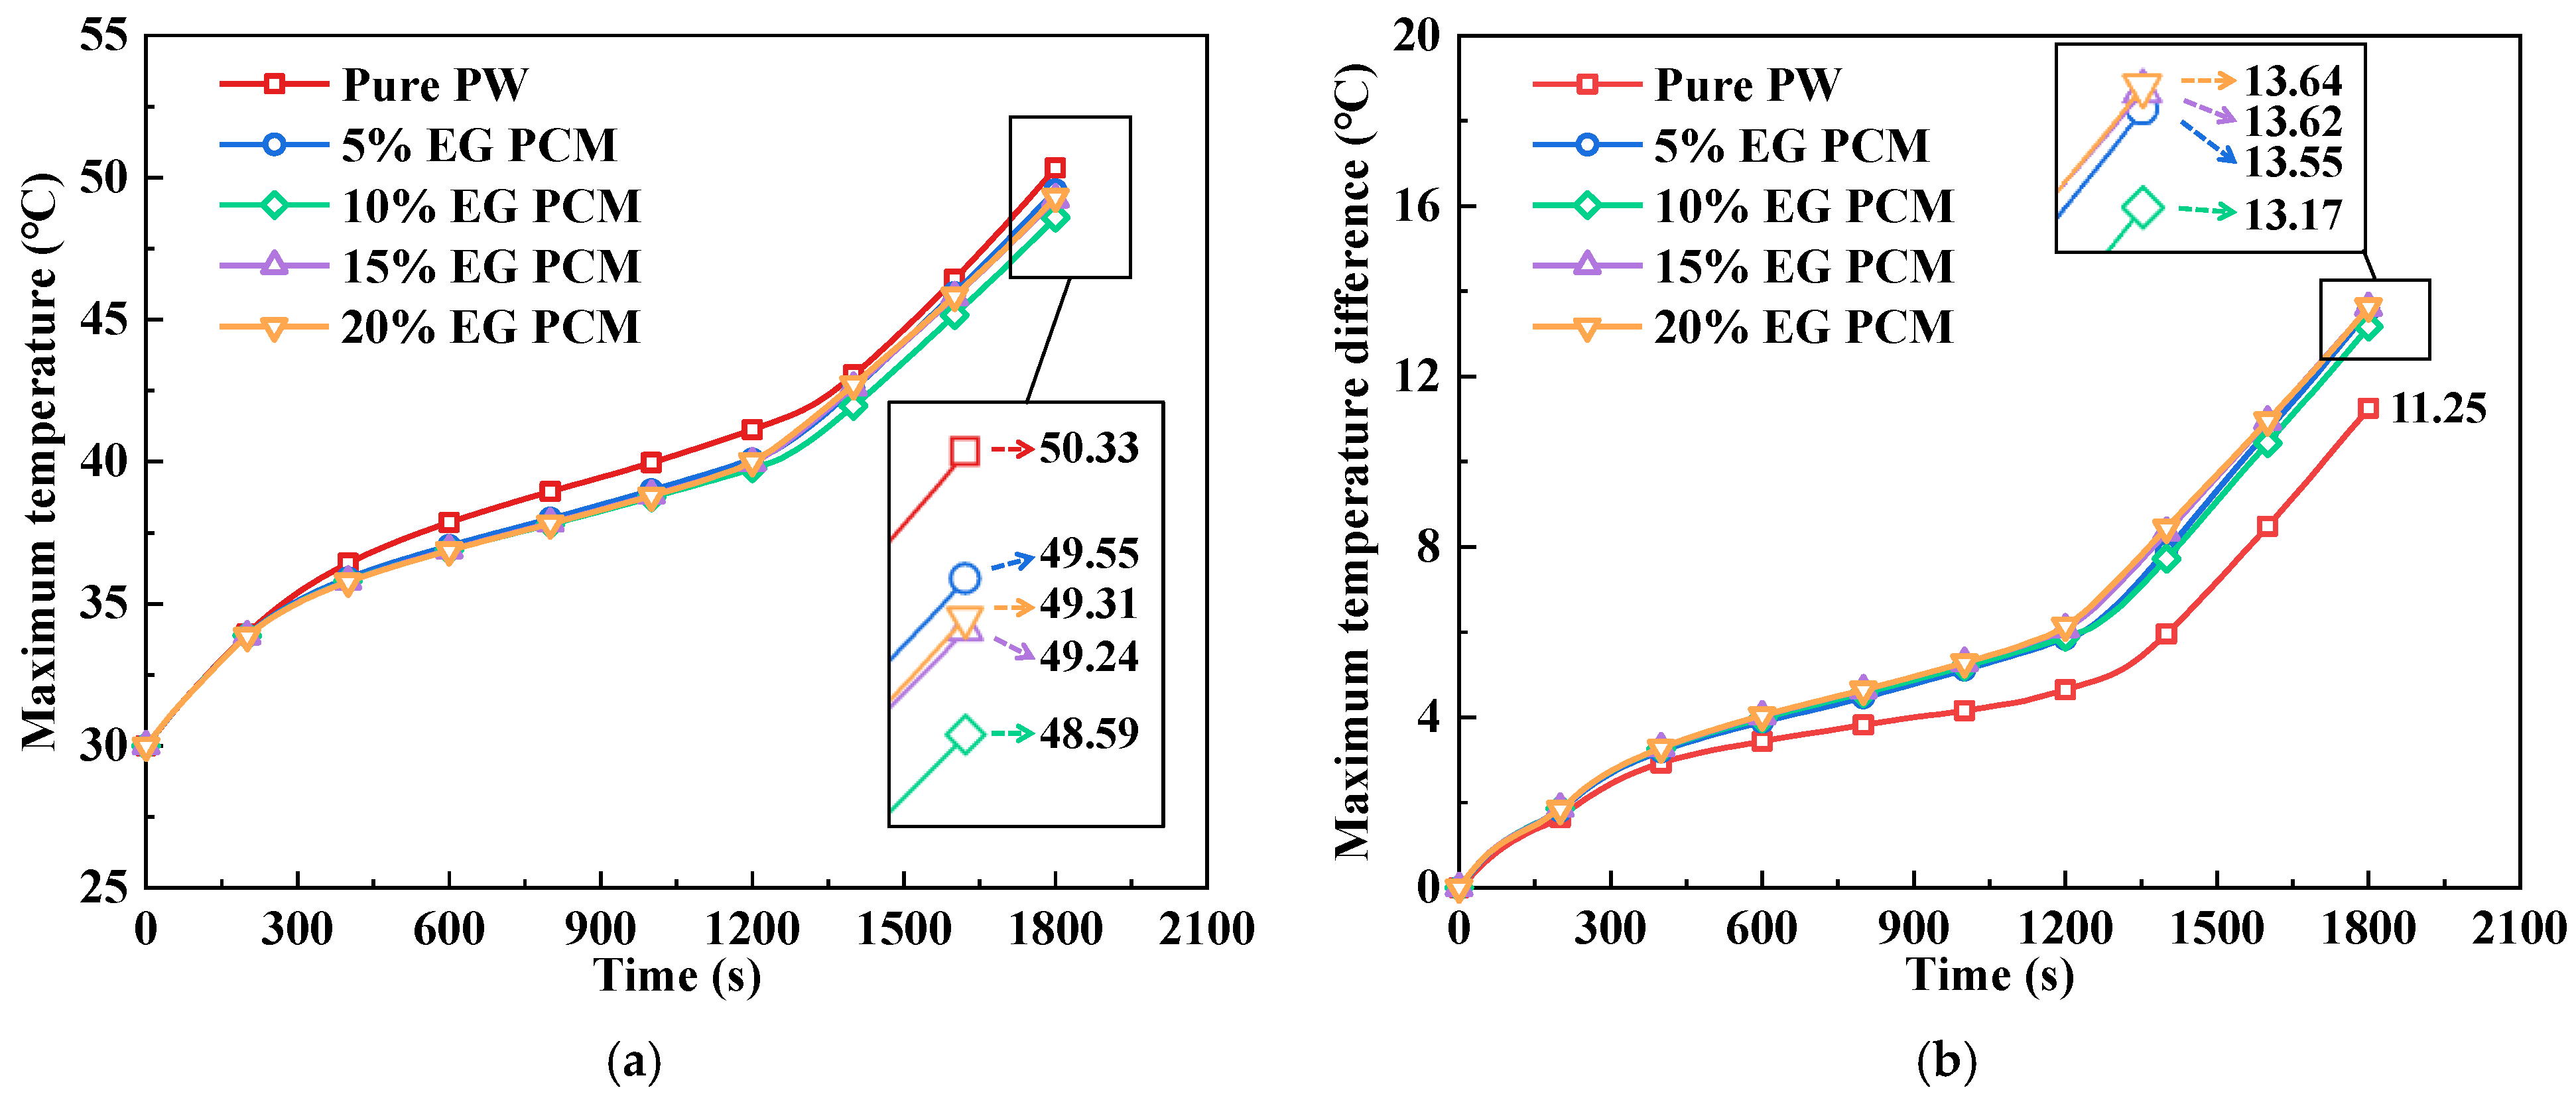
Mixing EG with various mass fractions in PW can clearly enhance the PCM’s thermal performance. Compared with pure PW, the use of 10% EG in PCM reduced the battery pack’s maximum temperature at the terminal of 2C discharge by 1.74 °C. Additionally, compared to the 20% EG PCM, it resulted in a 0.47 °C decrease in the temperature difference. Furthermore, as determined through discussing the average temperature and liquid fraction of PCM, the addition of 10% EG in PCM was able to sustain a sufficient heat storage capacity, making this the ideal mass fraction ratio.
(3)
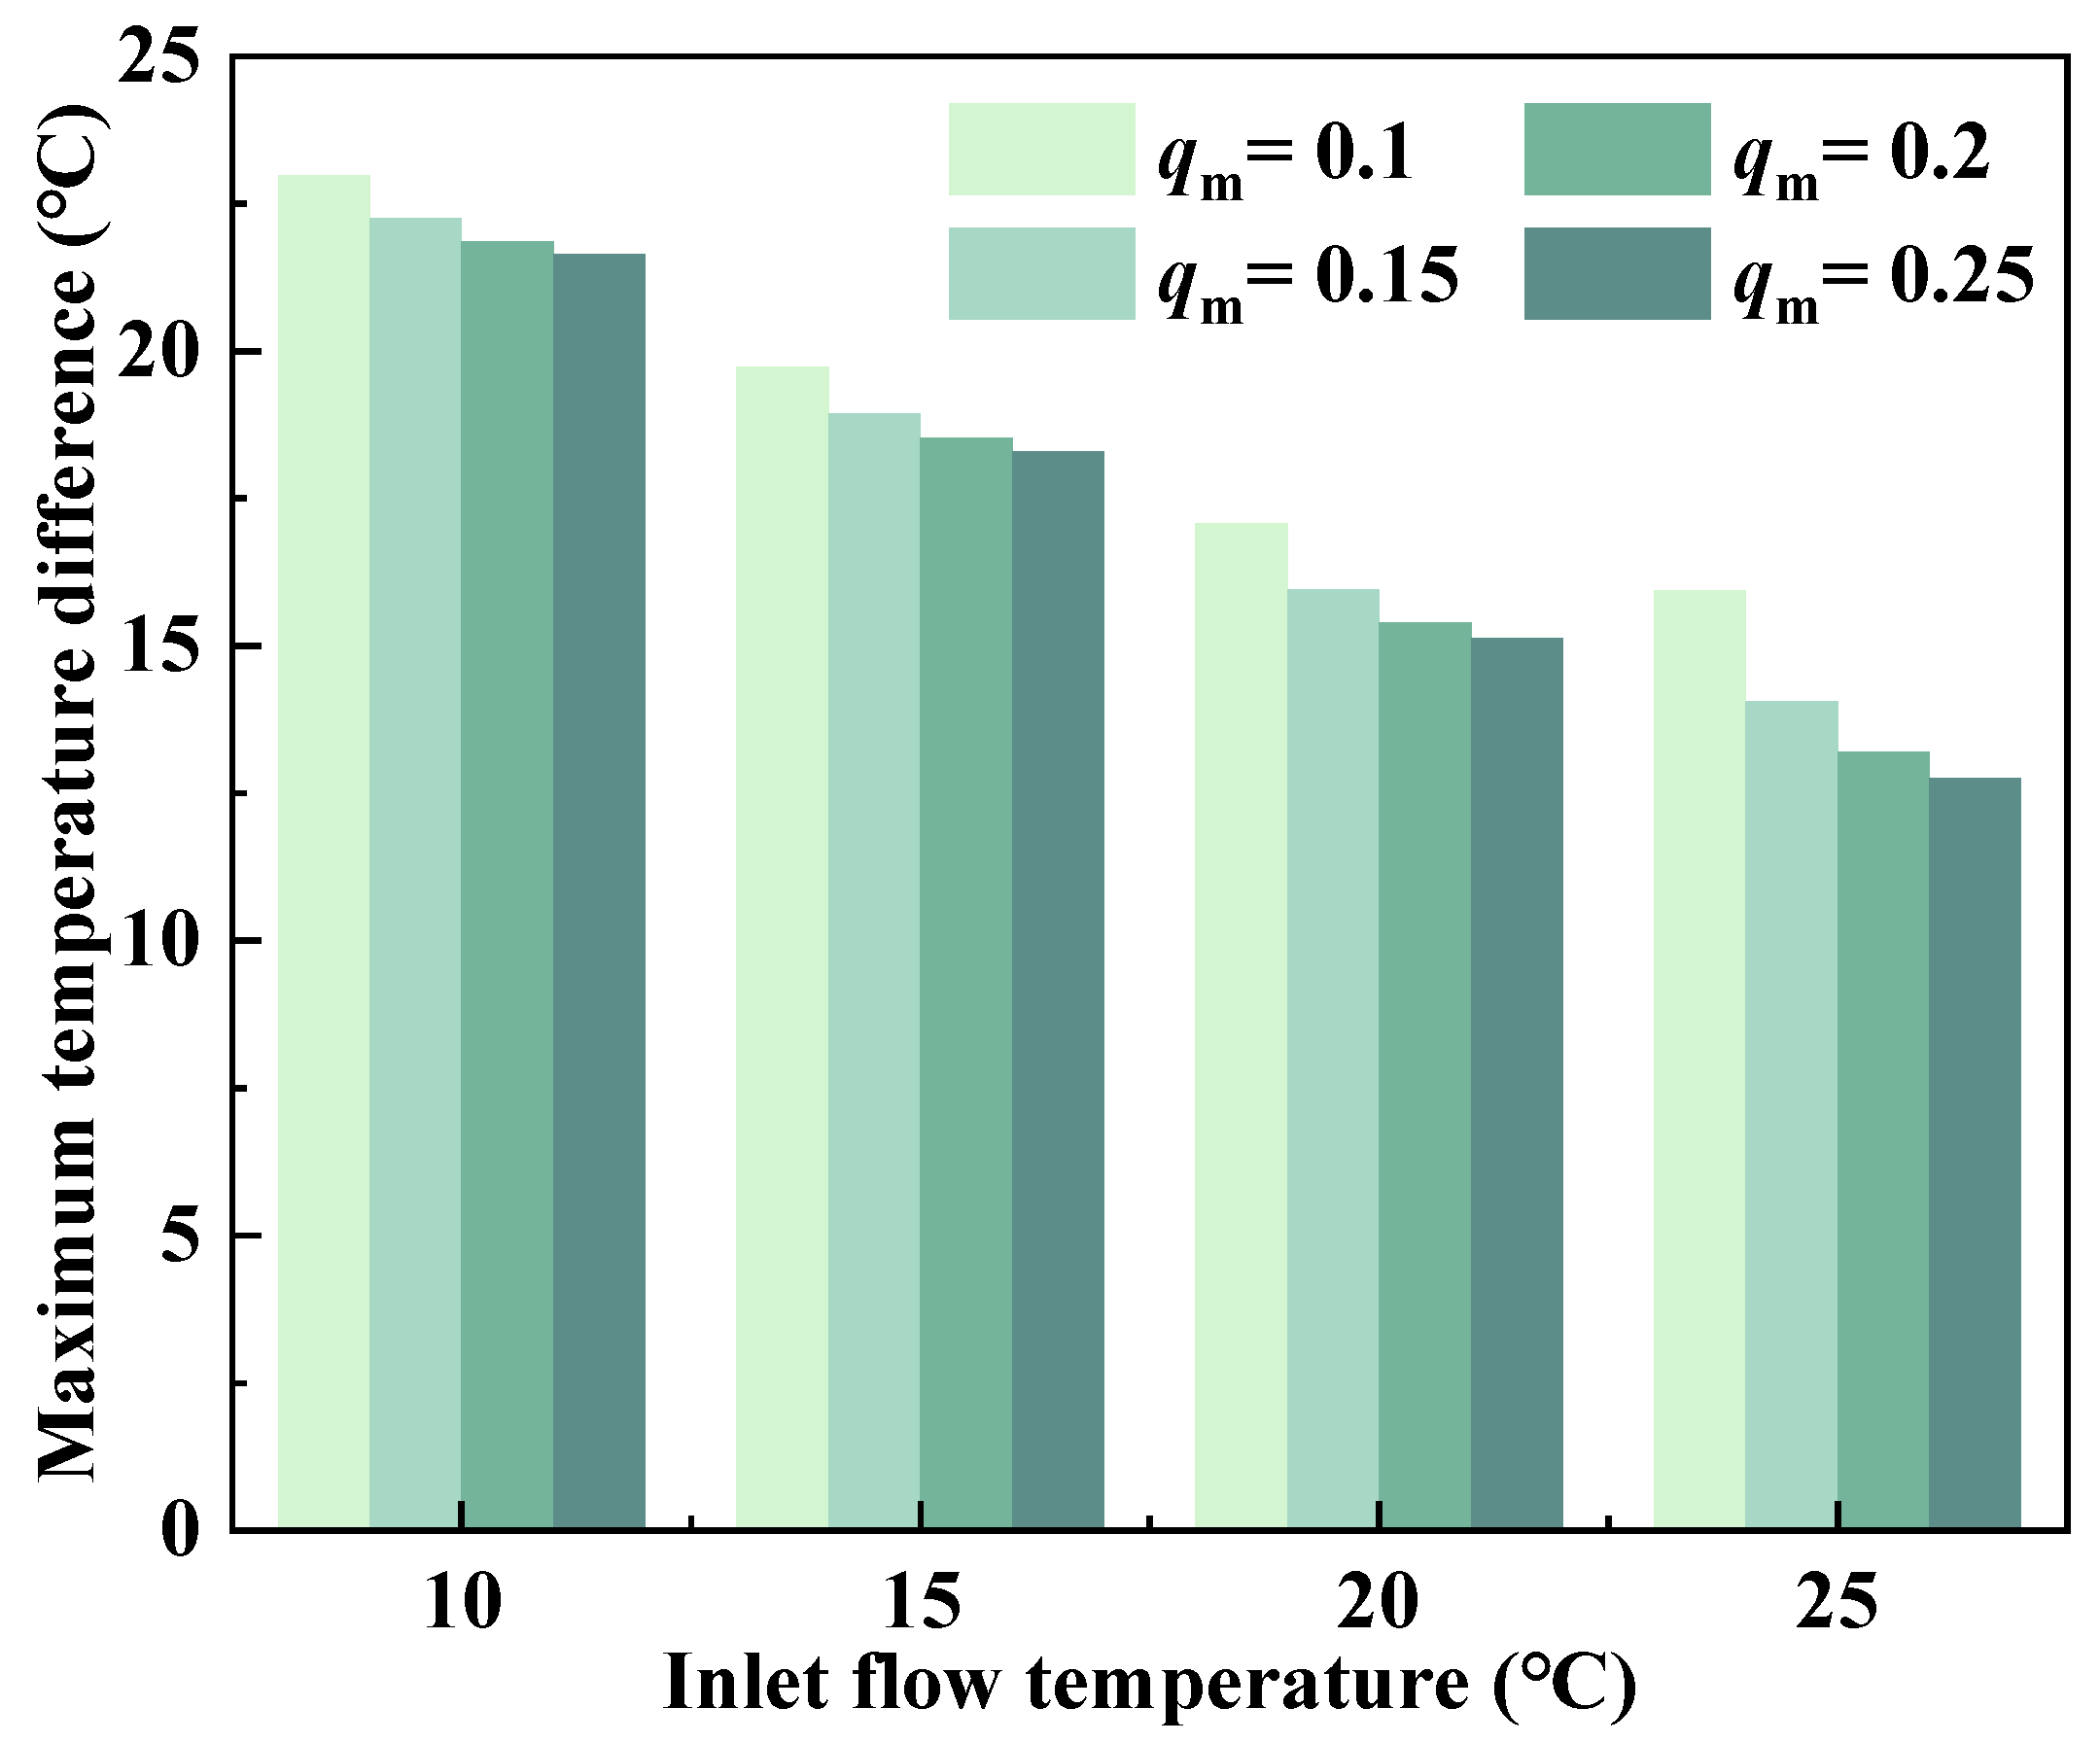
The maximum temperature of the battery pack during the 2C discharge process at a temperature of 40 °C can be decreased by increasing the mass flow rate and decreasing the flow temperature of the coolant. Additionally, the former can also reduce the maximum temperature difference of the battery pack. However, the latter will deeply reduce the temperature of the battery bottom and deteriorate the battery temperature difference. Hence, an ideal LC control logic for this model was proposed, which would be to increase the mass flow rate while maintaining the appropriate inlet temperature.

Author Contributions

Conceptualization, D.D. and M.W.; methodology, J.S., D.D. and Y.Z.; investigation, J.S. and S.C.; simulations, J.S.; wrote the paper, J.S., D.D. and M.W.; revised the paper, D.D., M.W. and E.W.; project administration, M.W.; funding acquisition, D.D. All authors have read and agreed to the published version of the manuscript.

Funding

This research work was financially supported by the National Natural Science Foundation of China (No. 52202434).

Data Availability Statement

Data sharing is not applicable to this article.

Acknowledgments

We wish to thank Xuehui Wang for his help in technical support and manuscript revision.

Conflicts of Interest

The authors declare no conflict of interest.

Nomenclature

AmushMushy zone constant [-]Subscripts
cSpecific heat [J·kg−1·K−1]aAmbient
dConstant coefficient [-]aveAverage value
HTotal enthalpy [J·kg−1]bBattery cell
hSensible enthalpy [J·kg−1]fFinal state
hnatNatural convective heat transfer iInitial state
coefficient [W·m−2·K−1]lLiquid cooling plate
hlLatent heat of PCM [J·kg−1]mMelting state
ΔHLatent heat capacity [J·kg−1]maxMaximum value
ICurrent [A]pPhase change material
kThermal conductivity [W·m−1·k−1]p,lLiquid phase change material
LpLiquid fraction of PCM [%]p,sSolid phase change material
mMass [kg]refValues in reference condition
nWall-normal direction [-]sShell
QTotal energy absorbed by PCM [J]tThermal pad
qHeat generation rate [J·s−1]wWater
qmMass flow rate of coolant [kg·s−1]
ReReynolds number
RohmOhmic resistance [Ω]Abbreviation
RpolarPolarization resistance [Ω]BTMBattery thermal management
SMomentum sink [kg·m·s−1]CFDComputational fluid dynamics
TTemperature [K]EGExpanded graphite
tTime [s]LCLiquid cooling
UocvOpen-circuit voltage [V]LCPLiquid cooling plate
VVolume [m3]PCMPhase change material
v Velocity of the liquid PCM [m·s−1]PWParaffin wax
SOCState of charge
Greek symbols
ρDensity [kg·m−3]
εConstant [-]

References

  1. Zhao, Y.; Dan, D.; Zheng, S.; Wei, M.; Xie, Y. A two-stage eco-cooling control strategy for electric vehicle thermal management system considering multi-source information fusion. Energy 2023, 267, 126606. [Google Scholar] [CrossRef]
  2. Ma, S.; Jiang, M.; Tao, P.; Song, C.; Wu, J.; Wang, J.; Deng, T.; Shang, W. Temperature effect and thermal impact in lithium-ion batteries: A review. Prog. Nat. Sci. Mater. Int. 2018, 28, 653–666. [Google Scholar] [CrossRef]
  3. Shahid, S.; Agelin-Chaab, M. A review of thermal runaway prevention and mitigation strategies for lithium-ion batteries. Energy Convers. Manag. X 2022, 16, 100310. [Google Scholar] [CrossRef]
  4. Dan, D.; Zhao, Y.; Wei, M.; Wang, X. Review of Thermal Management Technology for Electric Vehicles. Energies 2023, 16, 4693. [Google Scholar] [CrossRef]
  5. Li, M.; Zheng, S.; Wei, M. Flow Loss Analysis and Structural Optimization of Multiway Valves for Integrated Thermal Management Systems in Electric Vehicles. Energies 2023, 16, 5040. [Google Scholar] [CrossRef]
  6. Karimi, G.; Li, X. Thermal management of lithium-ion batteries for electric vehicles. Int. J. Energy Res. 2013, 37, 13–24. [Google Scholar] [CrossRef]
  7. Wang, T.; Tseng, K.J.; Zhao, J.; Wei, Z. Thermal investigation of lithium-ion battery module with different cell arrangement structures and forced air-cooling strategies. Appl. Energy 2014, 134, 229–238. [Google Scholar] [CrossRef]
  8. Zhao, G.; Wang, X.; Negnevitsky, M.; Li, C. An up-to-date review on the design improvement and optimization of the liquid-cooling battery thermal management system for electric vehicles. Appl. Therm. Eng. 2023, 219, 119626. [Google Scholar] [CrossRef]
  9. Zhao, J.; Rao, Z.; Li, Y. Thermal performance of mini-channel liquid cooled cylinder based battery thermal management for cylindrical lithium-ion power battery. Energy Convers. Manag. 2015, 103, 157–165. [Google Scholar] [CrossRef]
  10. Sheng, L.; Su, L.; Zhang, H.; Li, K.; Fang, Y.; Ye, W.; Fang, Y. Numerical investigation on a lithium ion battery thermal management utilizing a serpentine-channel liquid cooling plate exchanger. Int. J. Heat Mass Transf. 2019, 141, 658–668. [Google Scholar] [CrossRef]
  11. Weragoda, D.M.; Tian, G.; Burkitbayev, A.; Lo, K.-H.; Zhang, T. A comprehensive review on heat pipe based battery thermal management systems. Appl. Therm. Eng. 2023, 224, 120070. [Google Scholar] [CrossRef]
  12. Bernagozzi, M.; Georgoulas, A.; Miché, N.; Rouaud, C.; Marengo, M. Novel battery thermal management system for electric vehicles with a loop heat pipe and graphite sheet inserts. Appl. Therm. Eng. 2021, 194, 117061. [Google Scholar] [CrossRef]
  13. Budiman, A.C.; Azzopardi, B.; Sudirja; Perdana, M.A.P.; Kaleg, S.; Hadiastuti, F.S.; Hasyim, B.A.; Amin; Ristiana, R.; Muharam, A. Phase Change Material Composite Battery Module for Thermal Protection of Electric Vehicles: An Experimental Observation. Energies 2023, 16, 3896. [Google Scholar] [CrossRef]
  14. Zheng, S.; Li, S.; Li, M.; Dai, R.; Wei, M.; Tian, R. Experimental and numerical investigation of a rectangular finned-tube latent heat storage unit for Carnot battery. J. Energy Storage 2023, 71, 108092. [Google Scholar] [CrossRef]
  15. Rao, Z.; Wang, Q.; Huang, C. Investigation of the thermal performance of phase change material/mini-channel coupled battery thermal management system. Appl. Energy 2016, 164, 659–669. [Google Scholar] [CrossRef]
  16. Alrashdan, A.; Mayyas, A.T.; Al-Hallaj, S. Thermo-mechanical behaviors of the expanded graphite-phase change material matrix used for thermal management of Li-ion battery packs. J. Mater. Process. Technol. 2010, 210, 174–179. [Google Scholar] [CrossRef]
  17. Alipanah, M.; Li, X. Numerical studies of lithium-ion battery thermal management systems using phase change materials and metal foams. Int. J. Heat Mass Transf. 2016, 102, 1159–1168. [Google Scholar] [CrossRef]
  18. Samimi, F.; Babapoor, A.; Azizi, M.; Karimi, G. Thermal management analysis of a Li-ion battery cell using phase change material loaded with carbon fibers. Energy 2016, 96, 355–371. [Google Scholar] [CrossRef]
  19. Ling, Z.; Wang, F.; Fang, X.; Gao, X.; Zhang, Z. A hybrid thermal management system for lithium ion batteries combining phase change materials with forced-air cooling. Appl. Energy 2015, 148, 403–409. [Google Scholar] [CrossRef] [Green Version]
  20. Lebrouhi, B.E.; Lamrani, B.; Ouassaid, M.; Abd-Lefdil, M.; Maaroufi, M.; Kousksou, T. Low-cost numerical lumped modelling of lithium-ion battery pack with phase change material and liquid cooling thermal management system. J. Energy Storage 2022, 54, 105293. [Google Scholar] [CrossRef]
  21. Song, L.; Zhang, H.; Yang, C. Thermal analysis of conjugated cooling configurations using phase change material and liquid cooling techniques for a battery module. Int. J. Heat Mass Transf. 2019, 133, 827–841. [Google Scholar] [CrossRef]
  22. Akbarzadeh, M.; Kalogiannis, T.; Jin, L.; Karimi, D.; Van Mierlo, J.; Berecibar, M. Experimental and numerical thermal analysis of a lithium-ion battery module based on a novel liquid cooling plate embedded with phase change material. J. Energy Storage 2022, 50, 104673. [Google Scholar] [CrossRef]
  23. Liu, Z.; Cao, M.; Zhang, Y.; Li, J.; Jiang, G.; Shi, H. Thermal management of cylindrical battery pack based on a combination of silica gel composite phase change material and copper tube liquid cooling. J. Energy Storage 2023, 71, 108205. [Google Scholar] [CrossRef]
  24. Senlin, C.; Mingshan, W.; Panpan, S.; Hongge, W. Cooling performance simulation of the power battery pack based on straight liquid cooling plate. J. Automot. Saf. Energy 2021, 12, 380. [Google Scholar]
  25. Wang, Y.; Dan, D.; Zhang, Y.; Qian, Y.; Panchal, S.; Fowler, M.; Li, W.; Tran, M.K.; Xie, Y. A novel heat dissipation structure based on flat heat pipe for battery thermal management system. Int. J. Energy Res. 2022, 46, 15961–15980. [Google Scholar] [CrossRef]
  26. Wu, W.; Wu, W.; Wang, S. Thermal optimization of composite PCM based large-format lithium-ion battery modules under extreme operating conditions. Energy Convers. Manag. 2017, 153, 22–33. [Google Scholar] [CrossRef]
  27. Xia, L.; Zhang, P.; Wang, R. Preparation and thermal characterization of expanded graphite/paraffin composite phase change material. Carbon 2010, 48, 2538–2548. [Google Scholar] [CrossRef]
  28. Li, W.; Xie, Y.; Zhang, Y.; Lee, K.; Liu, J.; Mou, L.; Chen, B.; Li, Y. A dynamic electro-thermal coupled model for temperature prediction of a prismatic battery considering multiple variables. Int. J. Energy Res. 2021, 45, 4239–4264. [Google Scholar] [CrossRef]
  29. Xie, Y.; Guo, H.; Li, W.; Zhang, Y.; Chen, B.; Zhang, K. Improving battery thermal behavior and consistency by optimizing structure and working parameter. Appl. Therm. Eng. 2021, 196, 117281. [Google Scholar] [CrossRef]
  30. Bernardi, D.; Pawlikowski, E.; Newman, J. A General Energy Balance for Battery Systems. J. Electrochem. Soc. 1985, 132, 5. [Google Scholar] [CrossRef] [Green Version]
  31. Thomas, K.E.; Newman, J. Thermal modeling of porous insertion electrodes. J. Electrochem. Soc. 2003, 150, A176. [Google Scholar] [CrossRef]
  32. Liu, Y.; Zheng, R.; Li, J. High latent heat phase change materials (PCMs) with low melting temperature for thermal management and storage of electronic devices and power batteries: Critical review. Renew. Sustain. Energy Rev. 2022, 168, 112783. [Google Scholar] [CrossRef]
  33. Ogoh, W.; Groulx, D. Effects of the heat transfer fluid velocity on the storage characteristics of a cylindrical latent heat energy storage system: A numerical study. Heat Mass Transf. 2012, 48, 439–449. [Google Scholar] [CrossRef]
  34. Voller, V.R.; Prakash, C. A fixed grid numerical modelling methodology for convection-diffusion mushy region phase-change problems. Int. J. Heat Mass Transf. 1987, 30, 1709–1719. [Google Scholar] [CrossRef]
  35. Jones, B.J.; Sun, D.; Krishnan, S.; Garimella, S.V. Experimental and numerical study of melting in a cylinder. Int. J. Heat Mass Transf. 2006, 49, 2724–2738. [Google Scholar] [CrossRef]
  36. Panchal, S.; Khasow, R.; Dincer, I.; Agelin-Chaab, M.; Fraser, R.; Fowler, M. Thermal design and simulation of mini-channel cold plate for water cooled large sized prismatic lithium-ion battery. Appl. Therm. Eng. 2017, 122, 80–90. [Google Scholar] [CrossRef]
  37. Xia, B.; Liu, Y.; Huang, R.; Yang, Y.; Lai, Y.; Zheng, W.; Wang, H.; Wang, W.; Wang, M. Thermal analysis and improvements of the power battery pack with liquid cooling for electric vehicles. Energies 2019, 12, 3045. [Google Scholar] [CrossRef] [Green Version]
  38. Zhu, C.; Li, X.; Song, L.; Xiang, L. Development of a theoretically based thermal model for lithium ion battery pack. J. Power Sources 2013, 223, 155–164. [Google Scholar] [CrossRef]
  39. Zhao, J.; Rao, Z.; Huo, Y.; Liu, X.; Li, Y. Thermal management of cylindrical power battery module for extending the life of new energy electric vehicles. Appl. Therm. Eng. 2015, 85, 33–43. [Google Scholar] [CrossRef]
Figure 1. The overall structure of the BTM system.
Energies 16 05815 g001
Figure 2. LCP structure and flow state judgment.
Energies 16 05815 g002
Figure 3. Mesh independence verification for the BTM system.
Energies 16 05815 g003
Figure 4. Mesh view of the BTM system; (a) Sectional view, (b) Local view.
Energies 16 05815 g004
Figure 5. The maximum temperature and temperature difference of the battery pack under an ambient temperature of 30 °C. (a) Maximum temperature; (b) maximum temperature difference.
Energies 16 05815 g005
Figure 6. The maximum temperature and temperature difference of the battery pack under an ambient temperature of 40 °C. (a) Maximum temperature; (b) maximum temperature difference.
Energies 16 05815 g006
Figure 7. The maximum temperature and temperature difference of the battery pack under various mass fractions of EG in PCM. (a) Maximum temperature; (b) maximum temperature difference.
Energies 16 05815 g007
Figure 8. The average temperature and liquid fraction of PCM under various mass fractions of EG.
Energies 16 05815 g008
Figure 9. The maximum temperature of the battery pack under different mass flow rates and flow temperature of the coolant. (a) Flow temperature of 25 °C; (b) flow temperature of 20 °C; (c) flow temperature of 15 °C; (d) flow temperature of 10 °C.
Energies 16 05815 g009aEnergies 16 05815 g009b
Figure 10. The maximum temperature difference of the battery pack under various inlet flow temperatures and mass flow rates of coolant.
Energies 16 05815 g010
Figure 11. The temperature contours for the battery pack during continuous discharge at 2C using PCM and LC. (a) Discharge for 300 s; (b) discharge for 600 s; (c) discharge for 1200 s; (d) discharge for 1800 s (fully discharged).
Energies 16 05815 g011
Table 3. The maximum temperature of the battery pack after finishing 2C discharge compared to the ambient temperature of 40 °C.
Flow Temperature
(°C)
Mass Flow Rate
(kg·s−1)
0.10.150.20.25
10−3.16−4.04−4.28−4.46
15−1.20−2.70−3.36−3.71
20+1.56−0.30−1.16−1.68
25+5.26+3.18+2.19+1.55
Disclaimer/Publisher’s Note: The statements, opinions and data contained in all publications are solely those of the individual author(s) and contributor(s) and not of MDPI and/or the editor(s). MDPI and/or the editor(s) disclaim responsibility for any injury to people or property resulting from any ideas, methods, instructions or products referred to in the content.

