Article

A Multiphysics-Multiscale Model for Particle–Binder Interactions in Electrode of Lithium-Ion Batteries

1
Department of Aerospace Engineering, College of Aeronautical Engineering, National University of Science and Technology, Risalpur 24090, Pakistan
2
Department of Mechanical Engineering, International Islamic University (IIUI), Islamabad 44000, Pakistan
3
Department of Mechatronics Engineering, Air University, Islamabad 44000, Pakistan
4
Department of Mechanical, Robotics and Energy Engineering Dongguk University, Seoul 04620, Republic of Korea
*
Authors to whom correspondence should be addressed.
Energies 2023, 16(15), 5823; https://doi.org/10.3390/en16155823
Submission received: 12 July 2023 / Revised: 28 July 2023 / Accepted: 3 August 2023 / Published: 5 August 2023

Abstract

:
Understanding the electrochemical and mechanical degradations inside the electrodes of lithium-ion battery is crucial for the design of robust electrodes. A typical lithium-ion battery electrode consists of active particles enclosed with conductive binder and an electrolyte. During the charging and discharging process, these adjacent materials create a mechanical confinement which suppresses the expansion and contraction of the particles and affects overall performance. The electrochemical and mechanical response mutually affect each other. The particle level expansion/contraction alters the electrochemical response at the electrode level. In return, the electrode level kinetics affect the stress at the particle level. In this paper, we developed a multiphysics–multiscale model to analyze the electrochemical and mechanical responses at both the particle and cell level. The 1D Li-ion battery model is fully coupled with 2D representative volume element (RVE) model, where the particles are covered in binder layers and bridged through the binder. The simulation results show that when the binder constraint is incorporated, the particles achieve a lower surface state of charge during charging. Further, the cell charging time increases by 7.4% and the discharge capacity reduces by 1.4% for 1 C-rate charge/discharge. In addition, mechanical interaction creates inhomogeneous stress inside the particle, which results in particle fracture and particle–binder debonding. The developed model will provide insights into the mechanisms of battery degradation for improving the performance of Li-ion batteries.

1. Introduction

Electrochemical and mechanical degradation inside the lithium-ion (Li-ion) battery electrodes is a major bottleneck in the design of robust electrodes [1,2]. During the charging and discharging process, the expansion and contraction of the particles results in concentration-gradient induced stress inside the particles. In addition, the mechanical deformation of the active particles is constrained by the binders and adjacent particles [3,4]. These surrounding confinements create additional stress inside the active particles [5], cause stress heterogeneity [6,7,8], and affect the discharge capacity [9,10,11].
Various researchers have investigated the effect of mechanical confinements on the degradation of the electrode [12,13]. Using single particle model, Takahashi et al. concluded that during lithiation/delithiation, the binder layer surrounding the electrode particle causes a stress shift towards compressive stress [14]. Baboo et al. developed an integrated framework of experiments and simulations to explore the effect of three different binders on the electrochemical performance of LiFePO4 battery [15]. Singh et al. analytically calculated the concentration gradient-induced stress in the electrode particles encapsulated in a thin layer of binder [16]. In addition, some research is focused on multiparticle models with typical or real particle networks [17,18,19]. For instance, Foster et al. examined the stress in an NMC particle of various morphologies covered in a binder layer [20]. Using a multiparticle model, Rahani et al. evaluated the stress generation in particles covered in a layer of binder [21]. Wu et al. investigated the stress development in composite electrodes by considering realistically shaped particles enclosed in PVDF binder [22]. Moreover, the interaction of the surrounding particles and the binder layer also resulted in inhomogeneous stress distribution inside the electrode particles [23,24,25]. For example, Liu et al. concluded that the P/P and P/B interaction leads to significant stress heterogeneity inside the particles [26]. Wang et al. [27] and Gao et al. [28] investigated the stress occurred at the P/B interface of two connected silicon particles during charging and discharging. Recently research has also been focused on the development of composite electrodes for supercapacitors [29], lithium–selenium batteries [30], zinc-ion [31], zinc–air [32] and ammonium-ion batteries [33].
The constraint-induced stresses from the binder and surrounding particles also affects the capacity and electrical response of the cell [34,35,36]. For instance, the compressive stress developed on particle surface results in stress-induced voltage decay [37]. Lu et al. explored the effect of stress on the kinetics of surface charge transfer and concluded that the hydrostatic stress affects the cell voltage [38]. The coupling between stress and voltage is also used in the development of mechanical sensors. For instance, Cannarella et al. applied mechanical stress to lithium-ion pouch cell to measure the voltage change [39]. Several numerical models are proposed to determine the stress developed at the particles and electrode levels [40,41,42,43]. These models mainly consist of diffusion-based models and mechanical models. The diffusion-based model is driven by a concentration gradient and with proper coupling, the mechanical model is integrated into the diffusion-based model [44,45,46]. In this regard, the Newman’s pseudo-two-dimensional (P2D) model is integrated with the mechanical model to investigate the multiphysics–multiscale behavior at the particle and electrode levels [47,48,49]. However, most of these models focus on isolated single particles. This idealized assumption cannot represent the complex situation imposed upon an active particle inside an electrode because the surrounding constraint affects the electrochemical–mechanical behavior of the particle.
Some efforts have been made to describe the coupling effect between the contact stress of two interacting particles and lithium diffusion [50,51]. In addition, the multiscale nature of the battery requires to comprehend the two-way coupling between the particle level and overall cell level [52,53,54,55]. Recently, Liu et al. [56] and Gao et al. [47] developed the multiphysics–multiscale models for silicon–carbon composite particles. However, the active particles are considered to be isolated with no surrounding mechanical constraint. The binder confinement and P/B interaction brings in extra stress, which affects the chemical potential and stress at microscale and alters the electrochemical voltage and stress at the macroscale. Therefore, a simultaneous multiphysics–multiscale model that incorporates the (P/P and P/B) interaction is still needed. To bridge the gap, we developed a fully coupled multiphysics–chemomechanical model to understand the effect of P/P and P/B interaction on the performance of the Li-ion battery during whole charge–discharge cycle. The 1D electrochemical model (Model 1) is fully coupled with the 2D representative volume element model (Model 2). Electrochemistry and mechanics are fully coupled in both models. The cell charging time, cell voltage, and discharge capacity, together with mechanical behaviors, are discussed. Finally, the cell performance is evaluated for various binders and under different charging rates.

2. Multiphysics–Multiscale Computational Methodology

Figure 1 illustrates the schematics of a lithium-ion battery comprising of an anode, cathode, and a separator. The whole anode is divided into five equal parts, and each part is fully coupled with the corresponding 2D RVE in Model 2. The RVE1 and RVE5 face the current collector and separator, respectively. All the particles are covered in binder shells and bridged through a binder inside the 2D RVE. Point 1 and Point 2 refer to the center of particle and the location where the particle interacts with the other particle through the binder. Due to the symmetric distribution of particles inside Model 2, the points are highlighted on just one particle.
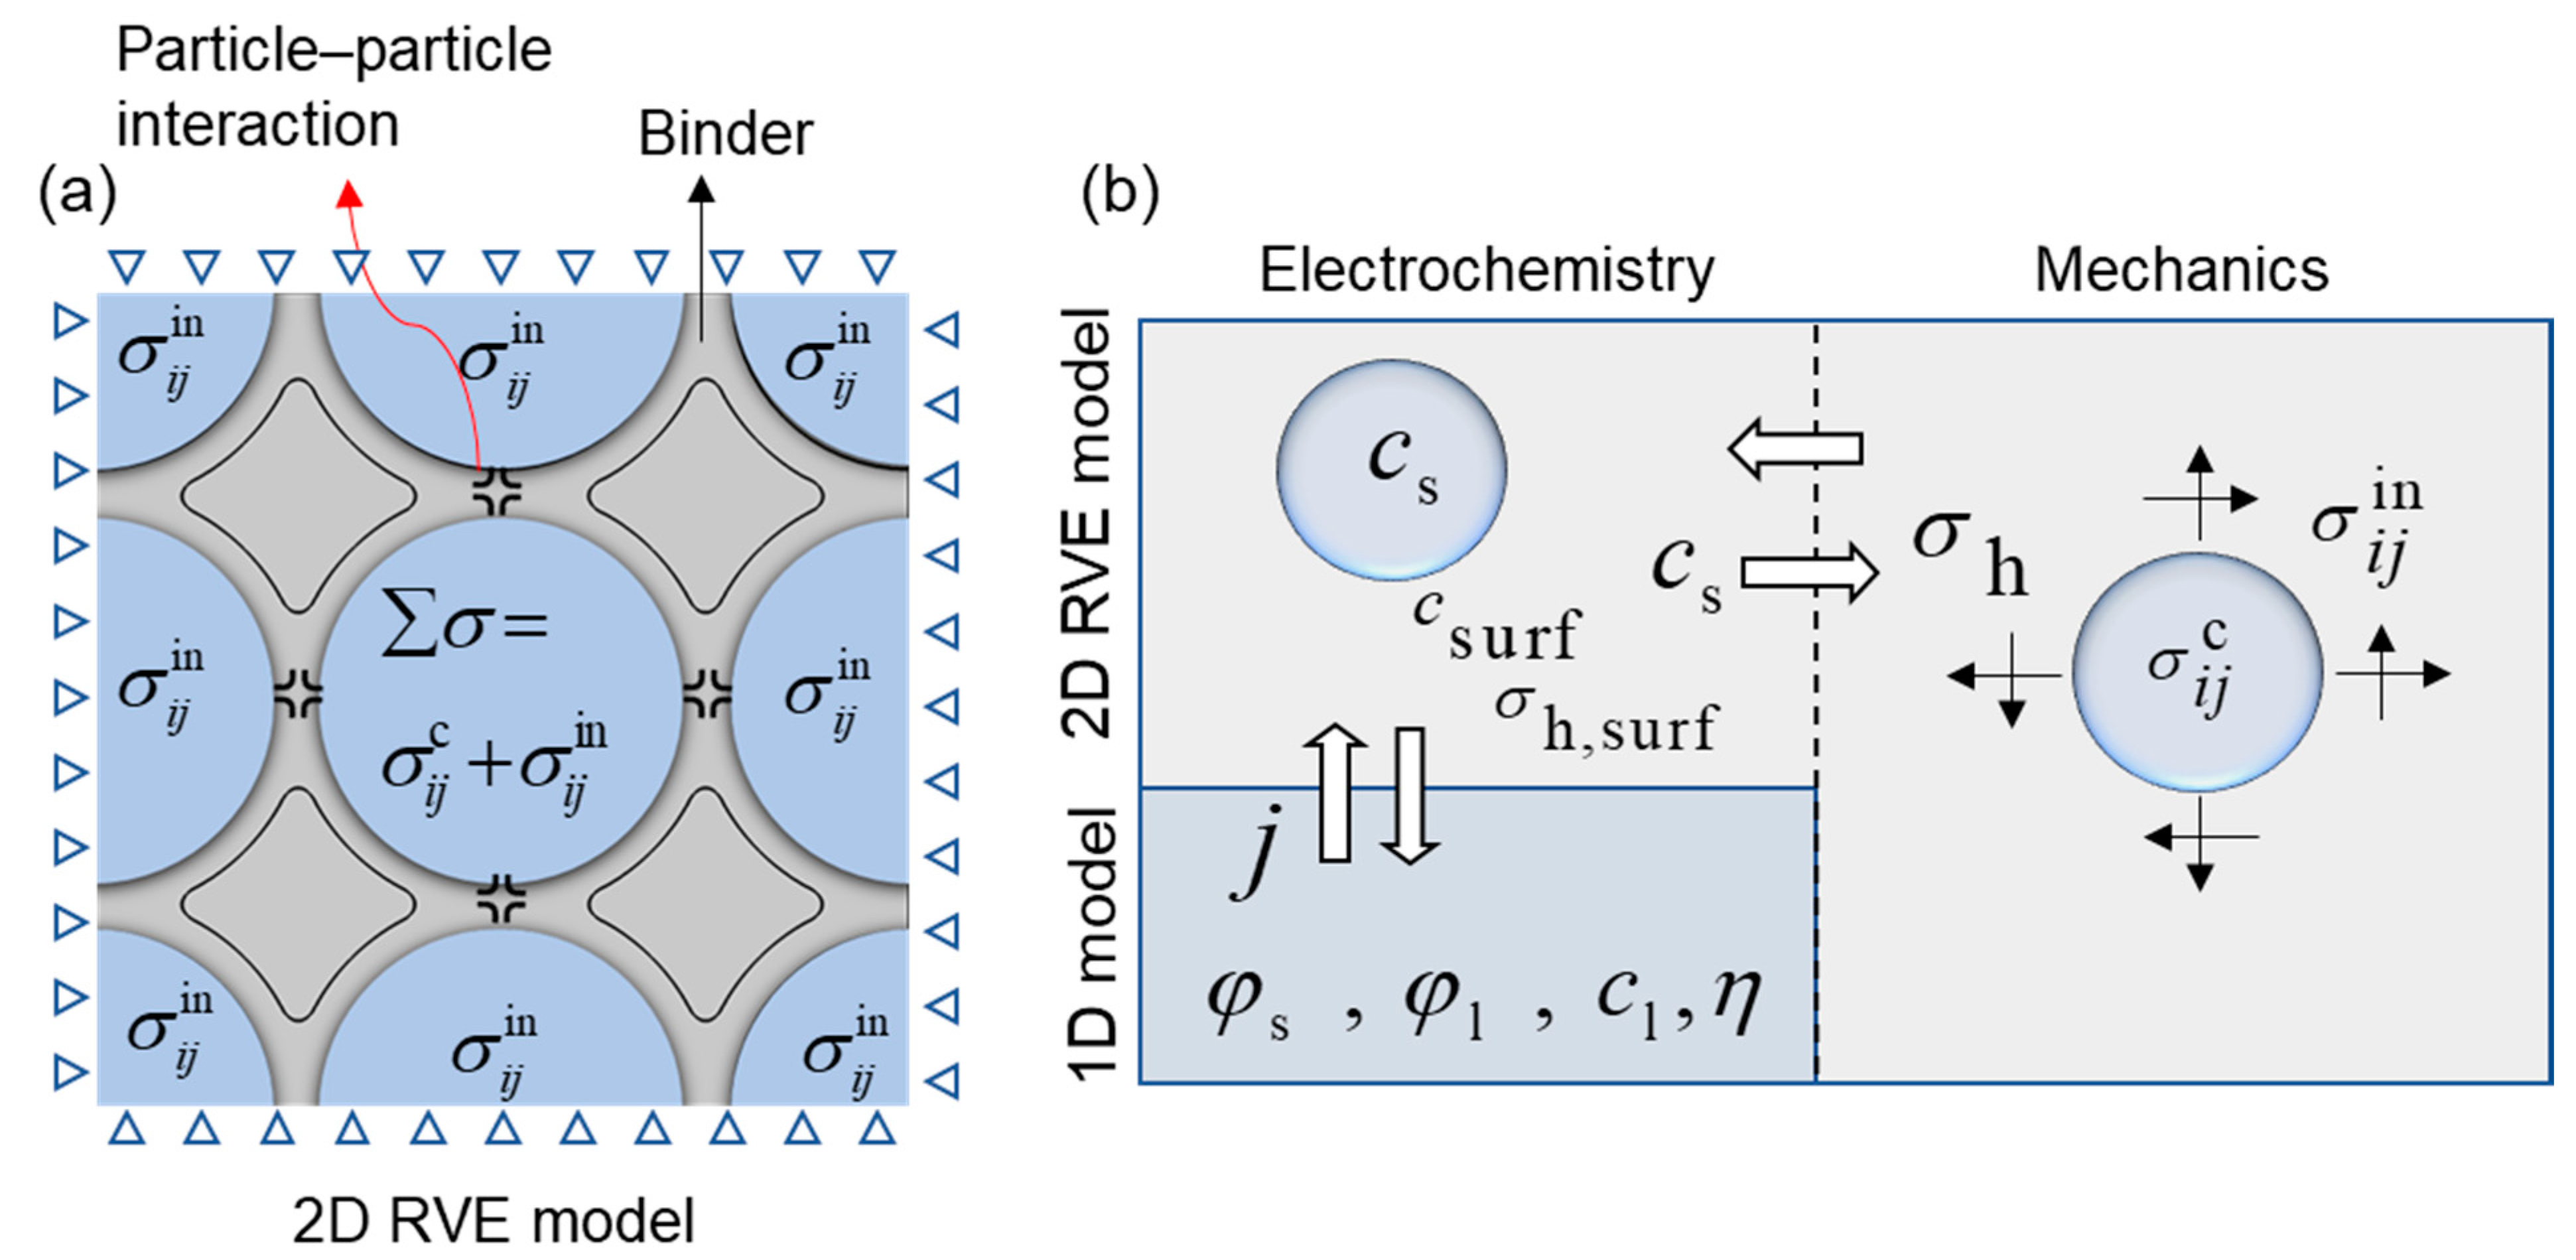
The P/P and P/B interactions offer mechanical constraints to the particle expansion and contraction. During charging/discharging, the total stress inside the particles is the superposition of the diffusion-induced stress σ i j c and the constraint-induced stress σ i j i n , stemming from P/P and P/B interactions, as depicted in Figure 2a. Figure 2b illustrates the multiphysics–multiscale coupling between Model 1 and Model 2. The electrochemical and mechanical aspects are fully coupled through c s and σ h . In the multiscale coupling, the average value of intercalation current density from Model 1 is projected on the surface of particle in Model 2 through the general projection coupling. In the reverse coupling, the intercalation current density is also a function surface lithium concentration c s u r f and surface hydrostatic stress σ h , s u r f , both obtained from respective 2D RVEs. To consider the extreme cases, the average value of c s u r f and the maximum value of σ h , s u r f is coupled back from Model 2 to Model 1.
The P/P and P/B interactions affect σ h , s u r f , which further varies σ i j c through stress–potential coupling. Similarly, σ h adjusts the diffusion of lithium, which further alters c s u r f and σ h , s u r f . The governing equation for the multiphysics–multiscale fully coupled chemomechanical model are described below.

2.1. Electrochemistry at Electrode Level

The intercalation/deintercalation current density responsible for charging/discharging can be expressed as:
i j = k F c surf , j c l , j ( c m c surf , j ) { exp ( α a η j F R T ) exp ( α c η j F R T ) }
where the subscript j = 1 to 5 represents the intercalation current density obtained from specific part of the anode in the 1D model. The overpotential η j is defined as
η j = φ s φ l , j E eq , j Ω   σ h , j F
where E eq , j is the equilibrium potential. Ω corresponds to change in volume per mol addition of lithium to the particle. Ω σ h , j F is the stress-induced overpotential. The material balance inside the electrolyte follows:
ε l   c l   t = ( D l c l ) + ( 1 t + F ) a j i j
where ε l and D l represent the electrolyte volume fraction and diffusion coefficient of lithium ions in the electrolyte. aj is the active surface area of the electrode responsible for intercalation/deintercalation. Inside the electrolyte, the lithium flux follows the following boundary conditions:
D l c l     x = 0 = 0     ,       D l c l     x = ( l n ) = D l c l       x = ( l n ) + , D l c l     x = ( l sep ) = D l c l       x = ( l sep ) + , D l c l     x = l = 0   ,
The lithium ions charge balance inside the electrolyte follows:
k l { 2 φ   l 2 R T   ( 1 t + ) F 2 ln c l } = a j   i j
Inside the electrode, the electronic charges are balanced as:
( k s φ s ) = a j   i j
where k l and k s represent the effective electrolyte and electrical conductivities. The boundary conditions for the electronic charge balance is given as:
k s φ s | x = 0 = 0   ,         k s φ s | x = l = i app

2.2. Particle Level

2.2.1. Stress-Enhanced Diffusion

Under the influence of both concentration gradient and mechanical stress, the total lithium flux on the particle surface is given by:
J j = D R T c m ( c s , j c m ) ( 1 c s , j c m ) ( F E eq 0 c m   x Li c s , j + Ω σ h , j )
σ h , j can be calculated from concentration gradient [57]. Therefore, the lithium diffusion inside the particles becomes:
J j = D R T c m ( c s , j c m ) ( 1 c s , j c m ) ( F E eq 0 c m   x Li c s , j 2 Ω 2 E 9 ( 1 ν ) c s , j )
The temporal evolution of lithium concentration is coupled with J j as:
c s , j t = J j
The boundary conditions for solving Equation (10) are:
c s | t = 0 = c 0   ,       c s | r = 0 = 0 ,         n J j | r = R p = i j F

2.2.2. Mechanics

During charging/discharging, the overall strain ε i j inside the particles is the sum of mechanical strain ε i j me and concentration gradient-induced strain ε i j d [58]:
ε i j = ε i j me + ε i j d = [ ( 1 + ν ) σ i j E ν σ k k E δ i j ] + Ω c s 3 δ i j
where ε i j and σ i j represents the strain and stress tensors, respectively, and δ i j is the Kronecker delta. The last term on the right-hand side represents the thermal analogy.

3. Numerical Solution of Stress

The governing equations are numerically solved via the COMSOL multiphysics. The lithium concentration inside the particles of the 2D RVEs is calculated using the Transport of dilute species module (tds), and the stress inside the 2D RVEs is solved using the solid mechanics module. Both the 1D electrochemical model and 2D RVEs are discretized using physics-controlled meshes. The 2D RVEs contained 221,315 elements with 997,581 degrees of freedom. To solve the model, the MUMPS solver was used with a relative tolerance of 0.0001. The simulations are carried out under plain strain conditions. For better convergence, the symmetric boundary condition is adopted on each side of the RVE. The abbreviations are shown in the Nomenclature. Table 1 shows the parameters used for simulation.

4. Results and Discussion

4.1. Electrochemical Results

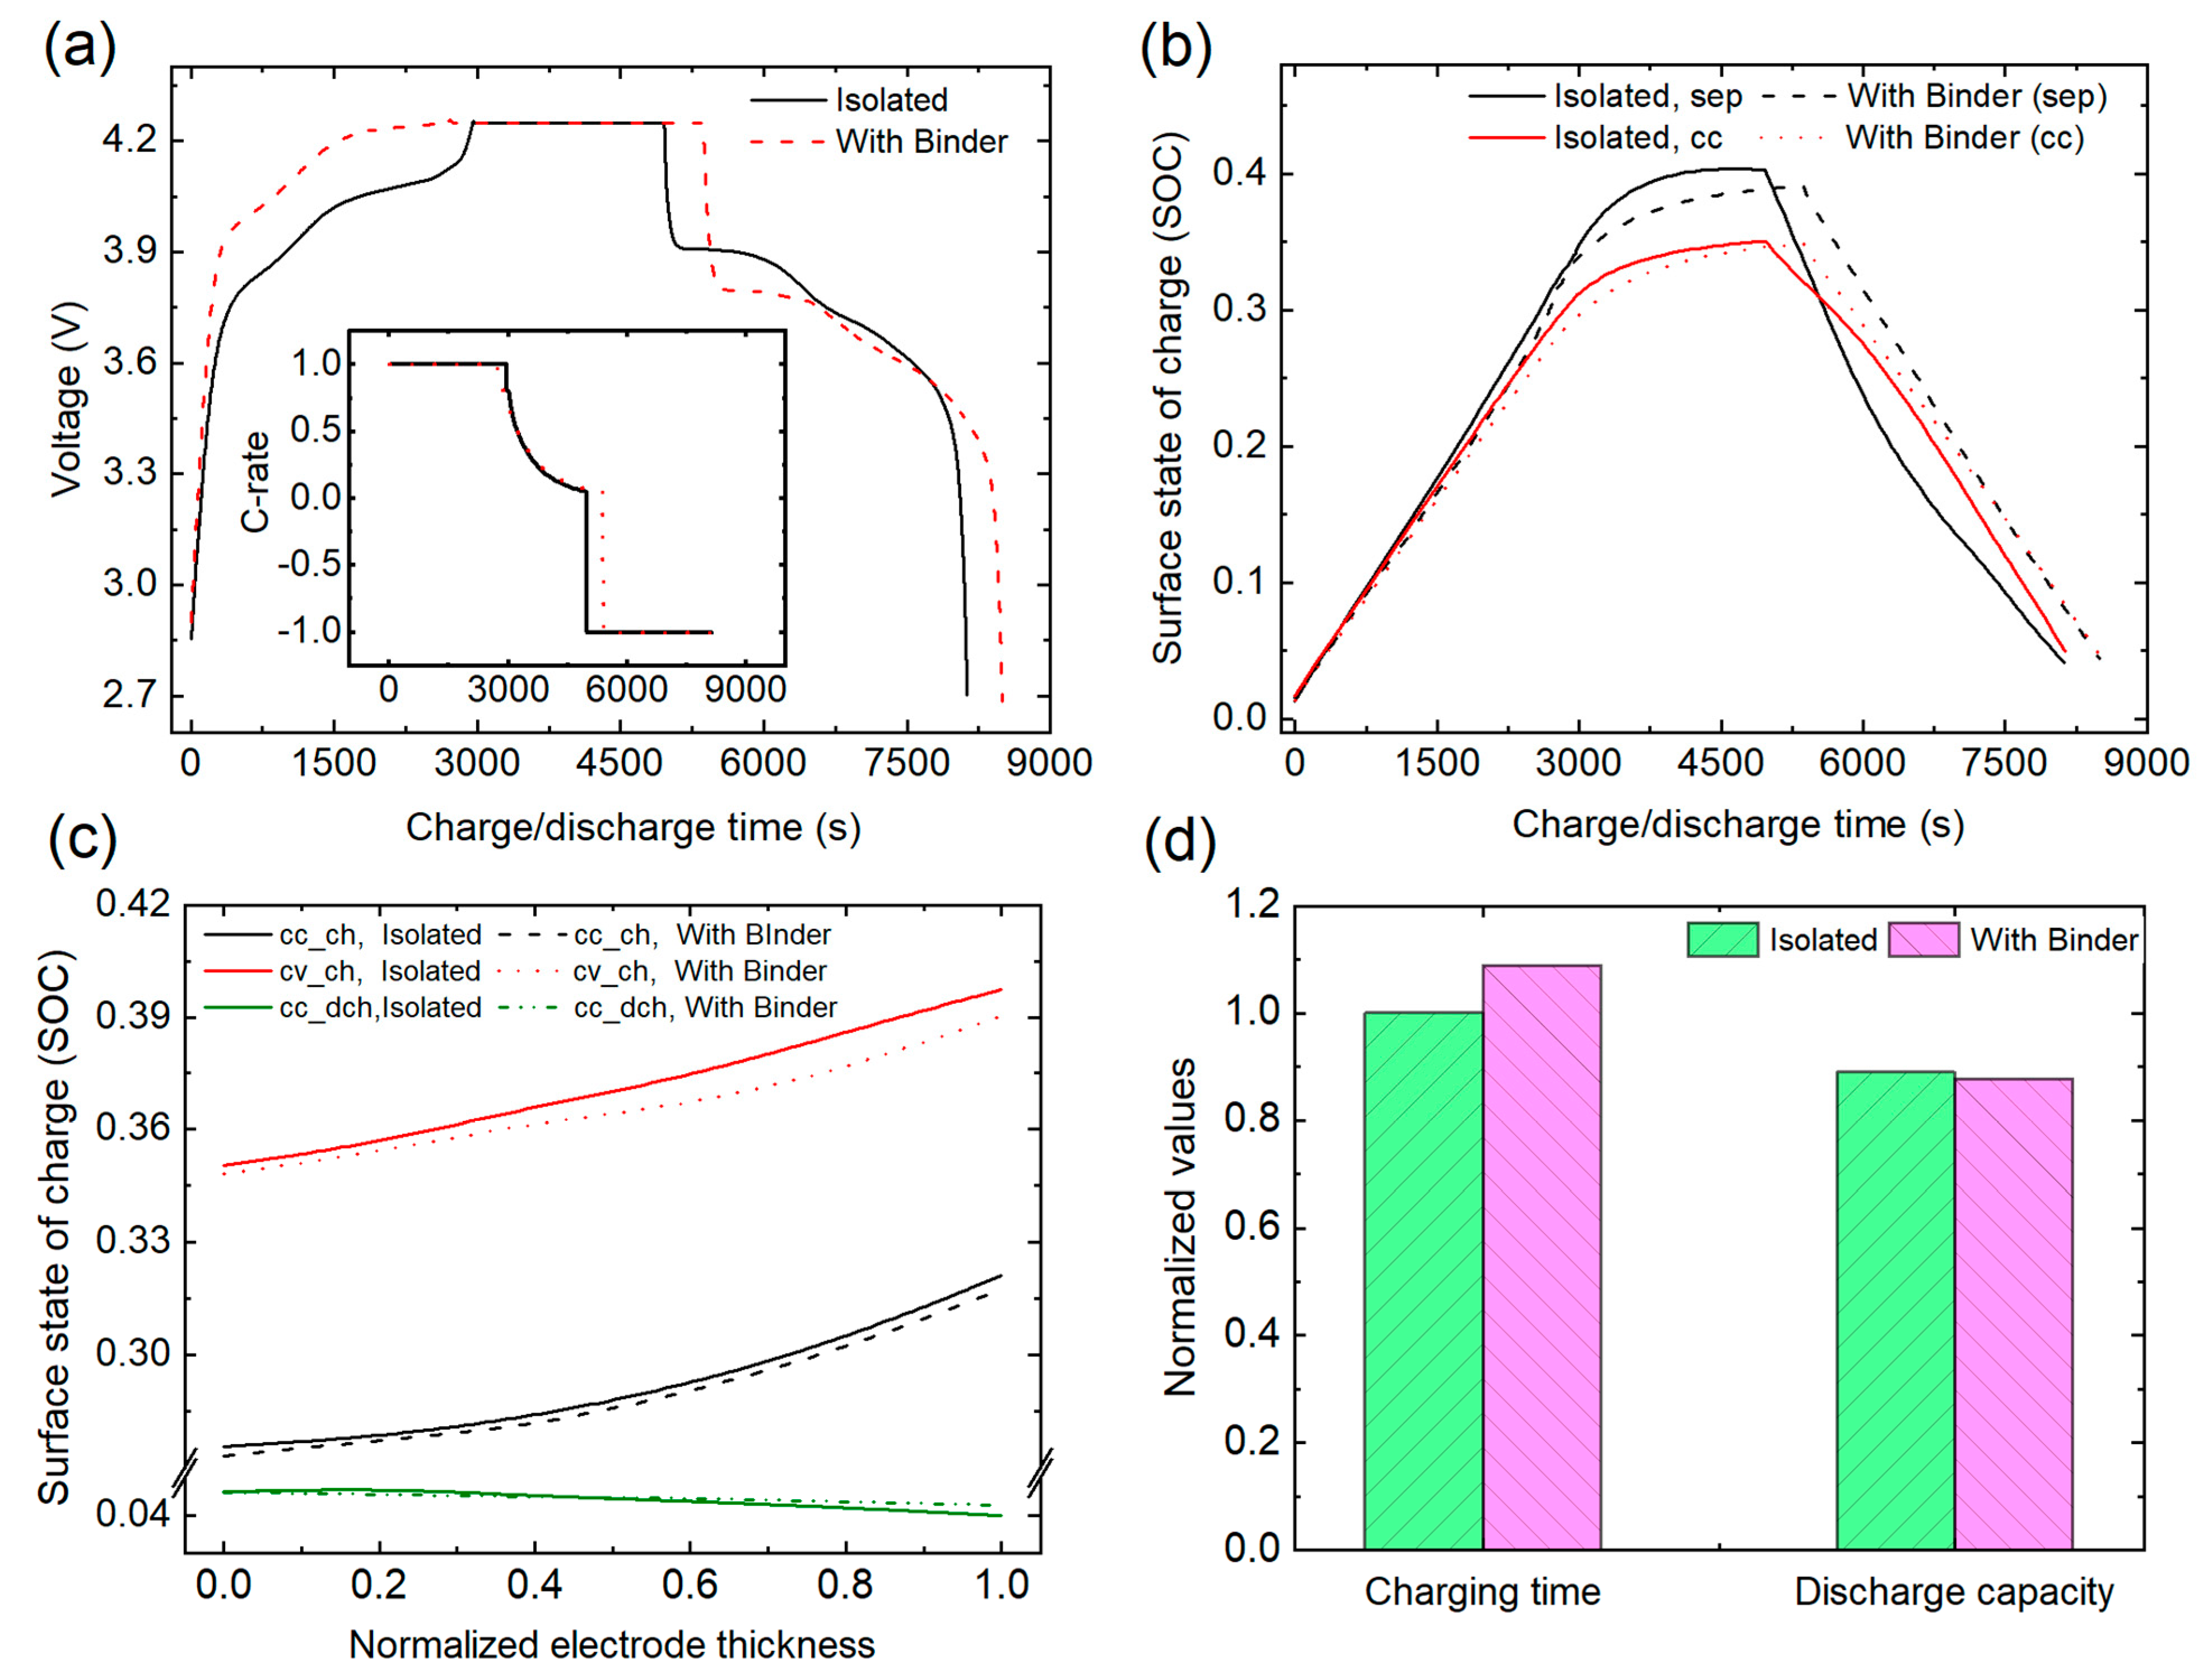
In the simulation, the cell is charged in two steps. The cell is continuously charged with 1 C-rate (cc_ch) till the voltage reaches the upper threshold of 4.25 V. The cell is further charged at constant voltage charging and stops when the current is reduced to the minimum value of 0.05 C-rate (cv_ch). The cell is then constantly discharged with 1 C-rate to minimum voltage (cc_dch). Figure 3a compares the charge–discharge voltage profile for the case of isolated particles and our developed model. It is observed that when the binder constraint is considered, the cell charging time is increased. With the binder constraint, the cc_ch time is decreased but the cv_ch period is primarily increased, leading to an increase in the total charging time. The inset in Figure 3a shows the profile of applied current. Under the binder constraint, more time is needed for the charging current to reach the cut-off value, which confirms the increase in charging time.
The increase in the charging time is because of the constraining effect from the surrounding binder layer and P/P interactions. In the case of no binder, the lithium ions migrated from the positive electrode were accommodated into the isolated particles of the anode. Under the encapsulation of binder, the mechanical constraint from the surrounding binder layer does not allow the particle volume expansion at the same rate as in the case of the isolated particle. Accordingly, the cell increased its charging time to accommodate the same lithium content.
Figure 3b depicts the temporal evolution of the surface state of charge (SOC) of an isolated particle and particle inside the 2D RVEs throughout the whole charge/discharge cycle. To exclude the location’s effect, the region near to the separator is selected for comparison. A lower surface SOC is achieved in a binder-constrained particle. Figure 3c shows the variation in the maximum surface SOC across the electrode thickness for isolated particles and the binder-constrained particles of the 2D RVEs. By the end of cv_ch, the maximum reduction in the SOC is observed near the separator. This shows that the effect of the binder is more significant near the separator region inside the electrode.
The reduction in the surface SOC is due to the coupled effect of stress-enhanced diffusion inside the particle and stress-induced overpotential. During lithiation, the developed surface compressive hydrostatic stress creates an additional flux towards the particle center. The surrounding binder constraint further enhances the surface compressive hydrostatic stress, which increases the stress-induced lithium flux into the particle. This enhanced flux draws more lithium towards the center, leading to a decrease in the surface SOC. In addition, the binder-constrained particles remained at a higher SOC by the end of discharge than the isolated particles. During discharging, the particles tend to compress, but the surrounding binder layer does not allow its compression. Therefore, some of the cyclable lithium remains inside the particles, resulting in lower discharge capacity. Thus, we conclude that the surrounding binder layer imposes three limits: (i) during lithiation, its compressive effect enhances the stress-induced lithium flux into the particle, (ii) it suppresses the rate of particle expansion during lithiation, and (iii) it does not allow the particle to shrink during delithiation. Figure 3d further illustrates that with the binder constraint, the cell charging time and discharge capacity increases and decreases by 7.4% and 1.4%, respectively.

4.2. Stress Analysis

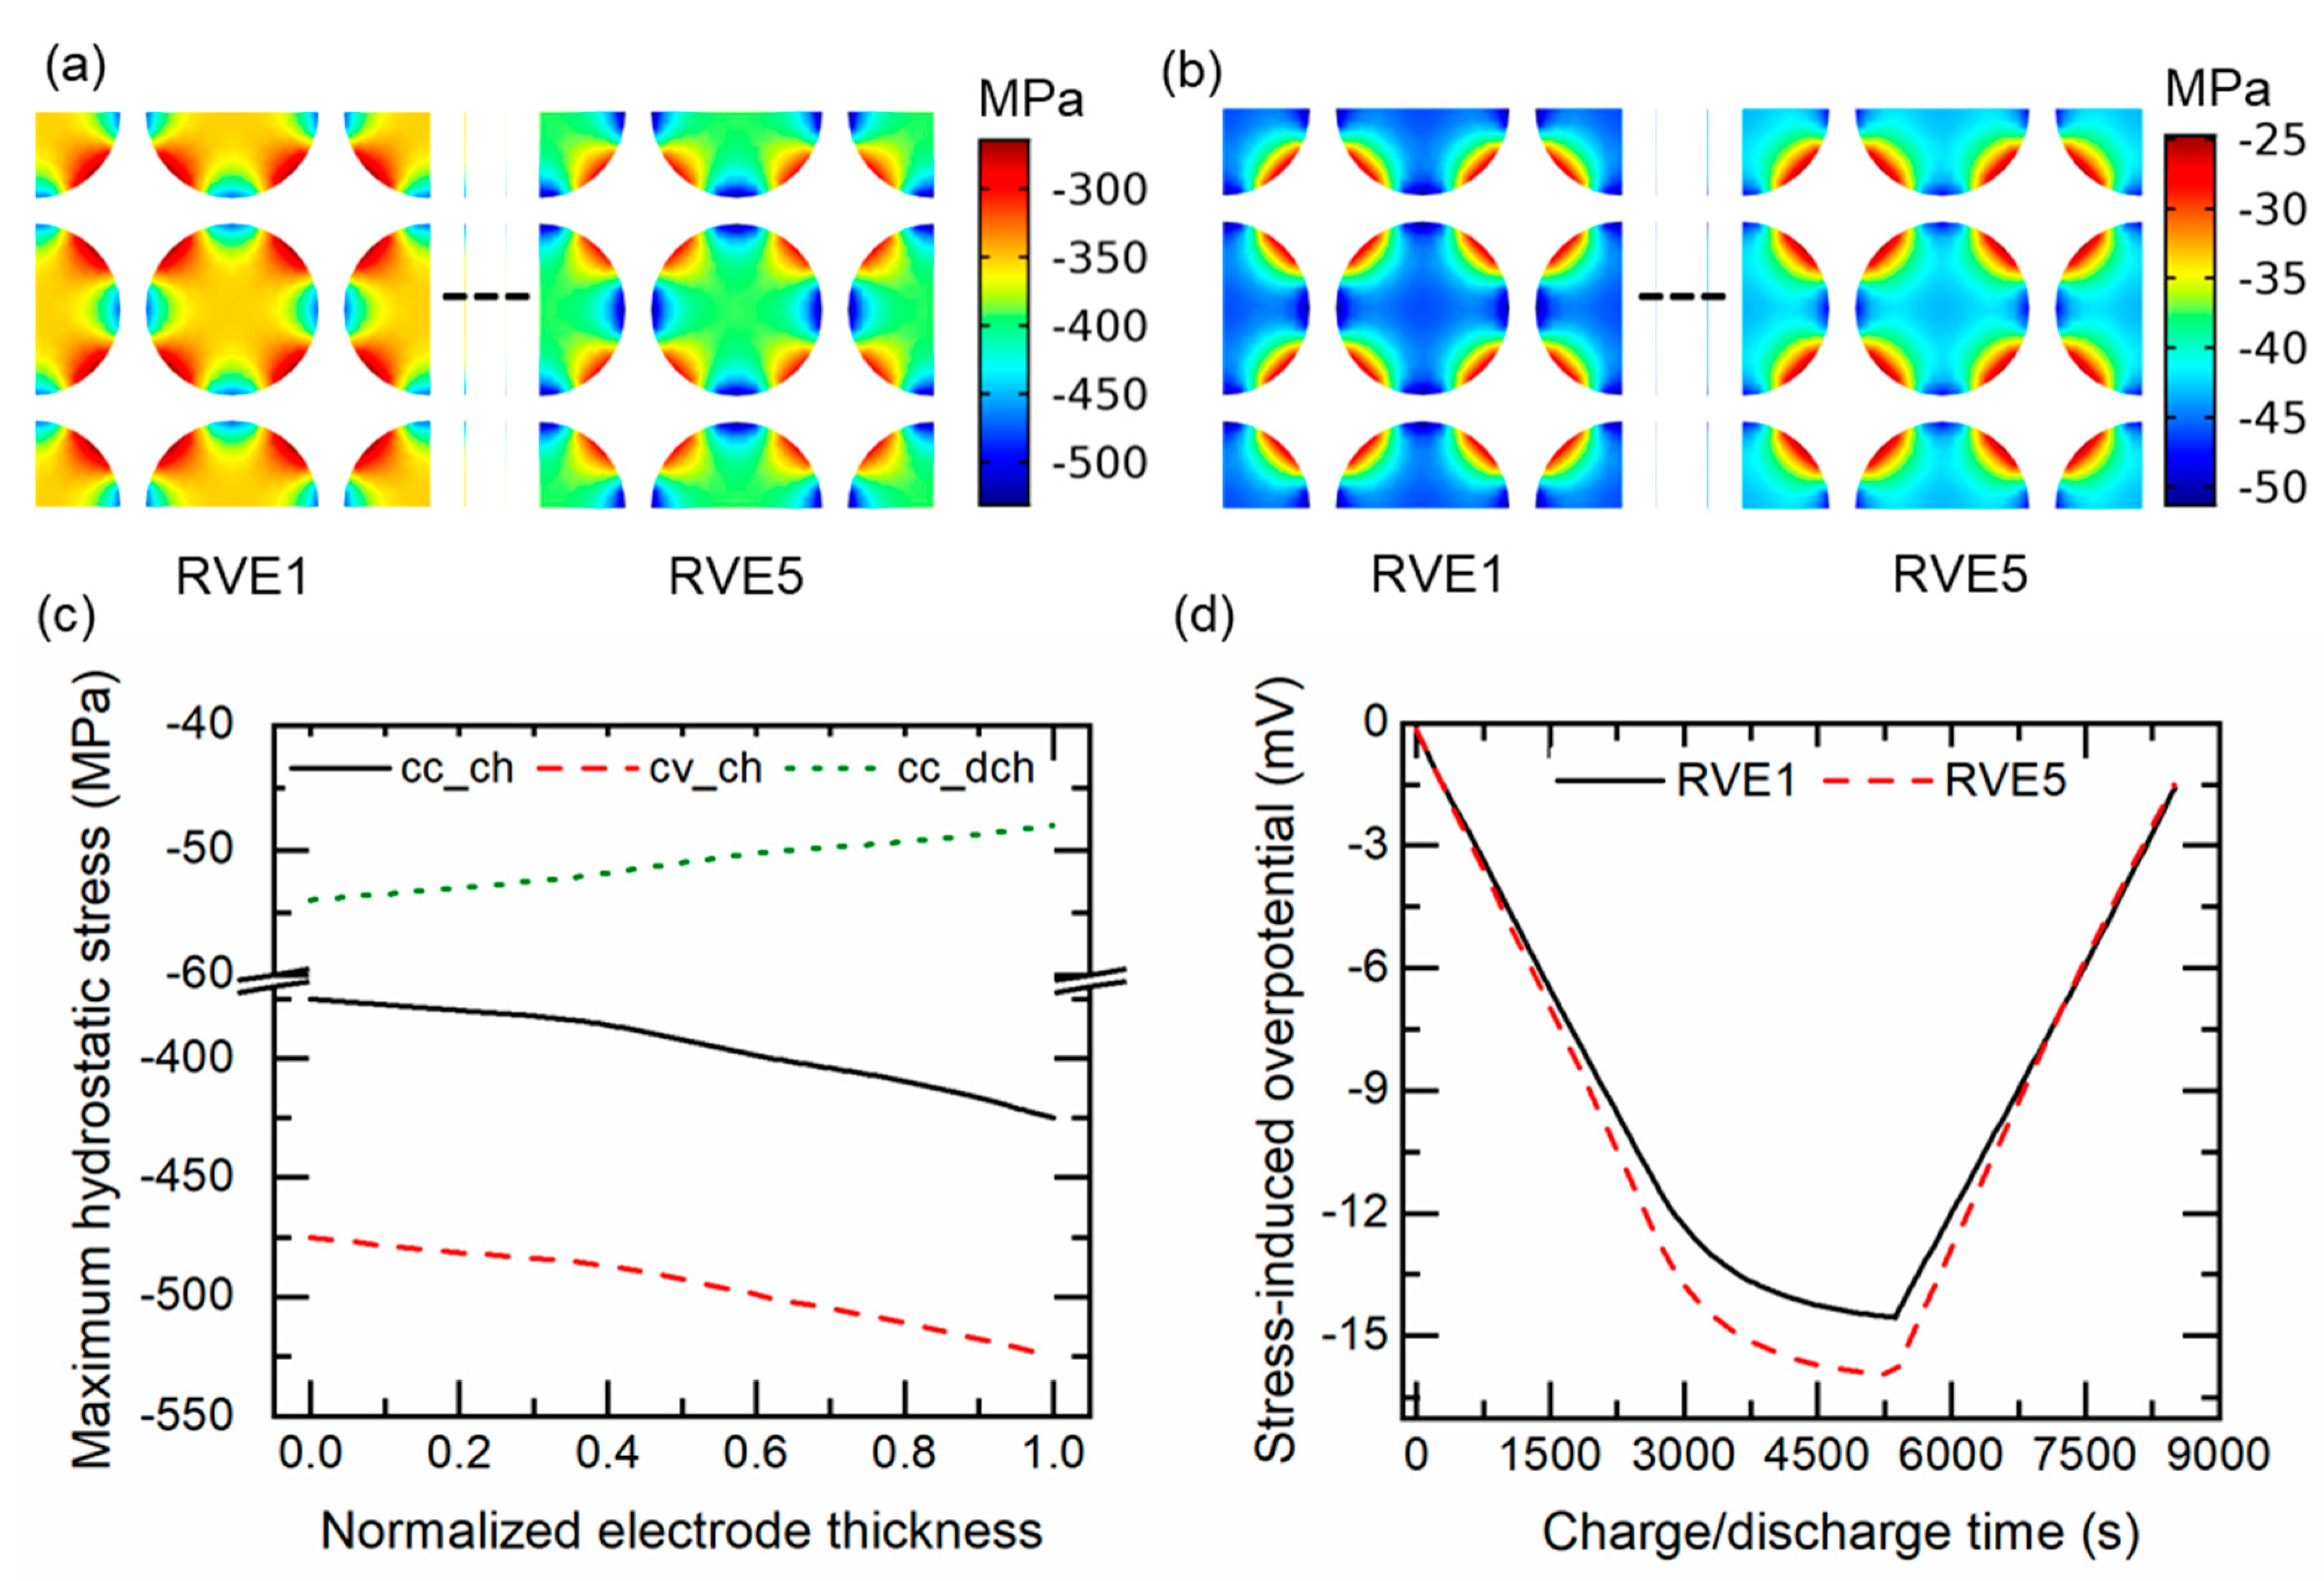
This section discusses the coupled effect of P/P and P/B interaction on the stress distribution inside the particles of 2D RVEs. Figure 4a illustrates the hydrostatic stress contour plots inside RVE1 and RVE5 at the end of cv_ch. The maximum compressive hydrostatic stress is observed at the location of P/P interaction. Moreover, higher stress values are obtained in the RVE5 than RVE1, demonstrating that the region of the electrode near the separator is more prone to stress. Figure 4b shows that by the end of discharging, the P/P interaction location inside RVE1 remained at higher stress state than RVE5.Figure 4c depicts the maximum compressive hydrostatic stress variation across the electrode thickness for the whole charge/discharge cycle. The maximum compressive hydrostatic stress varies almost linearly across the electrode and increases with charging. However, by the end of cc_dch, the compressive hydrostatic stress near the separator is reduced than that near to the current collector. The resulting stress-induced overpotential Ω σ h F for the whole charge/discharge cycle is shown in Figure 4d. During the cc_ch, the stress-induced overpotential increased almost linearly, followed by a gentle increase during cv_ch. In the subsequent cc_dch, it again decreases. These results further demonstrate that the effect of P/P and P/B interaction on the electrochemical response is more significant near the separator.
Figure 5a,b shows the temporal evolution of the von Mises stress at Point 1 and Point 2 and the maximum von Mises stress inside the particles of RVE1 and RVE5, respectively, for the whole charge/discharge cycle. At each location, the von Mises stress increases linearly during cc_ch, followed by a gentle increase during cv_ch. During the discharging process, the von Mises stress decreases until it reaches the minimum value at the end of discharge. Furthermore, the stress at Point 2 is higher than Point 1, which suggests that the particle fracture is favored at Point 2. The same trend is obtained inside the RVE5.
Figure 5c,d depicts the σ v at Point 1, Point 2, and σ v , m a x across the whole electrode at the end of cc_ch and cv_ch, respectively. During cc_ch, the σ v increased almost linearly across the electrode, with higher stress obtained near the separator. At the end of cv_ch, the σ v follows a gentle parabolic profile. Nevertheless, in the succeeding cc_dch, the σ v decreased across the electrode towards the separator, as shown in Figure 6e. Concluding the results, we state that as the lithiation proceeds, the σ v inside the particle increases until it reaches the local maximum values at the end of charging and then decreases with the discharging. At the end of cc_dch, some residual stress remains inside the particles because a certain lithium concentration gradient remains inside the particle. The increasing and decreasing behavior of σ v during charging and discharging, respectively, is also explained by other researchers and is termed the mechanical breathing of the electrode particles [62,63].

4.2.1. Effect of Binder Modulus

To study the effect of binder modulus on stress heterogeneity inside the particles and chemomechanical response of the cell, two binder moduli were considered. Figure 6a depicts the maximum compressive hydrostatic stress variation across the electrode thickness at the end of cc_ch, cv_ch, and cc_dch, respectively, in the case of soft binder. The results almost followed the same trend, as shown in Figure 4c, in the case of the hard binder; however, lower compressive stress values are obtained. The corresponding stress-induced overpotential is also lower, as shown in Figure 6b. However, minimal difference is observed on the surface SOC and cell charging time. Figure 6c compares the temporal evolution of surface SOC for the soft and hard binder. The zoomed view of the maximum surface SOC and charging time shows little variation for both binders.
Figure 6d shows the σ v across the electrode thickness at the end of cc_ch. Across the electrode thickness, the stress almost followed a parabolic increase towards the separator. The stress gradient between Point 1 and Point 2 is lower compared to that shown in Figure 5e, which confirms that the stress heterogeneity inside the particle is reduced for the case of soft binder. Figure 6e illustrates the σ v across the electrode thickness for the end of cv_ch. The σ v at Point 1 is higher than Point 2, in contrast to that in Figure 5d. Figure 6f shows the σ v across the electrode thickness at the end of cc_dch. Like the hard binder, the stress decreased across the electrode thickness towards the separator; however, a lower residual stress remained inside the particles than seen in Figure 5e.

4.2.2. Effect of Charging Rates

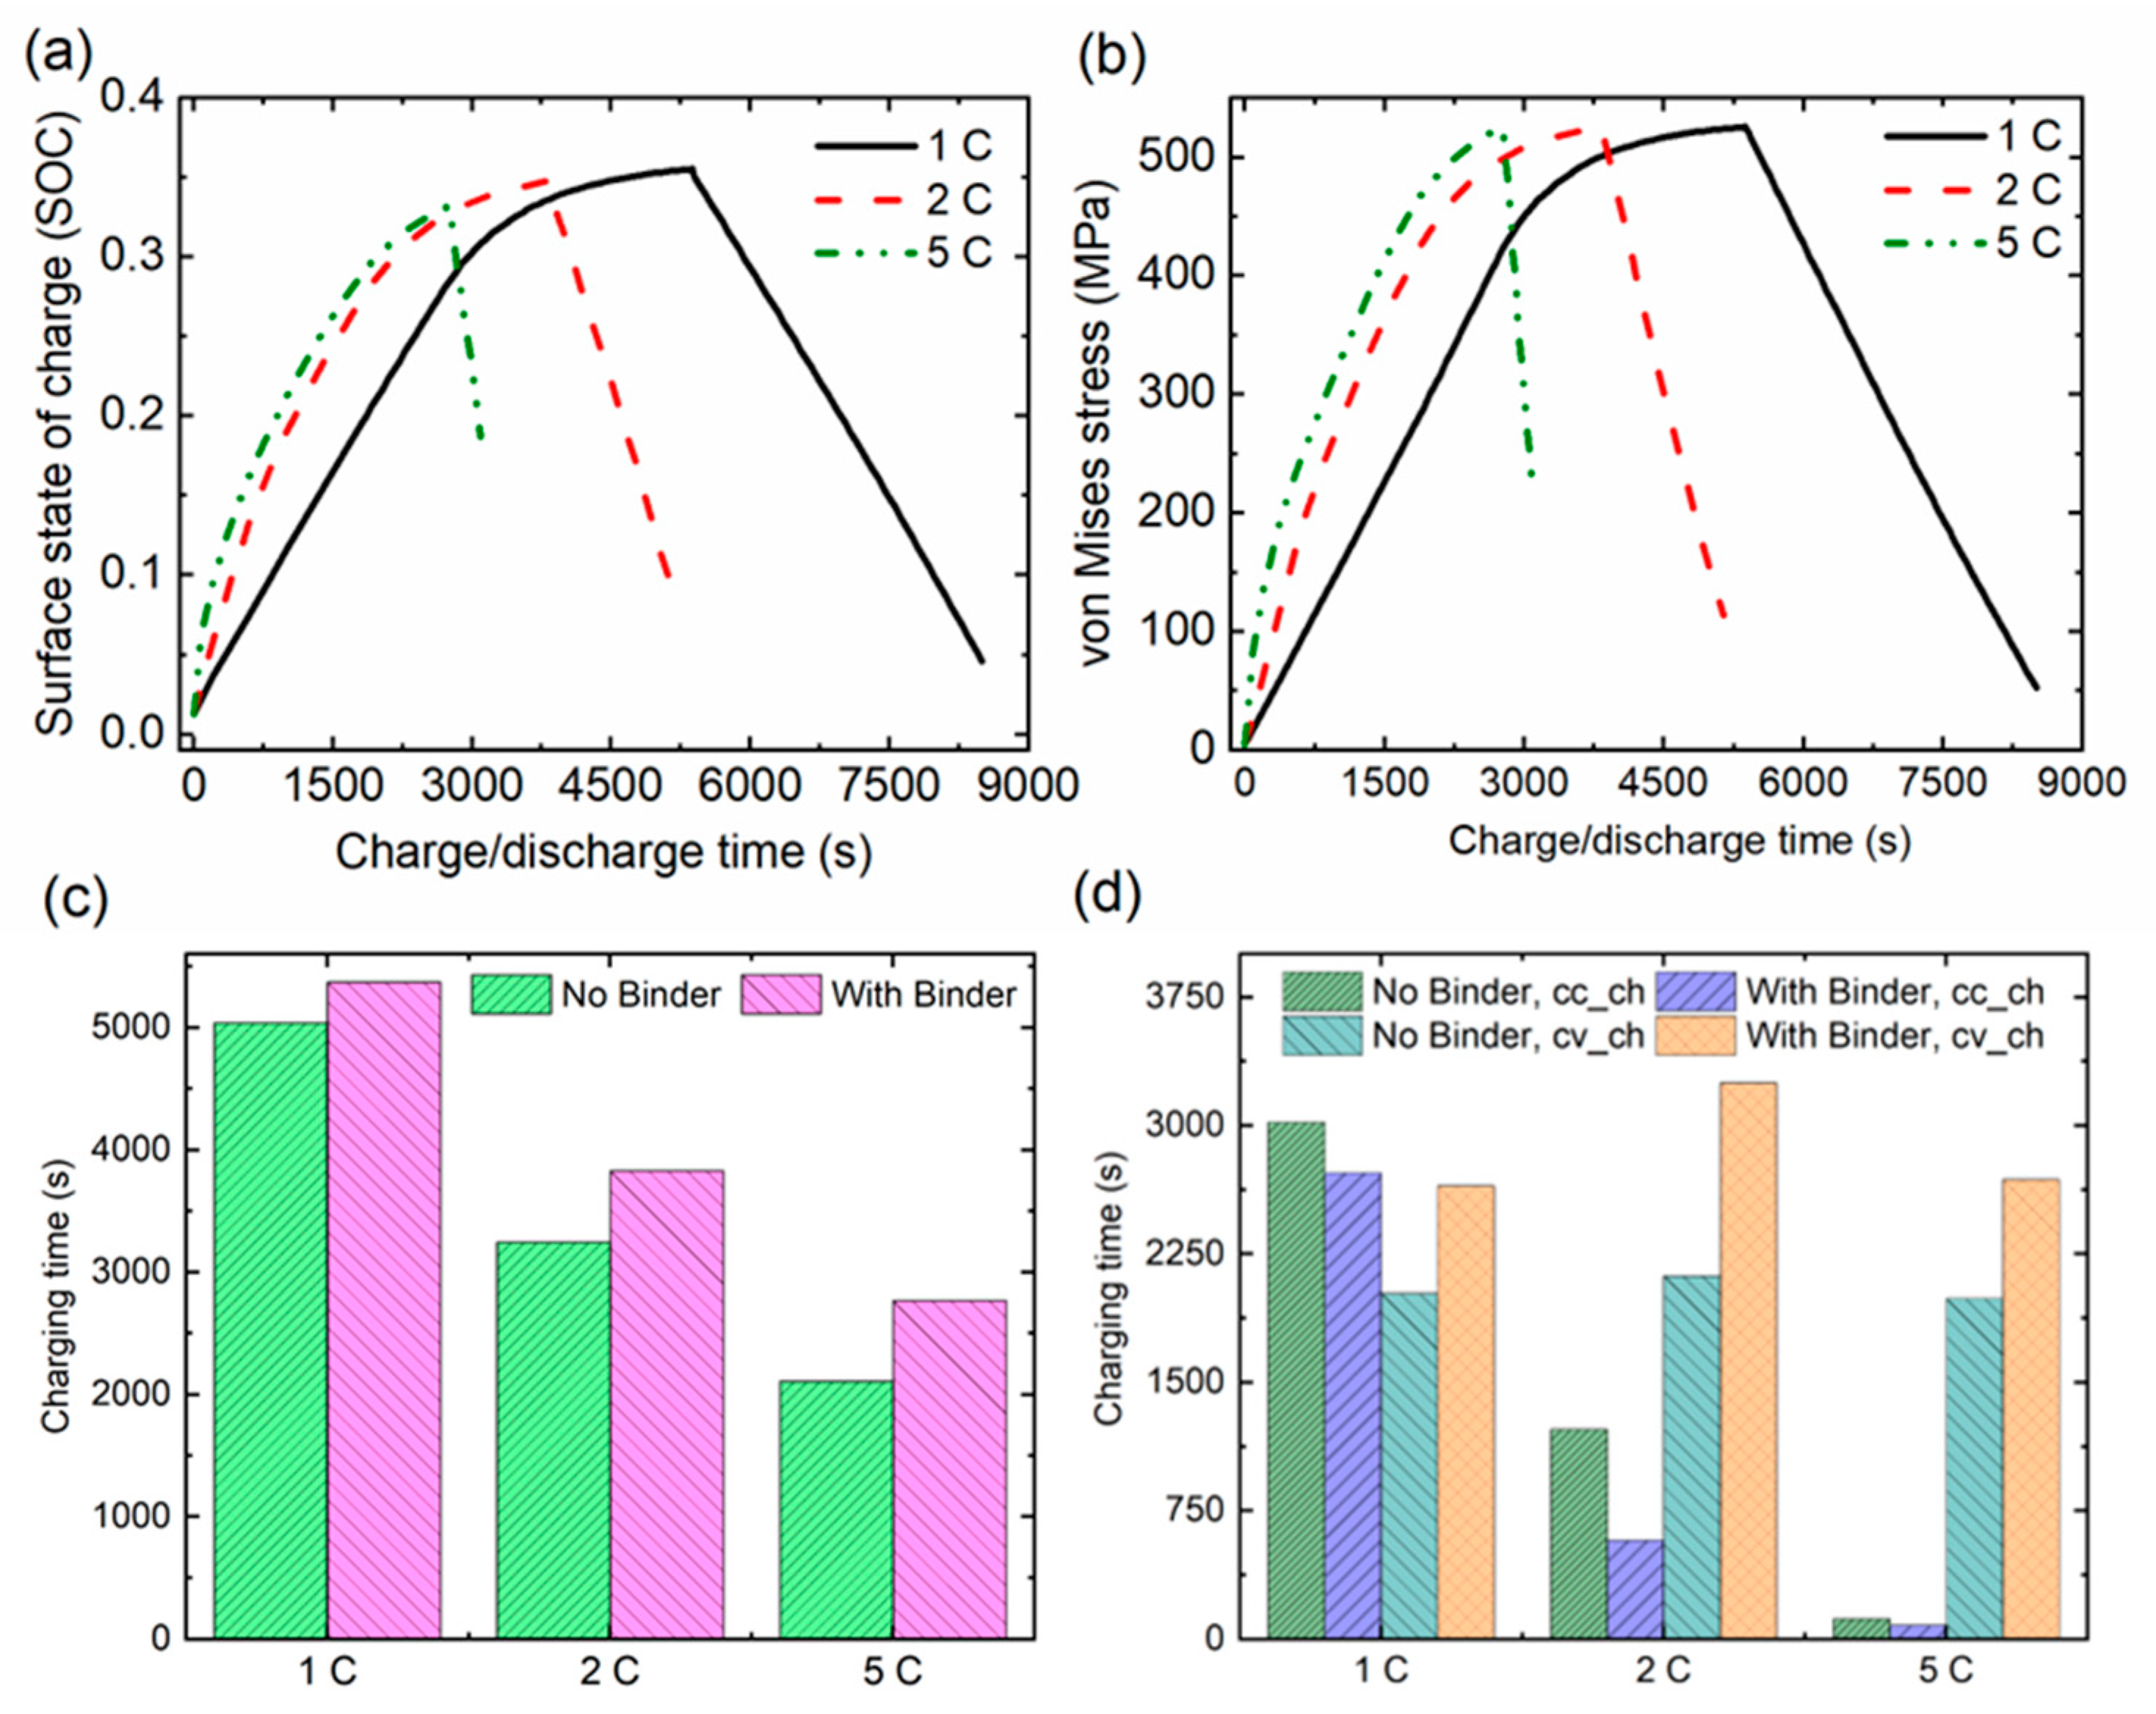
To assess the impact of different C-rates, the model was simulated at 1 C, 2 C, and 5 C. A common cut-off current of 0.05 C was applied at the end of the cv_ch for all cases. Figure 7a shows the evolution of surface SOC inside RVE5 for all C-rates. As the C-rate was increased, lower surface SOC was achieved at the end of charging. Figure 7b shows the evolution of σ v , m a x for all C-rates. Likewise, the surface SOC, the σ v , m a x also occurred at the end of charging.
The surface SOC and σ v follow a steep increasing behavior as the C-rate is increased. This is because increasing the C-rate increases the flux of lithium ions to the particle. Because of the diffusion constraints, the intercalated lithium starts to accumulate in the near to surface region, causing large concentration gradients inside the particle. The simulation results are in close comparison with the results presented in [13].
Figure 7c discusses the effect of C-rate on the charging time of isolated and binder-constrained particles. The charging time increases with the C-rate. Figure 7d shows the effect of binder constraint on both cc_ch and cv_ch intervals as a function of C-rates. As the C-rate increases, the cc_ch duration becomes shorter but the cv_ch duration becomes larger, leading to a rise in the total charging time. For instance, the surface SOC of the positive electrode particles reaches the minimum value at the end of cc_ch. However, there is still a considerable amount of lithium content that is to be deintercalated from positive electrode particles and inserted into the negative electrode. Therefore, the cell follows the subsequent cv_ch charging. In addition, at high C-rates, the faster increase in the surface SOC of the particles inside the 2D RVEs leads to rapid volume expansion at the surface. The constraining binder does not allow the particle expansion at the same rapid rate. Therefore, considering the combined effect from both the binder constraint to particle expansion inside the 2D RVEs and C-rate, the cell increases its cv_ch duration to obtain maximum cyclable lithium from the positive electrode and accommodate in the negative electrode. Therefore, we conclude that constant voltage charging is necessary to obtain the cell’s maximum charging capacity.
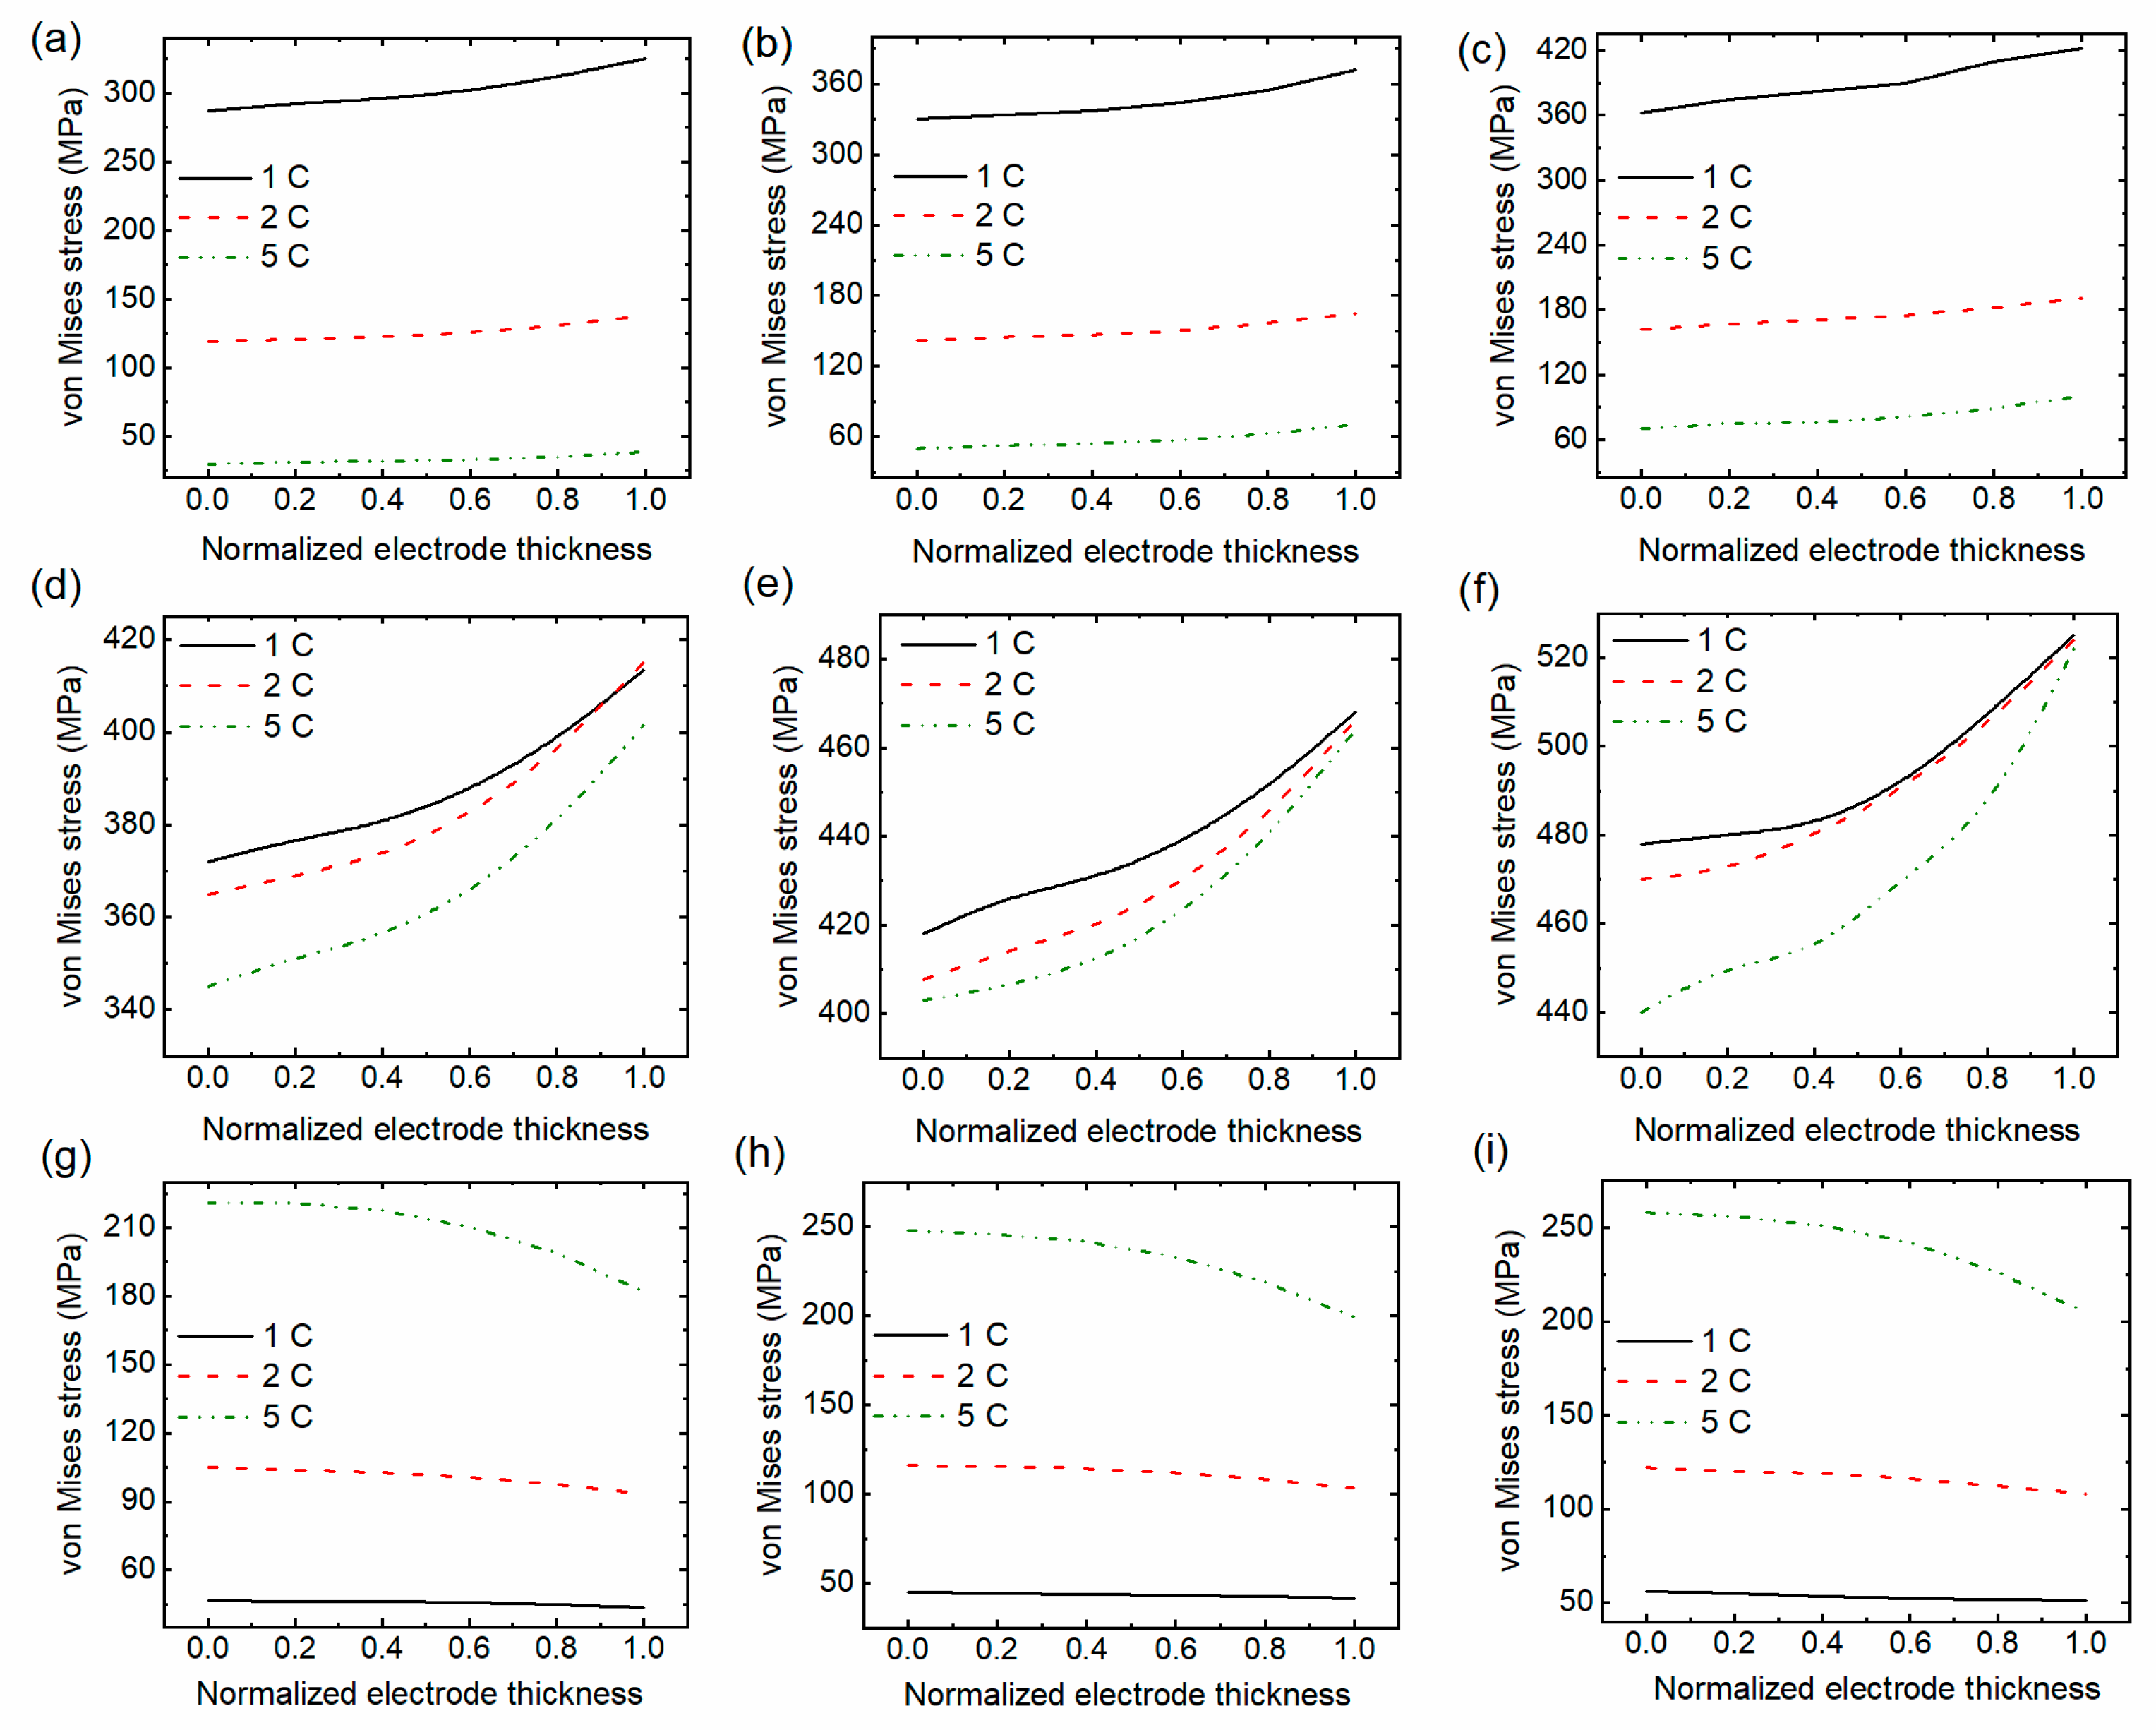
Figure 8a–c depicts the σ v at Point 1, Point 2, and σ v , m a x , respectively, across the electrode thicknesses for all C-rates and at the end of cc_ch. It can be observed that the stress increases linearly across the electrode thickness with larger stress occurred near to the separator. Moreover, lower stress is observed for the 5 C during the cc_ch phase. The higher stress at Point 2 than Point 1, as shown in Figure 8b, suggests that the particle fracture is more probable at Point 2 during the cc_ch phase. Figure 8d–f illustrates the σ v at Point 1, Point 2, and σ v , m a x , respectively, across the electrode thicknesses for all C-rates and end of cv_ch. Across the electrode thickness, the stress followed a parabolic increase towards the separator. In addition, near to the separator, the stress is independent of the C-rate.
Figure 8g–i depicts the σ v across the electrode thickness at Point 1, Point 2, and σ v , m a x , respectively, by the end of cc_dch. It can be observed that considerable stress remained inside the particles for a high C-rate and near the current collector. These stresses inside the particles are responsible for particle fracture and binder debonding. Therefore, the maximum stress inside the particle and P/B interface needs to be controlled to alleviate the particle fracture and binder debonding.

5. Conclusions

In this study, we developed a fully coupled multiscale–multiphysics model to investigate the effect of P/P and P/B interactions on the electro-chemo-mechanical response of Li-ion battery. The P/P and P/B interaction is incorporated inside the anode using 2D RVEs. The electrochemistry and mechanics are fully coupled both inside the 1D electrochemical model and 2D RVEs, by considering the effect of stress-enhanced diffusion and stress-induced overpotential. Both the 1D model and the 2D RVEs are two-way-coupled.
The model is solved for a complete charge/discharge cycle. The study concludes that the particles achieved a lower surface SOC during charging due to the surrounding binder constraints. Furthermore, these constraints increase the charging time and reduce the discharge capacity. Moreover, inhomogeneous stress distribution also occurred inside the electrode particles due to the P/P interaction through the binder layer.
The results further elaborate that the binder’s effect is more significant near the separator than the current collector. Moreover, the decreasing binder modulus showed little impact on the cell charging time and discharge capacity. However, it reduces the stress levels and stress non-uniformity inside the particles and across the electrode. With increasing C-rate, the effect of mechanical confinement is more pronounced on the constant voltage charging and the maximum von Mises stress occurred at the end of charging. Our study concludes that understanding the P/P and P/B interaction is essential for controlling the cell charging time and mitigated the stress inhomogeneity inside the particles and P/B interface. The developed model will further be extended to understand the P/B interface debonding to develop robust electrodes.

Author Contributions

Conceptualization, Y.A.; methodology, Y.A.; software, Y.A., N.I. and T.A.K.; validation, Y.A., N.I. and I.S.; formal analysis, Y.A.; investigation, Y.A.; resources, Y.A. and N.I.; data curation, Y.A.; writing—original draft preparation, Y.A.; writing—review and editing, Y.A and T.A.K.; visualization, Y.A. and N.I.; supervision, Y.A. and I.S; project administration, Y.A. and N.I.; funding acquisition, Y.A. All authors have read and agreed to the published version of the manuscript.

Funding

This research received no external funding.

Data Availability Statement

This research is part of an ongoing project.

Conflicts of Interest

The authors declare no conflict of interest.

References

  1. Zhuo, M.; Offer, G.; Marinescu, M. Degradation Model of High-Nickel Positive Electrodes: Effects of Loss of Active Material and Cyclable Lithium on Capacity Fade. J. Power Sources 2023, 556, 232461. [Google Scholar] [CrossRef]
  2. Jiao, X.; Wang, Y.; Chen, Y.; Wang, J.; Xiong, S.; Song, Z.; Xu, X.; Liu, Y. Insight of Electro-Chemo-Mechanical Process inside Integrated Configuration of Composite Cathode for Solid-State Batteries. Energy Storage Mater. 2023, 61, 102864. [Google Scholar] [CrossRef]
  3. Gao, X.; Li, S.; Xue, J.; Hu, D.; Xu, J. A Mechanistic and Quantitative Understanding of the Interactions between SiO and Graphite Particles. Adv. Energy Mater. 2023, 13, 2202584. [Google Scholar] [CrossRef]
  4. Li, D.; Guo, H.; Jiang, S.; Zeng, G.; Zhou, W.; Li, Z. Microstructures and Electrochemical Performances of TiO2-Coated Mg–Zr Co-Doped NCM as a Cathode Material for Lithium-Ion Batteries with High Power and Long Circular Life. New J. Chem. 2021, 45, 19446–19455. [Google Scholar] [CrossRef]
  5. Ali, Y.; Iqbal, N.; Lee, S. Inhomogeneous Stress Development at the Multiparticle Electrode of Lithium-ion Batteries. Int. J. Energy Res. 2021, 45, 14788–14803. [Google Scholar] [CrossRef]
  6. Chen, Z.; Christensen, L.; Dahn, J.R. Large-Volume-Change Electrodes for Li-Ion Batteries of Amorphous Alloy Particles Held by Elastomeric Tethers. Electrochem. Commun. 2003, 5, 919–923. [Google Scholar] [CrossRef]
  7. Yan, X.; Wang, Y.; Yu, T.; Chen, H.; Zhao, Z.; Guan, S. Polyimide Binder by Combining with Polyimide Separator for Enhancing the Electrochemical Performance of Lithium Ion Batteries. Electrochim. Acta 2016, 216, 1–7. [Google Scholar] [CrossRef]
  8. Liu, G.; Zheng, H.; Song, X.; Battaglia, V.S. Particles and Polymer Binder Interaction: A Controlling Factor in Lithium-Ion Electrode Performance. J. Electrochem. Soc. 2012, 159, A214. [Google Scholar] [CrossRef] [Green Version]
  9. Bucci, G.; Swamy, T.; Bishop, S.; Sheldon, B.W.; Chiang, Y.-M.; Carter, W.C. The Effect of Stress on Battery-Electrode Capacity. J. Electrochem. Soc. 2017, 164, A645–A654. [Google Scholar] [CrossRef]
  10. Tomaszewska, A.; Chu, Z.; Feng, X.; O’Kane, S.; Liu, X.; Chen, J.; Ji, C.; Endler, E.; Li, R.; Liu, L.; et al. Lithium-Ion Battery Fast Charging: A Review. eTransportation 2019, 1, 100011. [Google Scholar] [CrossRef]
  11. Zhu, G.L.; Zhao, C.Z.; Huang, J.Q.; He, C.; Zhang, J.; Chen, S.; Xu, L.; Yuan, H.; Zhang, Q. Fast Charging Lithium Batteries: Recent Progress and Future Prospects. Small 2019, 15, 1805389. [Google Scholar]
  12. Iqbal, N.; Ali, Y.; Lee, S. Analysis of Mechanical Failure at the Interface between Graphite Particles and Polyvinylidene Fluoride Binder in Lithium-Ion Batteries. J. Power Sources 2020, 457, 228019. [Google Scholar] [CrossRef]
  13. Ali, Y.; Iqbal, N.; Lee, S. Simultaneous Effect of Particle Size and Location on Stress Development in the Electrodes of Lithium-ion Batteries. Int. J. Energy Res. 2020, 44, 12145–12157. [Google Scholar] [CrossRef]
  14. Takahashi, K.; Higa, K.; Mair, S.; Chintapalli, M.; Balsara, N.; Srinivasan, V. Mechanical Degradation of Graphite/PVDF Composite Electrodes: A Model-Experimental Study. J. Electrochem. Soc. 2016, 163, A385–A395. [Google Scholar] [CrossRef] [Green Version]
  15. Baboo, J.P.; Yatoo, M.A.; Dent, M.; Hojaji Najafabadi, E.; Lekakou, C.; Slade, R.; Hinder, S.J.; Watts, J.F. Exploring Different Binders for a LiFePO4 Battery, Battery Testing, Modeling and Simulations. Energies 2022, 15, 2332. [Google Scholar] [CrossRef]
  16. Singh, G.; Bhandakkar, T.K. Analytical Investigation of Binder’s Role on the Diffusion Induced Stresses in Lithium Ion Battery through a Representative System of Spherical Isolated Electrode Particle Enclosed by Binder. J. Electrochem. Soc. 2017, 164, A608–A621. [Google Scholar] [CrossRef]
  17. Mendoza, H.; Roberts, S.A.; Brunini, V.E.; Grillet, A.M. Mechanical and Electrochemical Response of a LiCoO2 Cathode Using Reconstructed Microstructures. Electrochim. Acta 2016, 190, 1–15. [Google Scholar] [CrossRef] [Green Version]
  18. Trembacki, B.L.; Noble, D.R.; Brunini, V.E.; Ferraro, M.E.; Roberts, S.A. Mesoscale Effective Property Simulations Incorporating Conductive Binder. J. Electrochem. Soc. 2017, 164, E3613–E3626. [Google Scholar] [CrossRef]
  19. Huang, P.; Gao, L.T.; Guo, Z.-S. Elastoplastic Model for Chemo-Mechanical Behavior of Porous Electrodes Using Image-Based Microstructure. Int. J. Solids Struct. 2022, 254–255, 111903. [Google Scholar] [CrossRef]
  20. Foster, J.M.; Huang, X.; Jiang, M.; Chapman, S.J.; Protas, B.; Richardson, G. Causes of Binder Damage in Porous Battery Electrodes and Strategies to Prevent It. J. Power Sources 2017, 350, 140–151. [Google Scholar] [CrossRef] [Green Version]
  21. Rahani, E.K.; Shenoy, V.B. Role of Plastic Deformation of Binder on Stress Evolution during Charging and Discharging in Lithium-Ion Battery Negative Electrodes. J. Electrochem. Soc. 2013, 160, A1153–A1162. [Google Scholar] [CrossRef]
  22. Wu, W.; Xiao, X.; Wang, M.; Huang, X. A Microstructural Resolved Model for the Stress Analysis of Lithium-Ion Batteries. J. Electrochem. Soc. 2014, 161, A803. [Google Scholar] [CrossRef]
  23. Rieger, B.; Schlueter, S.; Erhard, S.V.; Jossen, A. Strain Propagation in Lithium-Ion Batteries from the Crystal Structure to the Electrode Level. J. Electrochem. Soc. 2016, 163, A1595–A1606. [Google Scholar] [CrossRef]
  24. Iqbal, N.; Ali, Y.; Lee, S. Mechanical Degradation Analysis of a Single Electrode Particle with Multiple Binder Connections: A Comparative Study. Int. J. Mech. Sci. 2020, 188, 105943. [Google Scholar] [CrossRef]
  25. Iqbal, N.; Ali, Y.; Lee, S. Chemo-Mechanical Response of Composite Electrode Systems with Multiple Binder Connections. Electrochim. Acta 2020, 364, 137312. [Google Scholar] [CrossRef]
  26. Liu, P.; Xu, R.; Liu, Y.; Lin, F.; Zhao, K. Computational Modeling of Heterogeneity of Stress, Charge, and Cyclic Damage in Composite Electrodes of Li-Ion Batteries. J. Electrochem. Soc. 2020, 167, 040527. [Google Scholar] [CrossRef]
  27. Wang, H.; Nadimpalli, S.P.V.; Shenoy, V.B. Inelastic Shape Changes of Silicon Particles and Stress Evolution at Binder/Particle Interface in a Composite Electrode during Lithiation/Delithiation Cycling. Extrem. Mech. Lett. 2016, 9, 430–438. [Google Scholar] [CrossRef] [Green Version]
  28. Gao, X.; He, P.; Ren, J.; Xu, J. Modeling of Contact Stress among Compound Particles in High Energy Lithium-Ion Battery. Energy Storage Mater. 2019, 18, 23–33. [Google Scholar] [CrossRef]
  29. Xiao, J.; Li, H.; Zhang, H.; He, S.; Zhang, Q.; Liu, K.; Jiang, S.; Duan, G.; Zhang, K. Nanocellulose and Its Derived Composite Electrodes toward Supercapacitors: Fabrication, Properties, and Challenges. J. Bioresour. Bioprod. 2022, 7, 245–269. [Google Scholar] [CrossRef]
  30. Deng, W.-N.; Li, Y.-H.; Xu, D.-F.; Zhou, W.; Xiang, K.-X.; Chen, H. Three-Dimensional Hierarchically Porous Nitrogen-Doped Carbon from Water Hyacinth as Selenium Host for High-Performance Lithium–Selenium Batteries. Rare Met. 2022, 41, 3432–3445. [Google Scholar] [CrossRef]
  31. Deng, W.; Xu, Y.; Zhang, X.; Li, C.; Liu, Y.; Xiang, K.; Chen, H. (NH4)2Co2V10O28·16H2O/(NH4)2V10O25·8H2O Heterostructure as Cathode for High-Performance Aqueous Zn-Ion Batteries. J. Alloys Compd. 2022, 903, 163824. [Google Scholar] [CrossRef]
  32. Zhou, W.; Zeng, G.; Jin, H.; Jiang, S.; Huang, M.; Zhang, C.; Chen, H. Bio-Template Synthesis of V2O3@Carbonized Dictyophora Composites for Advanced Aqueous Zinc-Ion Batteries. Molecules 2023, 28, 2147. [Google Scholar] [CrossRef] [PubMed]
  33. Wen, X.; Luo, J.; Xiang, K.; Zhou, W.; Zhang, C.; Chen, H. High-Performance Monoclinic WO3 Nanospheres with the Novel NH4+ Diffusion Behaviors for Aqueous Ammonium-Ion Batteries. Chem. Eng. J. 2023, 458, 141381. [Google Scholar] [CrossRef]
  34. Song, Y.C.; Soh, A.K.; Zhang, J.Q. On Stress-Induced Voltage Hysteresis in Lithium Ion Batteries: Impacts of Material Property, Charge Rate and Particle Size. J. Mater. Sci. 2016, 51, 9902–9911. [Google Scholar] [CrossRef]
  35. Liu, B.; Jia, Y.; Li, J.; Jiang, H.; Yin, S.; Xu, J. Multiphysics Coupled Computational Model for Commercialized Si/Graphite Composite Anode. J. Power Sources 2020, 450, 227667. [Google Scholar] [CrossRef]
  36. Sethuraman, V.A.; Srinivasan, V.; Bower, A.F.; Guduru, P.R. In Situ Measurements of Stress-Potential Coupling in Lithiated Silicon. J. Electrochem. Soc. 2010, 157, A1253. [Google Scholar] [CrossRef] [Green Version]
  37. Lu, Y.; Chang, L.; Song, Y.; He, L.; Ni, Y. Effect of Plasticity on Voltage Decay Studied by a Stress Coupled Phase Field Reaction Model. Extrem. Mech. Lett. 2021, 42, 101152. [Google Scholar] [CrossRef]
  38. Lu, B.; Song, Y.; Zhang, Q.; Pan, J.; Cheng, Y.T.; Zhang, J. Voltage Hysteresis of Lithium Ion Batteries Caused by Mechanical Stress. Phys. Chem. Chem. Phys. 2016, 18, 4721–4727. [Google Scholar] [CrossRef]
  39. Cannarella, J.; Leng, C.Z.; Arnold, C.B. On the Coupling between Stress and Voltage in Lithium-Ion Pouch Cells. In Energy Harvesting and Storage: Materials, Devices, and Applications V; SPI: Baltimore, MD, USA, 2014; Volume 9115, p. 91150K. [Google Scholar]
  40. Zhang, X.; Shyy, W.; Marie Sastry, A. Numerical Simulation of Intercalation-Induced Stress in Li-Ion Battery Electrode Particles. J. Electrochem. Soc. 2007, 154, A910. [Google Scholar] [CrossRef]
  41. Ai, W.; Kraft, L.; Sturm, J.; Jossen, A.; Wu, B. Electrochemical Thermal-Mechanical Modelling of Stress Inhomogeneity in Lithium-Ion Pouch Cells. J. Electrochem. Soc. 2020, 167, 013512. [Google Scholar] [CrossRef]
  42. Wu, B.; Lu, W. Mechanical-Electrochemical Modeling of Agglomerate Particles in Lithium-Ion Battery Electrodes. J. Electrochem. Soc. 2016, 163, A3131–A3139. [Google Scholar] [CrossRef]
  43. Christensen, J.; Newman, J. Stress Generation and Fracture in Lithium Insertion Materials. J. Solid State Electrochem. 2006, 10, 293–319. [Google Scholar] [CrossRef]
  44. Gao, Y.F.; Zhoua, M. Strong Stress-Enhanced Diffusion in Amorphous Lithium Alloy Nanowire Electrodes. J. Appl. Phys. 2011, 109, 014310. [Google Scholar] [CrossRef] [Green Version]
  45. Bower, A.F.; Guduru, P.R.; Sethuraman, V.A. A Finite Strain Model of Stress, Diffusion, Plastic Flow, and Electrochemical Reactions in a Lithium-Ion Half-Cell. J. Mech. Phys. Solids 2011, 59, 804–828. [Google Scholar] [CrossRef] [Green Version]
  46. Kim, S.; Wee, J.; Peters, K.; Huang, H.Y.S. Multiphysics Coupling in Lithium-Ion Batteries with Reconstructed Porous Microstructures. J. Phys. Chem. C 2018, 122, 5280–5290. [Google Scholar] [CrossRef]
  47. Gao, X.; Lu, W.; Xu, J. Modeling Framework for Multiphysics-Multiscale Behavior of Si–C Composite Anode. J. Power Sources 2020, 449, 227501. [Google Scholar] [CrossRef]
  48. Doyle, M.; Fuller, T.; Newman, J. Modeling of Galvanostatic Charge and Discharge of the Lithium/Polymer/Insertion Cell. J. Electrochem. Soc. 1993, 140, 1526–1533. [Google Scholar] [CrossRef]
  49. Liu, B.; Yin, S.; Xu, J. Integrated Computation Model of Lithium-Ion Battery Subject to Nail Penetration. Appl. Energy 2016, 183, 278–289. [Google Scholar] [CrossRef] [Green Version]
  50. Xu, R.; Zhao, K. Mechanical Interactions Regulated Kinetics and Morphology of Composite Electrodes in Li-Ion Batteries. Extrem. Mech. Lett. 2016, 8, 13–21. [Google Scholar] [CrossRef]
  51. Xu, R.; Scalco De Vasconcelos, L.; Zhao, K. Computational Analysis of Chemomechanical Behaviors of Composite Electrodes in Li-Ion Batteries. J. Mater. Res. 2016, 31, 2715–2727. [Google Scholar] [CrossRef] [Green Version]
  52. Wu, B.; Lu, W. A Consistently Coupled Multiscale Mechanical–Electrochemical Battery Model with Particle Interaction and Its Validation. J. Mech. Phys. Solids 2019, 125, 89–111. [Google Scholar] [CrossRef]
  53. Kashkooli, A.G.; Farhad, S.; Lee, D.U.; Feng, K.; Litster, S.; Babu, S.K.; Zhu, L.; Chen, Z. Multiscale Modeling of Lithium-Ion Battery Electrodes Based on Nano-Scale X-ray Computed Tomography. J. Power Sources 2016, 307, 496–509. [Google Scholar] [CrossRef]
  54. Pannala, S.; Turner, J.A.; Allu, S.; Elwasif, W.R.; Kalnaus, S.; Simunovic, S.; Kumar, A.; Billings, J.J.; Wang, H.; Nanda, J. Multiscale Modeling and Characterization for Performance and Safety of Lithium-Ion Batteries. J. Appl. Phys. 2015, 118, 072017. [Google Scholar] [CrossRef]
  55. Richardson, G.; Denuault, G.; Please, C.P. Multiscale Modelling and Analysis of Lithium-Ion Battery Charge and Discharge. J. Eng. Math. 2012, 72, 41–72. [Google Scholar] [CrossRef]
  56. Liu, B.; Wang, X.; Chen, H.S.; Chen, S.; Yang, H.; Xu, J.; Jiang, H.; Fang, D.N. A Simultaneous Multiscale and Multiphysics Model and Numerical Implementation of a Core-Shell Model for Lithium-Ion Full-Cell Batteries. J. Appl. Mech. Trans. ASME 2019, 86, 041005. [Google Scholar] [CrossRef]
  57. Cheng, Y.T.; Verbrugge, M.W. Evolution of Stress within a Spherical Insertion Electrode Particle under Potentiostatic and Galvanostatic Operation. J. Power Sources 2009, 190, 453–460. [Google Scholar] [CrossRef]
  58. Iqbal, N.; Ali, Y.; Lee, S. Debonding Mechanisms at the Particle-Binder Interface in the Li-Ion Battery Electrode. J. Electrochem. Soc. 2020, 167, 060515. [Google Scholar] [CrossRef]
  59. Lin, X.; Park, J.; Liu, L.; Lee, Y.; Lu, W.; Sastry, A.M. A Comprehensive Capacity Fade Model and Analysis for Li-Ion Batteries. J. Electrochem. Soc. 2013, 160, A1701–A1710. [Google Scholar] [CrossRef]
  60. Xiao, X.; Wu, W.; Huang, X. A Multi-Scale Approach for the Stress Analysis of Polymeric Separators in a Lithium-Ion Battery. J. Power Sources 2010, 195, 7649–7660. [Google Scholar] [CrossRef]
  61. Lee, S.; Yang, J.; Lu, W. Debonding at the Interface between Active Particles and PVDF Binder in Li-Ion Batteries. Extrem. Mech. Lett. 2016, 6, 37–44. [Google Scholar] [CrossRef]
  62. Wang, X.; de Vasconcelos, L.S.; Chen, K.; Perera, K.; Mei, J.; Zhao, K. In Situ Measurement of Breathing Strain and Mechanical Degradation in Organic Electrochromic Polymers. ACS Appl. Mater. Interfaces 2020, 12, 50895. [Google Scholar] [CrossRef] [PubMed]
  63. Wang, X.; Chen, K.; de Vasconcelos, L.S.; He, J.; Shin, Y.C.; Mei, J.; Zhao, K. Mechanical Breathing in Organic Electrochromics. Nat. Commun. 2020, 11, 211. [Google Scholar] [CrossRef] [PubMed] [Green Version]
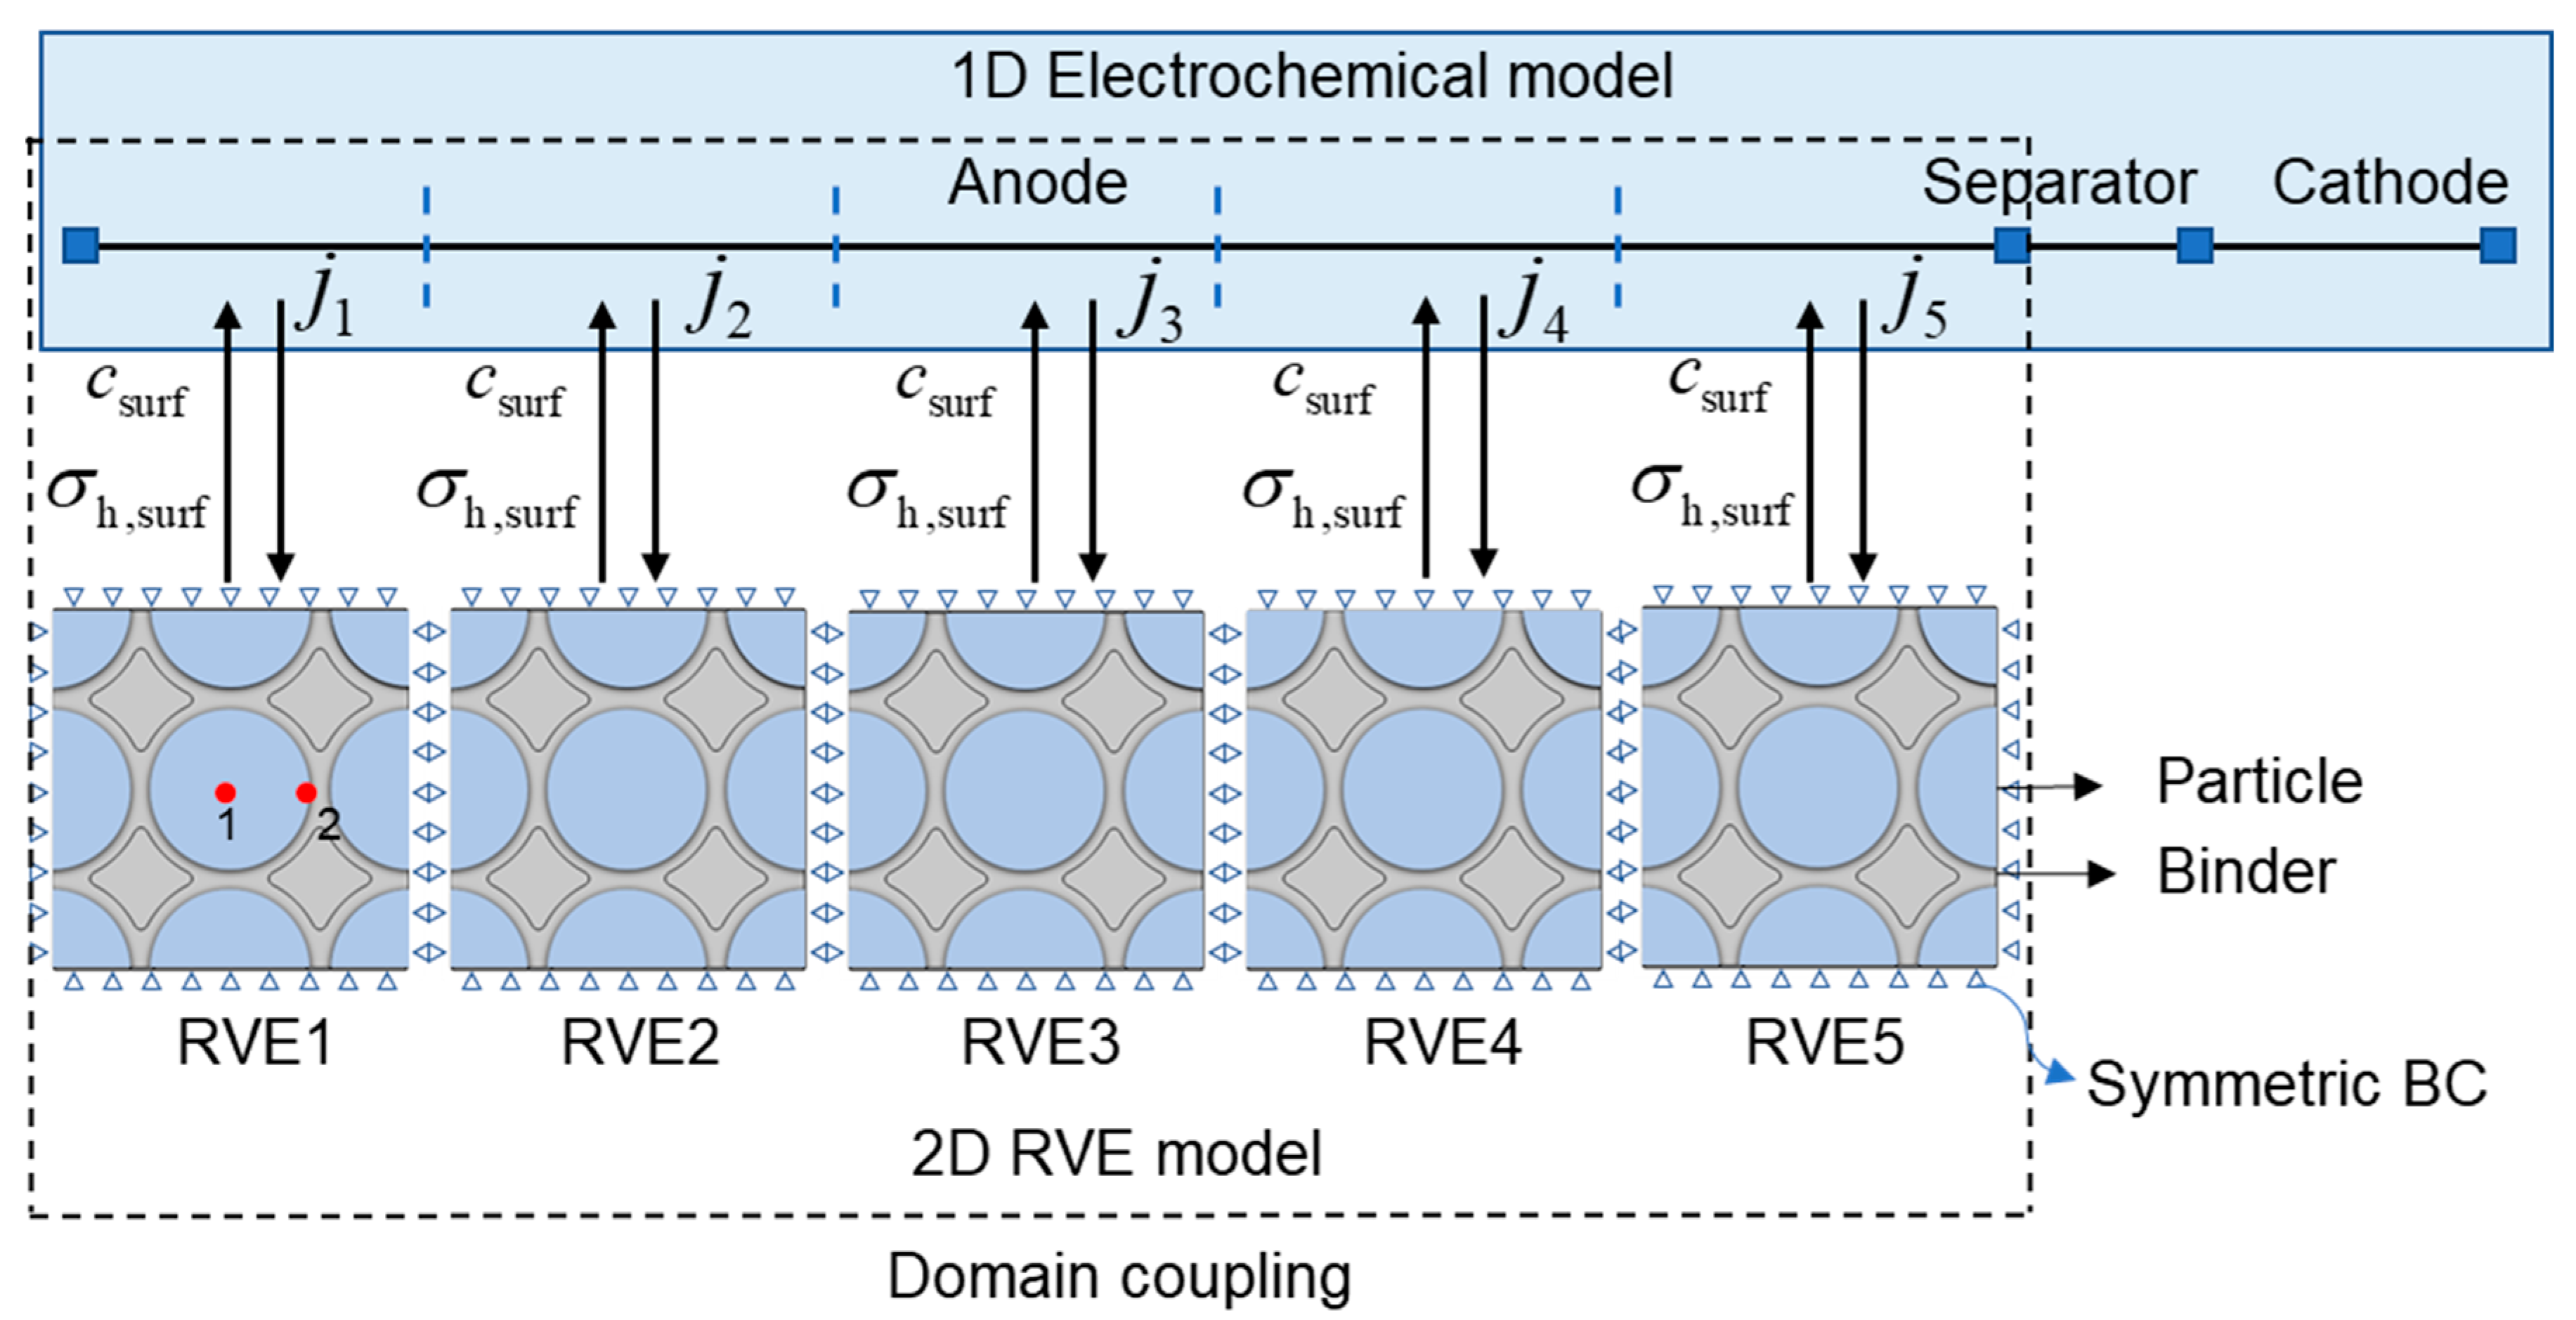
Figure 1. Schematic of the simulation model showing the coupling between the 1D electrochemical model and 2D RVE model. Inside the 1D model, the whole anode is divided into five equal parts, and each part is two-way coupled with its corresponding 2D RVE. RVE1 and RVE5 are near to current collector and separator respectively. Point 1 and 2 refer to the center of particle and particle-binder interface, respectively.
Energies 16 05823 g001
Figure 2. (a) The total stress inside the particle is the superposition of concentration gradient induced stress σ i j c and stress coming from P/P and P/B interaction σ i j in . (b) Coupling between electrochemistry and mechanics in both 1D electrochemical model and 2D RVE model.
Energies 16 05823 g002
Figure 3. Evolution of (a) cell voltage and (b) surface SOC for the isolated and binder-constrained particles throughout the whole charge–discharge cycle. The inset in (a) shows the profile of applied current; (c) comparison of the surface SOC across the electrode thickness for the case isolated and binder-constrained particles; (d) bar graphs comparing the charging time and discharge capacity for isolated and binder-constrained particles.
Energies 16 05823 g003
Figure 4. Contour plots of hydrostatic stress inside the RVE1 and RVE5 at the end of (a) charging, (b) discharging; (c) maximum compressive hydrostatic stress distribution inside the binder-constrained particles across the electrode thickness; (d) evolution of stress-induced overpotential inside RVE1 and RVE5 during the complete charge–discharge cycle.
Energies 16 05823 g004
Figure 5. Temporal evolution of von Mises stress at Point 1 and Point 2 and the maximum von Mises stress inside the particle of (a) RVE1 and (b) RVE5. The von Mises stress variation at Point 1 and Point 2 and the maximum von Mises stress values across the electrode thickness at the end of (c) cc_ch, (d) cv_ch, and (e) cc_dch.
Energies 16 05823 g005
Figure 6. (a) Maximum compressive hydrostatic stress inside the binder-constrained particles across the electrode thickness for the case of soft binder; (b) temporal evolution of stress-induced overpotential inside RVE1 and RVE5 during the whole charge/discharge cycle for the soft binder’s case; (c) comparison of surface SOC for the soft and hard binder. The von Mises stress variation at Point 1 and Point 2, and the maximum von Mises stress across the electrode thickness at the end of (d) cc_ch, (e) cv_ch, and (f) cc_dch, when the soft binder is considered.
Energies 16 05823 g006
Figure 7. Temporal evolution of (a) surface SOC and (b) maximum von Mises stress as a function of C-rates inside RVE5. Comparison of (c) total charging time, (d) cc_ch and cv_ch periods.
Energies 16 05823 g007
Figure 8. Von Mises stress profile inside the binder-constrained particles across the electrode thickness for different C-rates at (a) Point 1, end of cc_ch; (b) Point 2, end of cc_ch; (c) maximum von Mises stress, end of cc_ch; (d) Point 1, end of cv_ch; (e) Point 2, end of cv_ch; (f) maximum von Mises stress, end of cv_ch; (g) Point 1, end of cc_dch; (h) Point 2, end of cc_dch; and (i) maximum von Mises stress, end of cc_dch.
Energies 16 05823 g008
Table 1. Parameters used in the simulation.
ParameterNegativePositiveSeparator
Electrode thickness905270
Particle radius5–20 8
Active material volume fraction0.471 [59]0.297 [59]
Conductivity1003.8
Diffusion coefficient3.9 × 10−141 × 10−13
Initial electrolyte concentration100010001000
Electrolyte diffusivity7.5 × 10−11 [22]7.5 × 10−117.5 × 10⁻¹¹
Charge transfer coefficient0.50.5
Reaction rate constant2 × 10−11 [22]2 × 10⁻¹¹
Elastic modulus12 [60]10 [60]
Elastic modulus of PVDF binder2250 MPa [60]
Poisson’s ratio0.3 [61]0.3
Partial molar volume3.64 × 10−6 [61]4.17 × 10⁻⁶ [22]
Disclaimer/Publisher’s Note: The statements, opinions and data contained in all publications are solely those of the individual author(s) and contributor(s) and not of MDPI and/or the editor(s). MDPI and/or the editor(s) disclaim responsibility for any injury to people or property resulting from any ideas, methods, instructions or products referred to in the content.