1. Introduction
As a third-generation wide bandgap semiconductor, ZnO is highly favored due to its semiconductor and piezoelectric properties; compared with other metal oxide semiconductors, concentrating on the following series of advantages, the case in point is non-toxic, inexpensive, has diverse preparation methods, good chemical thermal stability, and high carrier mobility [
1,
2] and is widely used in fields such as gas sensing [
3,
4,
5,
6,
7,
8,
9,
10], ultraviolet sensing [
11], piezoelectric electronics [
12,
13], and electrocatalysis [
14], etc. Currently, ZnO can be used for the detection of various gases, including hydrogen [
3,
4], acetone [
5], ethanol [
6], carbon monoxide [
7,
8], ozone [
9], nitrogen dioxide [
10], and more.
Exploring the mechanism of sensors is beneficial for further understanding sensors. The essence of a gas-sensing mechanism is the adsorption and desorption of the gas on the material’s surface, which leads to the transfer of electrons and changes in resistance. This section briefly introduces the detection process of reducing and oxidizing gases by semiconductors. Gas-sensing reactions can be divided into two categories: oxidizing gases and reducing gases. When
n-type semiconductors are used for the detection of reducing gases, it is widely believed by researchers that oxygen vacancies (O
V) of semiconductors can adsorb a large number of O
2 to generate oxygen ions (O
2−, O
−, and O
2−), increasing semiconductors’ resistance. When reducing gases enter the atmosphere, they react with surface oxygen ions while releasing electrons, leading to a decrease in semiconductors’ resistance [
3,
4,
5,
6,
7]. On the contrary, when
n-type semiconductors are used to detect oxidizing gases, most savants believe that oxidizing gases, such as ozone and nitrogen dioxide, have higher electron affinity than oxygen. As a result, oxidizing gases tend to adsorb at oxygen vacancies (O
V) on the surface of semiconductors, seizing electrons and leading to an increase in semiconductors’ resistance [
9,
10]. Due to the difference in multi-carriers between
n-type semiconductors (electrons) and
p-type semiconductors (holes), for
p-type semiconductors, the direction of charge transfer is opposite to that of
n-type semiconductors; for this reason, the phenomenon of detecting gas in
n-type and
p-type semiconductors is opposite.
It is generally recognized that since the Industrial Revolution, the increasing seriousness of environmental pollution, and the depletion of non-renewable resources, finding alternative clean energy sources has become urgent. Among them, hydrogen gas, known for its high combustion heat, high energy ratio, and non-polluting products, provides a potential solution for replacing fossil fuels and reducing carbon emissions [
15,
16]. Because of the small size and easy leakage of H
2 molecules, the wide range of explosive concentrations (4–75% by volume) limits the promotion and application of hydrogen, and the development of H
2 sensors with low detection limits is crucial in safe production and H
2 leakage detection [
17]. Recently, Ankur et al. synthesized Pd-modified ZnO nanowires and achieved a sensitivity of approximately 42% for H
2 at a testing temperature of 200 °C and a concentration of about 500 ppm [
3]. Lupan et al. synthesized ZnO nanowires with a diameter of approximately 140 nm and obtained a sensitivity of less than 68% for H
2 at room temperature and a concentration of 100 ppm [
4]. In most studies, due to hydrogen being a typical reducing gas, hydrogen reacts with the oxygen ions (O
2−, O
−, O
2−) on the surface of
n-type semiconductors and produces H
2O or -OH, resulting in the charge transfer process from the adsorbed oxygen species back to the conduction band of the
n-type semiconductors, and the space charge depletion layer on the surface of the material is reduced; thereby, the resistance of the material is reduced.
However, in this work, we investigated the gas-sensing performance of a ZnO nanofiber film synthesized through electrospinning and observed abnormal behavior compared to previously reported pure ZnO-based H2 sensors. Specifically, during the temperature range from 210 °C to 330 °C, the resistance of the ZnO nanofiber film increased upon exposure to 20 ppm H2 and returned to its original level upon H2 closure. Characterization of the ZnO nanofiber film microstructure was performed using XRD, XPS, and SEM, revealing an increased concentration of oxygen vacancies on the surface of the ZnO nanofiber film. The elevated oxygen vacancy content influenced the adsorption properties of the ZnO surface. By combining experimental results with DFT calculations, the charge transfer during the gas-sensing process was accurately determined. This study provides insight into the mechanism behind the H2-gas-sensing performance of ZnO from another perspective.
2. Materials and Methods
ZnO nanofiber film was electrospun from solutions consisting of zinc acetate dihydrate (Zn(CH
3COO)
2·2H
2O), N, N-dimethylformamide (DMF), polyvinyl pyrrolidone (PVP, M
W = 1,300,000), and ethanol.
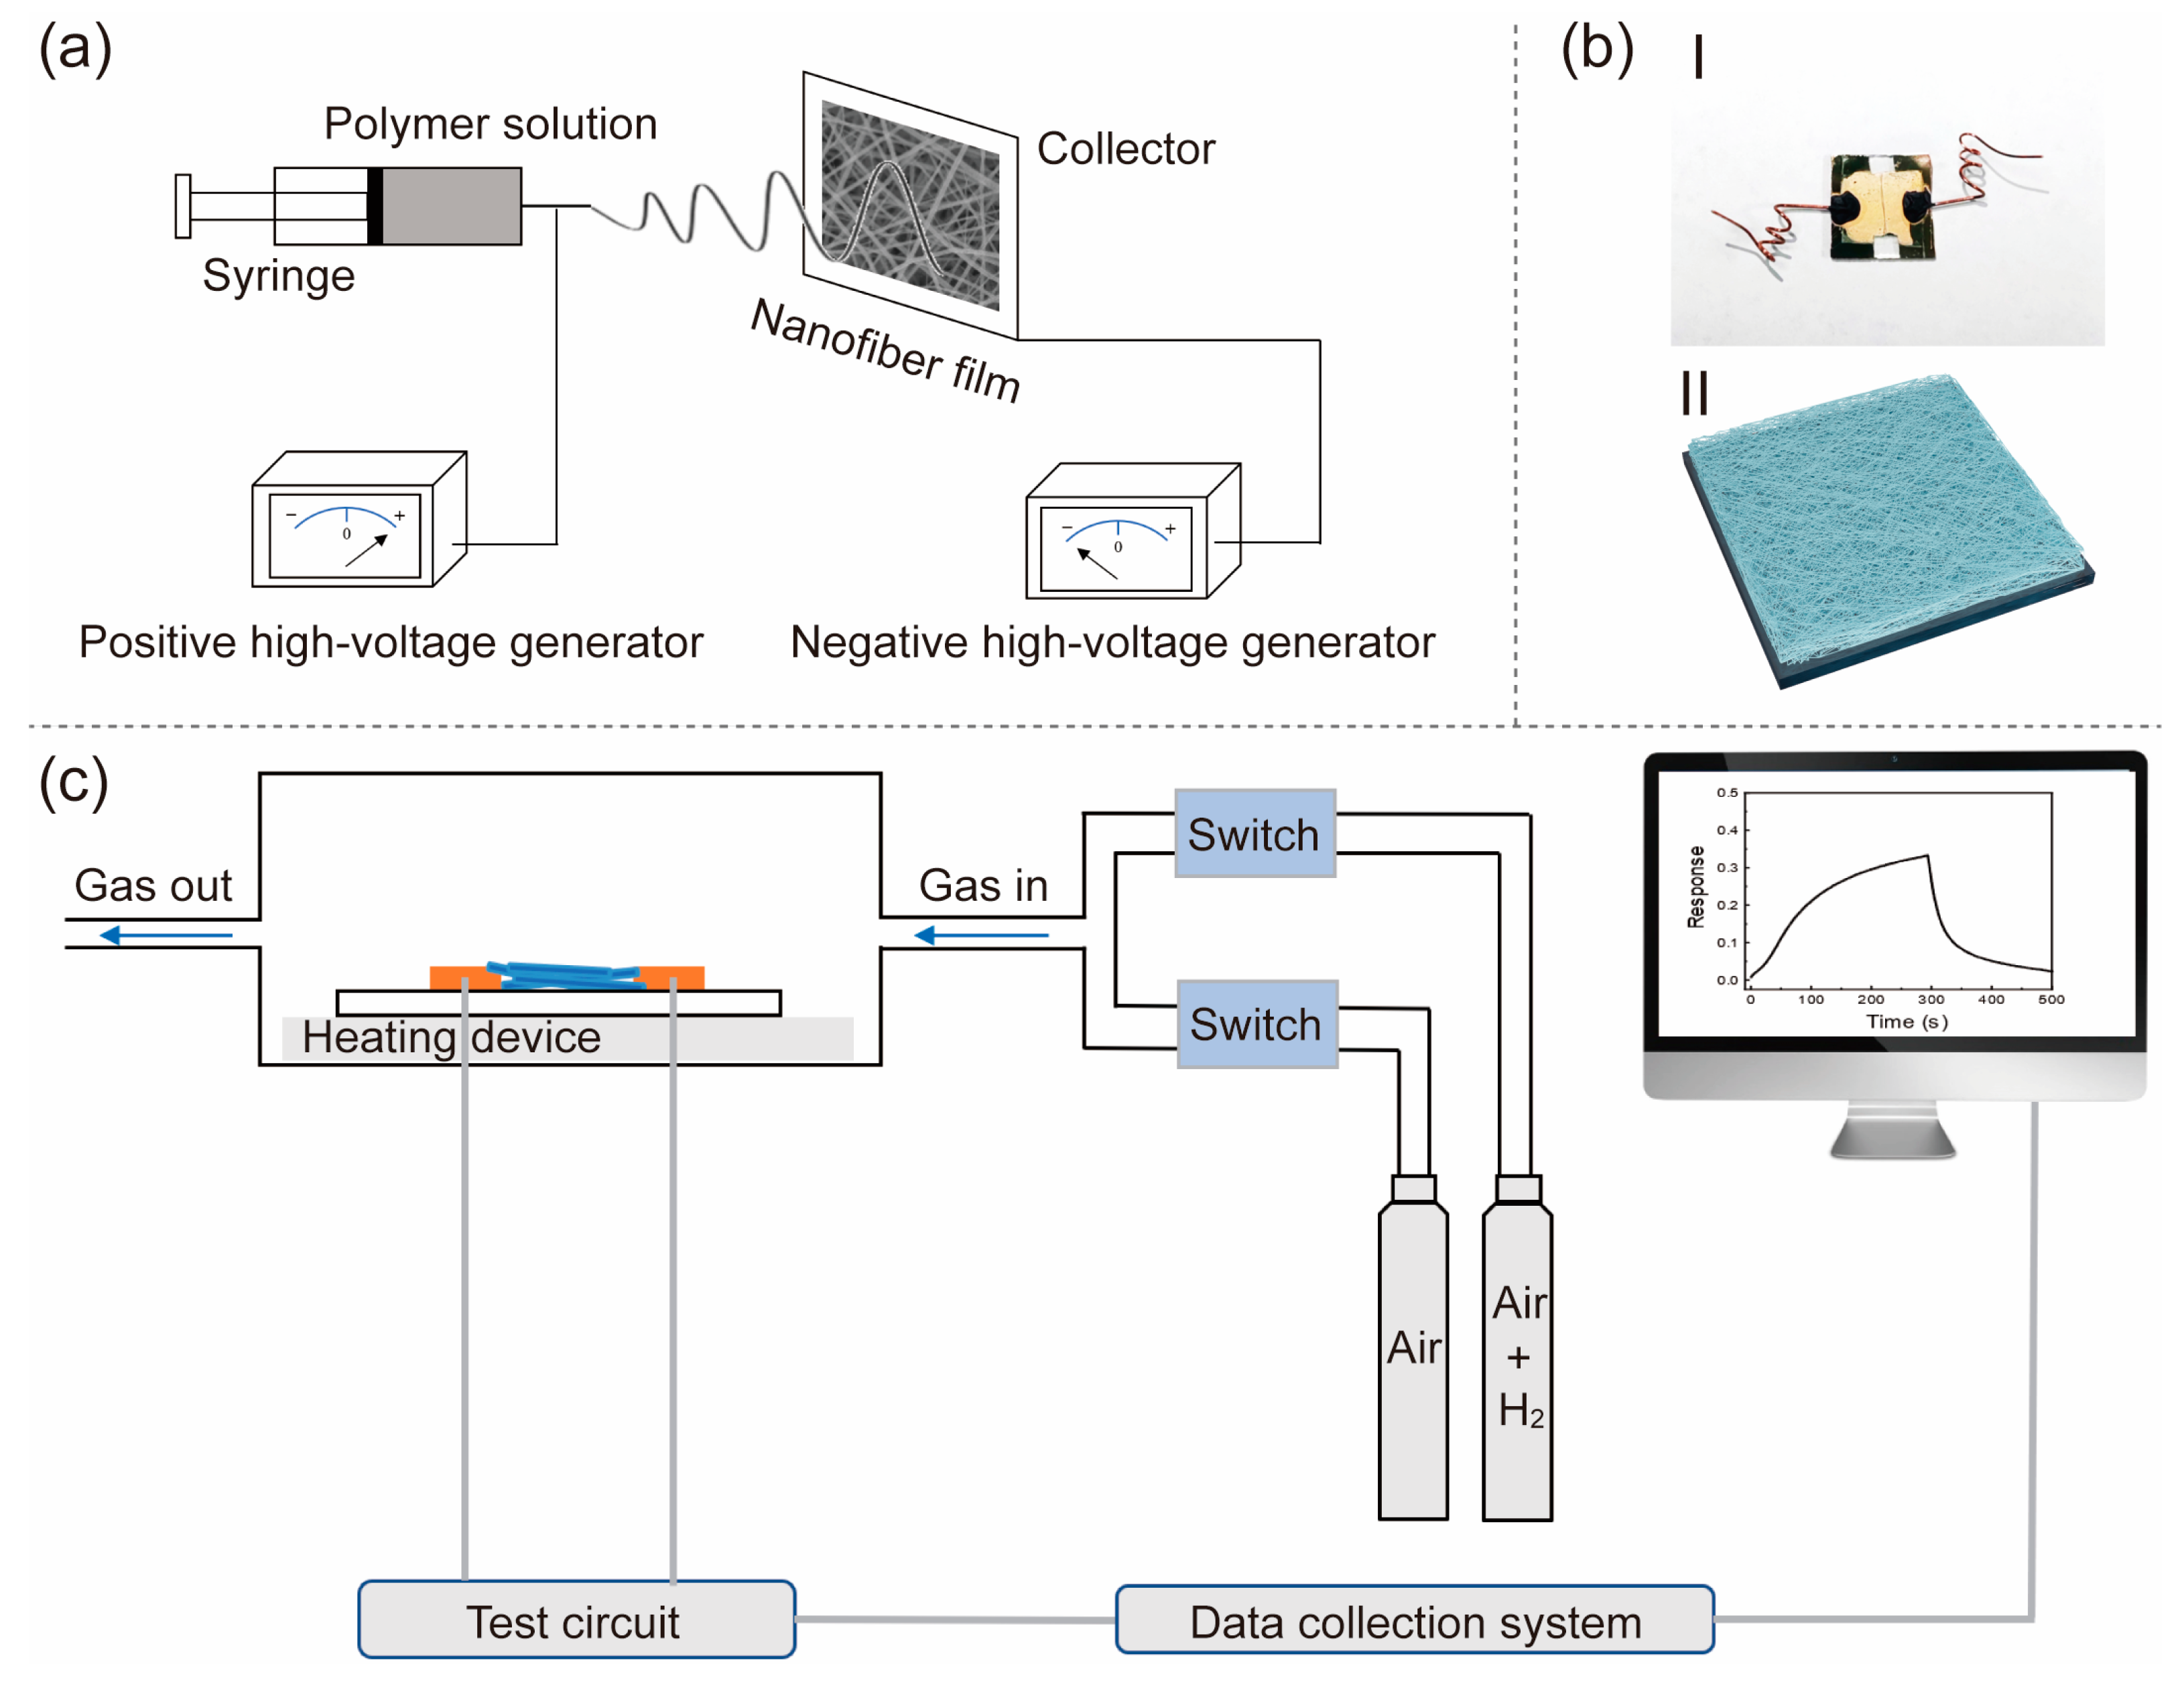
Figure 1a illustrates the process of preparing the ZnO nanofiber film through electrospinning. All the chemicals and reagents utilized in this study were of analytical grade and were directly used without further purification.
In detail, Step 1: Preparation of a metal electrode substrate: The quartz sheet was cut into a size of 12 mm × 12 mm square, washed by deionized water, acetone, and ethanol, respectively, and dried. Then, an electrode spacing of approximately 50 mm was achieved through magnetron sputtering (initial air pressure: about 9 × 10
−4 Pa; sputtering air pressure: about 3 Pa; sputtering gas: Ar gas molecule; sputtering power: 100 W; sputtering time: 10 min), resulting in the deposition of a layer of Au film on the surface of a quartz wafer. Step 2: Preparation of polymer solution: 2.8 g of Zn(CH
3COO)
2·2H
2O was dissolved in a mixed solvent consisting of 20 g of DMF and 7 g of ethanol, resulting in a transparent solution at 25 °C. Subsequently, 3 g of PVP was slowly added to the solution, followed by stirring for 12 h to obtain a polymer solution. Step 3: Preparation of polymer film: The polymer solution was loaded into a syringe equipped with a metal needle, while a quartz substrate containing a Au electrode was placed on the collector. An applied positive voltage of approximately 22 kV was used for the syringe, while an applied negative voltage of approximately −2 kV was used for the collector. The electrospinning process was carried out by using a syringe that was kept at a distance of 22 cm from the collector. The electrospinning was conducted for 15 min at approximately 20 °C and relative humidity (RH) of the environment of about 15%, which obtained a polymer solution film. Step 4: Preparation of ZnO nanofiber film: The polymer film was dried in an environment of 70 °C and annealed for two hours at 600 °C (heating rate: 2 °C/min), before naturally cooling to room temperature, leading to the formation of the ZnO nanofiber film. Step 5: preparation of ZnO nanofiber film H
2 sensor: the wires on the gold electrode were led out, and a simple ZnO nanofiber film hydrogen sensor was obtained, as illustrated in
Figure 1b-I, with a schematic diagram shown in
Figure 1b-II.
ZnO nanofiber film was characterized using X-ray diffraction (XRD, X’pert Pro) at ambient temperature and humidity, with data analysis performed using Jade software. The surface morphology and elemental composition of the ZnO nanofiber film were determined using scanning electron microscopy (SEM, S-4800) coupled with an energy-dispersive spectrometer (EDS). The elemental composition, surface state, and elemental valence of the ZnO nanofiber film were analyzed using X-ray photoelectron spectroscopy (XPS, Kratos AXIS Ultra DLD).
The H
2 sensitivity of the ZnO nanofiber film sensor was evaluated using a specially designed gas dilution and sensing system, as shown in
Figure 1c. The ZnO nanofiber film device was placed on a hot stage with a temperature resolution of 0.5 °C, and the wires were led out properly. The Maynuo DC Source Meter (M8812) can be used to provide voltage to the ZnO H
2 sensor, while the current of the ZnO H
2 sensor can be measured using the KEYSIGHT B2985A, and the gas flow rate (200 sccm) can be controlled through a flow meter. In a typical experiment, before the test: continuously introduce simulated air (composition: 20% O
2 + 80%N
2) into the sensing chamber until the current of the sensor stabilizes; in test: a predetermined quantity of 20 ppm H
2 (composition: 20% O
2 + 80% N
2 + 20 ppm H
2) is transferred from a storage cylinder into the sensing chamber; after the test: continuously introduce simulated air (composition: 20% O
2 + 80% N
2) into the sensing chamber until the current of the sensor stabilizes and then start the next cycle of testing. Following the introduction of 20 ppm H
2 gas, the current of the ZnO nanofiber film sensor decreased; this sensor gas response (
Resp) was defined as:
Resp = (
Ia −
Ig)/
Ig, where
Ia represents the current of the sensor exposed to the gas of air (20% O
2 + 80% N
2) and
Ig represents the current of the sensor when exposed to the gas of 20 ppm H
2 (20% O
2 + 80% N
2 + 20 ppm H
2).
3. Results
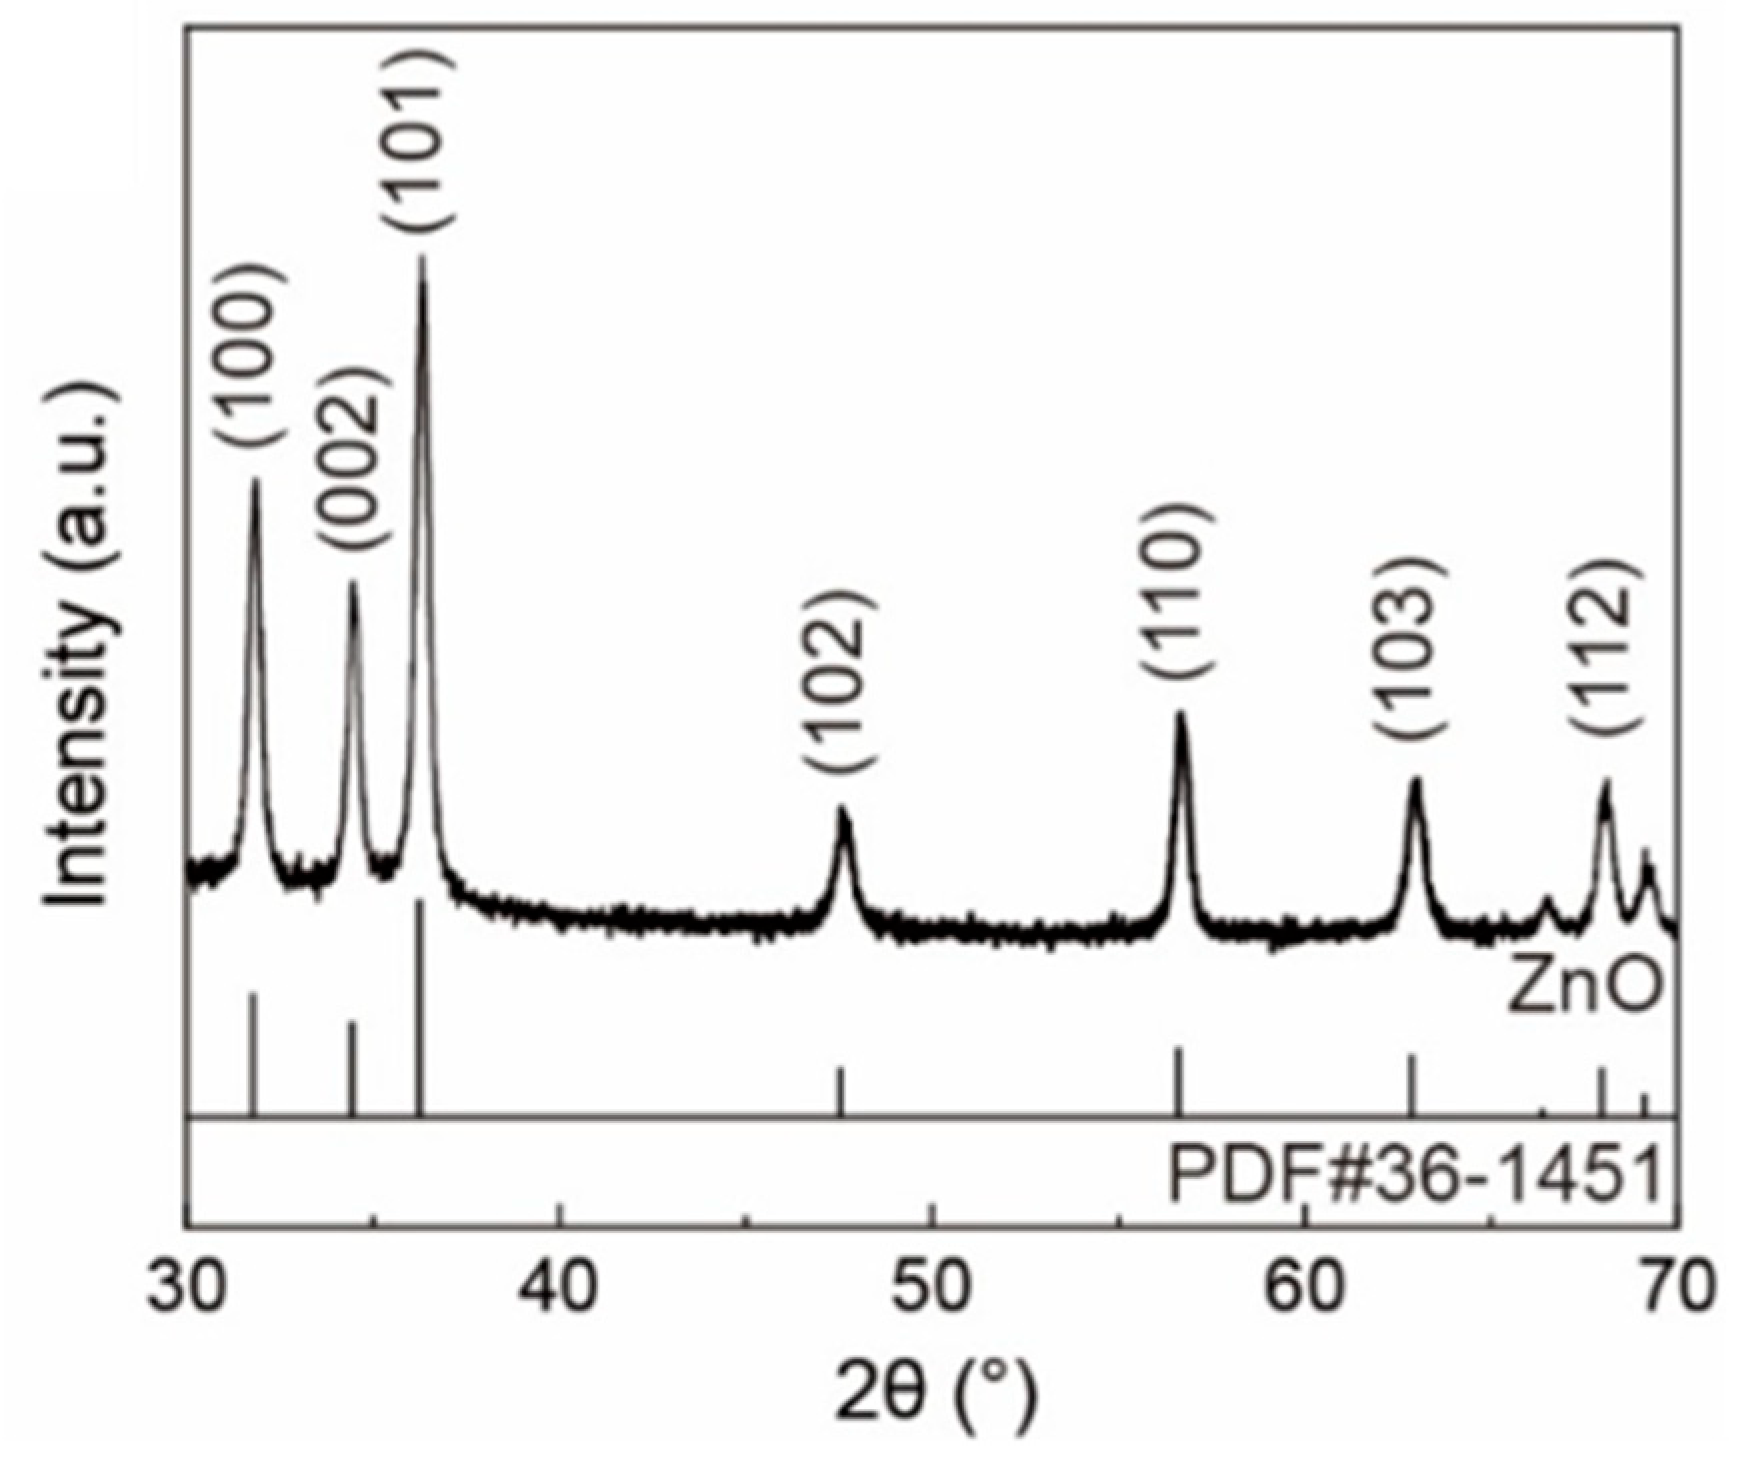
The microstructure of the sample was analyzed, and the XRD patterns of pure ZnO are shown in
Figure 2. The XRD pattern of ZnO contained the diffraction peaks at 2
θ = 31.86°, 34.56°, 36.36°, 47.64°, 56.66°, 62.92°, 66.54°, 67.99°, and 69.16°, which are assigned to the reflection lines of (1 0 0), (0 0 2), (1 0 1), (1 0 2), (1 1 0), (1 0 3), (2 0 0), (1 1 2), and (2 0 1) showing a hexagonal wurtzite structure (PDF#36-1451). No other discernible diffraction peaks were detected, indicating the high purity of the ZnO sample. The sharp and intense diffraction peaks further validate the high crystallinity of the ZnO nanofiber film.
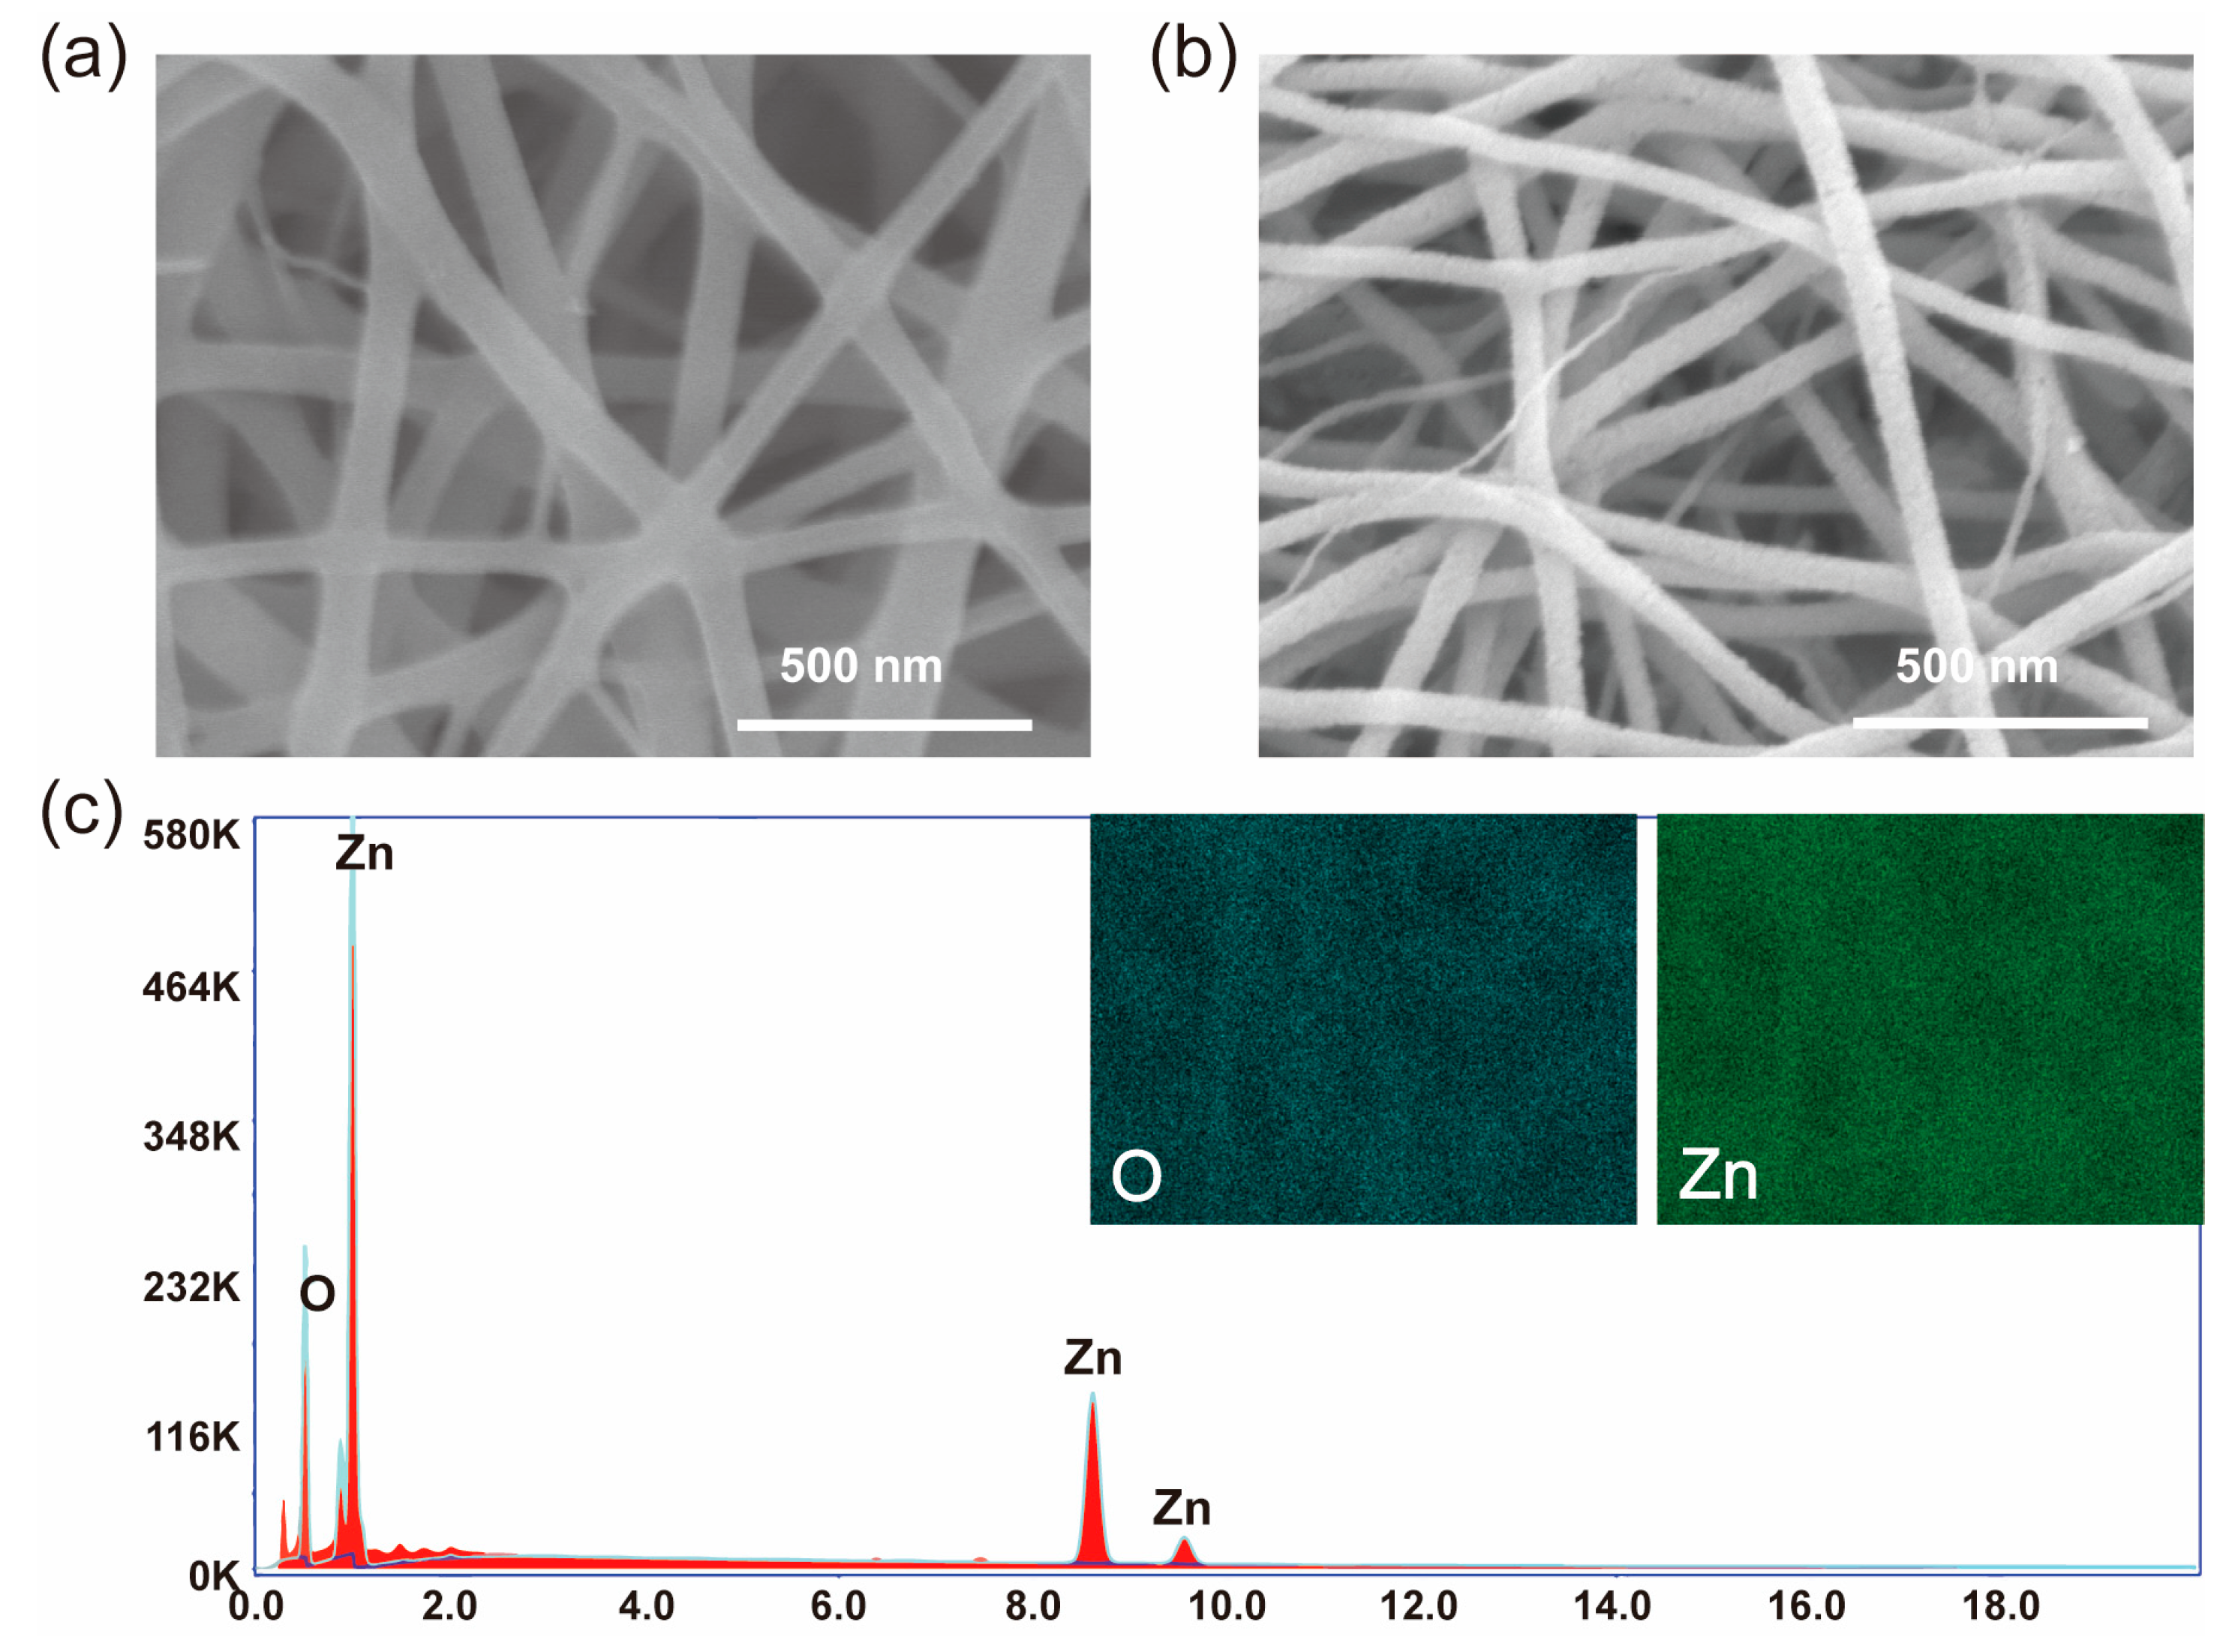
The micromorphology and composition of the ZnO nanofiber film were analyzed by SEM. The SEM images of the polymer film and ZnO nanofiber film are shown in
Figure 3a,b, respectively. The polymer film is composed of a large number of nanowires, with a smooth surface and an average diameter of about 97.7 nm. In contrast, the surface of the ZnO nanofiber film is rough, with an average diameter of about 59.09 nm; this phenomenon is consistent with previous reports [
18,
19]. ZnO nanofiber film nanowires were found to be finer and rougher compared to those in the polymer film. The main reason can be attributed to the degradation temperature of PVP in polymer film being about 343–361 °C [
18,
19]. During the roasting process at 600 °C, PVP was degraded to generate gases such as CO
2, H
2O, et al. The volatilization of these gases and the degradation of PVP lead to increased surface roughness. The rough surface of ZnO nanofiber film has a larger specific surface area to provide a more active site, which is advantageous for improved gas sensing, particularly when the diameter of the nanowire is the same. The EDS spectrum of the ZnO nanofiber film is shown in
Figure 3c. From the spectrum, it can be seen that the Zn and O elements are uniform, with no diffraction peaks of other elements, indicating the complete degradation of PVP.
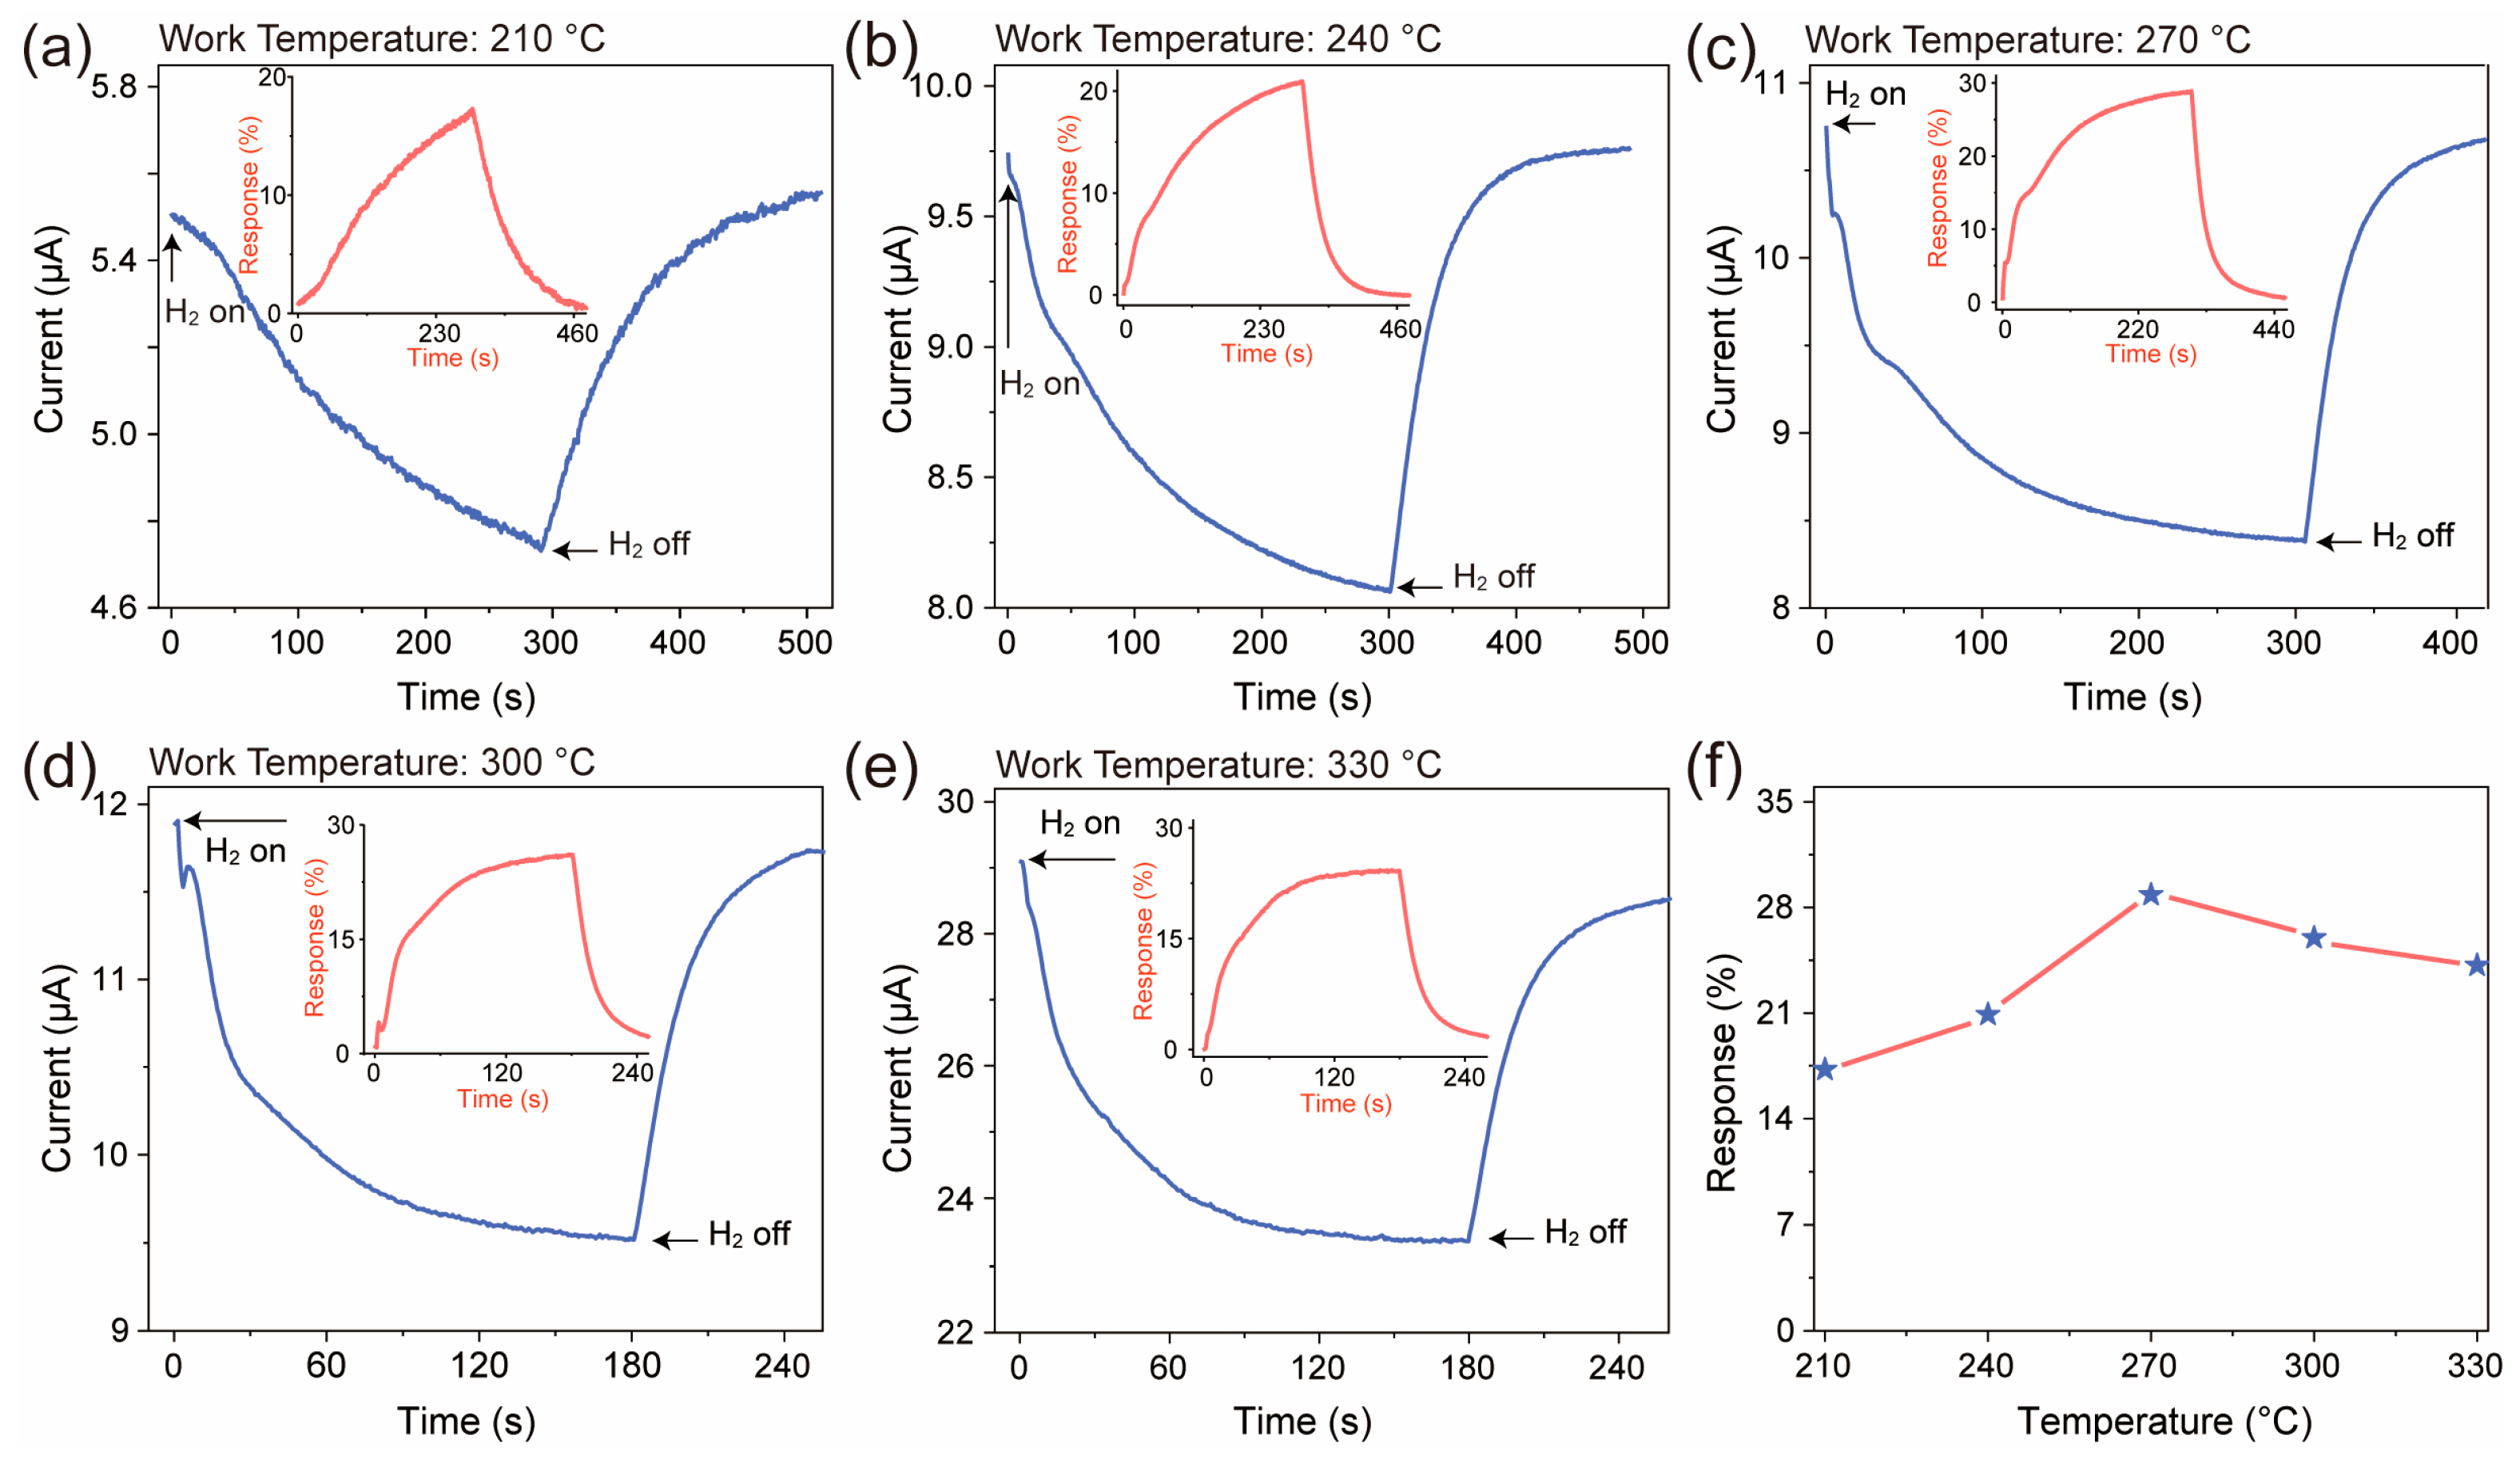
The H
2-sensing performance of the ZnO nanofiber film was tested, as shown in
Figure 4. The H
2 concentration used in the test was 20 ppm, and the applied voltage was 10 V. The current variation curves (a–e) represent the response of the ZnO nanofiber film, and the insets depict the corresponding dynamic response curves to H
2. It is obvious that the baseline current of the ZnO nanofiber film exhibits an increasing trend as the temperature increases; the main reason is the increase in carrier concentration caused by thermal excitation. The response of the film to H
2 initially increases and then decreases, reaching its maximum value at 270 °C with a response of approximately 28.84%. At lower operating temperatures, the activation energy on the surface of the gas-sensitive material is relatively low, resulting in a lower response from the sensor. However, when the temperature exceeds the optimal temperature, the desorption rate on the surface of the gas-sensitive material surpasses the adsorption rate, leading to a decreased sensor response [
7,
20].
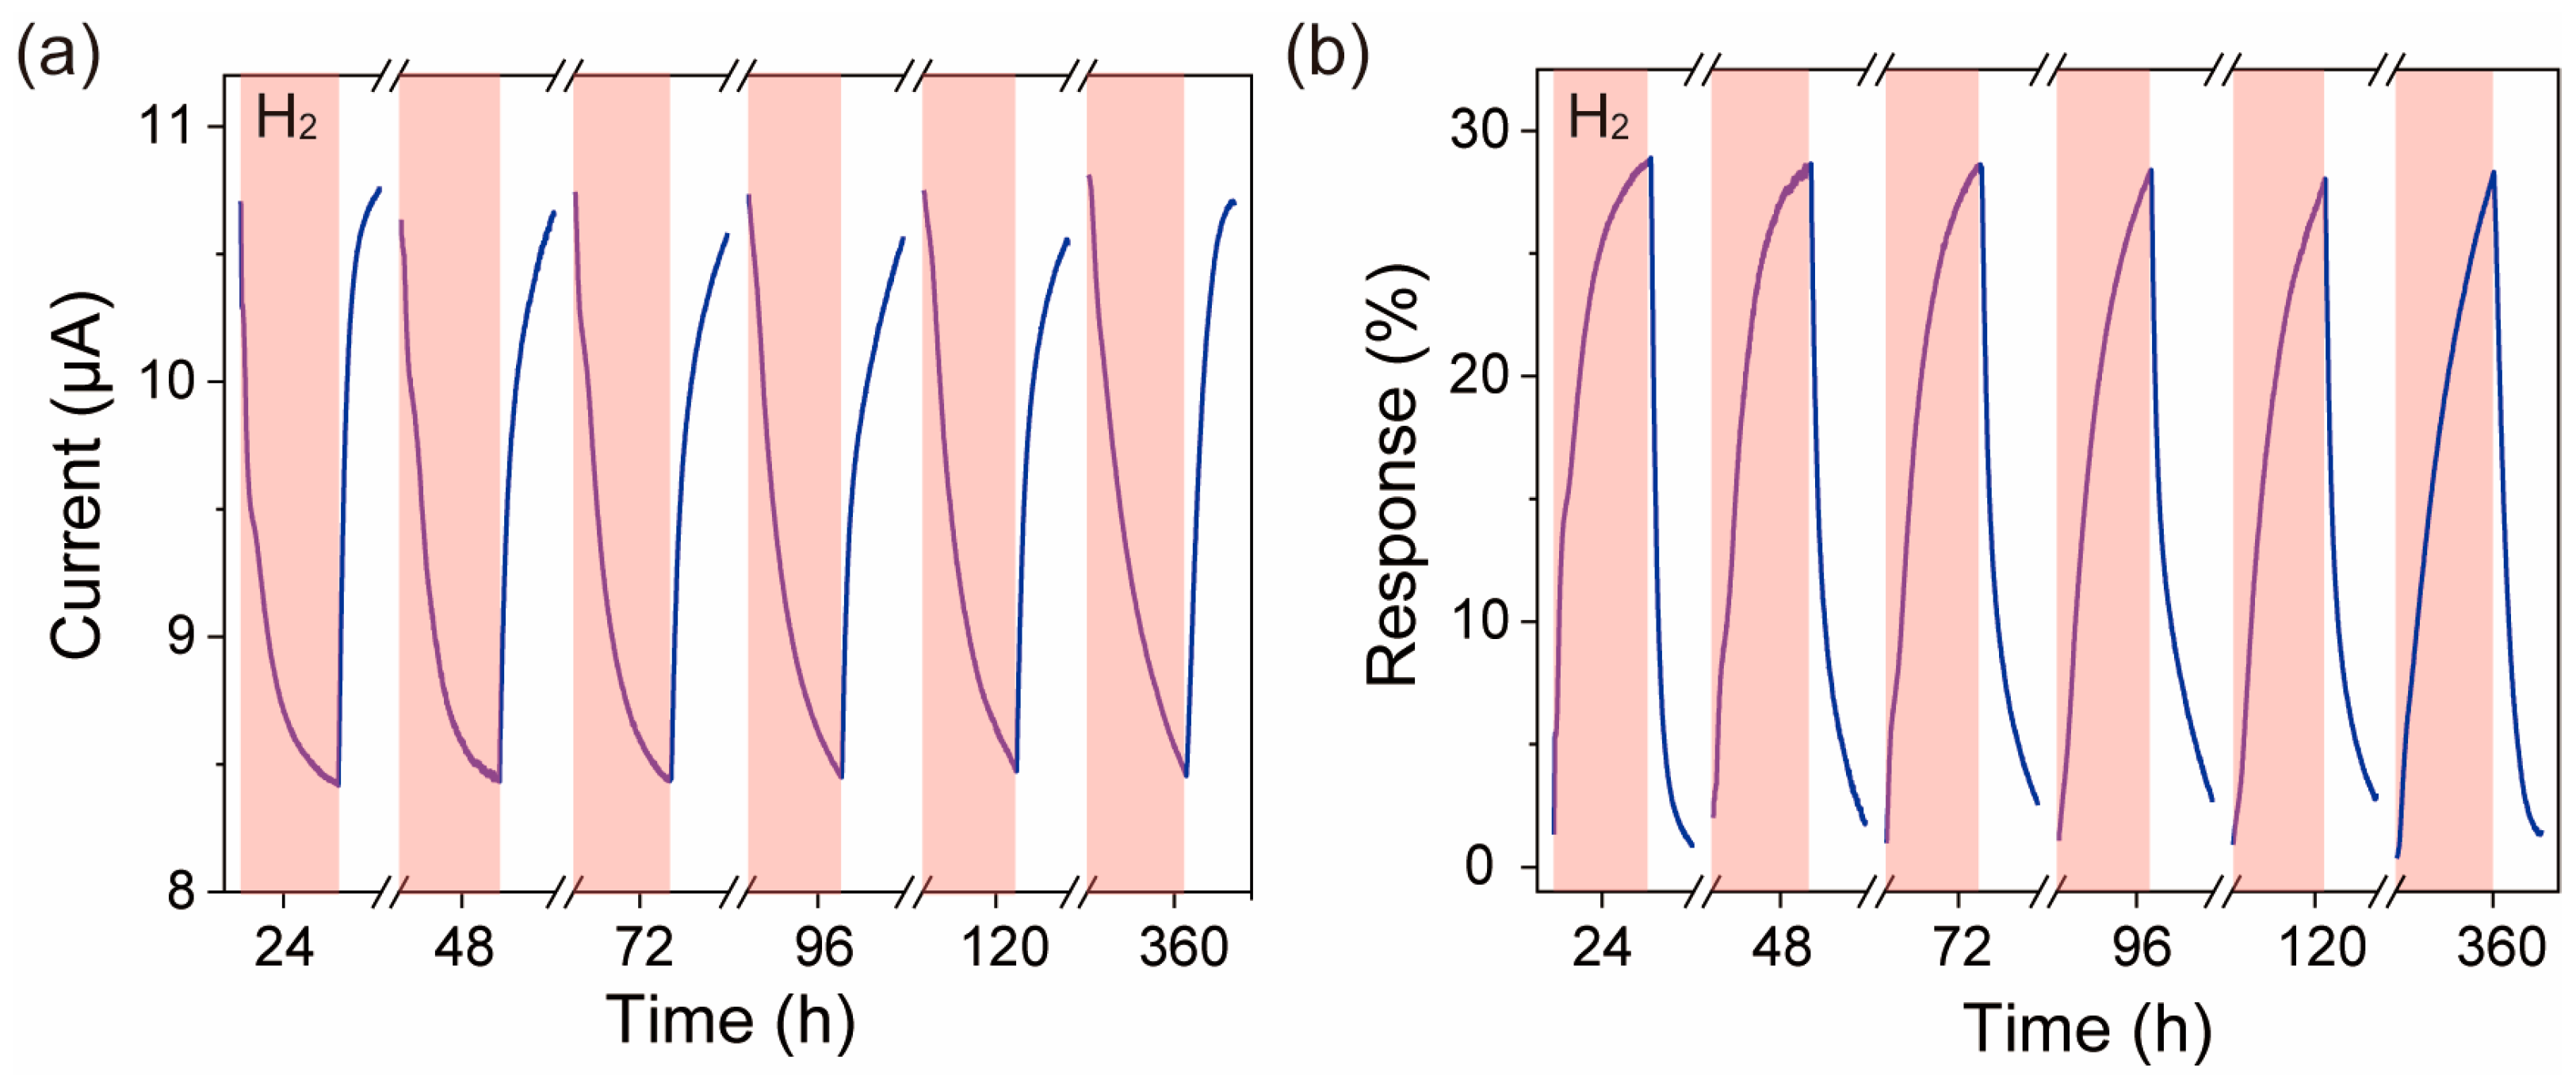
Repeatability is an important indicator for evaluating sensor performance. To test the long-term stability of the ZnO nanofiber film sensor, we stored the ZnO nanofiber film H
2 sensor in a Petri dish and placed it in a cabinet. The long-time repeatability of the ZnO nanofiber film towards 20 ppm H
2 was tested at the optimal operating temperature of 270 °C as shown in
Figure 5. From
Figure 5a, we found that the current of the ZnO nanofiber film decreased with the introduction of H
2 during multiple testing processes. After 5 min of H
2 was introduced, the current of the ZnO nanofiber film was about 8.42 μA when placed for 24 h, ~8.43 μA at 48 h, ~8.44 μA at 72 h, ~8.45 μA at 96 h, ~8.48 μA at 120 h, and ~8.46 μA at 360 h. Multiple test results consistently exhibited anomalous behavior, confirming that the anomalous phenomenon is not random. The calculated sensitivity curve is shown in
Figure 5b, where it can be seen that the sensitivity of the ZnO nanofiber film sensor is about 28.89% when placed for 24 h, ~28.66% at 48 h, ~28.62% at 72 h, ~28.40% at 96 h, ~28.04% at 120 h, and ~28.31% at 360 h. The range between the maximum and minimum sensitivity values during this period, the average value of multiple tests, and the maximum error rate are 0.85%, 28.49%, and 1.6%, respectively, indicating that there is no significant degradation in the sensitivity of the ZnO nanofiber film to 20 ppm H
2. This indicates that the ZnO nanofiber film exhibits good stability.
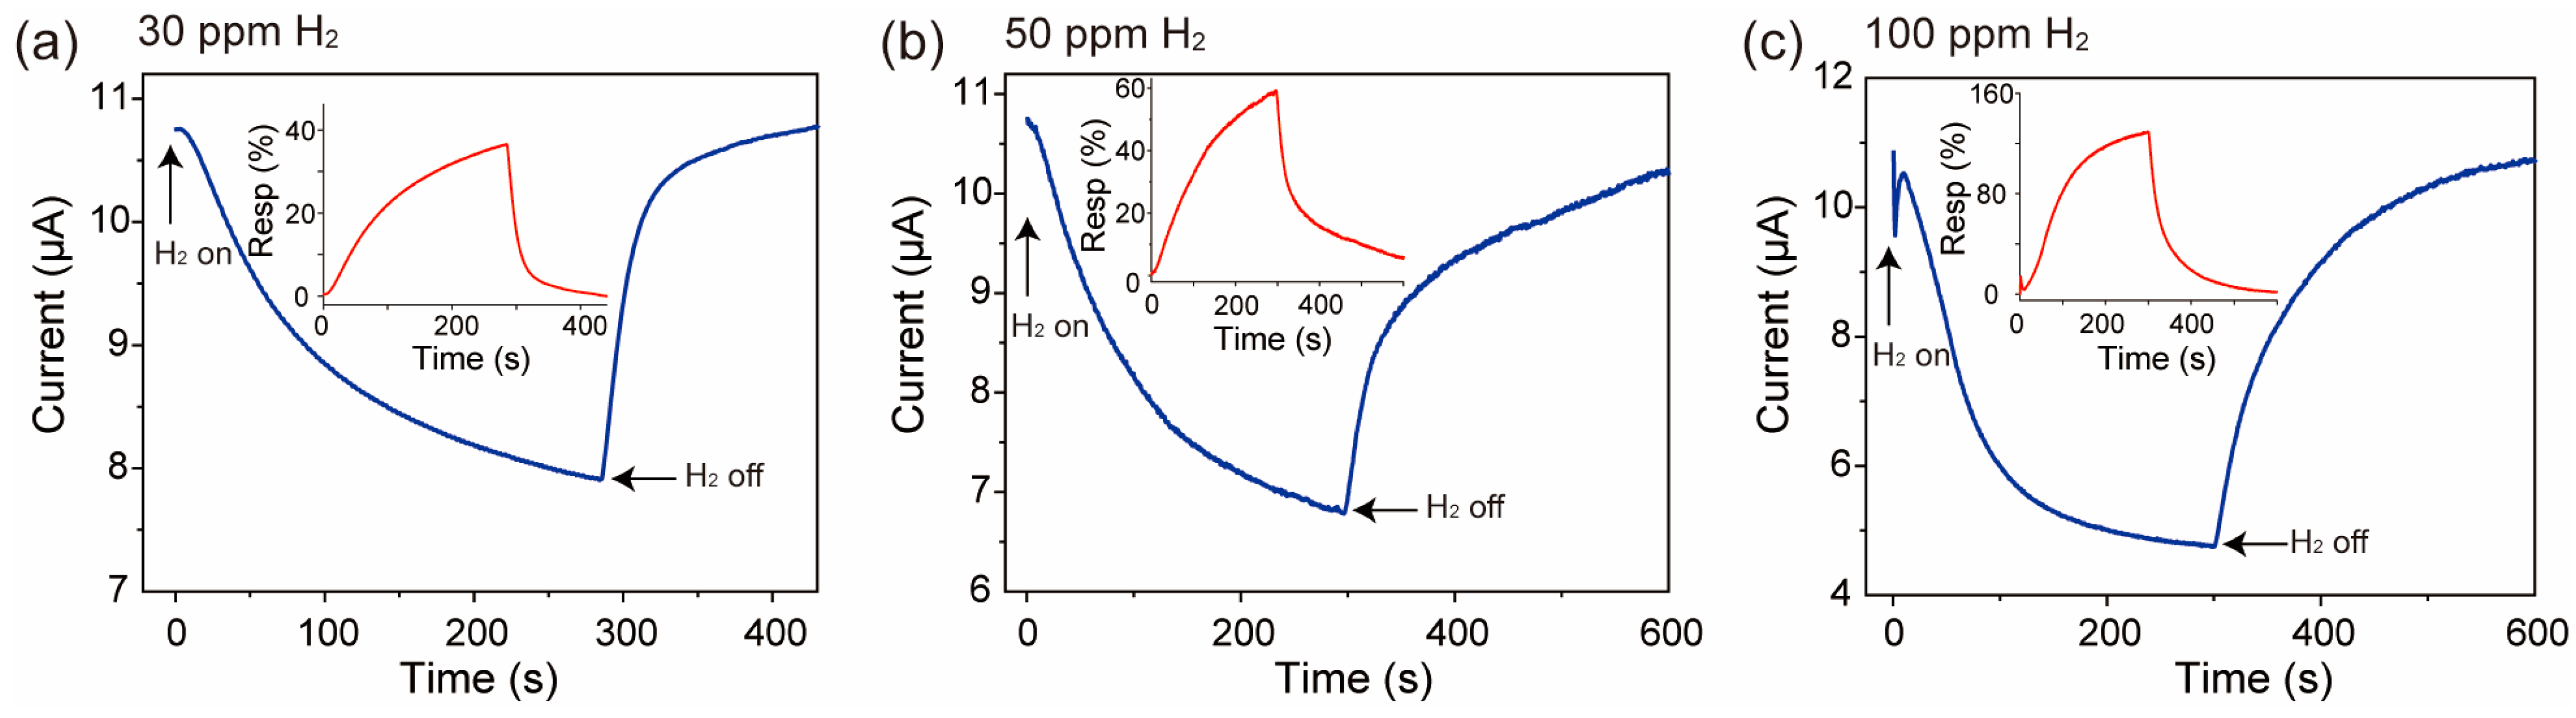
The response of the ZnO nanofiber film to different concentrations of H
2 is shown in
Figure 6, where the current of the ZnO nanofiber film decreasing with the introduction of H
2 concentration at 30 ppm, 50 ppm, and 100 ppm is shown in
Figure 6a–c, respectively. The calculated sensitivity curve is shown in the inset of
Figure 6a–c, where it can be seen that the sensitivity of the ZnO nanofiber film sensor is about 35% at 30 ppm H
2, ~59% at 50 ppm H
2, and ~120% at 100 ppm H
2, and when the H
2 concentration increases in the range of 20 ppm–100 ppm, the ZnO nanofiber film’s gas-sensing response enlarges. This phenomenon proves that the anomaly is not random.
It is commonly believed that ZnO is a typical n-type semiconductor, where the main charge carriers are electrons. When ZnO is exposed to air, oxygen molecules adsorb onto oxygen vacancies on the surface, forming a depletion layer and increasing the resistance of the ZnO. However, in the case of the ZnO nanofiber film, a decrease in current is observed upon the introduction of H
2. When H
2 is removed and simulated air is continuously supplied, the baseline current slowly rises back to the pre-test level, as shown in
Figure 4. This experimental phenomenon contradicts the behavior observed in most experiments and exhibits a reversible reaction process. The surface oxygen vacancies in ZnO are believed to be associated with this phenomenon.
4. Discussion
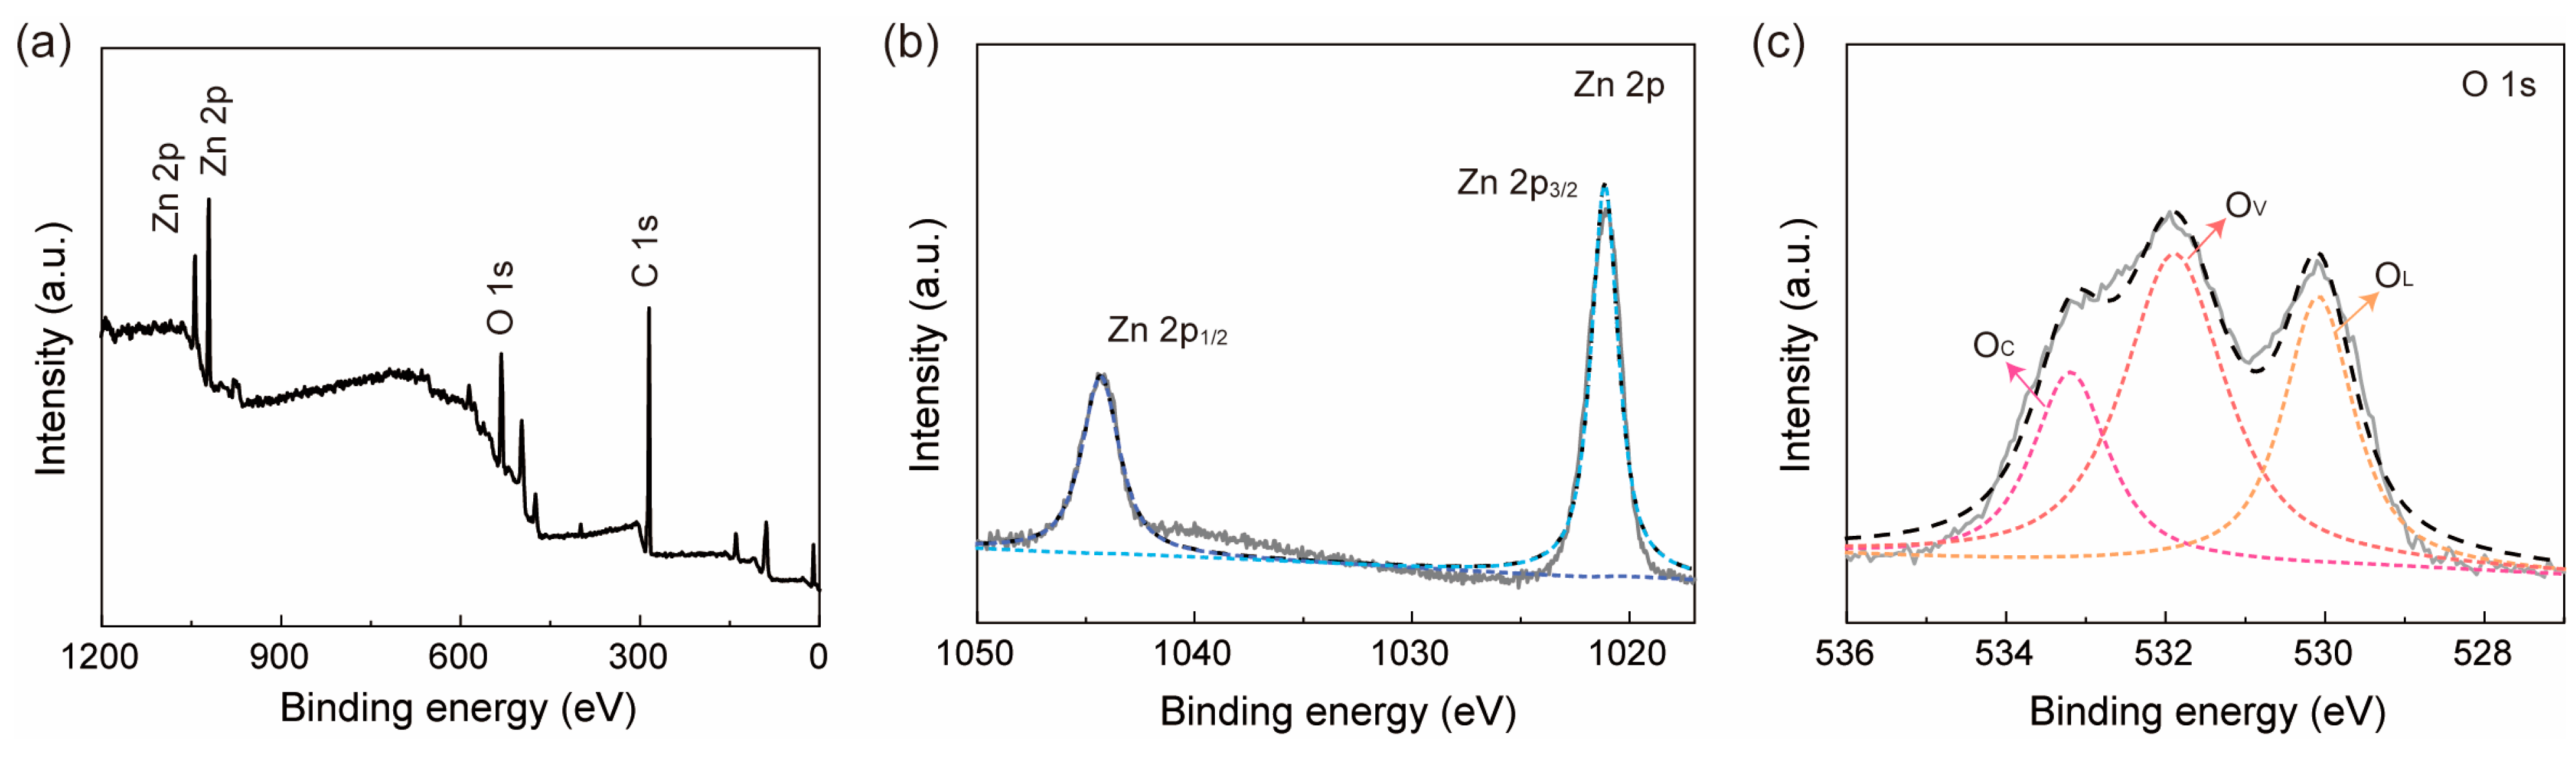
Investigating this abnormal phenomenon that a decreased response current was observed in the ZnO nanofiber film is of great significance for us to understand the H
2 sensing mechanism of ZnO. Through XPS analysis, two elements of Zn and O in the sample were found, as shown in
Figure 7a. No impurities were discovered, indicating a high degree of purity. The C 1s peak at 284.8 eV was used for calibration. As shown in
Figure 7b, the Zn element exists in the valence state of about 2+. The O 1s peak was deconvoluted into three different components: lattice oxygen (O
L) at approximately 530.1 eV, oxygen vacancy (O
V) at around 531.9 eV, and chemically adsorbed oxygen (O
C) near 533.2 eV. It can be seen from
Figure 7c that the proportion of O
C, O
V, and O
L is about 31.06%, 36.52%, and 32.42%, respectively. High oxygen vacancy content is beneficial for the adsorption of gas molecules. Oddly, the binding energy of O
V and O
C is obviously higher than the standard values of O
V (531.1 eV) and O
C (532.2 eV), while the binding energy of O
L is almost the same as the standard value of O
L (530.09 eV) [
21].
Based on the XPS theory, it can be qualitatively inferred that the binding energy of O
L in the ZnO nanofiber film is consistent with the standard value, while the binding energies of O
C and O
V are slightly higher than the standard values. This suggests that the electron density around O
C in the ZnO nanofiber film is slightly lower compared to the standard ZnO, whereas the electron density around Zn in the ZnO nanofiber film is slightly higher than that of Zn atoms in standard ZnO [
22,
23]. The O
2 in the simulated air reaches an equilibrium state with the ZnO surface before introducing hydrogen gas, which macroscopically manifests as fluctuations in the body’s resistance within a certain range. When 20 ppm H
2 interacts with the surface of the ZnO nanofiber film, H
2 molecules will collide with O
L, O
V, and O
C on the surface of ZnO. The electronegativity value of the H(2.2) atom is greater than that of the Zn(1.6) atom [
24], and the H atom obtains electrons from the Zn atom, leading to a decrease in the carrier concentration of ZnO, due to the H atom absorbing on the surface of the Zn atoms. Conversely, O
C will acquire electrons from the H atoms through the reaction between the H atoms and O
C, increasing the carrier concentration of ZnO. The H atoms gain electrons while interacting with H atoms that lose electrons. The collision probability between H
2 and O
V is higher than that of O
C, mainly due to the higher O
V content, and shows an increase in the resistance of the ZnO nanofiber film. When the H
2 gas is removed, the chemical equilibrium of the H
2 reaction is broken due to a sharp decrease in H
2 concentration. H
2 desorbs from the Zn atoms, and O
2 molecules re-establish a new chemical equilibrium. Since there are no changes in O
2 concentration, gas flow rate, and test temperature, the resistance of the ZnO nanofiber film returns to its initial state.
In order to explore the reaction mechanism, first-principles calculations were employed to calculate the charge transfer when hydrogen atoms are adsorbed on the ZnO nanofiber’s surface [
25,
26,
27]. Geometric optimizations were performed using density functional theory [
28,
29,
30,
31]. The generalized gradient approximation (GGA) in the Perdew–Burke–Ernzerhof (PBE) scheme was used to describe the exchange correlation [
32]. For the ZnO bulk, a 3 × 2 × 2 supercell, a 380 eV plane-wave cutoff, and a 2 × 2 × 1 Monkhorst–Pack sampling were used. The system was fully relaxed until the final force on each atom was less than 0.05 eV/Å. ZnO surfaces were modeled by periodic slabs with a 3 × 2 supercell (2 × 2 supercell for ZnO surfaces without vacancies), consisting of six ZnO atomic layers and a vacuum space of 15 Å. The bottom layer was fixed while the other layers were relaxed.
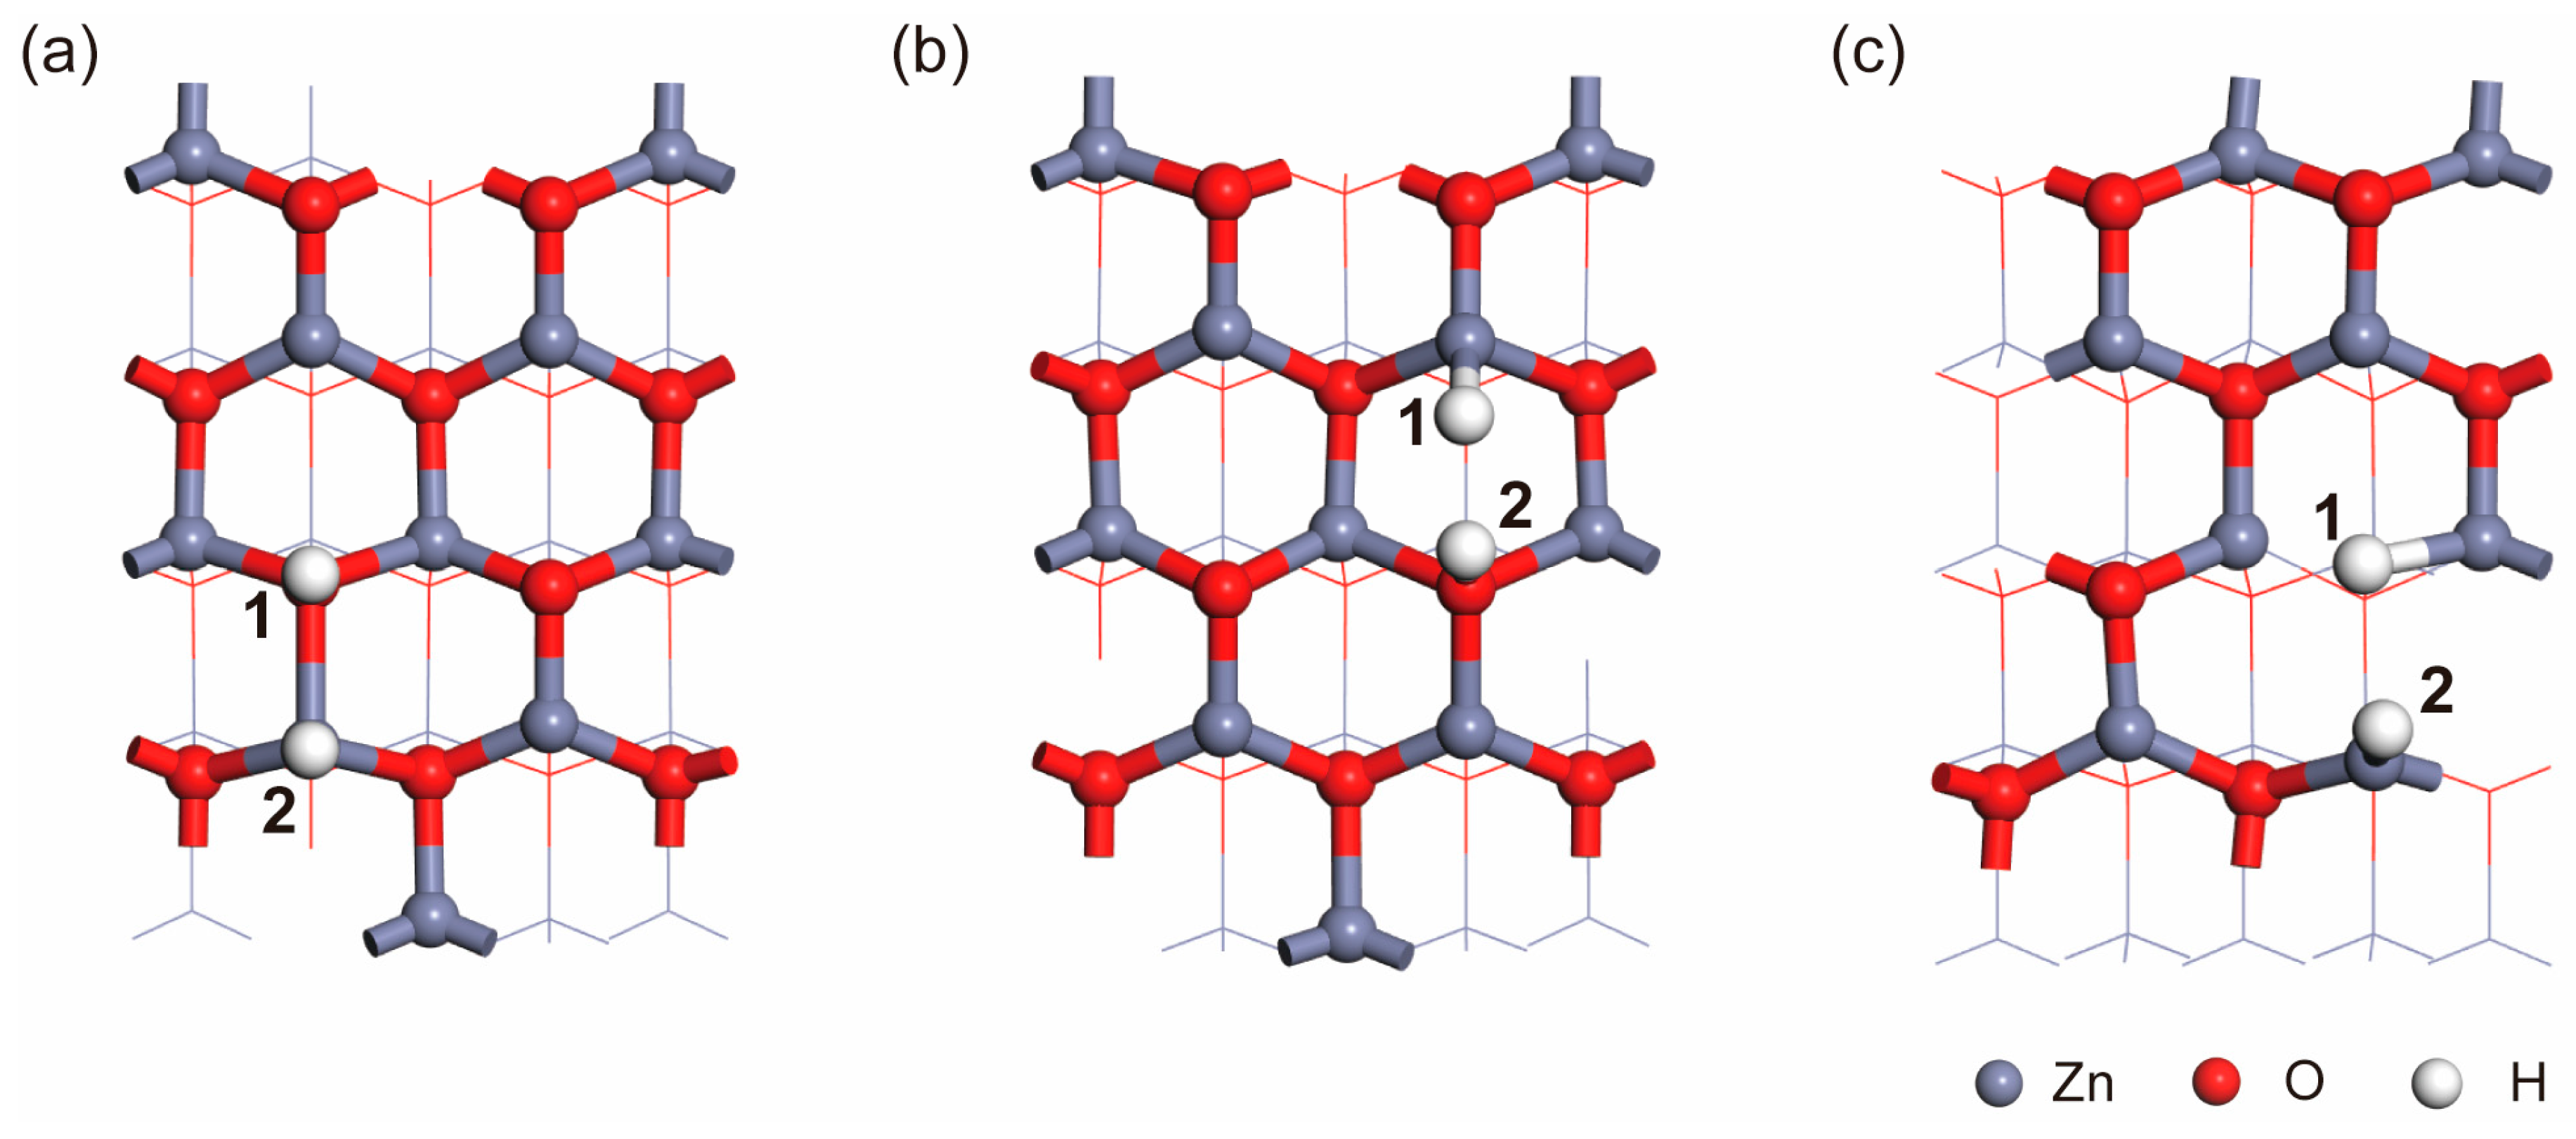
Here, the Milligan charge analysis method was used to calculate the charge transfer during the adsorption of H
2 on the ZnO surface. Two distinct configurations were identified by analyzing the charge transfer [
32,
33,
34], and those configurations are illustrated in
Figure 8a,b. In
Figure 8a, the charge transfer for H1 and H2 is determined to be 0.44 e (electron) and −0.28 e, respectively. In
Figure 8b, the charge transfer for H1 and H2 is found to be −0.34 e and 0.44 e, respectively. We find that H atoms that adsorb on Zn atoms gain electrons, resulting in the generation of H
−, while they adsorb on O atoms and lead to the generation of H
+ through electron loss. Considering the preparation method employed in this study, which results in a significant presence of O
V, the adsorption of H2 at O
V sites was also investigated, as depicted in
Figure 8c [
35]. The calculated charge transfer between H atoms and ZnO reveals that the charge transfer for H1 and H2 is −0.39 e and −0.26 e, respectively. These results indicate that the chemical adsorption of H
2 at the O
V sites on the ZnO surface involves electron gain, which will lead to a reduction in the carrier concentration in the ZnO system. This reduction macroscopically manifests as a decrease in current. The DFT calculations provide further validation of the experimental observations reported in this study.
This article further supplements the physical mechanism of ZnO hydrogen gas sensing. Upcoming work will involve material optimization and a design aspect. First, material morphology can be changed to increase the specific surface area, provide a more active site, reduce the size to two Debye lengths, and further deplete the carrier concentration in the material; these factors are beneficial for improving the sensitivity of the material. Common shapes include hollow spheres, nanotubes, flower-like, thin films, etc. Second, doping elements can be used to improve the morphological and microstructural (introducing impurity level) properties of ZnO. Common doping elements include Al, In, Ag, Ga, Cu, Cd, P, N, Li, etc. Third, decorating with ideal elements can tune the surface defects of the materials, which leads to more oxygen vacancies. Moreover, incorporating noble metal ions with high catalytic activity onto the ZnO nanomaterials could form the Schottky barrier, which improves the selectivity and performance of the sensors. The case in point is noble metals (Au, Pd, Pt, etc.) and non-noble metals (Cu, Co, In, Mg, etc.). Last but not least, chemiresistive sensors based on heterojunctions exhibit enhanced sensitivity because of their grain boundary and a synergistic effect ascribed to the strong interactions between the closely packed nano-units in the composite structure. Heterojunctions are divided into
n-
n heterojunctions (In
2O
3-ZnO, SnO
2-ZnO, WO
3-ZnO, etc.),
p-
n heterojunctions (Co
3O
4-ZnO, NiO-ZnO, etc.), and other structures (ZnO-rGo, ZnO-CNT, ZnO-CNF, etc.). All in all, material optimization will be employed to further enhance the detection limit of hydrogen, reduce the response–recovery time, and improve the stability of the sensor, etc. [
36]. Device optimization and design aspect: The miniaturization of sensors and the integration of multiple sensors are the trends in the development of sensor components; machine learning and other methods will be employed to further enhance the intelligence, anti-interference capability, and different gas resolution abilities of ZnO hydrogen gas sensors [
37,
38].


