Article

Improvement of a Hybrid Solar-Wind System for Self-Consumption of a Local Object with Control of the Power Consumed from the Grid

1
Department of Computer Engineering and Electromechanics, Institute of Engineering and Information Technologies, Kyiv National University of Technologies and Design, Mala Shyianovska (Nemyrovycha-Danchenka) Street, 2, 01011 Kyiv, Ukraine
2
Department of Electrical Power Engineering, Faculty of Electrical Engineering and Informatics (FEI), Technical University of Kosice, Letná 9, 04001 Košice, Slovakia
*
Author to whom correspondence should be addressed.
Energies 2023, 16(15), 5851; https://doi.org/10.3390/en16155851
Submission received: 1 July 2023 / Revised: 23 July 2023 / Accepted: 31 July 2023 / Published: 7 August 2023
(This article belongs to the Section A2: Solar Energy and Photovoltaic Systems)

Abstract

:
Improvement of the principles of the implementation of a hybrid solar-wind system equipped with a battery for self-consumption of a local object, with the control of power consumed from the grid, is considered. The aim is to increase the degree of energy use from renewable energy sources for consumption while limiting the degree of battery discharge, taking into account deviations in the load schedule and generation of energy sources relative to the calculated (forecast) values. The possibility of compensating for deviations in the load schedule and renewable energy sources generation relative to the calculated (forecast) values is shown when electricity consumption decreases and the degree of energy use increases. Compliance of the schedule of the battery state of charge with the calculated schedule is achieved by correcting the consumption of active power according to the deviation of the state of charge with a given discreteness of time. The algorithm of the control was improved by taking into account the measured value of the load power with an increase in the degree of energy use. Also, the use of correction allows you to limit the depth of discharge of the battery at the accepted value. A mathematical 24 h model of energy processes was developed, taking into account the error in estimating the state of charge. The results of the modeling using archival data on renewable sources generation confirm that the proposed solutions are effective. For the considered application with average monthly generation in February, the correction allows reducing electricity consumption by 16–21% and payment costs at three tariffs by 24–27%.

1. Introduction

In recent times, more attention has been paid among owners and in the scientific community to the self-consumption of renewable energy sources (RES) from grid-connected systems with their energy storage increased. Therefore, the review [1] summarizes the existing research on the self-consumption of photovoltaic systems and options for its improvement. To a large degree, the considerations apply to local objects (LO) of the domestic and agro-industrial sectors of relatively low power, while the battery energy storage system (BESS) is usually used to store energy. The application of grid-connected solar-wind (PV-WG) systems is a flexible decision to increase the degree of reliability of access to electricity. In locations with low wind speeds, a photovoltaic battery (PV) is a more reliable source of energy. At the same time, it is advisable to use a wind generator (WG) as an auxiliary source [2] to ensure night generation and equalize winter generation, when the wind speed is higher and the PV generation is reduced. This aims to reduce energy costs during the period of operation in the face of energy carriers’ prices increasing. At the same time, the task of improving the management of the system with RES and BESS, which are used for the self-consumption of LO, is topical. The aim is to ensure a reduction in electricity consumption from the grid with an increase in the degree of the RES’s installed power use when the PV generation deviates from the forecast and the load from the calculated one.
In Section 2, a detailed literature review is presented. The problem statement, devoted to increasing the RES energy use in a hybrid solar-wind system with BESS for self-consumption of LO, is proven, and the primary objectives of the article are described. Section 3 outlines the methodology used for the research of the proposed hybrid PV-WG system with BESS. Section 4 discusses the structure of the hybrid system, the calculation of parameters in setting the schedule of the state of charge of the battery, and the correction of the setting of the power consumed from the grid in the process of forming a given schedule of the state of charge, when the energy generated by RES and consumed by the load deviates from the calculated (forecast) values. Implementation algorithms are proposed. In Section 5, a description of the 24 h simulation of the energy processes is presented. Simulation results are shown in Section 6, and Section 7 focuses on the results of the study on the increasing degree of RES energy use in the hybrid system for self-consumption with a deviation of the energy generated by the RES and the load consumed relative to the calculated (forecast) values when the battery discharge depth is limited. Section 8 concludes the article with a summary of the findings and their implications for future research.

2. Literature Review and Problem Statement

Much attention has been paid to using PV-WG systems to optimize the choice of parameters and control. In most cases, genetic algorithms are used for optimization [3]. The ratio of installed PV and WG powers may be different; therefore, in [4,5], close power values were considered. For the private sector and for the LO of small and medium-sized power consumption, an important limiting factor is the level of WG noise. In this regard, the use of household WG with a vertical axis with a power of up to 8 kW and a wind speed of up to 7 m/s looks promising. The use of WG as an auxiliary energy source with a lower power than the PV ones for low wind speed conditions (3–5 m/s) was considered in [2]. It also becomes possible to modernize the PV system using an auxiliary WG to improve performance. The approach using lower power WG was developed in [6].
The RES generation varies widely during the day. At the same time, the issue of the efficient use of RES and the BESS energy capacity is largely determined by the control algorithm of energy redistribution in the system. This is possible when the forecast of RES generation is used [7]. The use of forecasting of PV and wind generation and electricity demand is considered in [8]. The use of the PV generation forecast for the formation of the reference is considered in [9]. The emergence of special web resources that provide information on the generation of PV, taking into account its orientation on the surface and location, contributes to the possibility of using the RES generation forecast. Such resources as [10,11] also provide wind speed forecasts. At the same time, the forecast has a certain error, which is confirmed by the developers of the program [12]; this factor should also be taken into account.
The control of energy redistribution in the system is usually carried out in the function of current values of powers generated by RES PR and load PL. This determines the charge or discharge of BESS and consumption from the grid by a taken algorithm [13]. At the same time, power consumed from the grid Pg, varies in the wide limits from 0 to PL. Control with active power Pg reference, consumed by LO from the grid, is promising. It will contribute to equalizing consumption from the grid in time with the possibility of restricting it during peak hours [14]. Reference of Pg is carried out by forecast of RES generation for a calculated schedule of load. At the same time, the task of forming a schedule of the BESS’ state of charge SoC(t) is solved from the condition of the depth of discharge (DoD) limiting and compensating for energy consumption from the grid during peak times. However, the deviation of the actual load power relative to that calculated and RES generation relative to the forecast values are not taken into account. As a result, RES energy is not fully utilized, thereby limiting its potential to reduce consumption from the grid.
The reduction in grid-based electricity costs is determined mainly by the tariffication of payment. An analysis of the impact of the electricity price profile on energy exchange planning within the microgrid is presented in [15]. Four different tariff structures are used, including peak and off-peak electricity rates, fixed constant prices, dynamic pricing that adjusts based on demand and electricity generation, and a virtual tariff. In [16], the optimal size of batteries for home consumption is considered in combination with the smoothing of peaks at the district level. The exclusion of consumption from the grid during peak hours with three-zone tariffication was considered in [17]. The energy of the BESS, accumulated during the day, was used at the evening peak.
Interaction with the grid also involves solving issues of electromagnetic compatibility using multifunctional grid inverters [18,19]. In addition to providing a power factor near to 1 at the common coupling point (PCC) to the grid, additional possibilities arise, in particular, the regulation of the active power drawn from the grid [20]. When using a multifunctional inverter in a PV-WG system with a BESS, a control system with several channels can be used [20,21]. These are the channels for controlling the currents of the BESS, PV, and current at the PCC to the grid. WG is usually used in the maximum power point tracking (MPPT) mode and operates irrespective of the control system of the converter unit [2]. Depending on the mode, one channel is used, which provides stabilization of voltage in the DC link of the inverter [9].
At the stage of design and development of systems with RES, mathematical modeling is widely used. This allows conducting the research in various conditions without being tied to the current season of the year. Therefore, in [22], a combination of laboratory experiments with virtual simulation was considered. The MATLAB R2022a software package is often used for this purpose. For systems with RES, models in the daily cycle of 24 h are widely represented and several solutions are presented on the website [23,24]. Various approaches are used to accelerate the modeling process. In order to accelerate the process of simulation, the Phasor solution from Specialized Power Systems was used in [25].
At the same time, electromagnetic processes of energy conversion are excluded from consideration, and modeling is carried out according to the fundamental harmonic. A similar approach was discussed in [26]. In [2,13], the modeling of energy processes in the system with the evaluation of indicators was considered; this presupposes formalization of the description of processes in steady-state modes [2] in accordance with the used operating modes and the algorithm for switching them. The setting of RES generation, at the same time, can be carried out according to archival data [27]. BESS is the important element of the model, the mathematical description of which is based on the characteristics of charge and discharge, set by the manufacturer graphically [28]. The expressions are used, as proposed in [29] and in the majority of publications, as well as at the MATLAB library. The technique of parameter calculation was considered in [30]. The model takes into account the change of the BESS charge mode (with taken current and at constant voltage) was considered in [2], but the setting of discharge characteristics was used in tabular form, which implies its refinement. The refined BESS model is described in [31].
Thus, the issues of realization of a promising version of a hybrid PV-WG system for self-consumption of LO, in which PV is the main source and WG is used as an auxiliary, have not been sufficiently studied. There are a number of issues: implementation of a control mechanism with the regulation of the active power consumed from the grid; forming of SoC(t) curve of BESS with correction of the power value consumed from the grid, by deviation of the actual SoC(t) value, to compensate for load deviations and actual generation of RES relative to the calculated (forecast) values; development of the 24 h model in accordance with proposed solutions for research in conditions close to real.
The aim of the article is to increase the level of use of RES energy in a hybrid PV-WG system with a BESS for self-consumption of LO, while limiting the degree of battery discharge, taking into account deviations in the load schedule and generation of RES relative to the calculated (forecast) values, which is achieved by improving control with the regulation of the power consumed from the grid.
The basic objectives of the research are as follows:
  • to substantiate the structure of the system with the control of power which is consumed from the grid and the implementation mechanism;
  • to study the possibility of compensating for deviations in the load schedule relative to the calculated and actual generation of RES relative to the forecast. To substantiate the mechanism of the calculated curve SoC(t) formation with the correction of the value of consumed power by the deviation of the actual value of the SoC;
  • to formulate algorithms for the control system functioning;
  • to refine the energy processes model “24 h” in the system, taking into account the peculiarities of the implementation of control and the error in estimating the value of the SoC. To explore the possibilities of the proposed solutions in different weather conditions.

3. Materials and Methods of Research

The methods of analysis of energy processes in the electrical circuits were used. The additional possibilities to reduce consumption from the grid while increasing the degree of RES energy use are tied to the control of the PV-WG system with reference to the power consumed from the grid according to the forecast of RES. The mechanism for implementing control by setting the power consumption takes into account the deviation of the forecast data relative to the actual generation of RES and the load relative to the calculated schedule and involves the formation of the SoC(t) schedule. This can be provided by correcting the power consumption setting by the deviation of the measured value of the SoC from the calculated value of the SoC at fixed points in time. The calculated value of the SoC(t) is determined by the calculated load schedule and the forecast of RES generation at the beginning of the day. At the same time, the hypothesis is accepted that the power setting at the corresponding time intervals is determined by the average value of the load power. That is, the distribution of the load over time (with the limitation of the maximum value) may differ from the calculated load schedule with the same value of the energy consumed.
With regard to the converter unit control system, a dual loop structure using stabilization of voltage in the DC link to ensure power balance was considered. In this case, one of the currents is regulated: BESS (IB), PV (IPV), and current at the PCC (Ig). The setting of active power Pg consumed from the grid is carried out according to the amplitude of the current Igm at the power factor at the PCC close to 1. WG control is independent in maximum power mode.
The analyses of energy processes were carried out for the steady-state modes on the level of active power for a 24 h cycle. Transient processes were taken into account during the change of the mode of operation, and energy losses were accounted for during the efficiency calculations. The modeling was performed in the MATLAB software package tested for this class of problems using real archival graphs of RES generation. The model uses the analytical expressions available for steady-state modes of operation, which are based on the generally accepted and proven methods of calculation. The properties of the BESS were set in accordance with the charge and discharge characteristics according to the data sheets. Changing modes and corresponding calculation expressions are carried out at time intervals with the introduction of auxiliary variables that take into account the value of the system parameters. At the same time, the possible deviation of RES generation from the forecast data (+10%, −20%) and the energy consumed by the load from the calculated schedule were taken into account. The error of the SoC value (±5%) measurement was also taken into account.

4. Research Results

4.1. Structure of PV-WG System

The structure of the PV-WG system (Figure 1) is made using well-known principles based on the use of a multifunctional grid inverter (VSI) [2,20]. WG, PV, and BESS are connected to the DC bus at the VSI input by means of appropriate voltage converters. The battery voltage converter CSB provides a controlled charge/discharge of the battery and has double-sided conduction. The WG operates independently and uses a CWG converter with an MPPT controller. The PV voltage converter (CPV) provides operation in the MPPT mode or with generation power regulation [2]. The system of automatic control provides stabilization of the voltage Ud in the link of DC [2,20]. The change of the structure, as well as the formation of current references, are provided by the control unit (CU) in accordance with the algorithm discussed below.
The calculation of the parameters and setting of the modes are carried out by the CPC unit in accordance with the forecast values of RES powers PR = (PPV + PW), the calculated load graph PL(t) and the measured value of the load power, and the accepted time intervals (T); the state of charge (SoC) of the BESS or Q* = 100Q/QR ( Q = I B d t —BESS charge, QR = CB—rated capacity, Ah). The Wi-Fi unit (WFM) [2] is used to obtain forecast data from a web resource. The algorithm that is implemented by the CPC, including the formation of the graph Q*(t) and the correction of the Pg setting, is discussed below.
The control system contains three channels [2]:
-
the PV generation control. Ensures the maintenance of the setting value of the PV current I1PV in the MPPT mode or from the proportional-integral (PI) controller VCIPV when regulating the PV generation [20];
-
the BESS charge control. Ensures the maintenance of the set current value I1B from the PI-controller of the VCIB or a fixed value from the CU;
-
the current of the grid Ig control (setting the power consumed from the grid). Ensures the maintenance of the set current value at the PCC, taking into account the phase currents of the inverter iCa,b,c and the load iLa,b,c [2,20]. This is provided by the CS inverter control system with a phase-locked loop (PLL). At the same time, in the PCC a power factor is maintained close to 1. The setting of the current amplitude I1gm is provided by the PI—controller VCIg or from the CU.
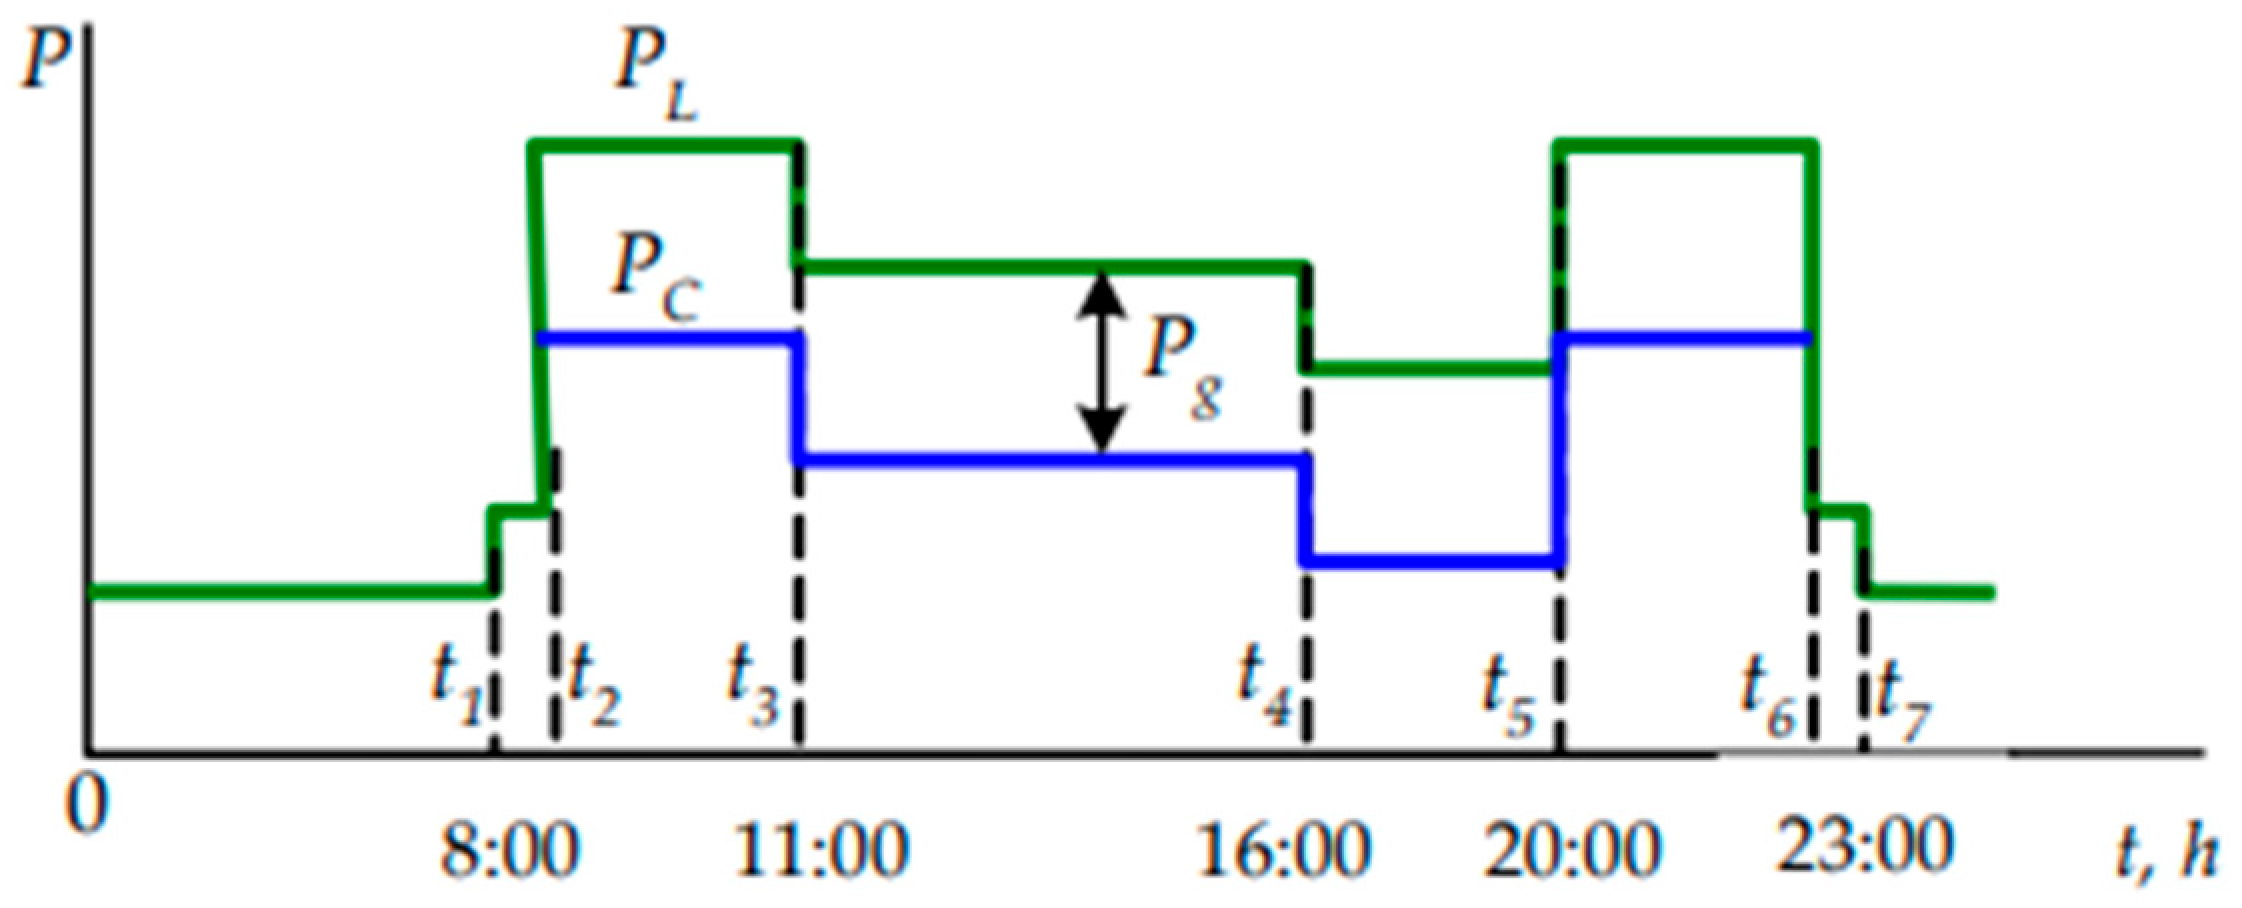
The PV-WG system use with a predominance of PV energy makes sense for LO with a daily load (interval (t2, t6) in Figure 2). Load schedule PL(t) has well-defined (morning—(t2, t3) and evening—(t5, t6)) peaks. We will proceed from the energy consumed by the load at time intervals. Usually, in terms of time, this is tied to the tariff zones (Figure 2) of payment for electricity [2,6]. We assume that when setting the value of the power consumed from the grid on the interval, the nature of the change in the load power within the accepted energy value does not affect the value of the BESS charge degree formed at the end of the interval. At the same time, the calculation schedule PL(t) sets the maximum average value of load power at the corresponding time interval. Value PL = PC + Pg and is provided by the output inverter power PC (energy of PV and BESS) and power Pg of consumption from the grid (Figure 2).

4.2. Setting the Value of the Power Consumed from the Grid and Correcting Its Value

The setting of the power consumed from the grid Pg is carried out according to the forecast in accordance with the intervals of the load schedule (Figure 2). It is also taken into account that, in accordance with the forecast, at night, the BESS may not be charged at all, or it may be carried out at the expense of excess RES energy and using the energy of the grid.
Consider a variant with the exclusion of consumption from the grid during peak times Pg23 = Pg56 = 0 while reducing day consumption. This is achievable by choosing the energy capacity of the battery WB from the condition of sufficiency to compensate for consumption in the evening peak (t5, t6) [2]. At the same time, the energy given off by the battery is
ΔWB56 = 0.01ΔQ*56·WB ηC·ηB,
where WB = UBCB, ηC and ηB are the converter and battery efficiency, and ΔQ*56 = (Q*6 − Q*2) is the battery discharge degree.
When calculating the Pg values for load schedule intervals (Figure 2), the Q* reference values at the beginning of the corresponding interval (Q*2, Q*3, Q*4, Q*5, Q*6) are used, and the problem of forming the schedule Q*(t) or SoC(t) is solved.
In summer, when the wind is absent and the PV generation energy at the interval (t5, t6) is WPV56→0 at DoD = 80%, taking into account the duration of the evening peak of 3 h, the value ΔQ*56 = (Q*6Q*5) = 60% is sufficient. If value ΔQ*23 20%, then 20% (Q*2R = Q*6) 40% (Q*2R—reference value). It is the real situation when the PV generation is sufficiently high (battery degree charge ΔQ*24 > 0). During the winter–spring–autumn period (where the duration of the evening peak is 4 h at the same peak load), this condition is fulfilled only with high WG generation in peak hours. When the wind is absent, ΔQ*56 = 80%; accordingly, the value ΔQ*23 = 0%, which is not real. Therefore, a night charge from the grid is necessary for the BESS.
In the case when the night charge of the BESS is not required and the energy of RES at night is not enough to charge the battery, herewith (Q*2R = Q*6), and taking into account the condition specified above, it is necessary to ensure that the required value is achieved by Q*5 = Q*6 + ΔQ*56. Even with a high generation of RES during the morning peak, a battery discharge with a drawdown of ΔQ*23 = (Q*3Q*2) < 0 can occur. Therefore, to maintain the accepted DoD value, the minimum value is
Q * 2 R = ( Q * 2 M I N + | Δ Q * 23 | + δ ) , i f Δ Q * 23 < 0 ( Q * 2 M I N + δ ) , i f Δ Q * 23 0 , ,
where δ = 5–7% is a margin, taking into account that the decrease in ΔQ* in the interval (t2, t3) may exceed ΔQ*23, and with ΔQ*23 ≥ 0, the intermediate value may be negative.
The value ΔQ*23 is
Δ Q * 23 = W R 23 · η C W L 23 0.01 W B η C η B ,
where WR23 = (WPV23 + WW23) is the total RES generation in the interval (t2, t3), WL23 is the energy which is consumed by the load.
In accordance with value ΔWB56 = WL56WR56·ηC ΔQ*56 and Q*5 are determined. The value of ΔQ*24 is determined in the same way as ΔQ*23. Reducing the state of charge of BESS,
Δ Q * 45 = k W R 45 · η C W L 45 0.01 W B η C η B ,
where k—degree of underutilization of RES energy.
BESS charge in the values zone (Q*4, Q*5) is carried out at Q* > Q*d (value Q*d corresponds to the beginning of mode of BESS charge with constant voltage) with a current limitation determined by the charging characteristic. In accordance with this, at PR·ηC > PL regulation (reduction) is carried out of PPV from the condition of power balance ensuring. That is, there is an underuse of RES energy. If take into account the possible incomplete use of RES energy at intervals (t4, t5) can be accepted:
k = 1 ,   if   W R 45 0.5 W L 45 0.75 if   W R 45 > 0.5 W L 45 .
If value ΔQ*45 0, then Q*4 = Q*5 − ΔQ*45 and acceptPg45 = 0. On the other hand, Q*4* = (Q*2R + ΔQ*24). If Q*4* ≤ Q*4, then it is necessary to consume from the grid when
P g 34 = Δ W B 34 + W L 34 W R 34 · η C ( t 4 t 3 ) ,
where ΔWB34 = 0.01 ΔQ*34WB/ηC·ηB, ΔQ*34 = Q*4Q*3 = Q*4 − (Q*2R + Q*23).
If Q*4* > Q*4, then Pg34 = 0 and value Q*5, and, accordingly, Q*6 will be higher than calculated. This situation is exceptional and is possible at maximum wind speed.
If ΔQ*45 0, then Q*4 = Q*5 + ΔQ*45. At Q*4 < 100% accept Pg45 = 0. If Q*4 ≤ Q*4, then power Pg45 is determined accordingly (3). Otherwise, Pg34 = 0. At Q*4 100% accept value ΔQ*45 = (100 − Q*5) and determine as
P g 45 = Δ W B 45 + W L 45 k · W R 45 · η C ( t 5 t 4 ) .
When the night charge of the BESS is necessary, at ΔQ*24 0 the value is set to Q*2R = 100%, Pg23 = Pg56 = 0. In Formula (4)—ΔWB34 = 0.01ΔQ*34WB/ηC·ηB, ΔQ*34 = |ΔQ*23|, Δ Q * 23 = W R 23 · η C W L 23 0.01 W B η C η B .
At ΔQ*24 = 0 value is Pg34 = 0.
The value Pg45 is determined at ΔQ*45 = (100 − Q*5) and the required value Q*5 = Q*6 + ΔQ*5.
At ΔQ*24 > 0 value is Pg34 = 0. For maximum RES energy use and BESS energy intensity, Q*2R is decreasing Q*2R ≥ 100 − ΔQ*24 and must meet the condition (1). If Q*2R > Q*6, an overnight charge is required.
The possibilities of night charging of the BESS only at the expense of RES energy or with additional energy consumption from the grid are discussed below.
The correspondence of the actual values of Q* to the SoC(t) schedule adopted in the calculation is only possible if the values of the energy consumed by the load WL are equal to the calculated values at time intervals and the RES generation WRA corresponds to the forecast WRF. Using calculated Pg values at WL and WRA deviations will result in a corresponding deviation of Q*(t) from the calculated value. With a decrease in WL or WRA > WRF, the battery will be charged earlier, which will lead to a limitation in the generation of the PV and, accordingly, to a decrease in the degree of use of its energy. The energy consumption from the grid will remain at the calculated value. With an increase in WL or WRA < WRF, the Q* value decreases, which will lead to an increase in DOD up to 100%, which is unacceptable.
This can be eliminated by changing the value of Pg. In this case, Pg is an adjustable parameter, the impact of which can be assessed by the deviation of Q* from the calculated schedule Q*(t). With a sufficiently large capacity of the battery, the rate of change of Q * is small. This makes it possible to carry out the correction of the value of Pg discretely with a step Δt. The value of Δt can be tied to the discreteness of the RES generation forecast (0.5 h). It is important that, in this case, the correction of the Pg value is carried out according to the RES energy and the load during the time Δt, while the current values of PL and PR can vary widely.

4.3. System: Operation Modes

The generation of WG in all modes is set by its controller in the MPPT mode. At this point in time, one of the three controllers is used: (VCIPV, VCIB, or VCIg), and the references of the other two currents are fixed [2]:
-
interval (t2, t3). PV works in MPPT mode and PR = PRM. BESS current is set by VCIBI1B. Reference of the current amplitude in PCC I1gm = 2 Pg/3Ug (Ug—phase voltage) is calculated and fed to the input of the unit of the current reference of the grid inverter.
-
interval (t3, t5). At Q* < Q*d, the mode of operation is saved. At Q*Q*d, the BESS current is determined using its characteristic of charge IB(Q*). If the given value I1B> IB(Q*), then VCIB turns into saturation. Excess energy, which cannot accept the BESS, leads to an increase in voltage Ud on input VSI above the taken value U1d. When the switching threshold is reached UdH = (U1d+ ΔU) VCIPV is turned on and reduces I1PV (PPV). That is, we have a second condition for switching controllers while excluding the impact of transients [2]. If PC→0 and Q*Q*d VCI1gm is used, which provides regulation (reduction) Pg at maximum RES generation. That is, the full use of the RES energy is ensured.
-
interval (t5, t6). PC56 = (PLPg56) = PB + PRM·ηC. The value is given Pg56 (I1gm), PV is in the MPPT mode, and the BESS current is set by VCIB.
-
interval (t6, t2). A prerequisite is the charge of the BESS at PR·ηC ≥ PL. The value Q*6Q*MIN and the night charge of the battery is carried out up to the value Q*2R, determined by the forecast for the night Q*2n = (Q*6 + ΔQ*62) and next day Q*2+1. A higher value is accepted.
If the value Q*2n is higher, then the value of BESS current is determined by a current ratio of the powers of RES and load. The option is considered when to save the accepted DOD, and the possible discharge of the BESS at certain time intervals is excluded. Current value is
I B 62 = P R M · η C P L U B ,   if   P R M · η C > P L , 0 ,   if   P R M · η C P L .
In this case, at IB62 > 0, Pg = 0 is set, and VCIB is in operation. With a decrease in PRM·ηC ≤ PL and current IB to 0, the power balance is disturbed, and there is not enough renewable energy. The missing energy is taken from the capacitor in the linked DC and voltage Ud decreases to a threshold value UdH (U1d− ΔUd). This causes the switching of the controllers: on the input of reference of BESS current, the constant IB62 = 0 is supplied. The output of VCIg connects to the input of reference of grid current and supports the value Pg = (PLPRM·ηC) in order to make a value Ud close to the taken value U1d. With an increase in PRM·ηC and the BESS charge absence, there is an excess of energy, which leads to an increase in Ud followed by a reverse switching of the controllers.
If the value Q*2+1 is greater and the RES energy is not enough, the BESS current is set as
I B 62 R = 0.01 C B ( Q * 2 R Q * 6 ) Δ t > 0 ,
where Δ t = ( t 2 - t 6 - 0.5 ) , i f Q * 2 R Q * d ( t 2 t 6 ) , i f Q * 2 R < Q * d .
If Q*2R ≥ Q*d, then the current value is slightly overestimated, taking into account the time of completion of the charge at constant voltage (accepted 0.5 h) and a corresponding reduction in BESS current according to the charging characteristic.
Possible situations:
(a)
value PRM·ηC > PL, and the value of the charge current I B 62 = P R M · η C - P L U B exceeds the required value, accordingly Pg = 0;
(b)
value PRM·ηC > PL, and the value of the charge current I B 62 = P R M · η C - P L U B is less than the required value. This involves consumption from the grid Pg > 0. A similar situation is with PRM·ηC ≤ PL.
In this case, the BESS current is set by a constant, and the power consumed from the grid is supported by the controller VCIg and value Pg = (PRM·ηCPLPB) 0.
In the case of (a), the controller VCIg goes into negative Pg < 0 (limitation Pg = 0), the balance of powers is disturbed, and voltage Ud increases. This causes the comptrollers to switch: reference Pg = 0, VCIB sets the current of the BESS. With a decrease in PRM·ηC, the BESS current decreases and is fixed at a predetermined value (restriction applies VCIB IB ≥ IB62R). The energy becomes insufficient, which leads to a decrease in Ud and subsequent switching of controllers.
If Q*2R = Q*6 and no charge is required, then the value of the BESS current is determined by the current ratio of the RES power and load.
WFM provides data on the forecast of the RES energy for a given coordinate of the LO with a discreetness of 1 h or 0.5 h: wind speed and PV power generation PPV. Wind speed is converted to power PW [2]. Based on this data, the RES generation values are calculated WR for i intervals of duration 0.5 h (from 00:30 to 24:00).

4.4. Algorithm for Changing the Structure of the Control System and Parameters Calculation

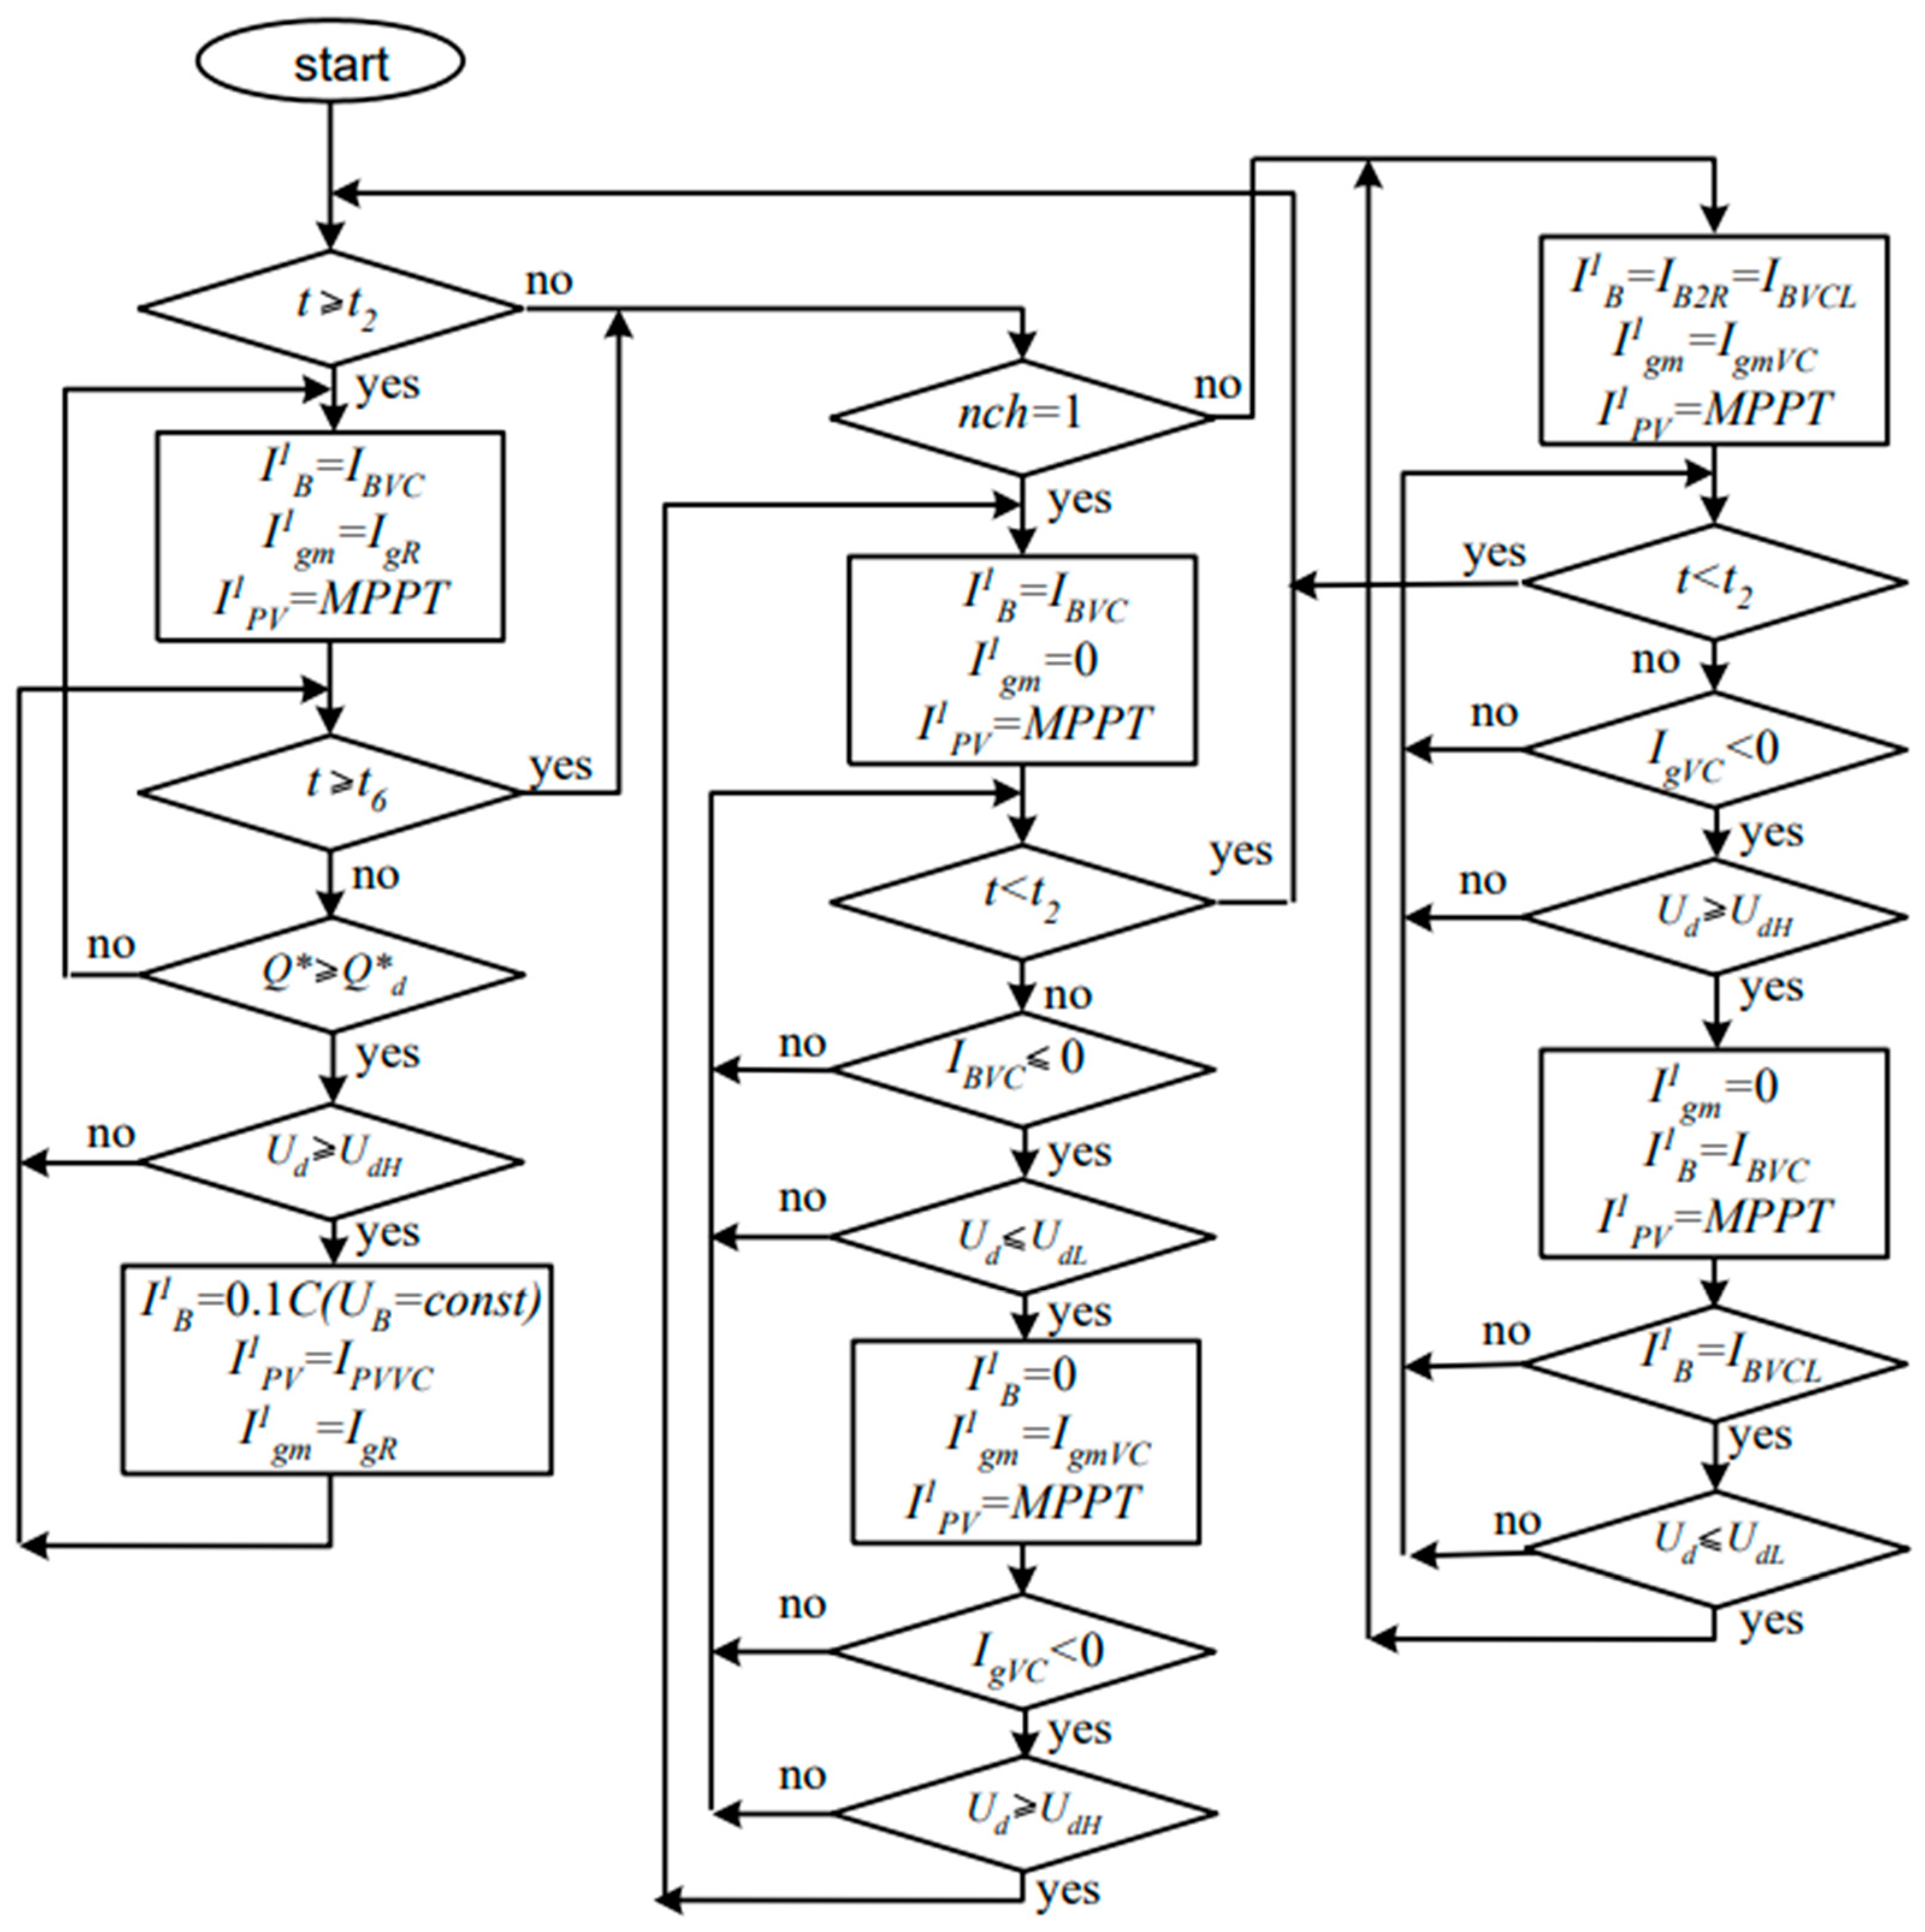
A block diagram of the algorithm for implementing changes in the structure of the control system is presented in Figure 3. Input values are: taken distribution of time intervals, the measured value of Q*, the current value of PgR, and the mode of night charge of BESS.
The output values are states of switches of signals of current references. In this case, the following designations are adopted: I1B = IBVC—current value of BESS is set by controller VCIB, I1B = IB2R = IBVCL—current value of the BESS is set by the lower limit of the controller VCIB, I1PV = IPVVC—the value of the PV current is set by controller VCIPV, I1PV = MPPT value of the PV current is set by the MPPT controller, I1gm = IgmVC—the value of grid current is set by controller VCIg, nch—night charge of the BESS (nch = 1 is determined by Q2n, nch = 0 is determined by Q2+1).
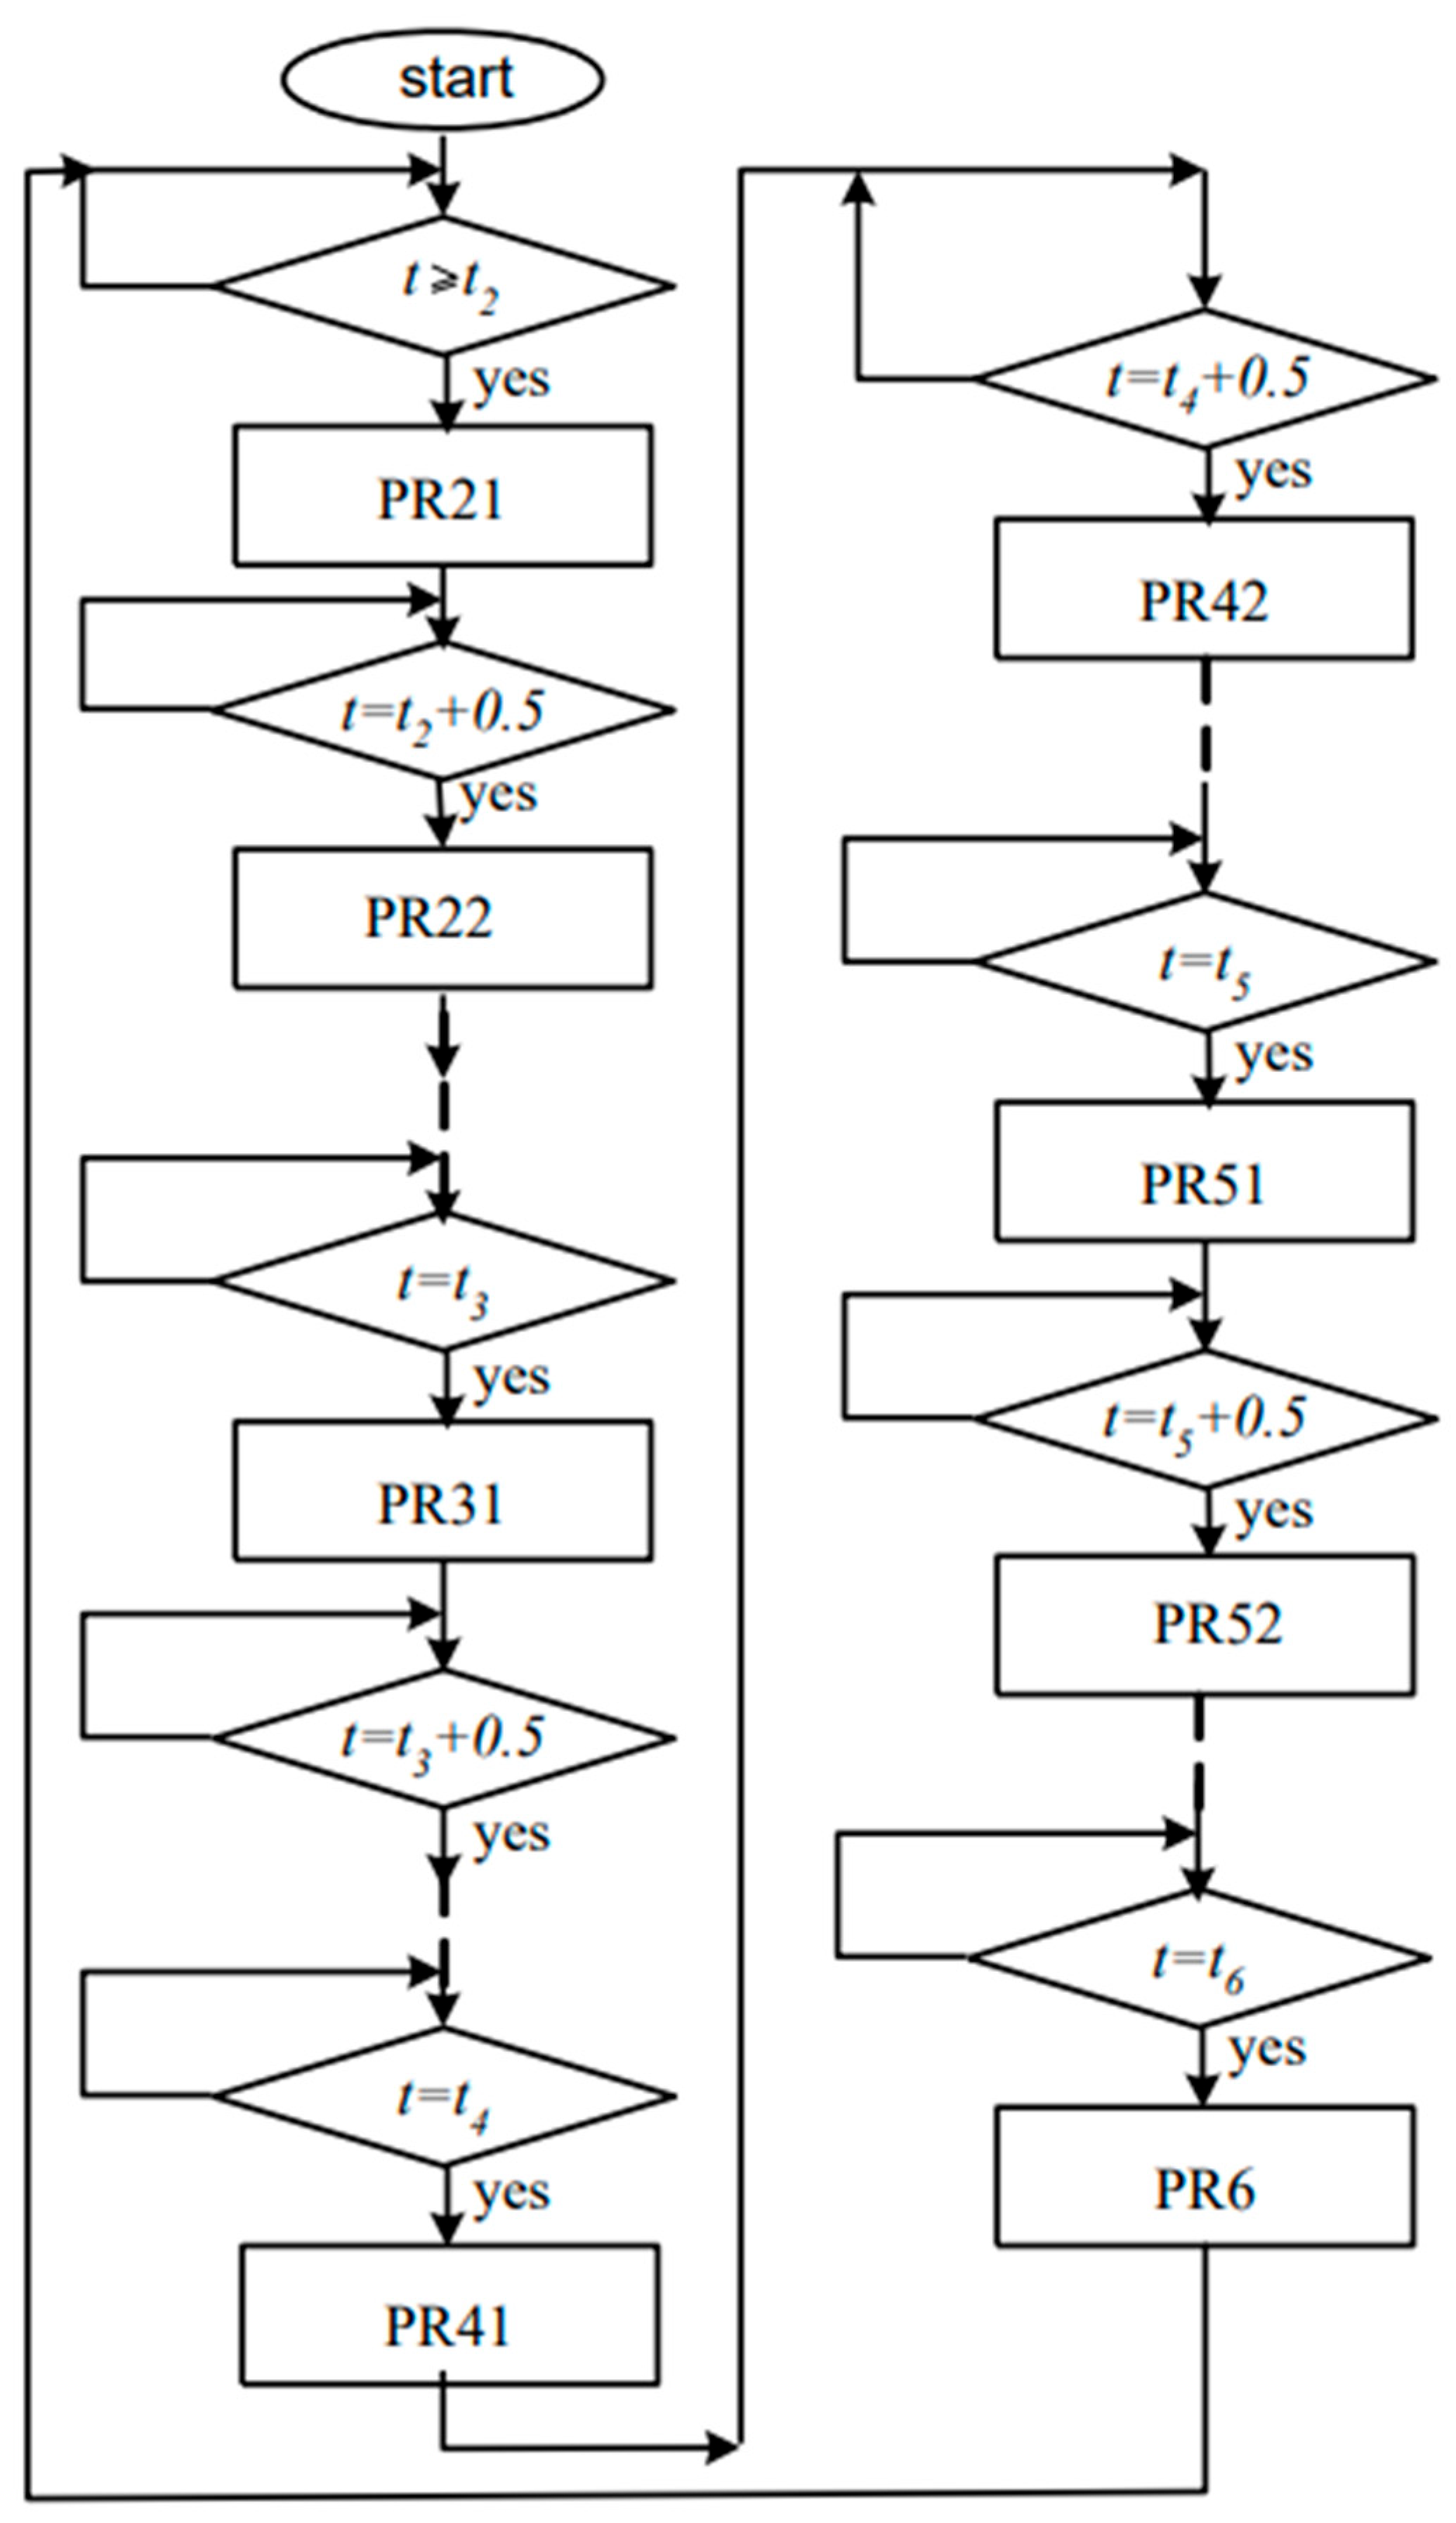
The block diagram of the calculation algorithm is shown in Figure 4. Input values are: the distribution of time intervals, the measured value of the Q*, value of RES generation WR for 0.5 h intervals, and the calculation of load schedule PL(t). Output values are the current value of PgR taking into account the correction, the mode of night charge of BESS. Units PRi include the corresponding calculations. The use of correction only on the interval (t2, t6) is considered.
The time moment is t2. The PR21 block calculates the value of the change in the degree of charge over an interval of 0.5 h ΔQ*2 by the RES energy and the calculated values of load consumption and PgR23 in this interval (0.5 h). The value of Q*2 is equal to the measured one and, accordingly, PgR = PgR23 = 0 (index R—given value).
At the time (t2 + 0.5), we have block PR22. The value of the change in the degree of charge for the interval of 0.5 h ΔQ*21 is calculated. The set value of Q* for this interval is Q*(2+05) = Q*2 + ΔQ*2. In accordance with the deviation of the set and measured values Δ = (Q*(2+05)Q*M(2+05)) ΔPgR is determined and the setting for this interval is PgR = PgR23 + ΔPgR.
At the time (t2 + 1), we have block PR23 and then the next, PR24, … for subsequent times (t2 + 1.5), and so on, until time t3 implements functions similar to block PR22.
The time moment is t3. Unit PR31 includes calculations of WR34, PgR34, and values of changes of charge degree during the 0.5 h ΔQ*3 by RES energy, calculation values of load consumption, and PgR34 at this interval (0.5 h). Value Q*3 is equal to that measured and, respectively, PgR = PgR34.
At the time (t3 + 0.5), we have block PR32. The value of the change in the degree of charge over the interval 0.5 h ΔQ*31 is calculated. Given the value Q* for this interval Q*(3+05) = Q*3 + ΔQ*3. In accordance with the deviation of the taken and measured values Δ = (Q*(3+05)Q*M(3+05)) ΔPgR and reference for this interval PgR = PgR34 + ΔPgR are determined.
At the time (t3 + 1), we have block PR33 and then the following PR34, … for subsequent points of time (t3 + 1.5) and so on till time moment t4 implement functions similar to the PR32.
Some peculiarity has the calculation of Q* when the value Q*d is reached. When the value of (Q*d − 2%) < Q*3+05i < (Q*d + 2%) at a point in time t3+05i Δt1 = (t4 − t3+05i) is determined and a number of intervals by 0.5 h τ = Δt1/0.5. At τ = 2 value of Q* at the next interval we take Q*3+i05 + 0.75 ΔQ*Q* = (100 − Q*3+i05)) and then t4 = 100%. At τ > 2 increments in the degree of charge at the following intervals ΔQ*/2, ΔQ*/3, ΔQ*/4, …, t4 = 100%.
Point of time t4. Unit PR41 includes the calculation of WR45, PgR45, and the values of the change in the degree of charge over the interval 0.5 h ΔQ*4 by RES energy, calculation values of load consumption, and PgR45 at this interval. The value of Q*4 is equal to the measured and, accordingly, PgR = PgR45.
For units PR42 and PR43, calculate the value of the change in the degree of charge over the interval 0.5 h, ΔPgR and reference for this interval PgR = PgR45 + ΔPgR.
Similar functions are implemented on the interval (t5, t6).
Point of time t6. No correction. According to the forecast for the next day, it is calculated as Q*2+1 и Q*2n. If Q*2nQ*2+1, then nch = 1 is set. If Q*2n < Q*2+1 (nch = 0) value IB62R is determined.

5. 24 h Simulation of Energy Processes

The initial data are the data of the archive of PV generation [19] in the MPPT mode PPVM(t). For WG, the power is set by intervals according to the average month values. Values of powers PL(t), PgR(t), PW(t), and PPVM(t), and the calculation schedule Q*R(t) are set in tabular form. The error of Q* measuring is accepted as constant ±5%, and the measured value is Q*M = 0.95Q* or Q*M = 1.05Q*. At the moments t2 (for scenario 1T) and t3 (for scenario 3T), binding of a given value Q*R(t) is carried out to the measured value taking into account the error ΔQ*M.
The change of modes in time is carried out in accordance with the variables t26, t23, t34, t45, t56, and t62, taking a value of 1 at the appropriate time. Switching conditions define auxiliary variables:
q = 1 ,   if   Q * Q * d   0 ,   if   Q * < Q * d   ,   p = 1 ,   if   P R M · η C P C   0 ,   if   P R M · η C < P C   ,   d = 1 ,   if   P L P g R   0 ,   if   P L < P g R   , r = 1 ,   if   Q * 2 R = Q * 2 n   0 ,   if   Q * 2 R < Q * n + 1   ,   b = 1 , i f ( P R M · η C P C ) / U B > I B R 0 , i f ( P R M · η C P C ) / U B I B R ,
where PRM = (PPVM + PW)—RES generation in the MPPT mode.
Variable q determines switching to the charge mode of a BESS with a constant voltage; p—excess of renewable energy generation power over the power given by the inverter; d—the ratio of the load power and the set value of the power consumed from the grid; r—determines the initial value of the state of charge from the night charge or calculated value for the next day; b—determines the state when, according to the generation conditions, the value of the BESS current exceeds the set value and cannot be reduced. The appropriate combinations of these variables determine the change in the mode of operation.
The value of the current RES generation, taking into account the regulation of the PV generation
P R · η C = P R M · η C · ( q ¯ p ¯ ) + ( P C + P B ) q · p · t 26 ,
where PB = UBIB.
The value of the power, which is given by the inverter
P C = P L · t 62 + ( P L P g R ) t 26 · d .
The power, consumed by the LO from the grid, without taking into account the correction
P g = ( P L + P B P R M · η C ) · t 62 ( r p ¯ b ¯ r ¯ ) + P g R · t 26 · d + P L · t 26 · d ¯ .
Taking into account the correction in the daytime, the second term (11)
P 1 g R = P g R + ( Q * R Q * M + Δ Q * M ) 0.01 W B η C · η B · Δ t ,
where Δt—time discreteness step during the correction.
The BESS current is
I B = I B 62 R · t 62 · b ¯ · r ¯ + P R M · η C P L U B p · t 62 ( r b r ¯ ) + ( q ¯ q p ¯ ) · t 25 · P R · η C P C U B + + P R M · η C P C U B · q · p · t 25 t 56 P B 56 U B .
where PB56 = PC56PRM.
The BESS model is performed according to the data sheets that are given graphically [28]. The charge characteristic IBch(Q*) is set by limiting the charge current value [31]
lim I B c h = f ( Q * ) ,   if   Q * Q * d   C B ,   if   Q * < Q * d ,   ,
where f(Q*)—dependence, which is set in tabular form according to the schedule for the interval (Q*d, 100%).
Function UBCh = f(Q*) is also set for two intervals. For Q* > Q*d value UBCh = const = 14.6 B.
Discharge characteristic UBrch (IBrch) is set according to the technique [31].
Value Q* taking into account the initial value Q*0:
Q * = ( Q * 0 + I B d t ) / C B ,
To estimate the reduction of the electricity cost that is consumed from the grid, the coefficient kE = WL/Wg was introduced (WL and Wg are electrical energies that are consumed, correspondingly, by the load and from the grid) [2].

6. Simulation Results

The structure of the model is based on (6)–(13). An assessment of indicators was made when the load and generation of RES corresponded to the calculated (forecast) values. For this, according to the archive, days were chosen when the generation was close to the average monthly values within specific intervals. Data were used [2,27] for PV and WG with installed power PPVR = PWR = 1 kW. Values Q*2R, kE (kE1, kE2, kE3—for one, two, and three tariff rates) and Pg26 for PPV = mP·PPVR, PWR = PWR /m (mP = 0.6 and m = 12.5—power recalculation coefficients [2]) and CB = 35 A are in Table 1. When using three tariffs, the following ratio of the cost of electricity was adopted: daily (half-peak)—1; peak—1.5; night—0.4. For two tariffs: daily—1; night—0.5. The taken load schedule corresponded to [2]: winter–spring–autumn PL23 = PL, PL34 = 0.9 PL, PL45 = 0.8 PL, PL56 = PL, PL62 = 0.3 PL (PL = 200); summer PL12 = PL67 = 0.3 PL, PL71 = 0.2 PL. The indicators with correction and without correction were almost the same.
The possibilities of correcting the Pg value when the load decreases relative to the calculated value and the deviation of the actual PV generation are relative to the forecast value. In accordance with Table 1, significant consumption from the grid during the daytime (Pg34, Pg45, Pg26) takes place in the period October to March. Accordingly, for a given level of PV generation, it makes sense to consider a Pg correction. Simulation results for the day of February are presented in Table 2 (+—the presence of correction). At the same time: P*LAV = PLAV/PLAVR—relative value of average power of daytime load PLAV to the calculated value PLAVR; W*PV = WPV/WPVF—relative value of PV generation to the forecast value WPVF; Q1M= Q*M/Q*—relative deviation of the measured value Q*M to the actual value Q*. At the same time, the implementation is somewhat simplified. A pre-calculated schedule Q*(t) was used in accordance with the calculated load schedule P*LAV = 1, W*PV = 1, and calculated value PgR.
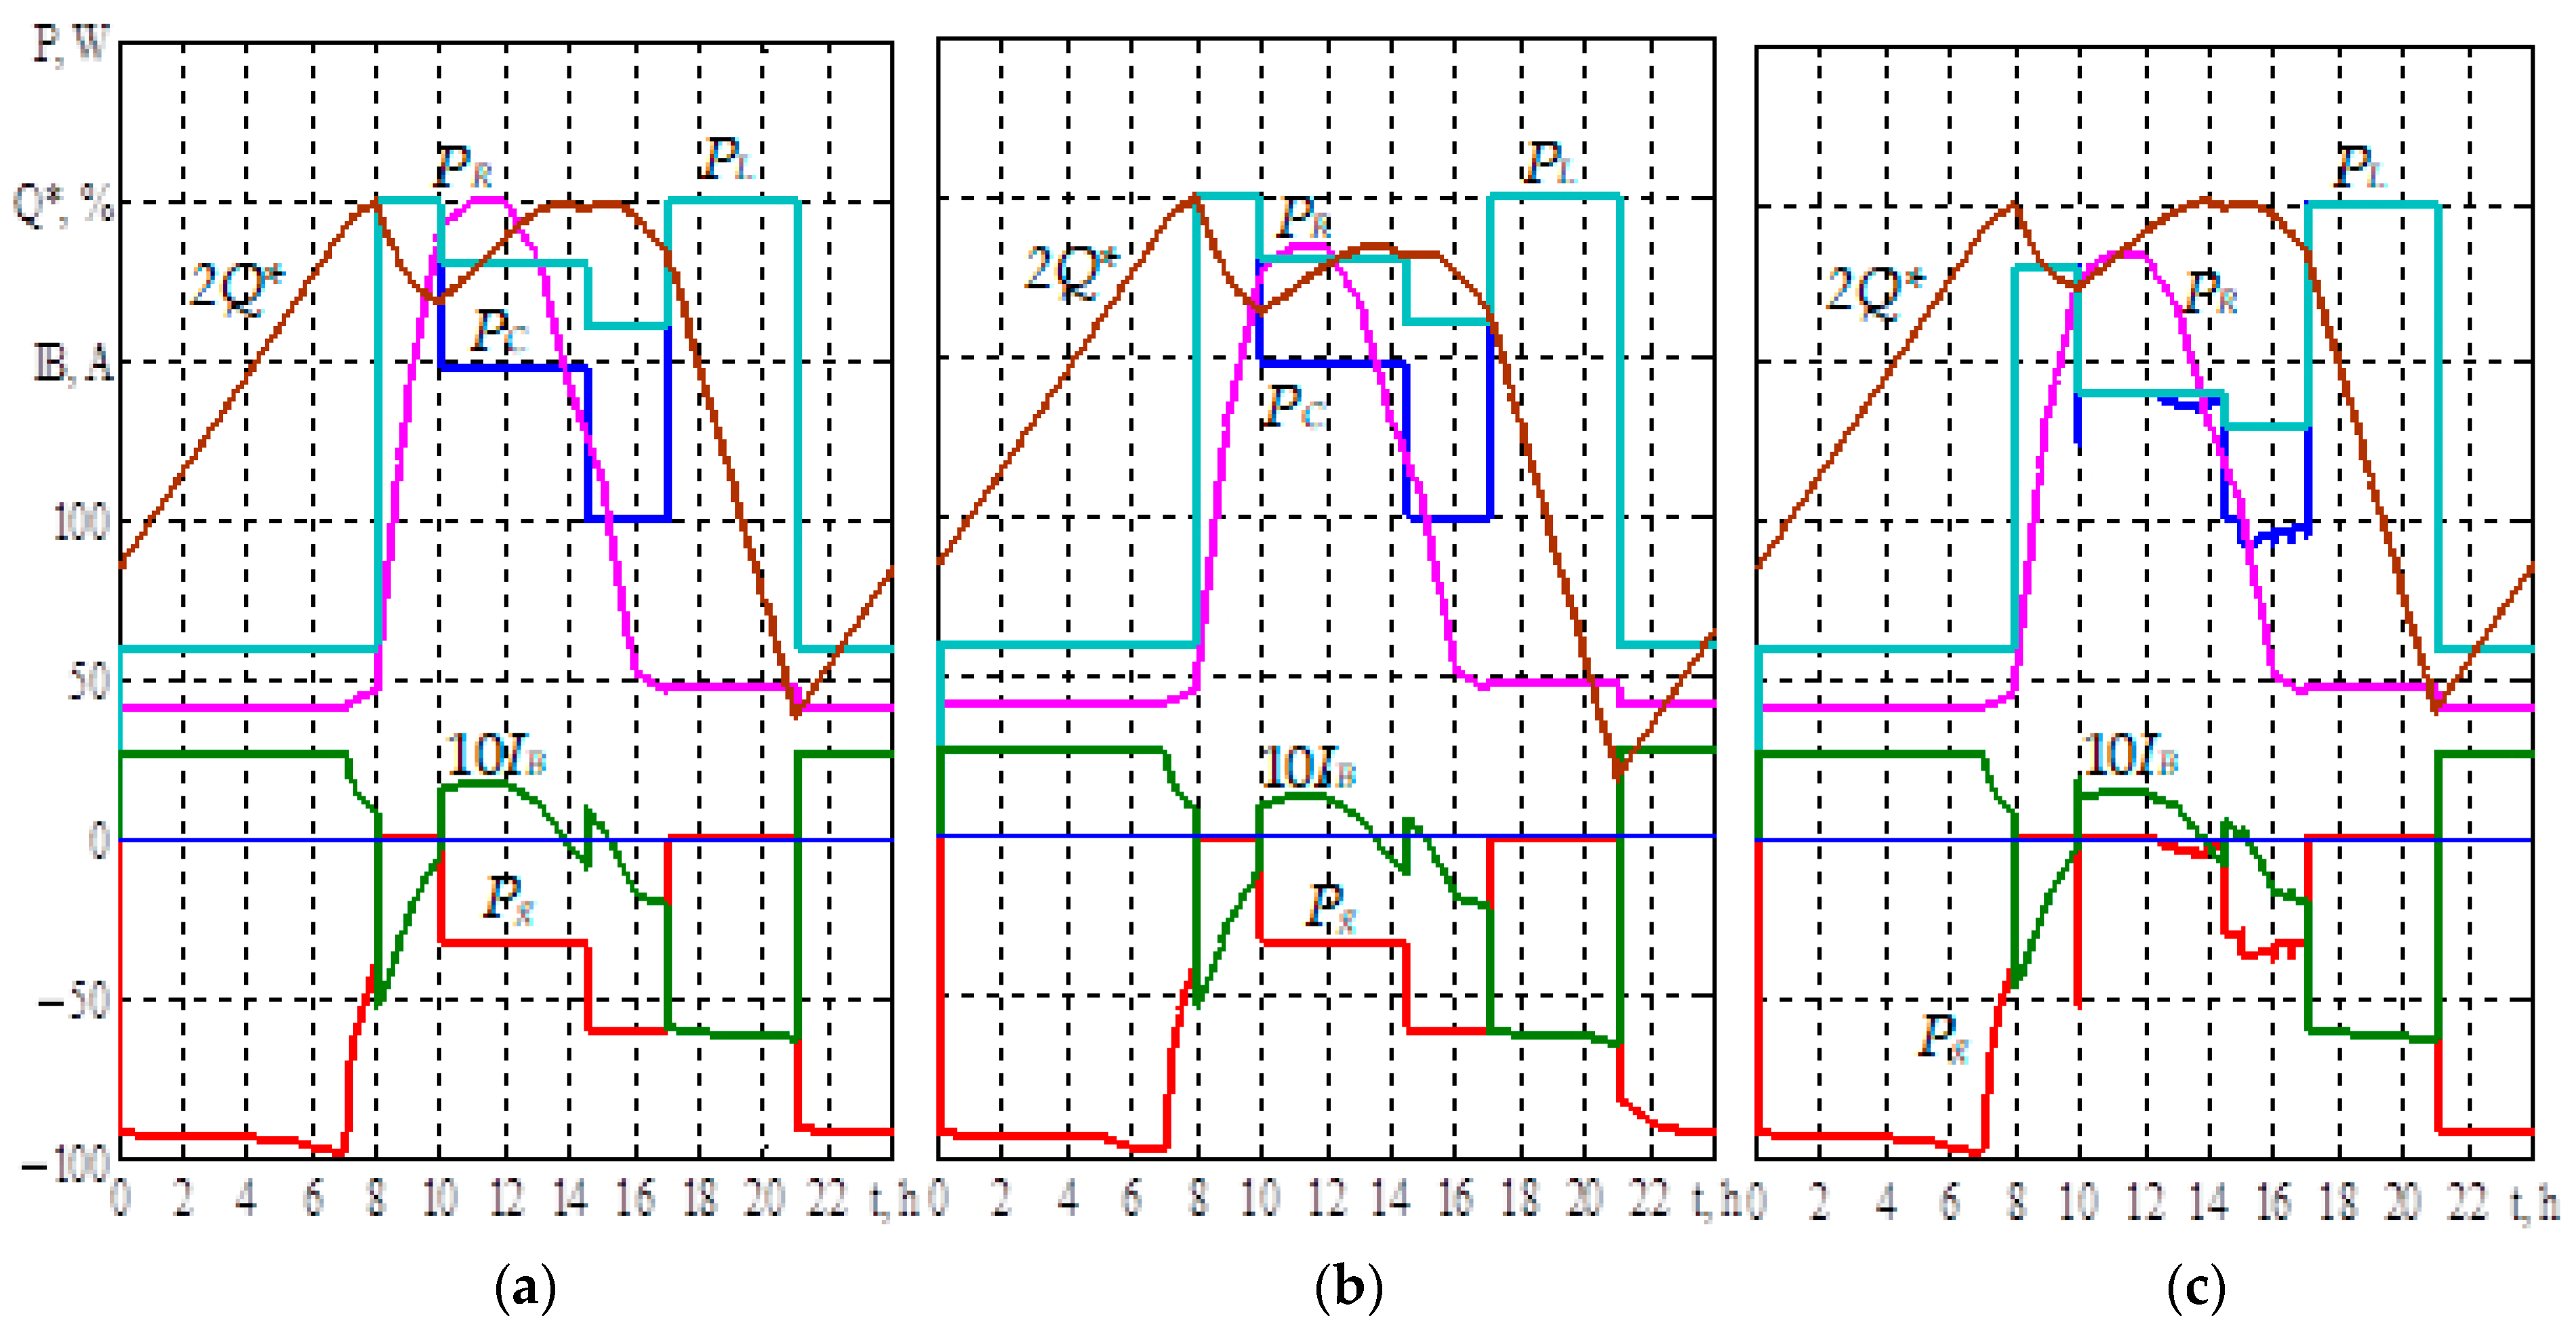
In the considered cases, the value of Q*6 without correction is changing. In Table 2, with W*PV = 0.9 and P*LAV = 1, we have Q*6 = 10% (assumed DoD ≤ 80% and Q*6 ≥ 20%). With large deviations of RES energy from the forecast, the picture worsens. With W*PV = 0.81 and P*LAV = 1 we have Q*6 = 0%. We have a similar picture when the load increases above the calculated one. With W*PV = 1 and P*LAV = 1.065 we have Q*6 = 0%.
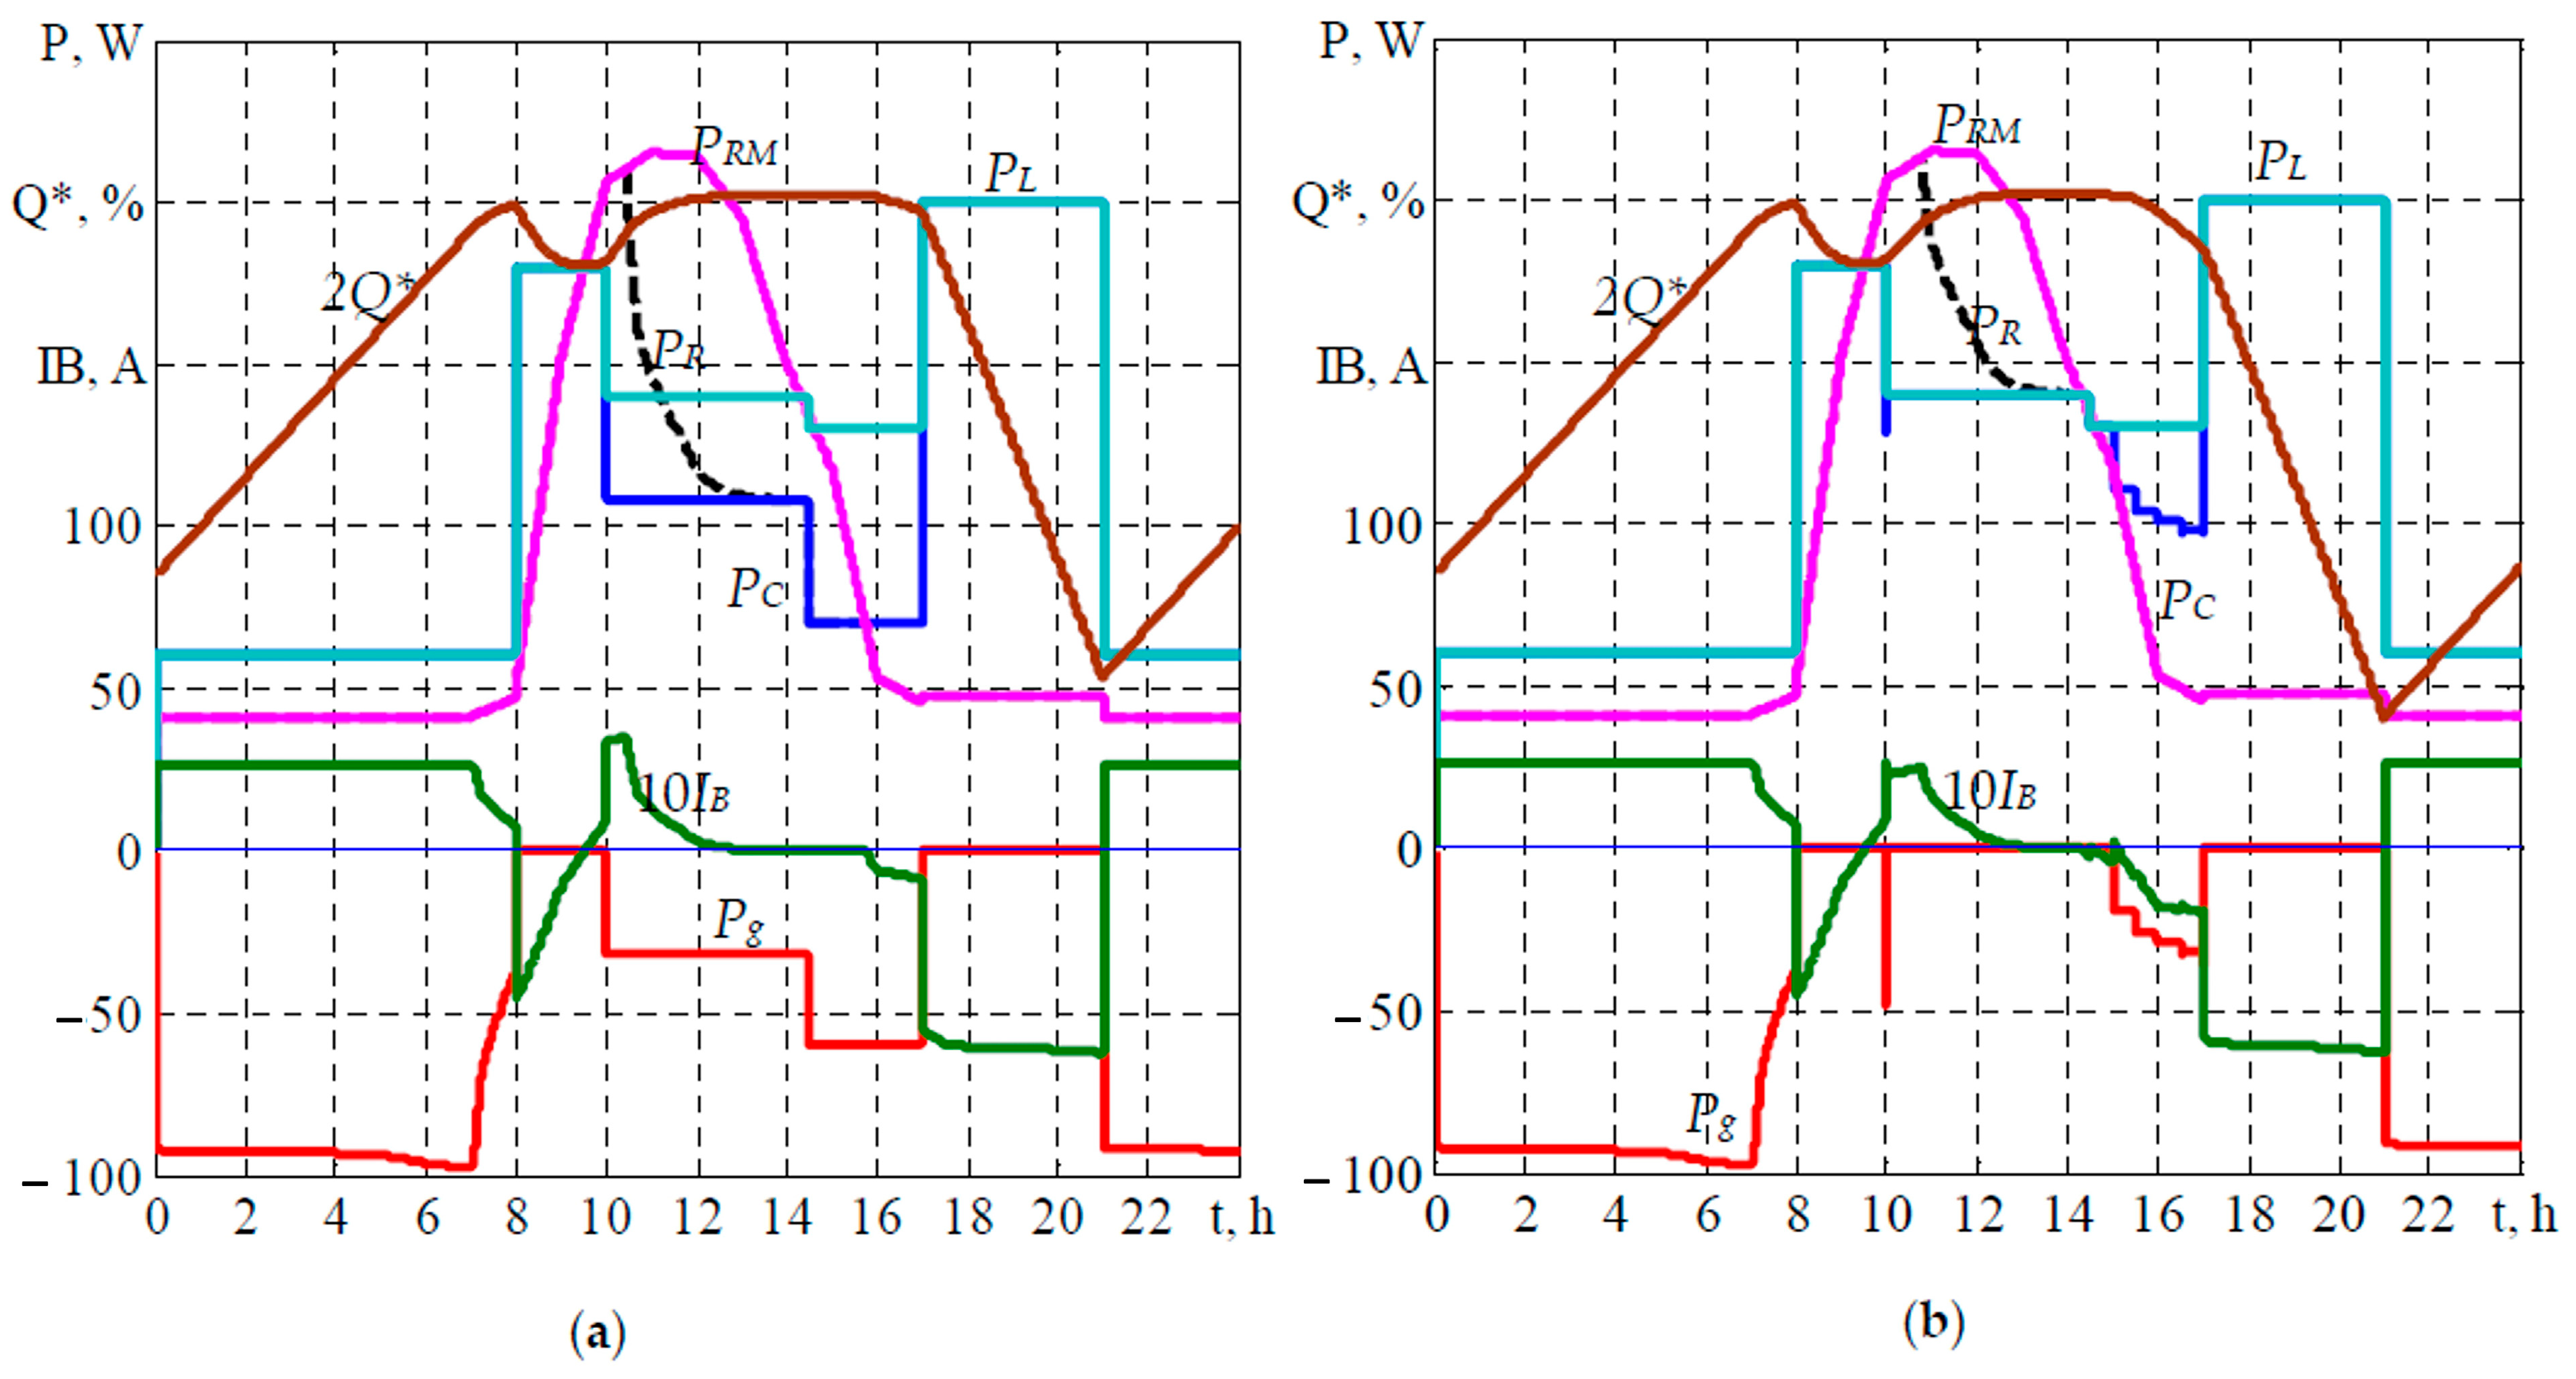
Oscillograms of the system operation are presented in Figure 5a as W*PV = 1, P*LAV = 1 without correction; in Figure 5b at W*PV = 0.9, P*LAV = 1 without correction; in Figure 5c as W*PV = 0.9, P*LAV = 0.877 with correction and Q1M = 1.05. For ease of display, the scales 2Q* and 10IB are used, and graph Pg is shown with a sign (-). The oscillogram data shows a decrease in consumption from the grid when the correction was used, as well as working out a given schedule SoC. Therefore, without correction, a decrease in the generation of RES (Figure 5b) led to a decrease in Q*6 below 10% at taken DoD ≤ 80%, which is unacceptable.
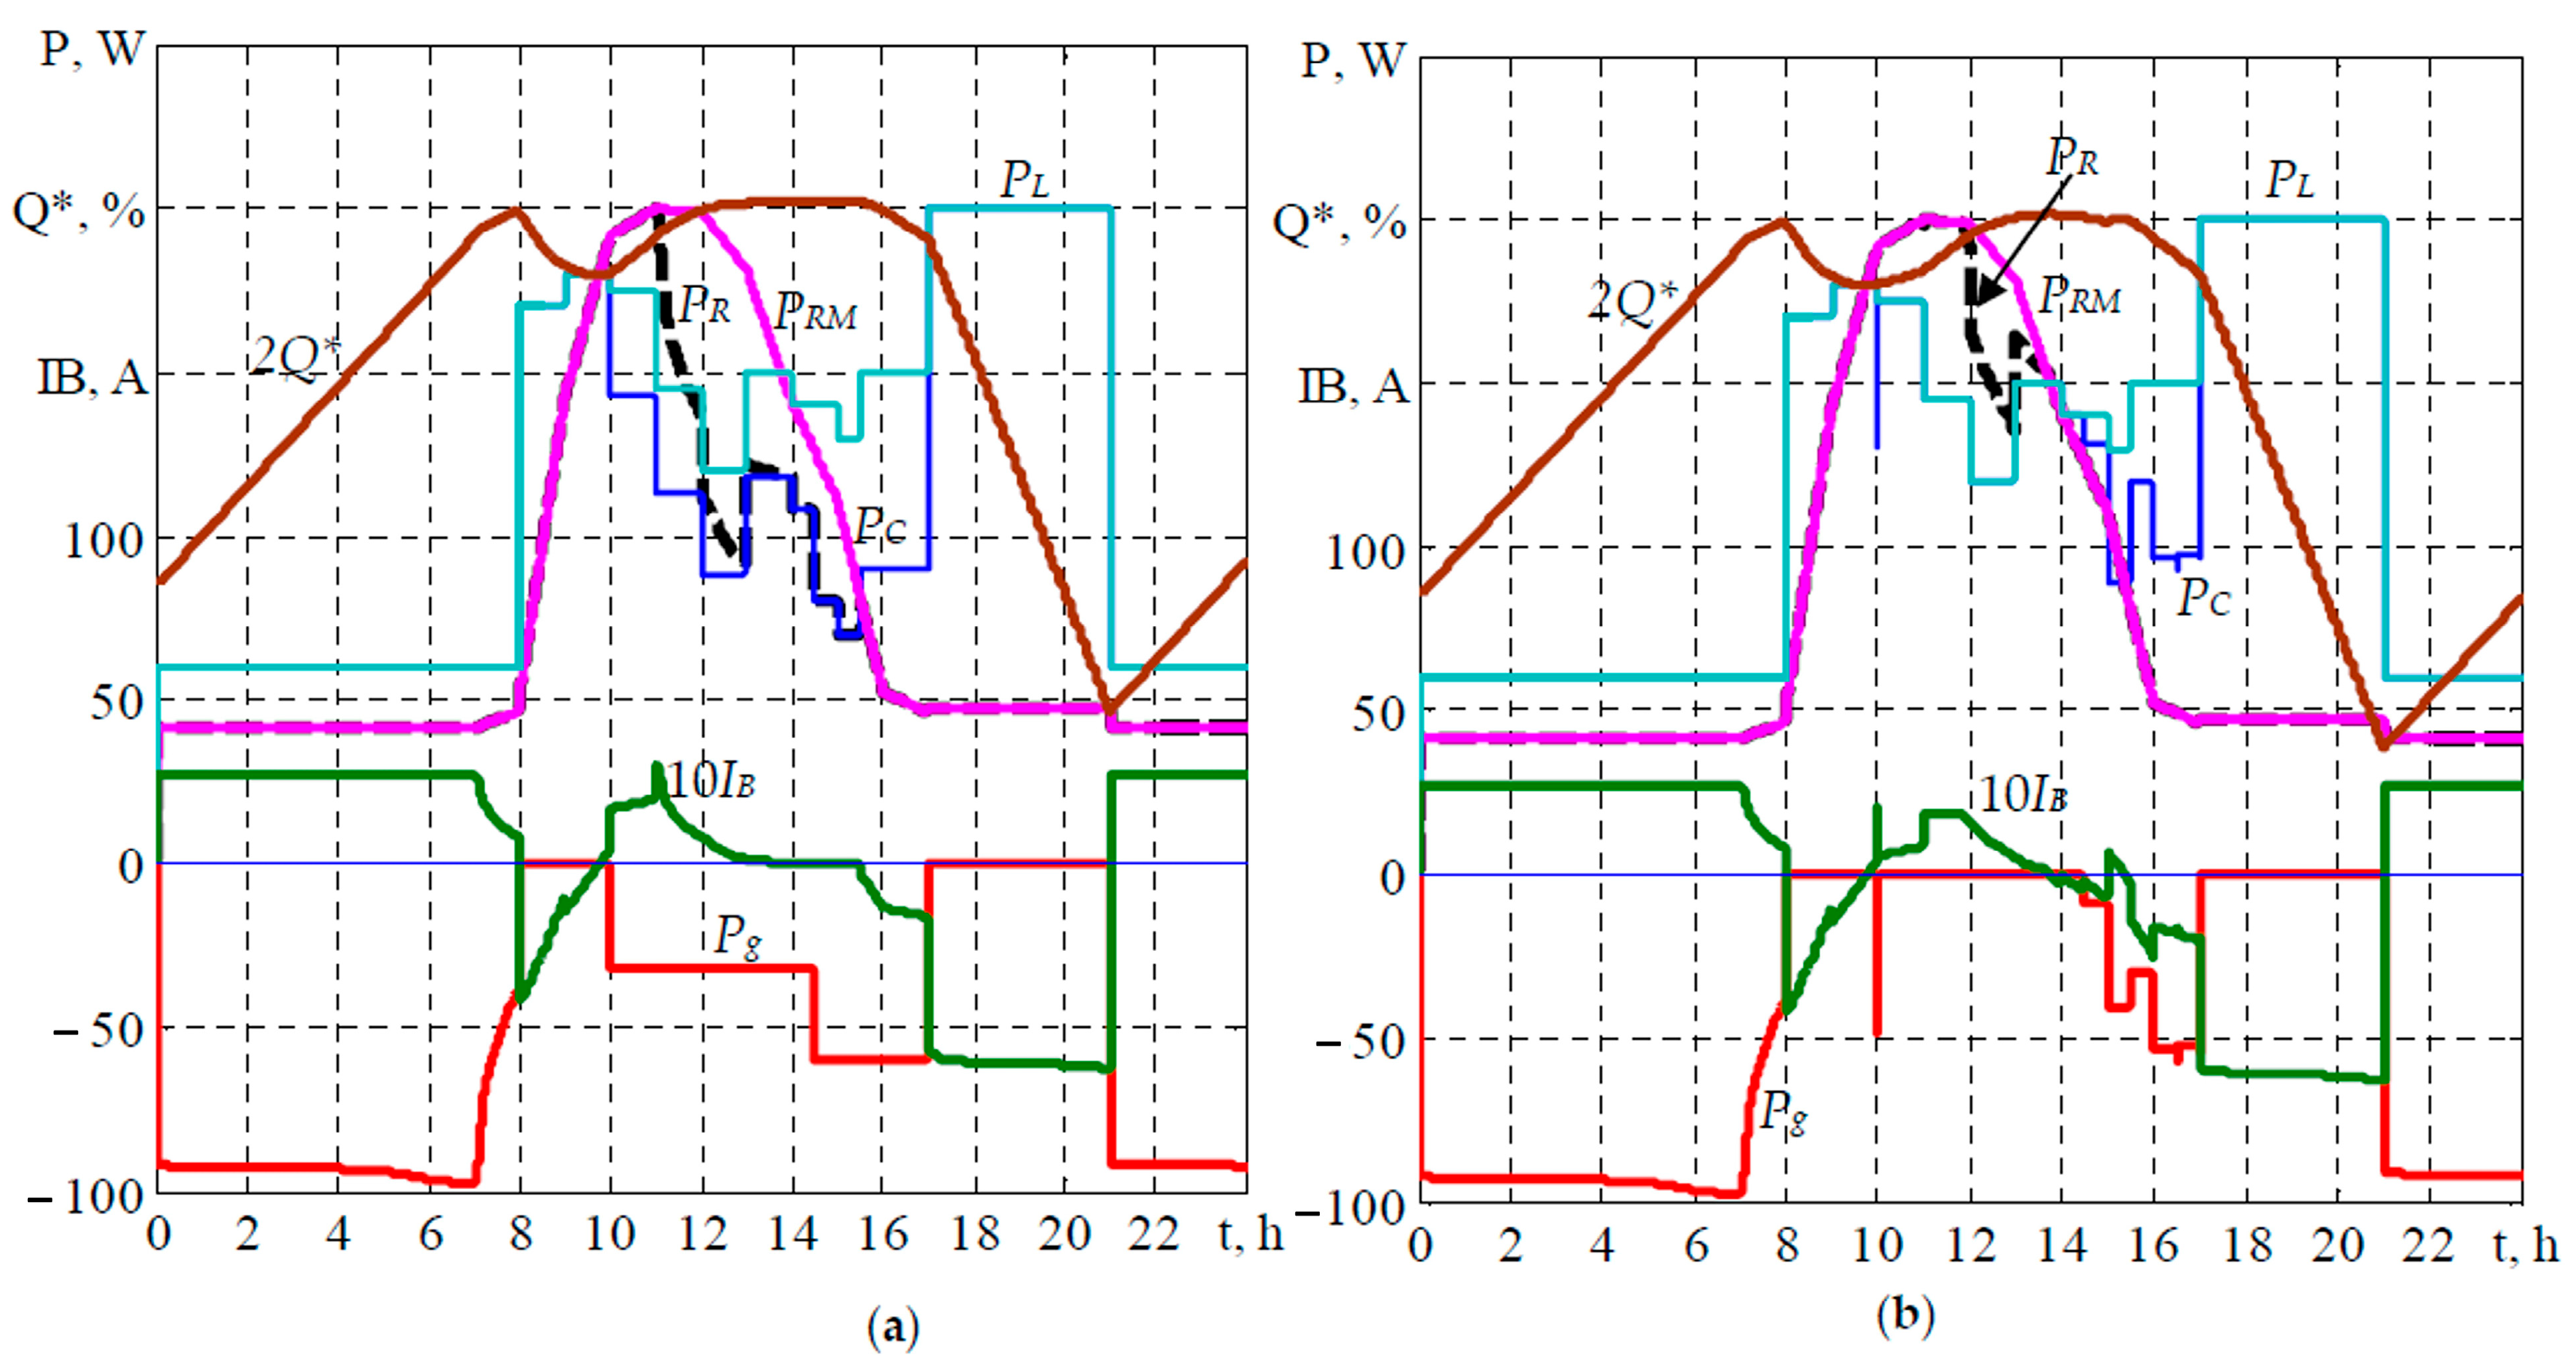
Oscillograms of the system operation are presented in Figure 6a at W*PV = 1.1, P*LAV = 0.877 without correction, and in Figure 6b at W*PV = 1.1, P*LAV = 0.877 with correction and Q1M = 1.05. In this case, there is not only reducing the consumption from the grid but a marked improvement in the use of RES (graph PR is shown by a dotted line).
The correction of the value Pg was also considered when the load decreased relative to the calculated value and changes in power values within the time intervals. The load in the evening peak was maximum. Oscillograms of the system operation are shown in Figure 7a at W*PV = 1.0, P*LAV = 0.9 without correction, and in Figure 7b at W*PV = 1.0, P*LAV = 0.9 with correction and Q1M = 1.05. Simulation results for different values P*PV are presented in Table 3 (+—the presence of correction).
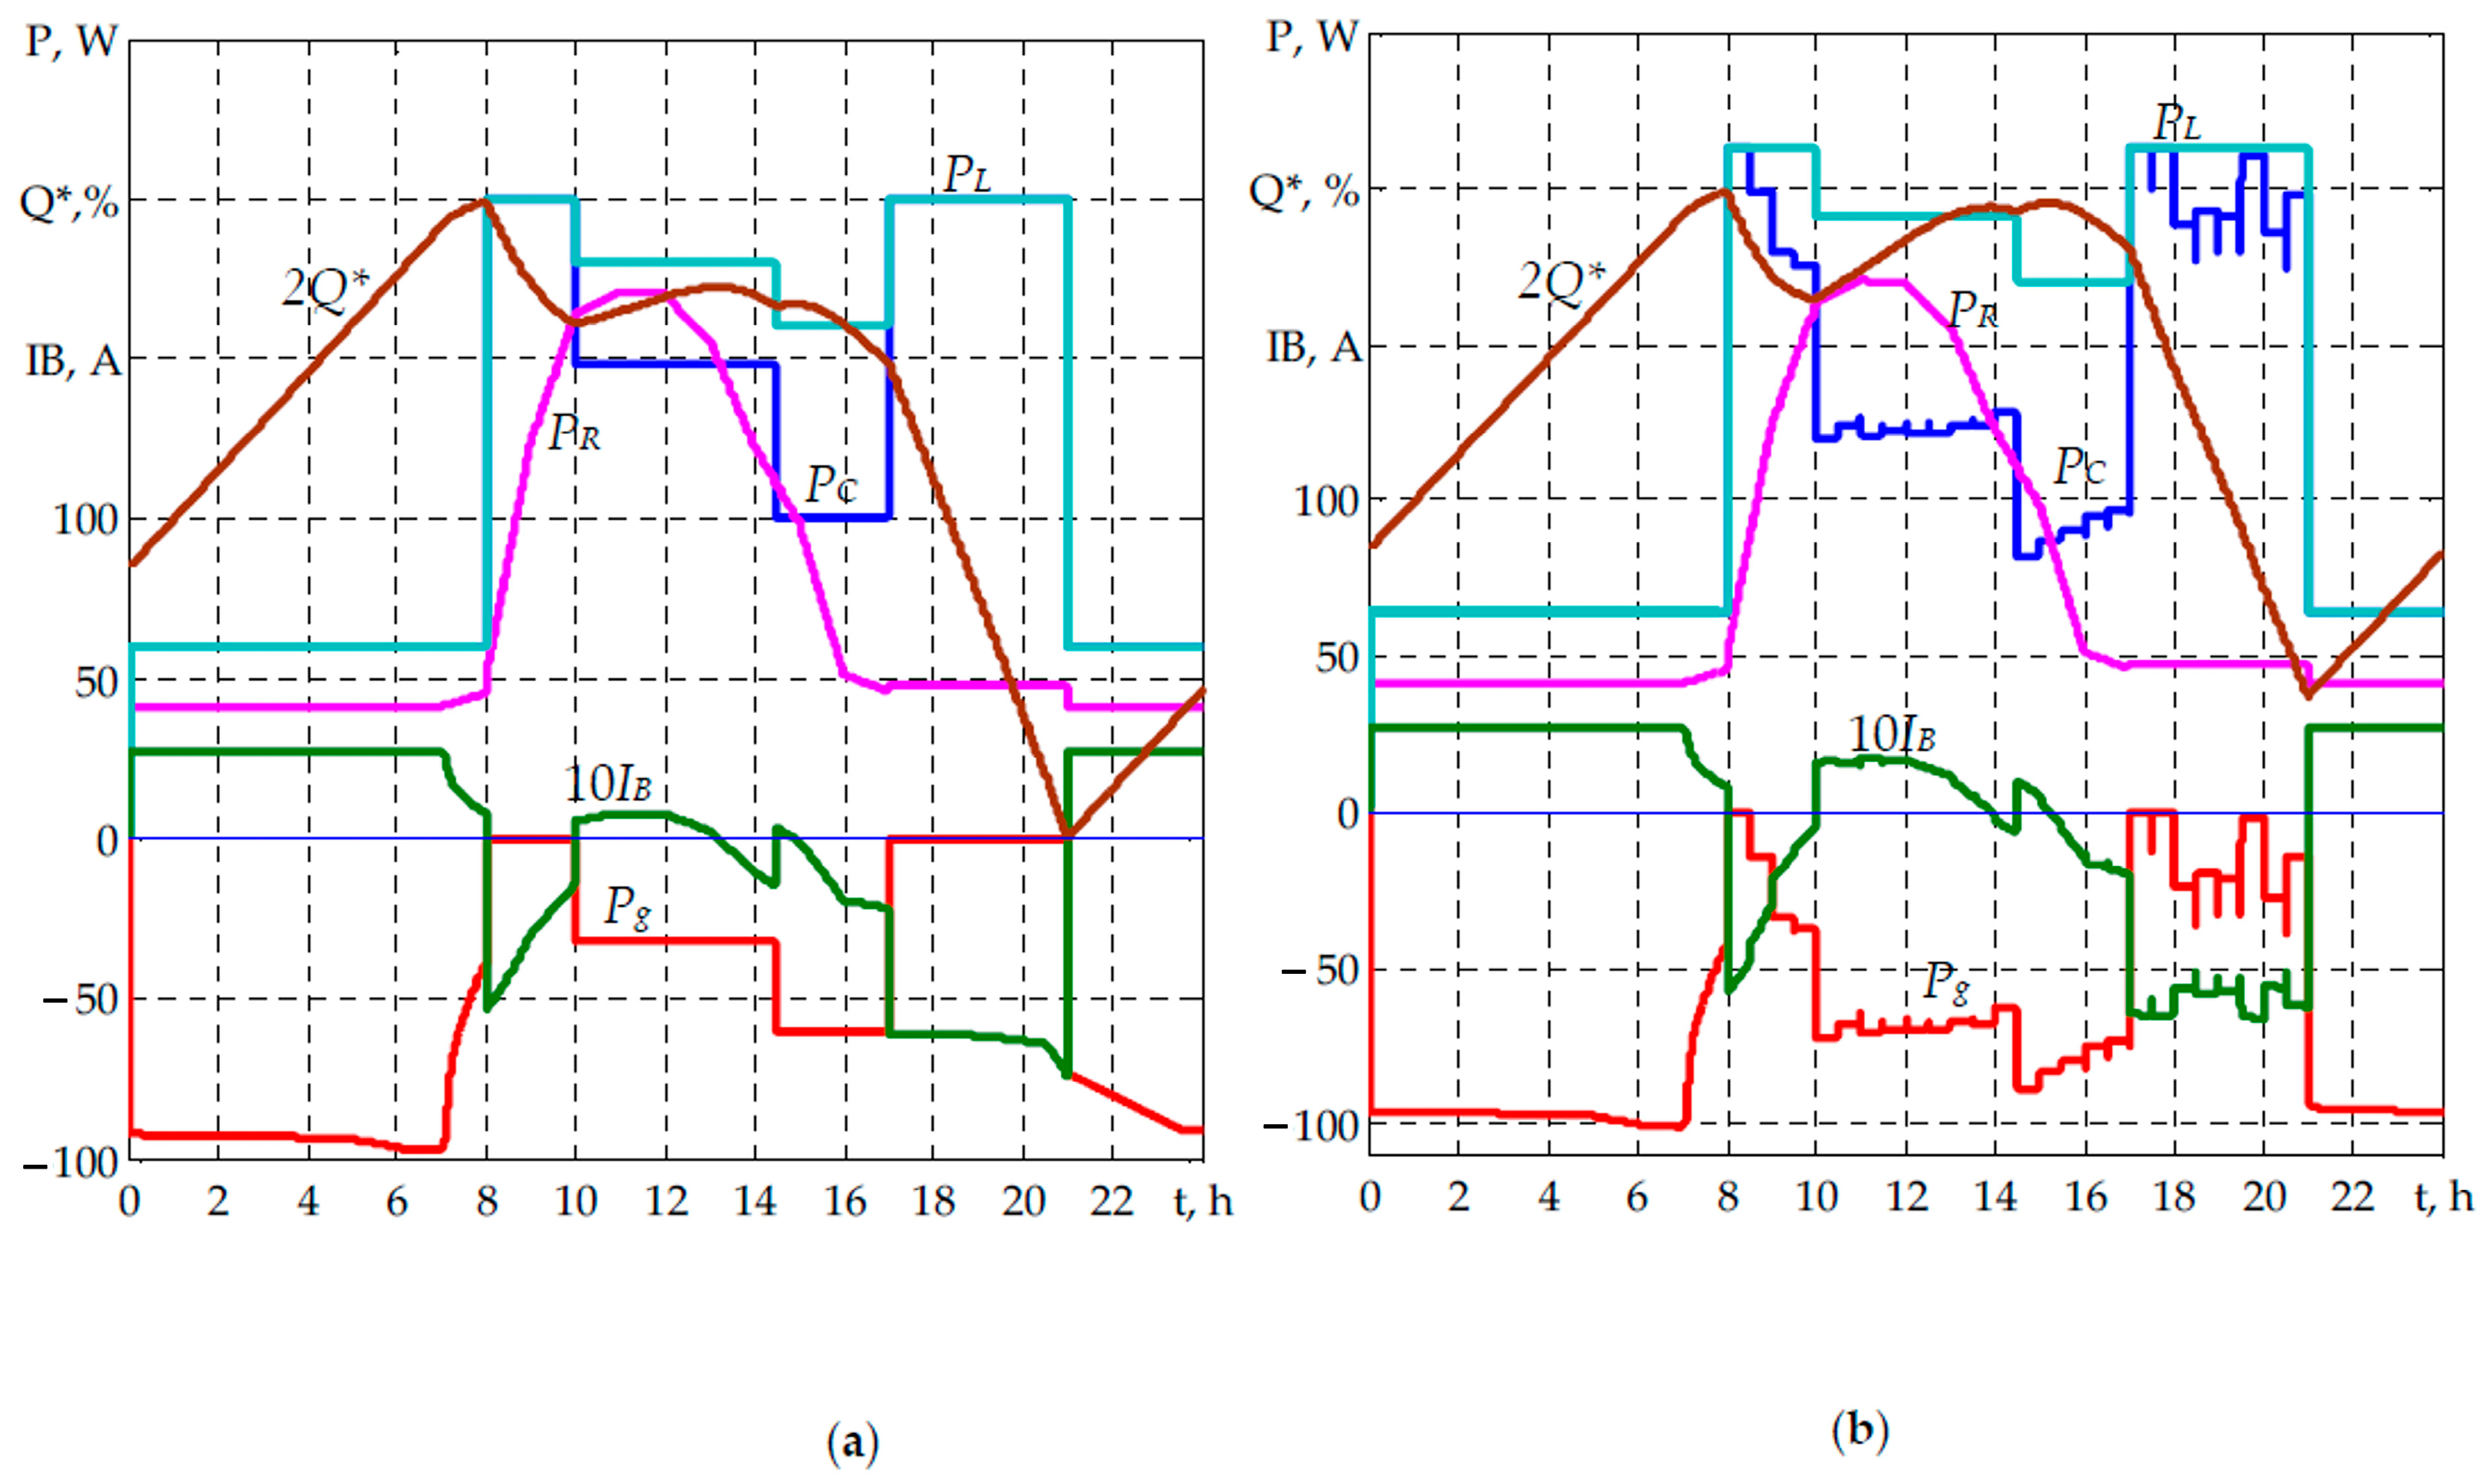
Oscillograms of the system operation are shown in Figure 8a at W*PV = 0.81, P*LAV = 1 without correction, in Figure 8b at W*PV = 0.8, P*LAV = 1.065 with correction and Q1M = 1.05.
In Figure 8a, we have DoD = 100%. In the case of using correction with a decrease in RES generation and an increase in load, we have kE1 = 2, kE2 = 2.34, kE3 = 2.83, and DoD = 80%. When using the Pg correction (Figure 8b), maintaining the adopted SoC(t) schedule is achieved by increasing the energy consumption from the grid, including some increase in consumption during peak hours.

7. Discussion of the Research Results

The increase of utilization of RES in the PV-WG system for self-consumption of LO, in combination with a simultaneous reduction in the cost of electricity consumed from the grid is possible due to:
-
the control with the setting of the power consumption from the grid based on the short-term forecast of the RES, using the correction of the taken power value by the deviation of the measured value of the SoC relative to the calculated SoC schedule. The SoC schedule is calculated at the beginning of the day in accordance with the calculated load schedule and the forecast of RES generation. This provides an additional reduction in electricity consumption from the grid and an increase in the degree of RES energy utilization at a load below the calculation and the generation of RES, which is different from the forecast;
-
taking into account the peculiarities of the implementation of the night charge of the BESS and the WG generation in the implementation of various scenarios;
-
use of the measured value of the load power to exclude the energy generation into the grid and the exclusion of the PV power regulation at the low generation of RES, as well as the implementation of the power reference in the evening peak.
Using the correction of the set power value avoids the discharge of the BESS below the accepted value DoD. By employing this approach, the service life of the BESS is extended.
This work is the development of works [2,6], where the use of auxiliary WG from the condition of providing a given value for reducing consumption from the grid was considered. The principle of control with reference to the power consumed from the grid is presented in [6] at the level of the declaration. At the same time, load deviations from the taken schedule and deviations of the actual and forecast value of the RES generation, and the features of the night charge in the presence of WG generation were not taken into account.
The peculiarity of the proposed solutions is the consideration of deviations in the LO load from the taken schedule, and actual and forecast generation of RES when forming a schedule SoC(t). The use of power consumption value correction when the load deviates from the calculated and actual generation of RES from the forecast value contributes to an increase in the degree of RES energy use and a decrease in consumption from the grid. The proposed solutions for implementation are formalized and taken into account in the description of the mathematical 24 h model of energy processes. To increase the veracity of the simulation, the description of the BESS model was clarified, and the error in the SoC estimation was taken into account.
There are certain limitations regarding the use of the research findings:
-
modeling with an assessment of the reduction in electricity costs for the average monthly generation RES and the calculated load was carried out with the generation of RES corresponding to the forecast;
-
the implementation of the correction of the value of power consumption on the deviation of the actual and calculated SoC assumes a high degree of SoC measurement and requires detailed study;
-
when simulation the solution with correction, the load deviation from the calculated value and the PV generation with a proportional change in PPV during the day was taken into account when the measured SoC value deviated to ±5%.
The further development of the article is connected with the improvement of the principles of implementation of the control system with reference to the consumed power.

8. Conclusions

The principle of controlling the power Pg consumed by the LO from the grid according to the forecast of RES generation has been developed. The setting of the Pg and Q* values of the battery is carried out according to the calculated load schedule and the data for the RES generation forecast at the corresponding time intervals at the beginning and end of the daily period.
It is shown that the deviation of the energy of the load and generation of RES relative to the calculated (forecast) values leads to a deviation of the SoC schedule relative to the calculated one and to a decrease in the degree of RES energy utilization. An increase in load and a decrease in RES generation can lead to a complete discharge of the battery, which is unacceptable. It is proposed to use the correction of the Pg assignment at the given time points in accordance with the deviation of the SoC value from the calculated value to form the calculated SoC(t) schedule. This makes it possible to compensate for the deviation of load energy and RES generation relative to the calculated (forecast) values.
Based on a formalized representation of energy processes in steady-state conditions, the “24 h” model of energy processes in the system has been finalized, taking into account the control features. The results of system modeling with the accepted load schedule and PPVR/PWR/PLAVR = 3/0.4/1 showed that at the average monthly RES generation, the decrease in the cost of grid electricity consumption for one rate of payment tariff from 1.68 to 14.2 times for one tariff, from 1.73 to 17.84 for two rates, from 1.73 to 22.66 times the three rates.
The use of Pg correction in the process of SoC formation according to the deviation of the actual SoC value from the calculated one at fixed moments (correction discreteness 0.5 h) allows for reducing grid electricity consumption while increasing the degree of RES energy utilization. It also ensures that the SoC schedule is maintained close to the calculated schedule while limiting the degree of battery discharge to the accepted value of 80%. The possibilities of using the correction are limited to cases where the generation of RES is insufficient, and energy consumption from the grid is required during the daytime. But precisely, these cases are important for reducing consumption. The efficiency of the correction increases with increasing deviation of the load from the calculated one. A correction discreteness of 0.5 h was used. So, for the February day with an average load value of PLA = 0.925 PLAVR (PLAVR is the design load), the reduction in electricity consumption is 16%, and the reduction in payment costs at the three tariffs is 24%. With PLAV = 0.877 PLAVR, we have 21% and 33%, respectively. For the same day, with PLAV = 0.877 PLAVR and the PV generation WPV = 0.9 WPVF (WPVF is the forecast value), the correction provides a 17.7% reduction in electricity consumption while reducing payment costs at the three tariffs by 27%. The degree of battery discharge does not exceed 80% even with PLA = 1.1 PLAVR and PV generation WPV = 0.8 WPVF
The results, which are obtained for specific parameters and conditions, showed the possibility of a hybrid PV system use with an auxiliary WG for the self-consumption of LO. The research findings are applicable in both the design of new hybrid PV-WG systems for LO and the enhancement of existing PVS with the addition of an auxiliary WG. The direction of further research is to study the effect of correction discreteness and increase the range of load and forecast deviations in order to improve the mechanism for implementing the system.

Author Contributions

Conceptualization, O.S., I.S. and M.K.; methodology, O.S., I.S. and M.K.; validation, D.M. and I.S.; formal analysis, I.S. and D.M.; investigation, O.S., I.S. and D.M.; resources, I.S. and D.M.; data curation, O.S. and I.S.; writing—original draft preparation, O.S. and I.S.; writing—review and editing, M.K.; visualization, I.S. and D.M.; supervision, M.K. All authors have read and agreed to the published version of the manuscript.

Funding

This work was supported by the Slovak Research and Development Agency under the contracts APVV-19-0576, APVV-21-0312, and SK-UA-21-0024.

Data Availability Statement

Not applicable.

Acknowledgments

This publication was issued thanks to support from the Ministry of Education and Science of Ukraine in the joint Ukrainian–Slovak R&D project “Energy management improvement of hybrid photovoltaic systems of local objects with storage batteries” between the Kyiv National University of Technologies and Design (Ukraine) and the Technical University of Kosice (Slovakia).

Conflicts of Interest

The authors declare no conflict of interest. The funders had no role in the design of the study; in the collection, analyses, or interpretation of data; in the writing of the manuscript, or in the decision to publish the results.

Nomenclature

PVphotovoltaic battery
WGwind generator
RESrenewable energy source
BESSbattery energy storage system
LOlocal object
PV-WGgrid-connected solar-wind system
DGdistribution grid
PCCpoint of common coupling
MPPTmaximum power point tracking
WFMwi-Fi unit
CPCunit of the calculation of parameters and setting of modes
CPVPV voltage converter
CSBbattery voltage converter
CWGWG converter
VSImultifunctional grid inverter
SoC(t)state of charge of BESS
DoDdepth of discharge of BESS
CUcontrol unit
PLLphase-locked loop
PPVPV power generation (W)
PWpower generation of the wind generator (W)
PLload power (W)
Pgpower consumption from the grid (W)
PPVRrate (installed) power of the photovoltaic battery (W)
PWRrate (installed) power of wind generator (W)
UdDC link voltage (V)
UBbattery voltage (V)
Uggrid voltage (V)
IBcurrent of battery (A)
Igcurrent at point of common coupling with a grid (A)
IPVcurrent of photovoltaic battery (A)
WPVenergy generation of photovoltaic battery (Wh)
WWenergy generation of wind generator (Wh)
WRtotal energy generation of photovoltaic battery and wind generator (Wh)
WBBESS energy capacity (Wh)
Wgconsumption of the energy from the grid (Wh)
WLenergy consumed by the load (Wh)
WPVAVDaverage value of energy, generated by PV battery per day (Wh)
WWA VDaverage value of energy, generated by wind generator per day (Wh)
CB or QRcapacity of the BESS or rated state of charge (Ah)
Q*state of charge of BESS (%)
Q*dstate of BESS charge when switching to the mode of constant voltage charge (%)
ηCoverall efficiency of converter and inverter (p.u.)
ηBefficiency of the BESS (p.u.)
mPcoefficient of PV battery power recalculation (p.u.)
mcoefficient of wind power recalculation (p.u.)
kEcoefficient of the cost reduction for the energy from the grid (p.u.)
t, t1, t2.… t7time and time points for load schedule [h]
Tdday tariff rate (p.u.)
Tnnight tariff rate (p.u.)

References

  1. Luthander, R.; Widén, J.; Nilsson, D.; Palm, J. Photovoltaic self-consumption in buildings: A review. Appl. Energy 2015, 142, 80–94. [Google Scholar] [CrossRef] [Green Version]
  2. Shavolkin, O.; Shvedchykova, I.; Kolcun, M.; Medved’, D. Improvement of the Grid-Tied Solar-Wind System with a Storage Battery for the Self-Consumption of a Local Object. Energies 2022, 15, 5114. [Google Scholar] [CrossRef]
  3. Ramoji, S.K.; Rath, B.B.; Kumar, D.V. Optimum Design of a Hybrid PV/Wind Energy System Using Genetic Algorithm (GA). IOSR J. Eng. 2014, 4, 38–48. [Google Scholar] [CrossRef]
  4. Yang, B.; Guo, Y.; Xiao, X.; Tian, P. 2Bi-level Capacity Planning of Wind-PV-Battery Hybrid Generation System Considering Return on Investment. Energies 2020, 13, 3046. [Google Scholar] [CrossRef]
  5. Menniti, D.; Pinnarelli, A.; Sorrentino, N. A Method to Improve Microgrid RELIABILITY by optimal Sizing PV/Wind Plants and Storage Systems. In Proceedings of the CIRED 2009—The 20th International Conference and Exhibition on Electricity Distribution—Part 2, Prague, Czech Republic, 8–11 June 2009; p. 1. [Google Scholar] [CrossRef] [Green Version]
  6. Shavolkin, O.; Shvedchykova, I.; Kolcun, M.; Medved’, D. Variant of Implementation of a Grid-Tied Solar-Wind System with a Storage Battery for Self-Consumption of Local Object. In Proceedings of the 2022 IEEE 8th International Conference on Energy Smart Systems (ESS), Kyiv, Ukraine, 12–14 October 2022; pp. 184–189. [Google Scholar] [CrossRef]
  7. Zsiborács, H.; Pintér, G.; Vincze, A.; Birkner, Z.; Baranyai, N.H. Grid balancing challenges illustrated by two European examples: Interactions of electric grids, photovoltaic power generation, energy storage and power generation forecasting. Energy Rep. 2021, 7, 3805–3818. [Google Scholar] [CrossRef]
  8. Wynn, S.L.L.; Boonraksa, T.; Boonraksa, P.; Pinthurat, W.; Marungsri, B. Decentralized Energy Management System in Microgrid Considering Uncertainty and Demand Response. Electronics 2023, 12, 237. [Google Scholar] [CrossRef]
  9. Shavolkin, O.; Gerlici, J.; Shvedchykova, I.; Kravchenko, K. Solar–Wind System for the Remote Objects of Railway Transport Infrastructure. Energies 2022, 15, 6546. [Google Scholar] [CrossRef]
  10. Forecast Solar. Available online: https://forecast.solar/ (accessed on 1 July 2023).
  11. Iyengar, S.; Sharma, N.; Irwin, D.; Shenoy, P.; Ramamritham, K. SolarCast—An Open WEB service for predicting Solar Power Generation in Smart Homes. In Proceedings of the 1st ACM Conference on Embedded Systems for Energy-Efficient Buildings, BuildSys, Memphis, TN, USA, 3–6 November 2014; pp. 174–175. [Google Scholar] [CrossRef]
  12. Iyengar, S.; Sharma, N.; Irwin, D.; Shenoy, P.; Ramamritham, K. A Cloud-Based Black-Box Solar Predictor for Smart Homes. ACM Trans. Cyber-Physical Syst. 2017, 1, 1–24. [Google Scholar] [CrossRef] [Green Version]
  13. Barelli, L.; Bidini, G.; Bonucci, F.; Castellini, L.; Castellini, S.; Ottaviano, A.; Zuccati, A. Dynamic Analysis of a Hybrid Energy Storage System (H-ESS) Coupled to a Photovoltaic (PV) Plant. Energies 2018, 11, 396. [Google Scholar] [CrossRef] [Green Version]
  14. Shavolkin, O.; Shvedchykova, I.; Romanchenko, J.; Marchenko, R.; Yakymets, S. Installed Power of the Grid-Tied Photovoltaic System with Battery for Self-Consumption of the Local Object. In Proceedings of the 2022 IEEE 4th International Conference on Modern Electrical and Energy System (MEES), Kremenchuk, Ukraine, 20–23 October 2022; pp. 1–6. [Google Scholar] [CrossRef]
  15. Ouédraogo, S.; Faggianelli, G.A.; Notton, G.; Duchaud, J.L.; Voyant, C. Impact of electricity tariffs and energy management strategies on PV/Battery microgrid performances. Renew. Energy 2022, 199, 816–825. [Google Scholar] [CrossRef]
  16. Schram, W.L.; Lampropoulos, L.; van Sark, W.G. Photovoltaic systems coupled with batteries that are optimally sized for household self-consumption: Assessment of peak shaving potential. Appl. Energy 2018, 223, 69–81. [Google Scholar] [CrossRef]
  17. Shavelkin, A.A.; Gerlici, J.; Shvedchykova, I.O.; Kravchenko, K.; Kruhliak, H.V. Management of power consumption in a photovoltaic system with a storage battery connected to the network with multi-zone electricity pricing to supply the local facility own needs. Electr. Eng. Electromechanics 2021, 2, 36–42. [Google Scholar] [CrossRef]
  18. Zeng, H.; Yang, R.; Zhao, C.; Cheng, C. Topologies and control strategies of multi-functional grid-connected inverters for power quality enhancement: A comprehensive review. Renew. Sustain. Energy Rev. 2013, 24, 223–270. [Google Scholar] [CrossRef]
  19. Vigneysh, T.; Kumarappan, N. Grid interconnection of renewable energy sources using multifunctional grid-interactive converters: A fuzzy logic based approach. Electr. Power Syst. Res. 2017, 151, 359–368. [Google Scholar] [CrossRef]
  20. Shavolkin, O.; Shvedchykova, I. Improvement of the multifunctional converter of the photoelectric system with a storage battery for a local object with connection to a grid. In Proceedings of the 2020 IEEE KhPI Week on Advanced Technology, KhPIWeek 2020, Kharkiv, Ukraine, 5–10 October 2020; pp. 287–292. [Google Scholar] [CrossRef]
  21. Guerrero-Martinez, M.A.; Milanes-Montero, M.I.; Barrero-Gonzalez, F.; Miñambres-Marcos, V.M.; Romero-Cadaval, T.; Gonzalez-Romera, E. A Smart Power Electronic Multiconverter for the Residential Sector. Sensors 2017, 17, 1217. [Google Scholar] [CrossRef] [PubMed] [Green Version]
  22. Abdelrahman, O.A.; Ahmed, M.H.; Mohamed, M.A.; Mohamed, N.S.; Mohamed, R.E. Energy management of photovoltaic-battery system connected with the grid. J. Energy Storage 2022, 55, 105865. [Google Scholar] [CrossRef]
  23. 24-Hour Simulation of a Vehicle to Grid (V2G) System. Available online: https://www.mathworks.com/help/physmod/sps/ug/24-hour-simulation-of-a-vehicle-to-grid-v2g-system.html (accessed on 1 July 2023).
  24. Simplified Model of a Small Scale Micro-Grid. Available online: https://www.mathworks.com/help/physmod/sps/ug/simplified-model-of-a-small-scale-micro-grid.html (accessed on 1 July 2023).
  25. Singh, M.; Singh, O. Phasor Solution of a Micro-Grid to Accelerate Simulation Speed. In Proceedings of the 2nd International Conference on Advanced Computing and Software Engineering (ICACSE-2019), Sultanpur, India, 11 April 2019; pp. 546–550. Available online: https://ssrn.com/abstract=3351025 (accessed on 1 July 2023).
  26. Chola, R.; Singh, S.B. A Case Study on 24-h Simulation of V2G System. In Advances in Renewable Energy and Sustainable Environment; Lecture Notes in Electrical, Engineering; Dewan, L.C., Bansal, R., Kumar Kalla, U., Eds.; Springer: Singapore, 2021; Volume 667. [Google Scholar] [CrossRef]
  27. Photovoltaic Geographical Information System. Available online: https://re.jrc.ec.europa.eu/pvg_tools/en/tools.html#SA (accessed on 1 July 2023).
  28. Data Sheet. Lithium Iron Phosphate Battery (LiFePO4) 12.8 V 150 Ah. Available online: https://www.eco-greenenergy.com/wp-content/uploads/2021/12/EGE-LiFePO4-Battery-12.8V150Ahd.pdf (accessed on 1 July 2023).
  29. Shepherd, C.M. Design of Primary and Secondary Cells. P. 2. An equation describing battery discharge. J. Electrochem. Soc. 1965, 112, 657–664. [Google Scholar] [CrossRef]
  30. Tremblay, O.; Dessaint, L.A.; Dekkiche, A.I. A Generic Battery Model for the Dynamic Simulation of Hybrid Electric Vehicles. In Proceedings of the Vehicle Power and Propulsion Conference (VPPC 2007), Arlington, TX, USA, 9–12 September 2007; pp. 284–289. [Google Scholar]
  31. Shavolkin, O.; Shvedchykova, I.; Lishchuk, V.; Stanovskyi, Y. Improving a model of the hybrid photovoltaic system with a storage battery for local object’s self-consumption involving the setting of power consumed from the grid. East.-Eur. J. Enterp. Technol. 2023, 3, 6–16. [Google Scholar] [CrossRef]
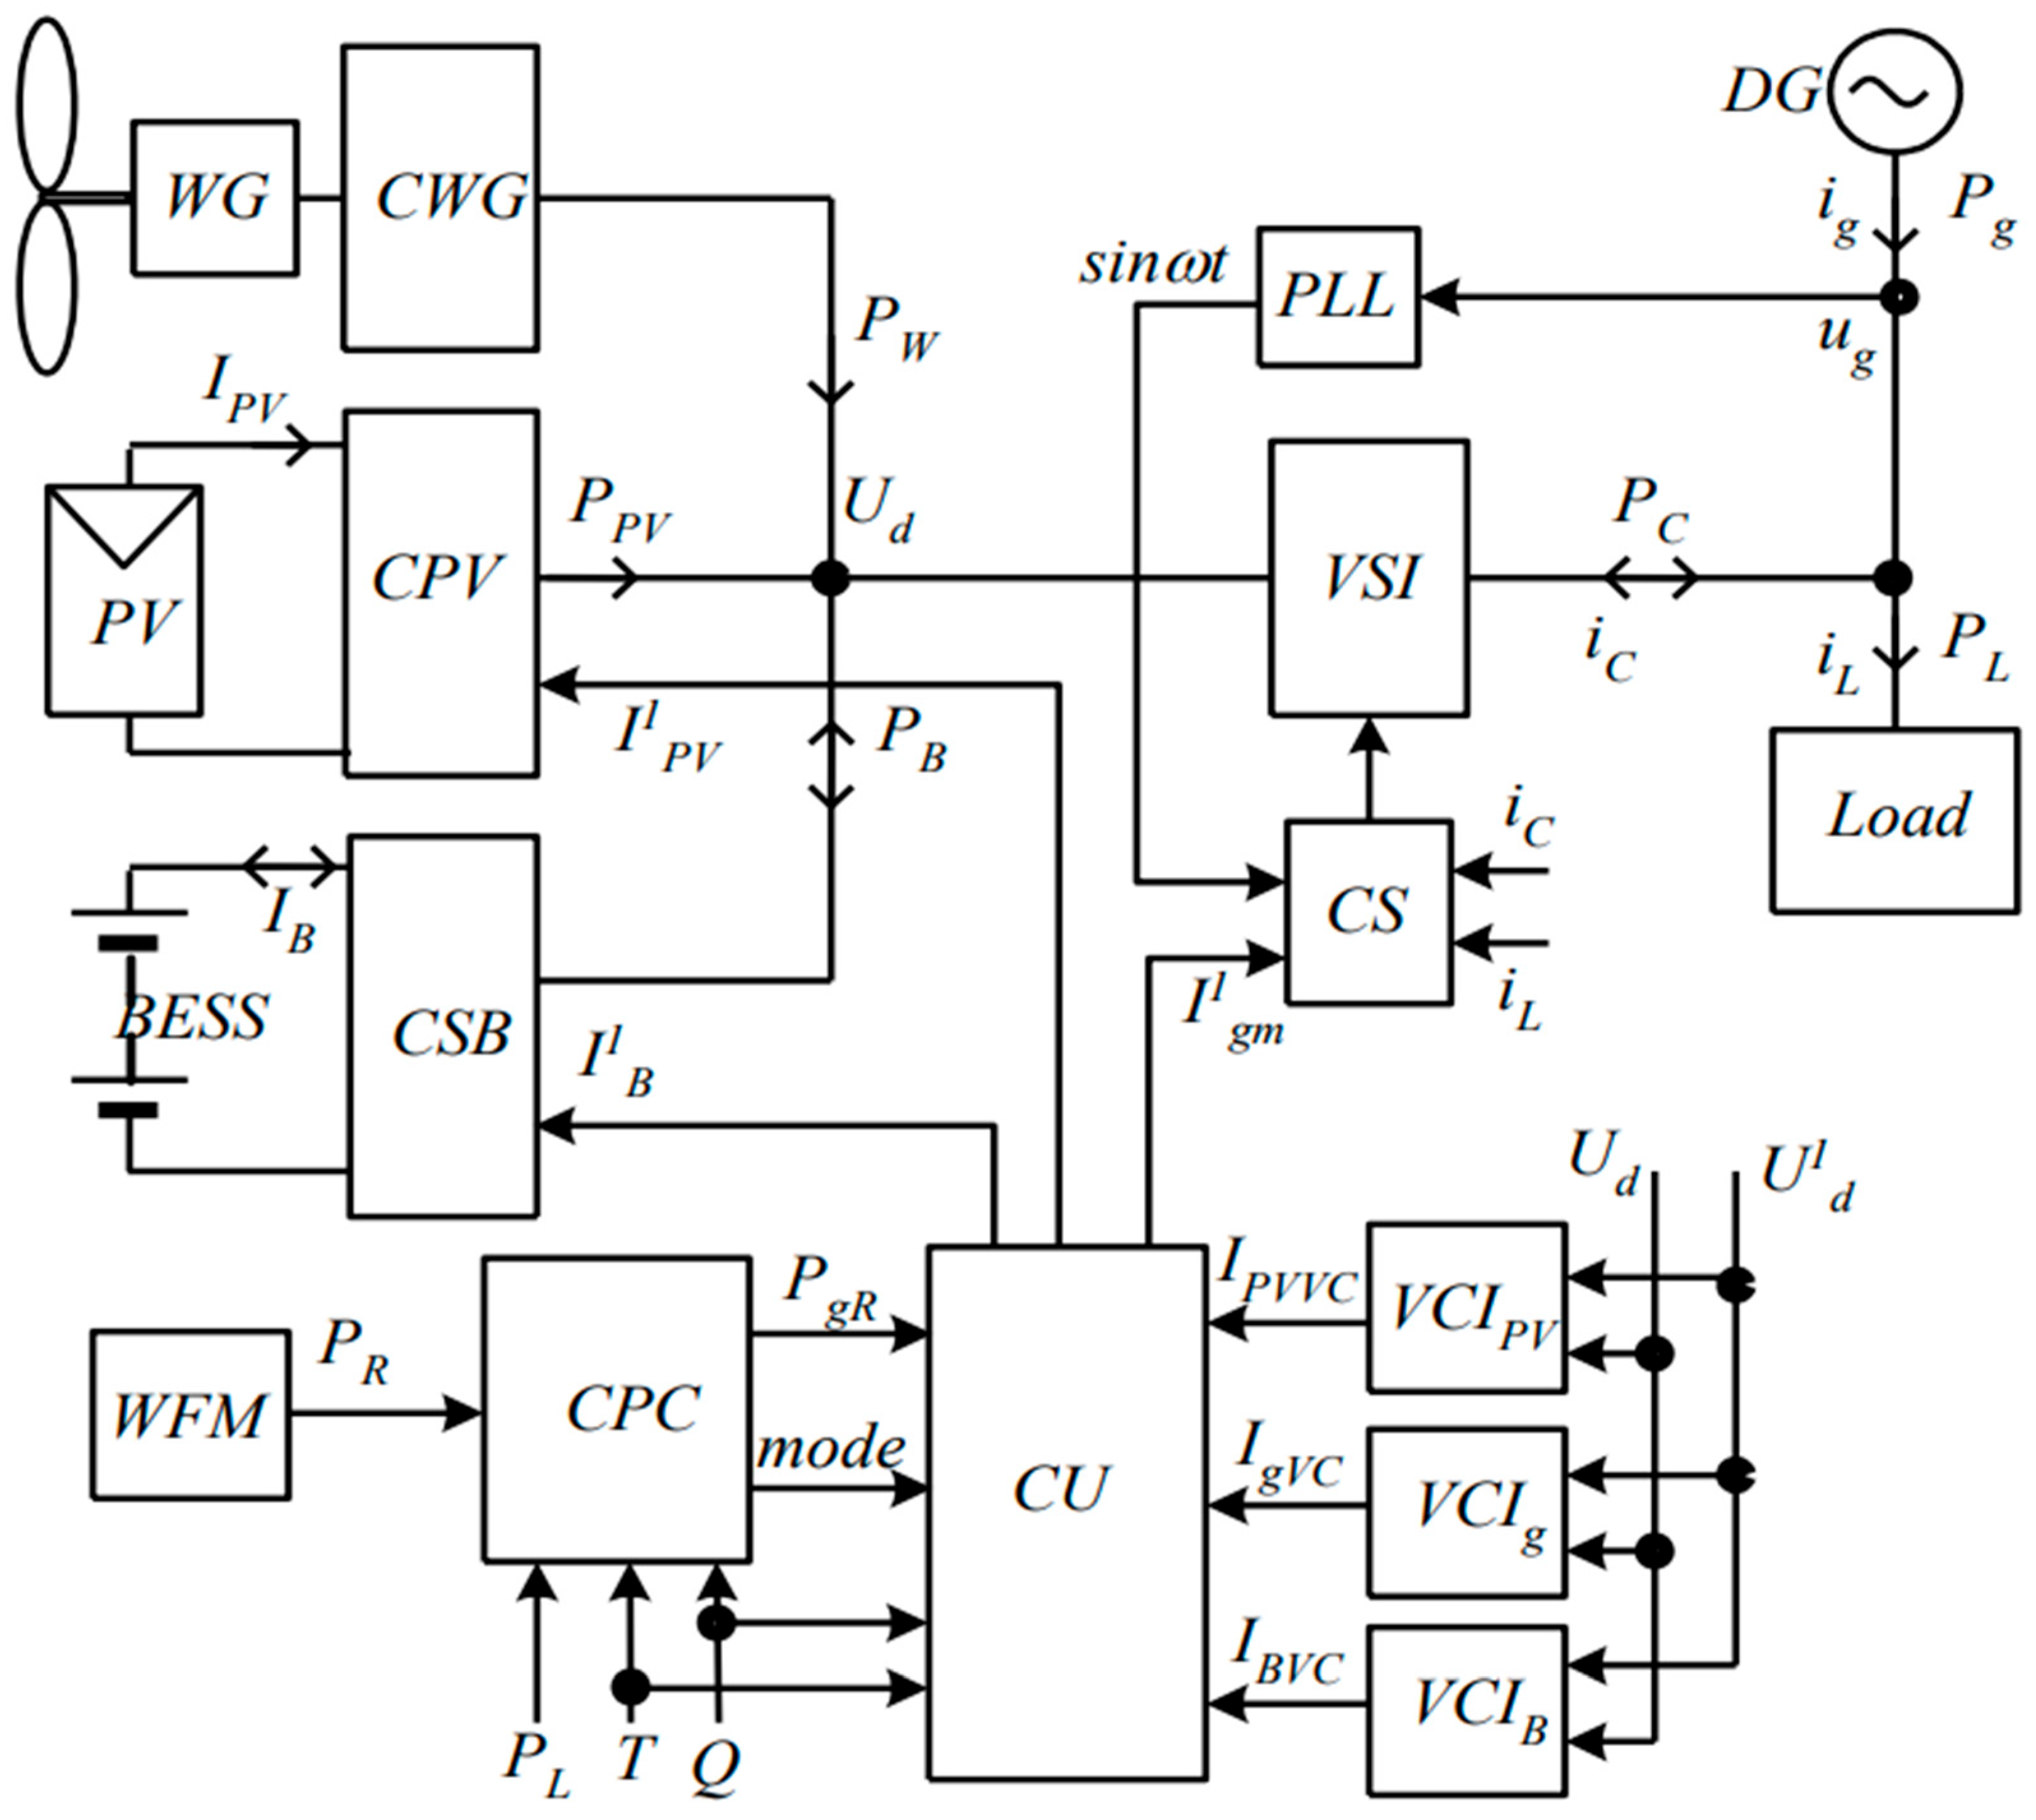
Figure 1. Simplified structure of the PV-WG system.
Energies 16 05851 g001
Figure 2. Daily load schedule of LO.
Energies 16 05851 g002
Figure 3. Block diagram of the algorithm for implementing changes in the structure of the control system.
Energies 16 05851 g003
Figure 4. Block diagram of the algorithm of calculation.
Energies 16 05851 g004
Figure 5. Oscillograms of Q*, battery current IB, RES power PR, load power PL, inverter power PC: (a) W*PV = 1, P*LAV = 1. (b) W*PV = 0.9, P*LAV = 1; (c) W*PV = 0.9, P*LAV = 0.877 with correction and Q1M = 1.05.
Energies 16 05851 g005
Figure 6. Oscillograms of Q*, battery current IB, RES power PRM for MPPT mode, RES power taking into account regulation PR, load power PL, inverter power PC: (a) W*PV = 1.1, P*LAV = 0.877. (b) W*PV = 1.1, P*LAV = 0.877 with correction and Q1M = 1.05.
Energies 16 05851 g006
Figure 7. Oscillograms of Q*, battery current IB, RES power PRM for MPPT mode, RES power taking into account regulation PR, load power PL, inverter power PC: (a) W*PV = 1.0, P*LAV = 0.9, (b) W*PV = 1.0, P*LAV = 0.9 with correction and Q1M = 1.05.
Energies 16 05851 g007
Figure 8. Oscillograms of Q*, battery current IB, RES power PRM for MPPT mode, RES power taking into account regulation PR, load power PL, inverter power PC: (a) W*PV = 0.81, P*LAV = 1, (b) W*PV = 0.8, P*LAV = 1.065 with correction and Q1M = 1.05.
Energies 16 05851 g008
Table 1. Simulation results when the load and generation of RES correspond to the calculated.
IndicatorsJanuaryFebruaryMarchAprilMayJuneJulyAugustSeptemberOctoberNovemberDecember
kE32.583.825.9511.8315.5614.4422.669.227.64.12.422.83
kE22.062.984.689.0412.4811.3417.847.155.843.231.932.25
kE11.782.393.776.6410.688.9814.25.434.342.611.681.93
Q*2R, %1001006036202820445075100100
Pg34, W120320000000012696
Pg45, W8060903037291933401218473
Table 2. Simulation results with load and RES generation deviation relative to the calculated values.
P*LAV, p.u.110.8770.877
P*PV, p.u.0.911.10.91.10.911.10.911.1
Q1M, p.u.---11---0.9511.050.9511.050.9511.05
kE33.853.823.823.484.243.463.463.474.224.424.54.414.614.674.434.674.75
kE232.982.982.733.282.672.672.673.23.343.43.343.483.523.353.513.57
kE12.532.392.392.342.562.162.162.162.462.542.572.542.612.632.542.632.66
Q*2, %100100100100100100100100100100100100100100100100100
Q*6, %102020202025252521.5202021212021.52020
Table 3. Simulation results when the load changes at intervals at Q1M = 1.05, P*LAV = 0.9.
P*PV, p.u.0.91.01.1
Correction+++
kE33.524.2253.524.5453.5224.635
kE22.7273.2292.7283.4532.7283.515
kE12.22.492.22.612.2012.643
Disclaimer/Publisher’s Note: The statements, opinions and data contained in all publications are solely those of the individual author(s) and contributor(s) and not of MDPI and/or the editor(s). MDPI and/or the editor(s) disclaim responsibility for any injury to people or property resulting from any ideas, methods, instructions or products referred to in the content.