Article

Heating Strategies for Efficient Combined Inductive and Convective Heating of Profiles

by
Raphael Gergely
* and
Christoph Hochenauer
Institute of Thermal Engineering, Graz University of Technology, Inffeldgasse 25/B/V, 8010 Graz, Austria
*
Author to whom correspondence should be addressed.
Energies 2023, 16(16), 5895; https://doi.org/10.3390/en16165895
Submission received: 27 June 2023 / Revised: 25 July 2023 / Accepted: 2 August 2023 / Published: 9 August 2023
(This article belongs to the Section J: Thermal Management)

Abstract

:
In this paper, an experimental and numerical study of a novel heating strategy is shown for thin profiled workpieces using induction and convective heating at the same time. A characteristic of induction heating is its potential for achieving efficient local heating due to the direct conversion of electromagnetic fields to thermal energy. One disadvantage of this is the high temperature gradients that occur on the workpiece and, therefore, the uneven distribution. This is even more significant for thin workpieces or workpieces made out of sheet metal due to the lighter mass and, therefore, less conduction away from the heating zone. This paper presents the idea of combining induction heating with convection to obtain a more even distribution of the temperature but with considerable energy savings compared to pure convective heating. The combination of both heating methods has been analysed both experimentally and numerically with different geometries. The multiphysic simulation included both the induction heating and also the convective heat transfer for temperature-dependent material properties. The results of the simulations and the experiments were in good agreement, and both showed that there is a huge potential for energy savings when convective heating is supported by induction heating (up to 53%). This study provides a reference for future industrial applications for heating sheet metal workpieces, e.g., for drying paint.

1. Introduction

Induction heating is a widely used clean heating method that uses an alternating current to directly heat the desired workpiece. This alternating current in the coil creates an alternating magnetic field that introduces eddy currents into the workpiece. These eddy currents then generate heat in the workpiece through the Joule effect [1,2]. Induction heating can produce very high temperature gradients due to the high energy induced into the workpiece (up to 30,000 W/cm3 [3]); therefore, it has a lot of industrial applications [4]. However, the distribution of the energy is very uneven. Several electromagnetic effects are responsible for this uneven distribution of heat. The most important effects mentioned in the literature are the following: skin effect [3,5,6], proximity effect [1], ring effect [1], slot effect [7], and end and edge effects [1].
In this study, the skin effect is the most important factor preventing uniform heating of the workpiece. The skin effect can be described as follows: the currents are mainly distributed on the outer layer of the workpiece located directly under the inductor coil, which is why this area is heated up the fastest. Several papers addressed the uneven distribution of the magnetic field and, thus, the temperature and provided various solutions to the problem. One method was to work with multiple coils. Plumed et al. [8] used a secondary coil to achieve uniform heating, Huang et al. [9] investigated multi-layer coils for their efficiency and uniformity in surface heating, and Shih et al. [10] investigated the difference between single and multi-zone induction heating based on their heating rates and uniformity of the temperature field. A common method to influence the uniformity of heating was to control the frequency of the induction heating device. Xiao et al. [11] controlled the temperature of a welded tube by varying the frequency. The third option often used to control the uniformity of the temperature field was to study the geometry of the magnetic flux concentrators (MFC). Bui et al. [12] studied the different geometries of MFC experimentally and numerically for the temperature distribution of a barrel injection moulding machine. Gao et al. [13] investigated the effects of different MFC geometries for point induction heating.
The energy provided by the inductor is distributed throughout the workpiece via heat conduction. This works well with volumetric workpieces as their greater mass compared to their surface area helps to make the temperature distribution uniform. The workpieces used in this study were made of sheet metal and were, therefore, not as suitable as the more volumetric workpieces mentioned earlier. Examples of the heating of volumetric workpieces in the literature include Sun et al. [14] for heavy cylinders, Thosdeekoraphat et al. [15] for heating a biomass tank, and Fu et al. for bevel gears [16].
The literature on induction heating of sheet metal is widespread, but only for flat sheets and not bent structures made from sheet metal, as presented in this paper. Vibrans [17] studied induction heating in hot stamping and press hardening. The hot forming of sheet metal was also studied experimentally and numerically by Bao et al. [18], using different geometries of the magnetiser to achieve a better distribution of the temperature field. Wang et al. [19] showed the bending of a steel sheet during heating with an inductor.
Another method for heating difficult workpieces or geometries is to use a second heat source. The most common combination found in the literature was the combination of induction heating and laser heating. Zhu et al. [20] showed a process for laser build-up welding with induction heating. The influence of induction pre-heating and post-heating in laser welding was shown by Li et al. [21]. Fan et al. [22] dealt experimentally and numerically with synchronous induction heating for laser-based directional energy deposition of thin-walled structures.
The combination of induction and convection has been covered less frequently in the literature. Two publications focused on the natural convection of water for household applications. Kawakami et al. [23] demonstrated natural convection in an inductively heated pan and compared induction heating with gas stove heating. Elsaady et al. [24] analysed numerically and experimentally household heating systems with coupled multiphase simulation with natural convection and induction, and Park et al. [25] experimentally showed a design and the implementation of a domestic induction heating system which can deal with ferromagnetic and non-ferromagnetic pots. Mouallem et al. [26] numerically dealt with the heating of particles dispersed in a turbulent flow.
The novel idea of this publication is to investigate experimentally and numerically the combination of induction and forced convection to heat geometries that are normally not suitable for induction heating and to combine the advantages of both heating methods. The high efficiency of induction is due to its direct energy input, geometry independence and high flexibility of convection.
The chosen geometries were made from bending sheet metal. Another issue investigated in this study was whether the same inductor geometry could be used for different geometries when combined with forced convection, as one disadvantage of induction is that it is difficult to design matching coils for different workpieces due to the high complexity of the magnetic field coupling between the workpiece and the induction coil. Therefore, the second geometry has a slope at the top and would normally require a different inductor geometry to be heated efficiently or even an inductor that can change its shape, as shown by Cao et al. [27]. The investigation in this paper should prove that the combination of forced convection and induction can be used in this case as well.
This work also aims to demonstrate the increase in efficiency of the novel combined heating method compared to pure convection and to present an efficient strategy that optimally exploits the advantages of both processes.

2. Materials and Methods

2.1. Experiments

2.1.1. Structure of the Test Rig

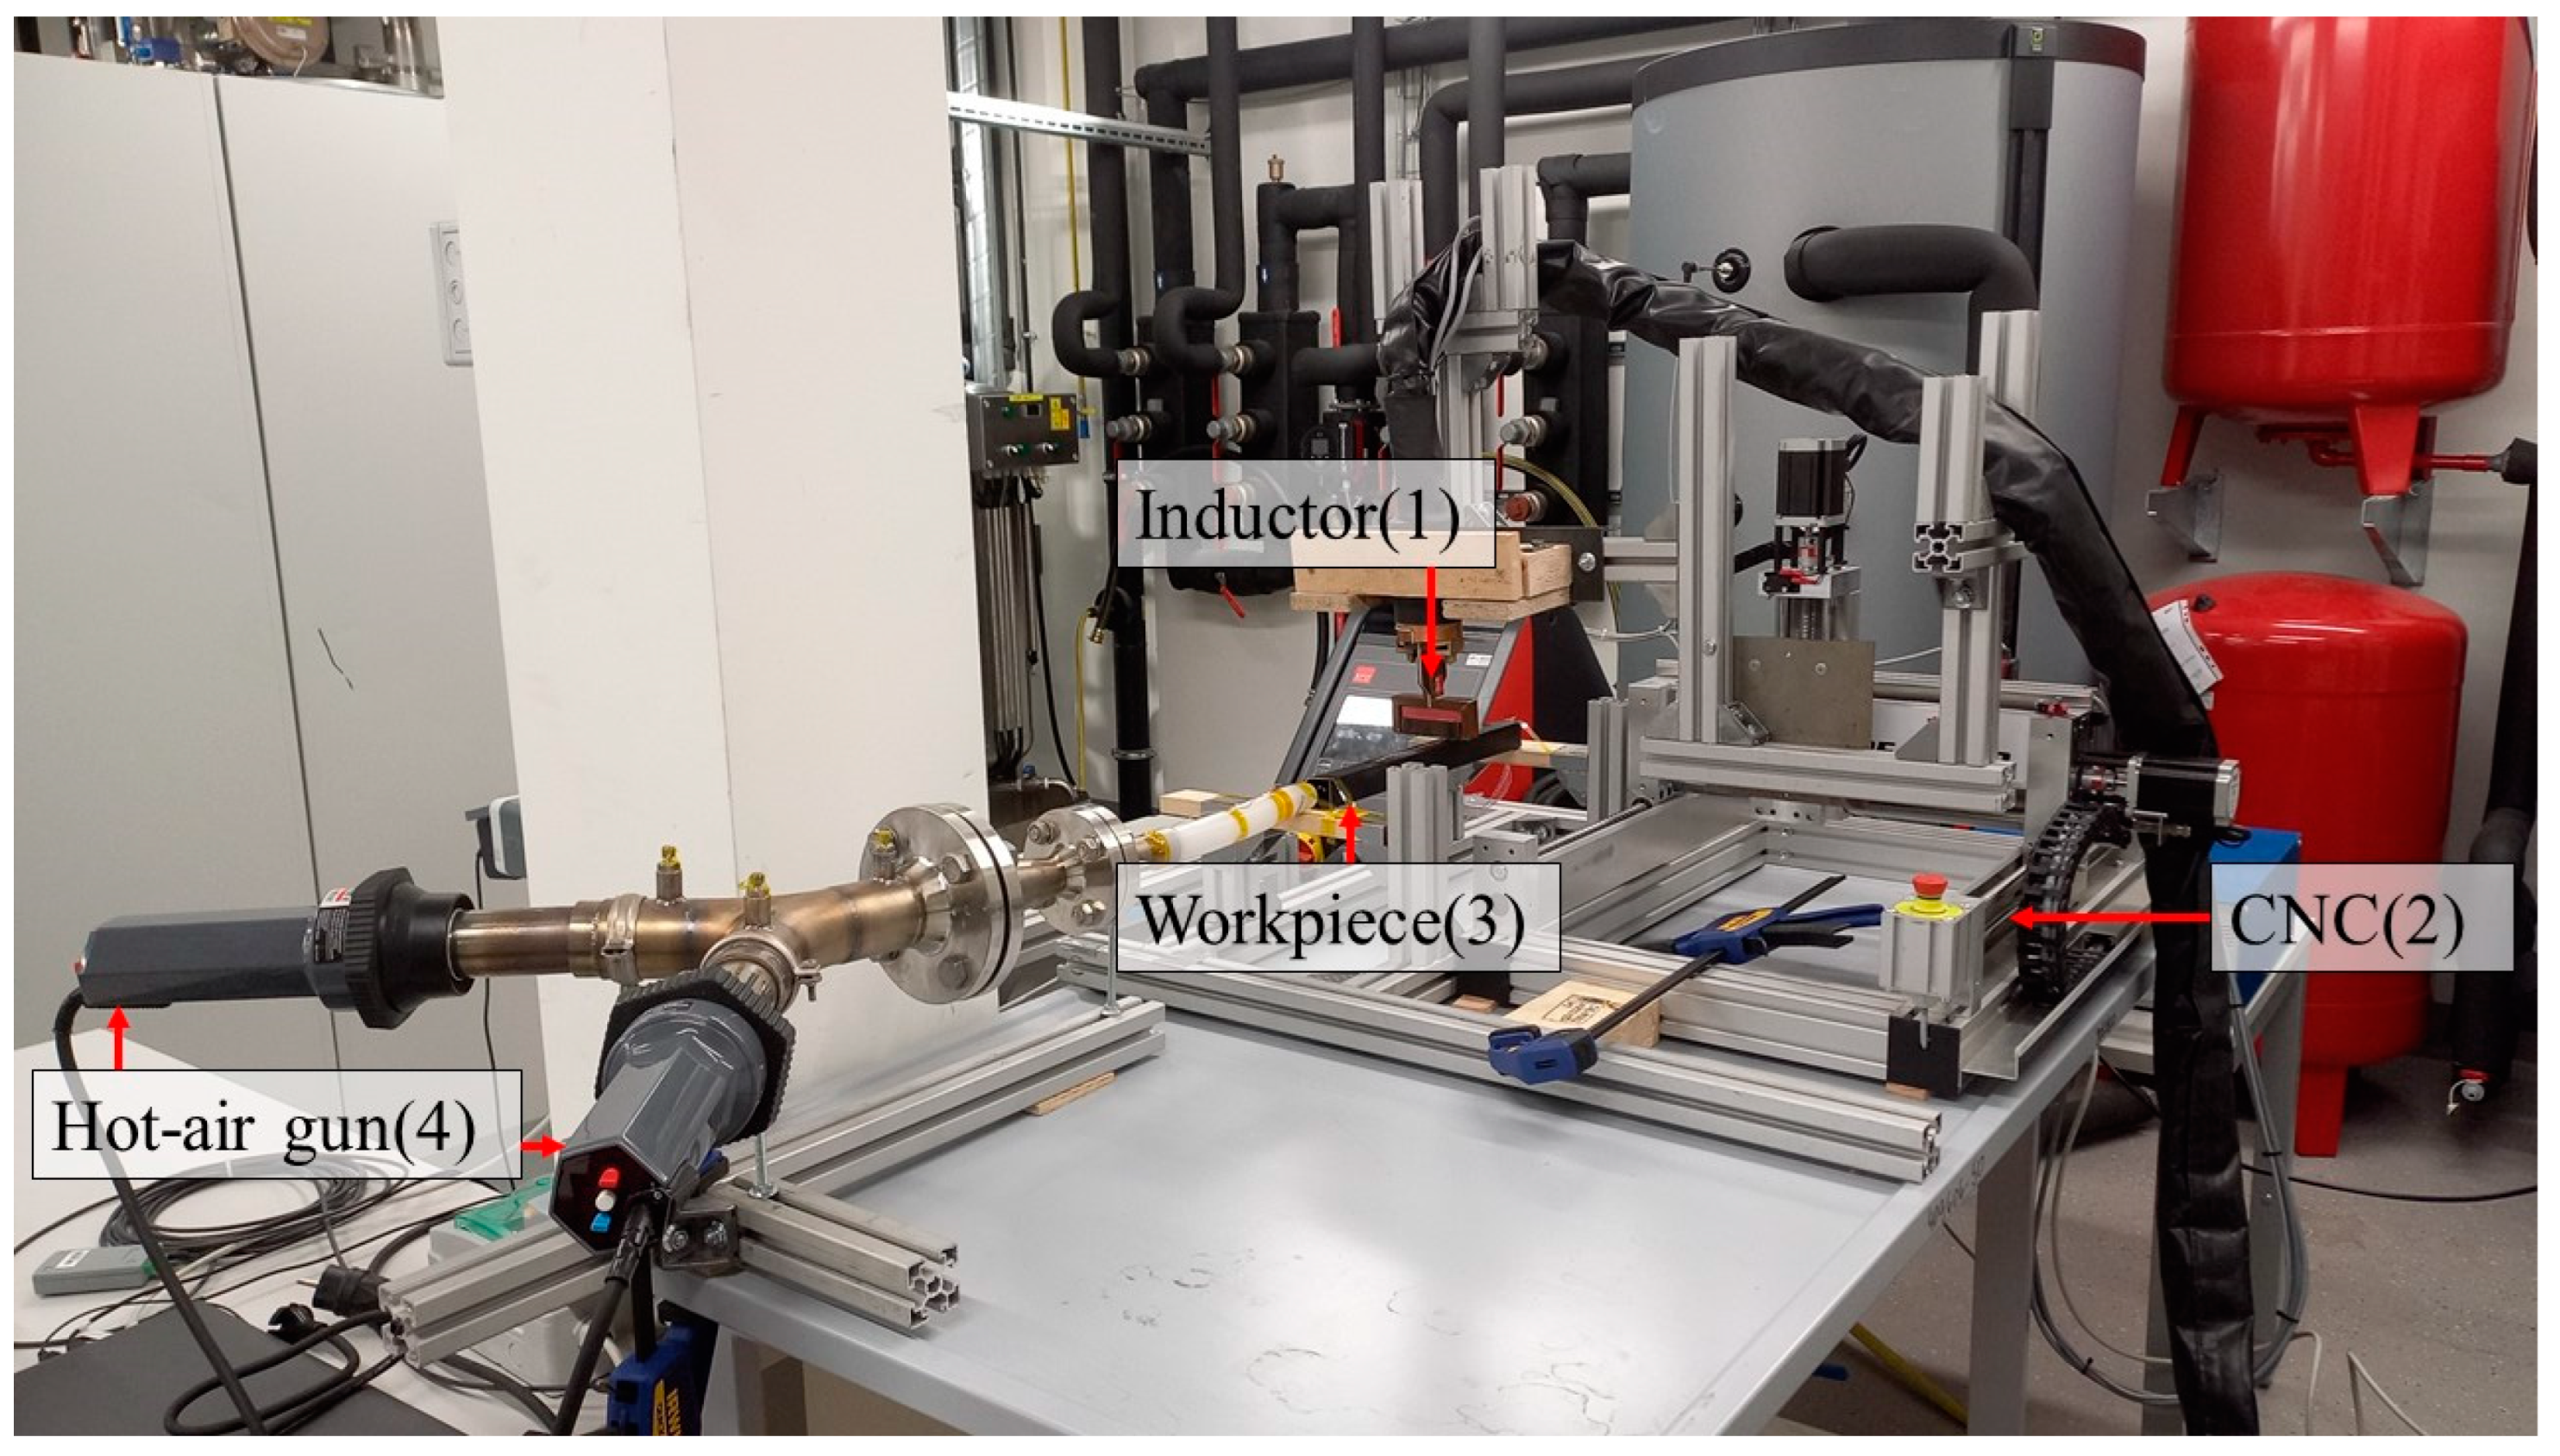
A test rig was designed and built to heat different profiles with a combination of induction and convection to experimentally demonstrate the potential of energy saving. In order to be able to carry out a range of experiments, a great deal of flexibility was required in the test rig, considering the following parameters: power of the inductor, feed rate of the inductor and air gap. The test rig is shown schematically in Figure 1. The inductor (1) is mounted on a CNC machine (2) that can move in three directions (x, y, z). This ensures a uniform speed of the coil as it moves over the workpiece and a constant air gap between the coil and the inductor. The induction coil was supplied by a commercially available power converter that could be programmed for different power outputs. Convective heat transfer is provided by two hot air guns (4). The two hot air guns have been connected with a y-shaped tube and lead to a silicone hose that guides the air mass flow to the workpiece.
The test bench is shown in Figure 2, where the CNC machine (2) with the induction coil (1) mounted is clearly visible. The workpieces (3) were always precisely positioned under the induction coil, with particular care taken to ensure an even air gap between the induction coil and the workpiece. The workpiece is placed on two wooden strips at the front and end to minimise interference from the inductor and to suspend the workpiece in the air to prevent heat conduction from the workpiece to the table.
To prevent local heating at the inlet of the air flow, steel wool was added to achieve a more diffuse energy input, which can be seen in more detail in Figure 3. The configuration of the hot air guns with the silicone hose was chosen to be able to direct the hot air through the profiles and to have a less complex system for the later simulations, where a more external free-flowing air stream would have created more uncertainties in the placement of the cases.

2.1.2. Execution of the Experiments

The following tests were carried out on the workpieces. The first series of tests consisted of heating the workpiece to a target temperature only by convective heat transfer. The hot air flow was generated using the two hot air guns. This test was performed with two different hot air mass flows, 6 g/s and 12 g/s, respectively, which were calculated from the temperature at the outlet and the power in the same way as Gerhardter et al. [28] calculated in their experiments. These experiments were used to have a comparison for the combined heating strategies. The convection experiments were repeated several times with slight changes in the position where the hot air entered the workpiece until a homogeneous temperature distribution was achieved This position was then used for the following combined heating experiments. The electrical power of the hot air guns was measured using two single-phase meters and transmitted every second to a measurement PC that recorded the data. According to the data sheet, the measurement error of the instrument is ±0.5%.
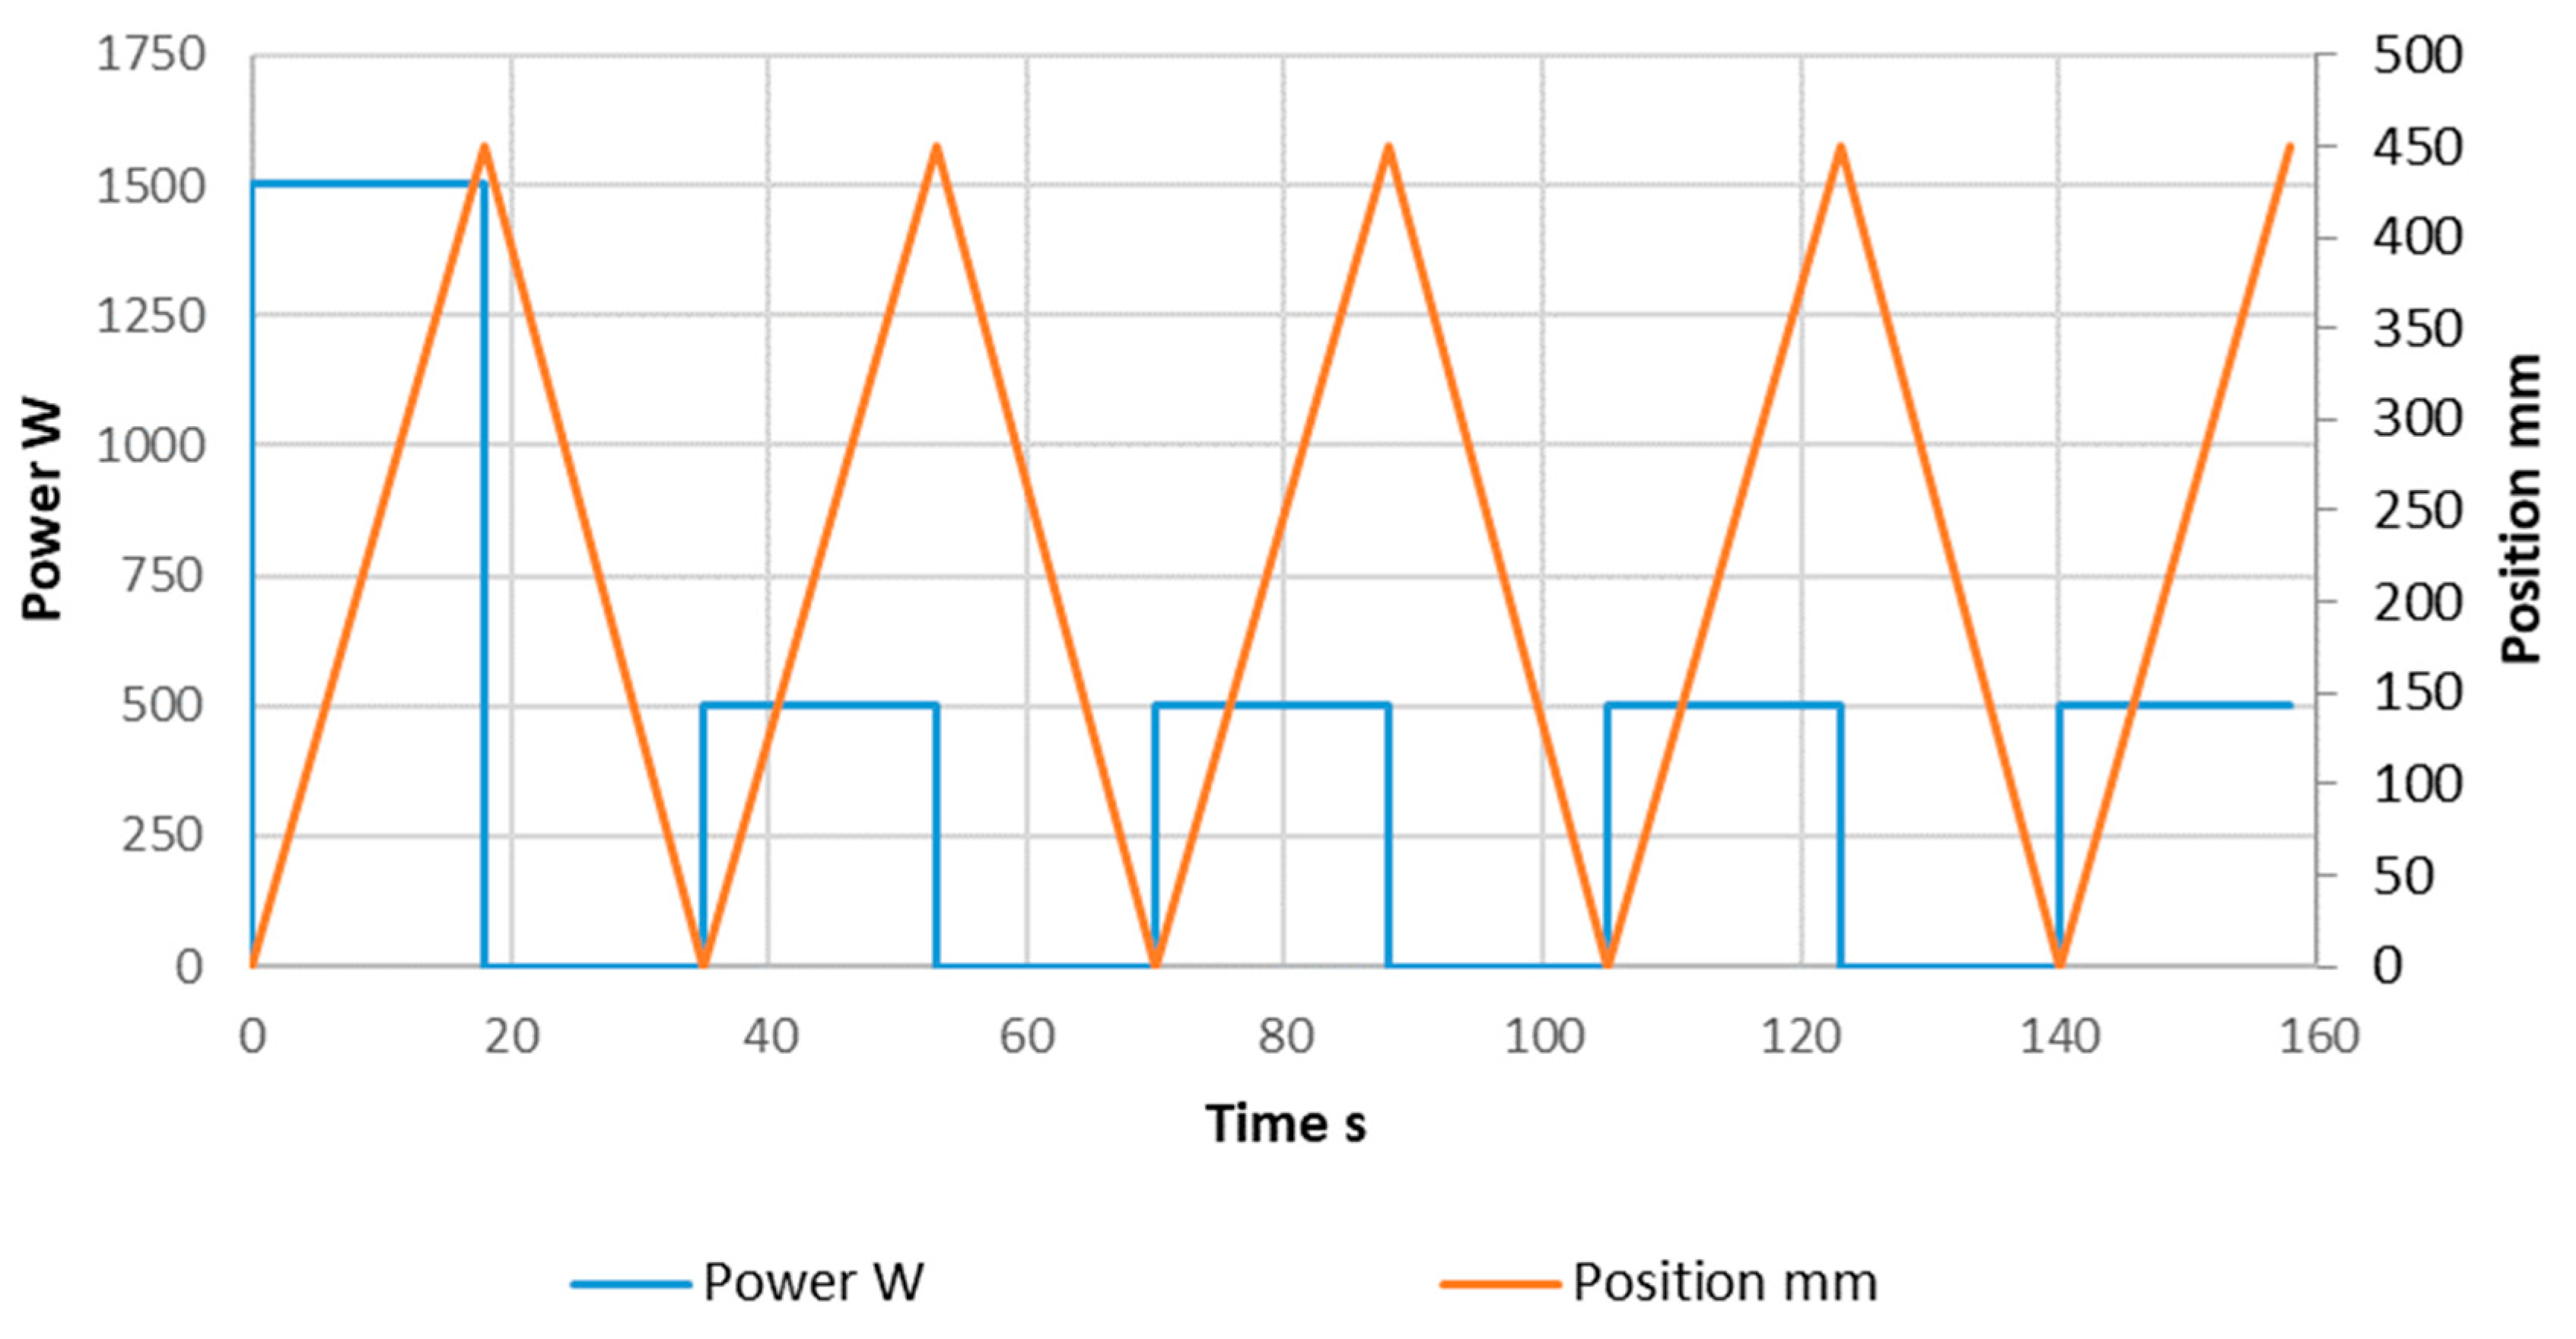
The other series of tests were carried out with a combination of convection and induction. In these tests, the hot air gun was also operated with two different mass flows, and the top of the workpiece was heated by the inductor, as shown in Figure 3. The strategy used for induction heating can be seen in Figure 4. To ensure the most efficient induction heating, the strategy was to bring the workpiece to the target temperature without overheating it and then reduce the inductor power for the following heating steps to maintain the temperature at the surface level. The exact parameters for the experiments are listed in Table 1. The inductor parameters were chosen to allow the inductor to operate with a small air gap to ensure efficiency and to allow the inductor to operate at the lower end of its operating power (500 W) without overheating the workpiece and to reach the targeted temperature.
The temperature was measured with 9 thermocouples on the workpiece (see Figure 5) and with one thermocouple at the outlet of the hot air blowers to measure the inlet temperature for convective heat transfer (Figure 3). To determine the total amount of electrical energy used to heat the workpiece to the target temperature, the electrical power absorbed by the two hot air guns was measured every second. For the electrical power of the inductor, the absorbed power was also measured each time the inductor was switched on. The inductor coil used is shown in Figure 6; it is a single-wound coil, meaning that the actual coil, which interacts with the workpiece, only consists of one rectangular straight piece of copper marked as coil in Figure 6. In the figure, the magnetic flux concentrator is shown in black the top part of the coil is for mounting to the power converter.
T-type thermocouples were used for the temperature measurements because of their fast response to the thermal changes that occur during induction heating. The thermocouples were calibrated in a water bath prior to the measurements. The temperature uncertainty of the thermocouples is ±1 K in the temperature range from −40 °C to 133 °C and ±0.75% in the temperature range from 133 °C to 350 °C. The experimental setup allows ten temperature measurements to be made in parallel. The thermocouples are connected to the inputs of transducers. The transducers convert the input variable into a 4–20 mA standardised signal. The actual measurements and pre-processing are performed using the EUROTHERM 2500 I/O (Eurotherm Inc., Worthing, UK) system, specifically analogue input modules. The measured data are transferred to the PC in real time via ethernet.
The aim of the experiments was to find the point with the highest efficiency between inductive and convective heat transfer. To find this point, two different profiles, which can be seen in Figure 5, were tested on the test bench. Both geometries were made of ferromagnetic steel with a thickness of 1.5 mm. The previously mentioned inductive heating strategy was developed via a series of experiments, and the most efficient of these strategies in terms of feed rate and inductor power was selected. The induction heating strategy remained the same for all the experiments shown and can be seen for both the power of the inductor and the coordinate of the inductor coil Figure 4. In addition, the current in the inductor coil and the frequency for both profiles can be seen in Table 1. The values in this table are the average of several experiments with the same conditions. For each forward pass of the inductor, the power is switched on as indicated by the blue line, and for the return to the starting position, the inductor is switched off. The orange line indicates the position of the induction coil relative to the workpiece, measured from the starting position at 20 mm in front of the workpiece, as shown in Figure 3. In the first run, the inductor is operated at 1500 W to reach the target temperature of 100 °C at the top of the profile. For the rest of the experiment, the inductor is operated at 500 W and continuously moved back and forth over the workpiece. The following tests were carried out:
  • Pure convection heating with minimal mass flow of the heat gun (~6 g/s);
  • Pure convection heating with maximum mass flow of the heat gun (~12 g/s);
  • Combination of induction and convection with minimal mass flow (~6 g/s);
  • Combination of induction and convection with max mass flow (~12 g/s).

2.2. Simulation

2.2.1. Mathematical Description

The mathematical description has been included in this paper to show that the theoretical background simulations have been carried out using the commercially available Ansys software package.
The basic electromagnetic phenomena in induction heating are as follows: an alternating current is applied to a coil, which then generates an alternating magnetic field with the same frequency around the coil, as described in Equation (1). The strength of this magnetic field depends on the following factors:
  • The current flowing through the inductor coil;
  • The geometry of the coil;
  • The electromagnetic coupling between the workpiece and the coil [1,12,29].
This induces eddy currents into the workpiece and other objects near the coil. This phenomenon is described in Equation (2). The frequency of the introduced currents is the same as the electric field frequencies, but the direction is opposite, hence the minus sign in Equation (2).
To calculate the thermal field for induction heating, Maxwell’s equations must first be solved. These equations describe the time-varying electric field and can be seen in differential form in Equations (1)–(3). H (A m−1) is the magnetic field density, J (A m−2) is the conduction current density, E (V m −1) is the electric field density, and B (T) is the magnetic flux density.
× H = J + D t
× E = B t
· B = 0
To solve Maxwell’s equations, the relationships between the field quantities must be specified, which is carried out in Equation (4). The parameter ε is the relative permittivity, μr is the relative magnetic permeability, and σ is the electrical conductivity of the material. The natural constants used are the following: μ0 is the permeability of free space, and ε0 is permittivity of free space.
B = μ r μ 0 H
J = σ E
Equation (3) shows that the magnetic flux satisfies a zero-divergence condition and can, therefore, be expressed by the magnetic vector potential A, as shown in Equation (6).
B = × A
Through derivation of the above Equation (7) can be obtained.
J = 1 μ r μ 0   ( × × A ) + σ A t
The volumetric heat source obtained with the eddy currents is described in Equation (8).
q = J 2 σ
The time-dependent heat transfer process can be described with the Fourier Equation (9). Here, ρ (kg m−3) is the density of the material, c (J (kg K)−1) is its specific heat capacity, T (K) is the temperature, k (W(mK)−1) is the thermal conductivity, and Q (J m−3 s−1) is the heat source density obtained per unit volume obtained in Equation (8). c and k are both non-linear functions dependent on the temperature.
ρ   c   T t +   · ( k T ) = q

2.2.2. Execution of Simulation

To further validate the results shown in the experiments and to fill a gap in the literature where no simulation of parallel convection and conduction could be found during the research for this paper, two cases were selected for simulation, and the results of these simulations were then compared with the experimental results.
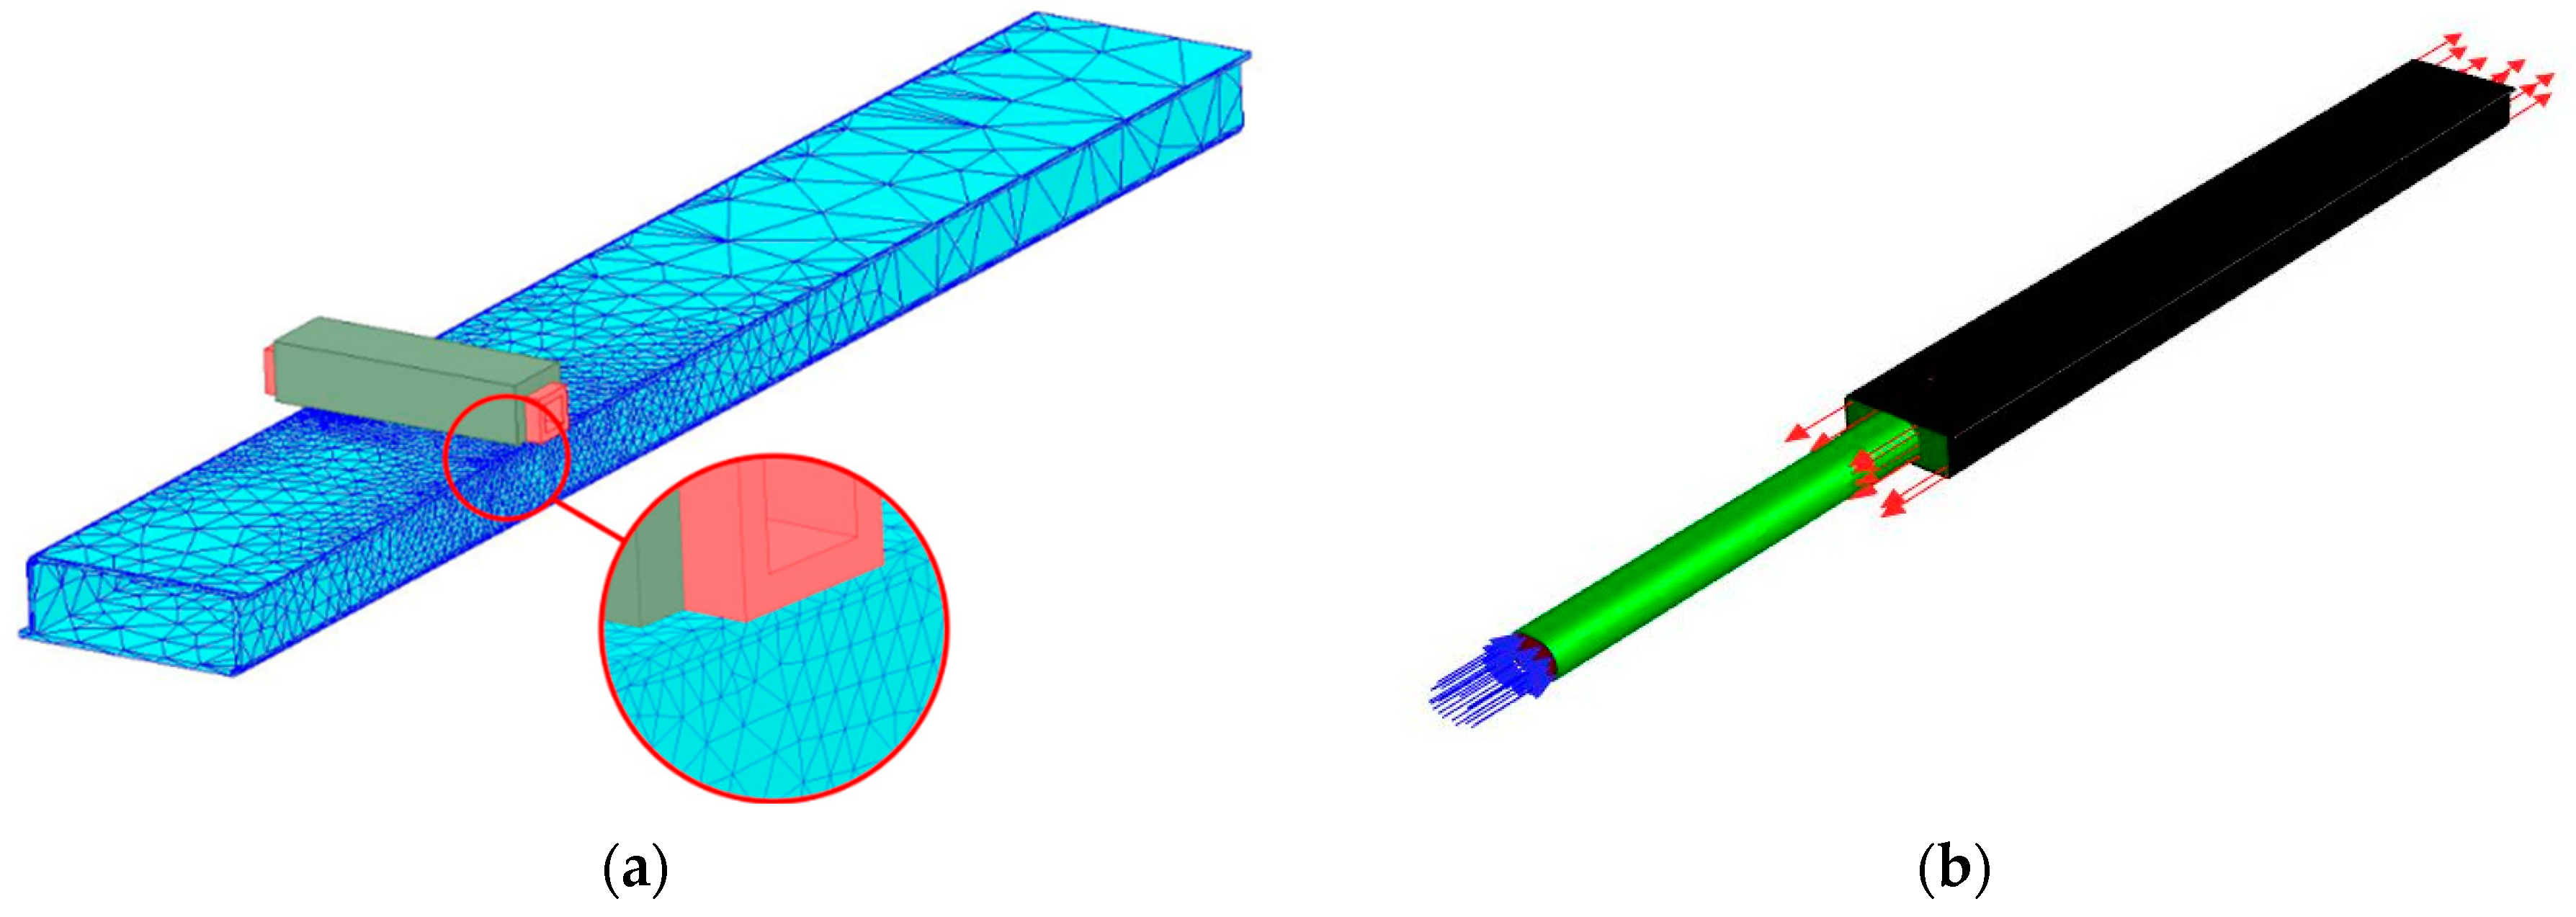
For an accurate numerical model, both the multiphysics and the non-linearity of the problem must be considered [30], so a combination of electromagnetic analysis and heat transfer is required, and the temperature-dependent material properties must be taken into account. This was conducted in this work using the commercially available Ansys software package. Ansys Maxwell (release 2020 R2) [31] is used for the electromagnetic side of the simulation. The heat transfer in the workpiece and the convective heat transfer from the hot air guns to the workpiece were modelled in Fluent. To reduce the numerical effort, the inductor model was simplified, and only the relevant part of the coil was modelled, as shown in Figure 7.
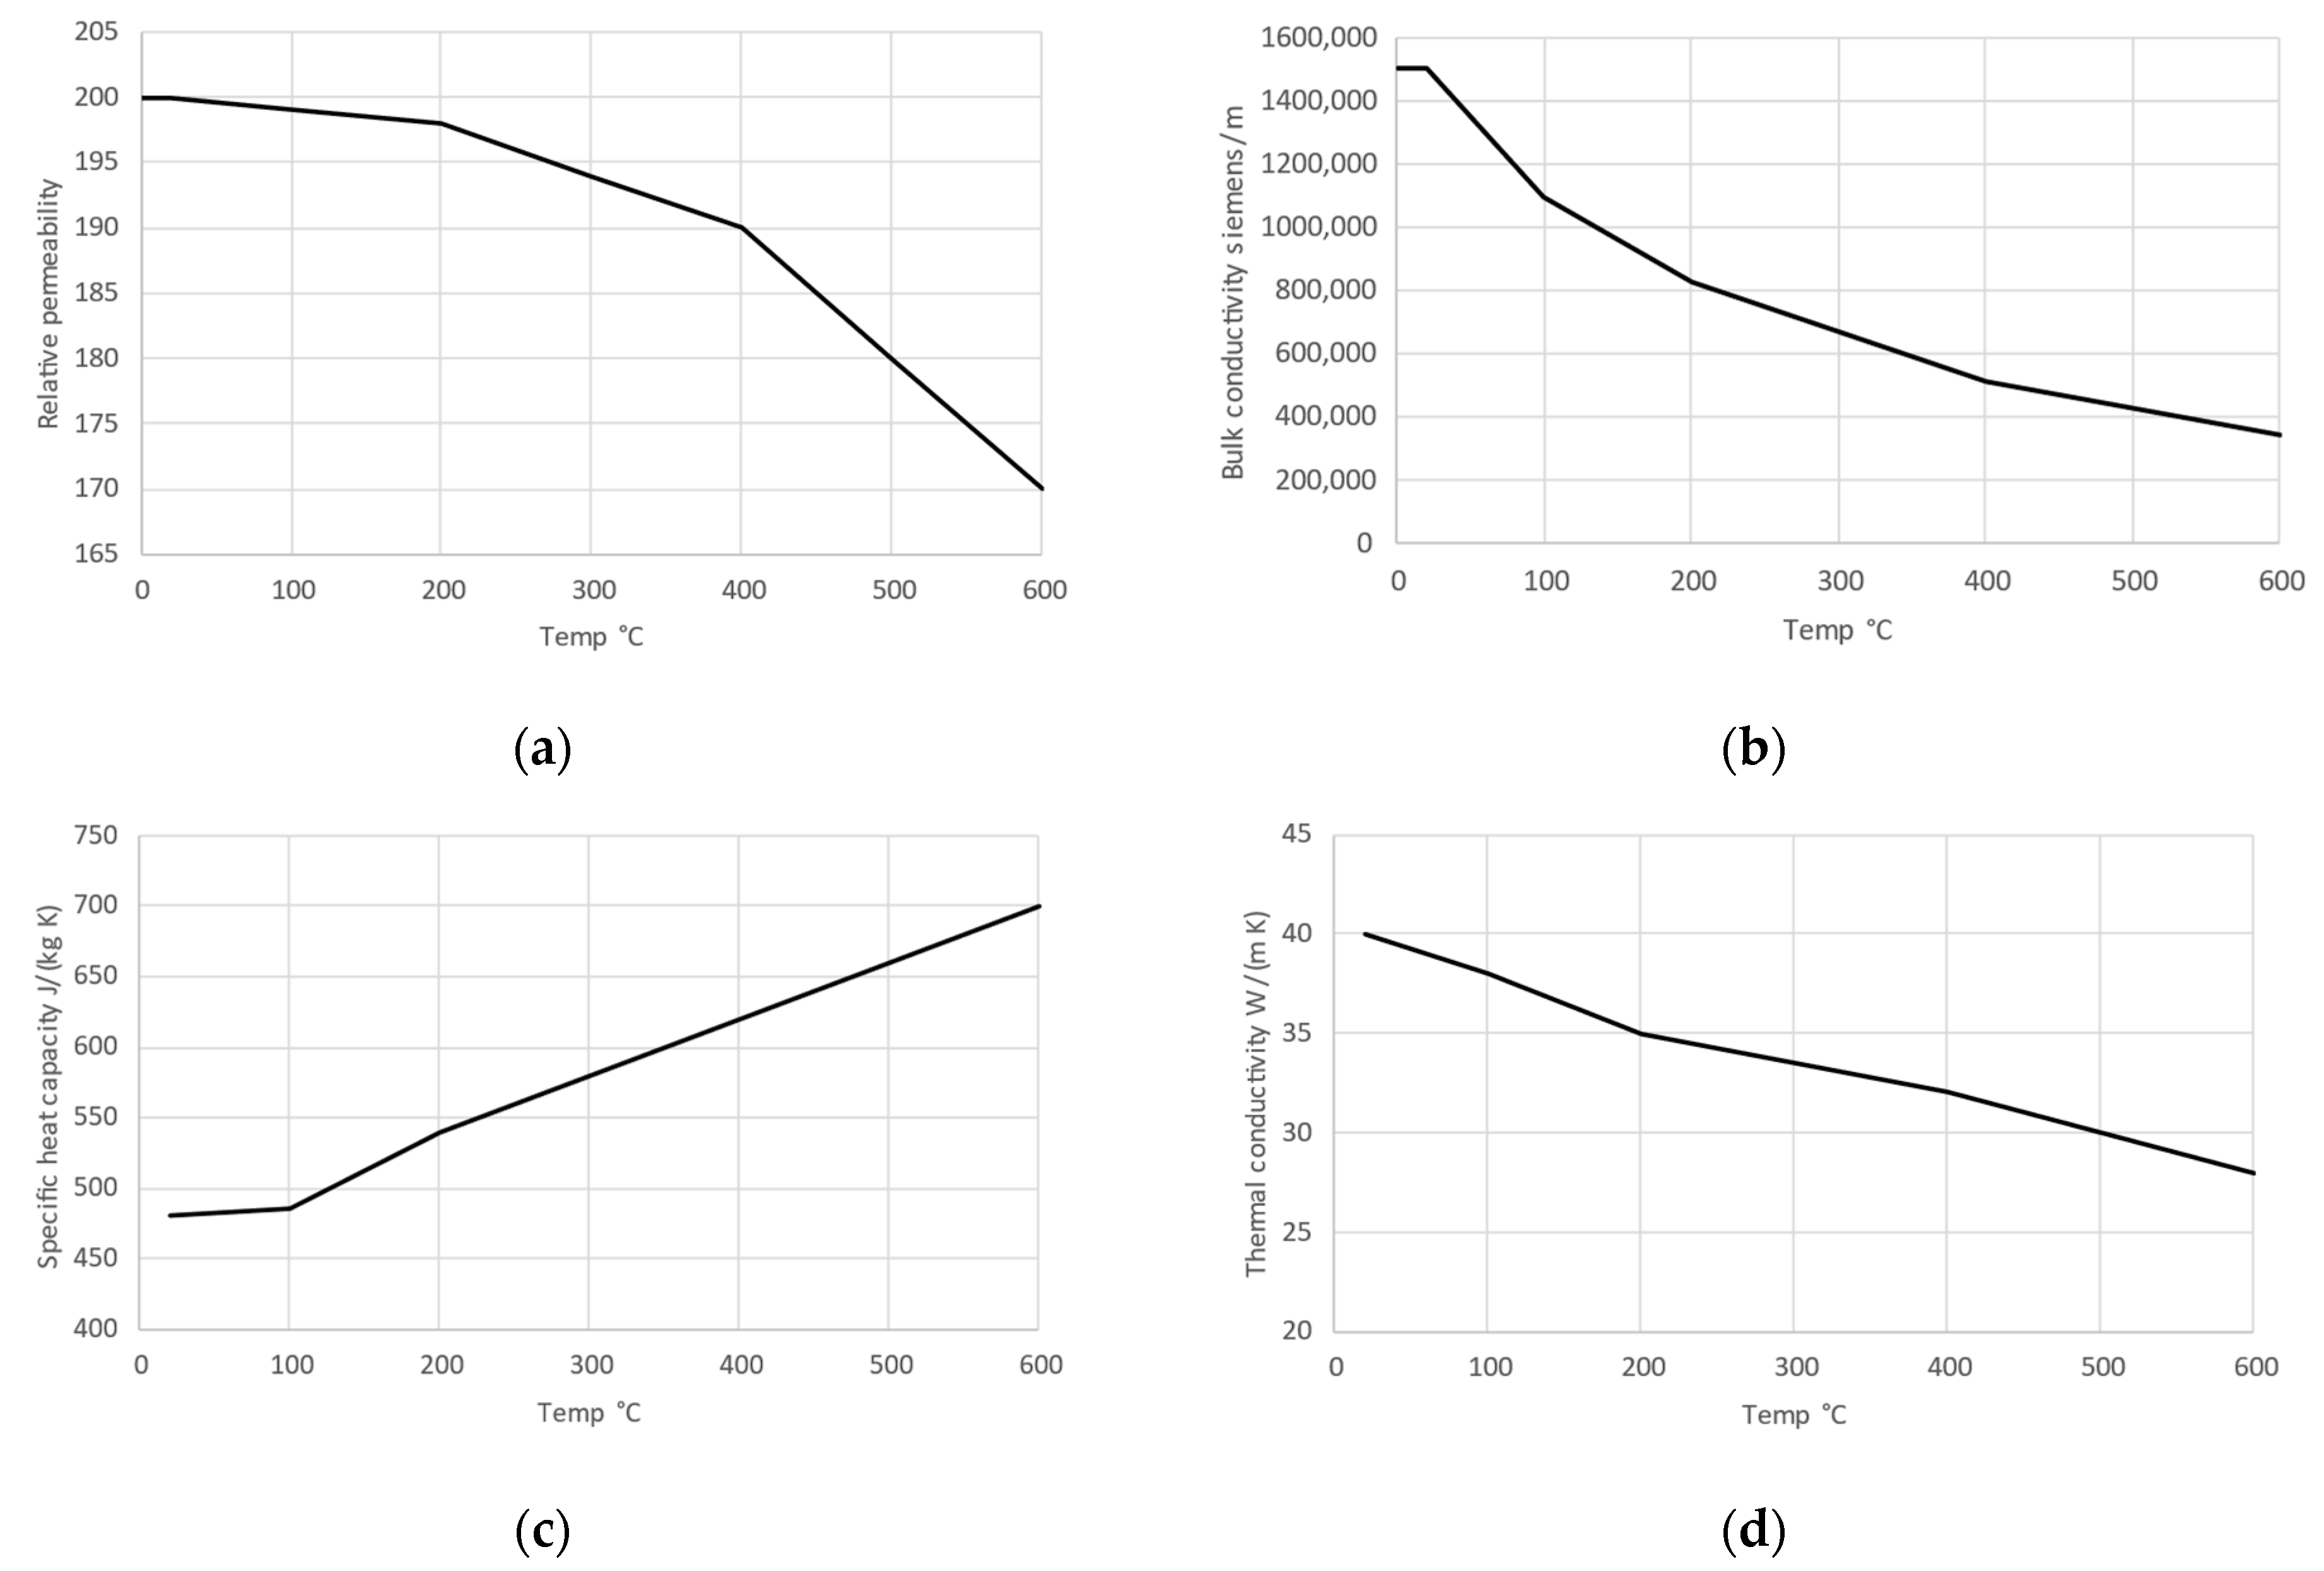
In Maxwell, the electromagnetic coupling between the coil with its magnetic flux concentrators and the workpiece is simulated. From this, the eddy currents in the workpiece were calculated and, out of this, the ohmic losses. These losses were then sent to the thermal simulation, which is handled in Ansys Fluent (release 2020 R2) [32], where the temperatures resulting from the losses and the forced convection are calculated. The coil is modelled with copper, and the magnetic flux concentrator is modelled with ferromagnetic steel. The material properties of the simulations can be seen in Table 2 and in Figure 8. The temperature is only updated for the workpiece and not for the coil and the magnetic concentrators because, in the experimental setup, the coil is cooled with water. Therefore, the temperature is not increasing much. After each timestep, the inductor coil is moved in the electromagnetic simulation according to the position shown in Figure 4. The electromagnetic coupling is simulated again until convergence is reached with the new position.
The time step was set to 0.5 s, and the end time was set to 158 s for both profiles, which correspond to 5 passes of the inductor. The maximum number of iterations for each time step in the coupling was set to 5, which was enough to ensure convergence for every time step. The excitation current for the induction coil was also set in time according to the power in Figure 4. The inductor design was highly simplified for the simulation, and the excitation current was directly assigned to both ends of the coil without modelling the mounting bracket of the coil. The frequency of the excitation current did not change with the alteration in the power and was set to 15 kHz, which was also used in the experiment. After each pass, the position of the induction coil is reset to start, and the excitation current is set to zero until the next pass. At this stage of the simulation, heating is only by forced convection.
The mesh in the electromagnet part of the simulation was automatically generated using the software using adaptive methods. Figure 7 shows the adaptive mesh for the time step of 5 s. The mesh is fine under the induction coil, where all the electromagnetic phenomena take place. Further away from the coil, the mesh is coarse to keep the simulation numerically cheap because there are hardly any electromagnetic phenomena, so the accuracy of the simulation is still valid. For the angled profile, the maximum number of adaptive passes was increased from 30 to 200 because the convergence could not be achieved with fewer passes due to the more complex geometry. In order to obtain a finer mesh in the most important zone of the workpiece close to the inductor, the workpieces were always modelled in 2 parts in the zone closest to the induction coil. This can be seen in the detail in Figure 7, where it is clearly visible that there are 2 layers of elements.
For the thermal simulation of this work, the turbulence caused by the air flow inside the workpieces was modelled with the SST k-Ω model. In this model, the inner 50% of the boundary layer is modelled according to Wilcox’s k-ω, but towards the boundary layer edge, it gradually changes to the standard k-ε model. SST stands for shear stress transport and describes the additional ability of the model to account for the transport of the principal turbulent shear stress in the case of a negative pressure [33,34]. The convection model on the flowing geometry was simplified, as shown in Figure 7, as only the workpiece was of interest. The air inlet was simplified and modelled only from the temperature measurement point onwards. The blue arrows in Figure 7b mark the inlet. The inlet temperature and mass flow of the air were assigned according to the experiment. Both sides of the profile were defined as pressure outlets (indicated by the red arrows in Figure 7) with a pressure of 1 bar, as seen in Figure 7. On all other walls on the profiles, a heat transfer coefficient of 5 W/(m2·K) to simulate the natural convection was applied, and the ambient temperature was set to be at 20 °C according to the experiments.

3. Results

3.1. Experimental Results

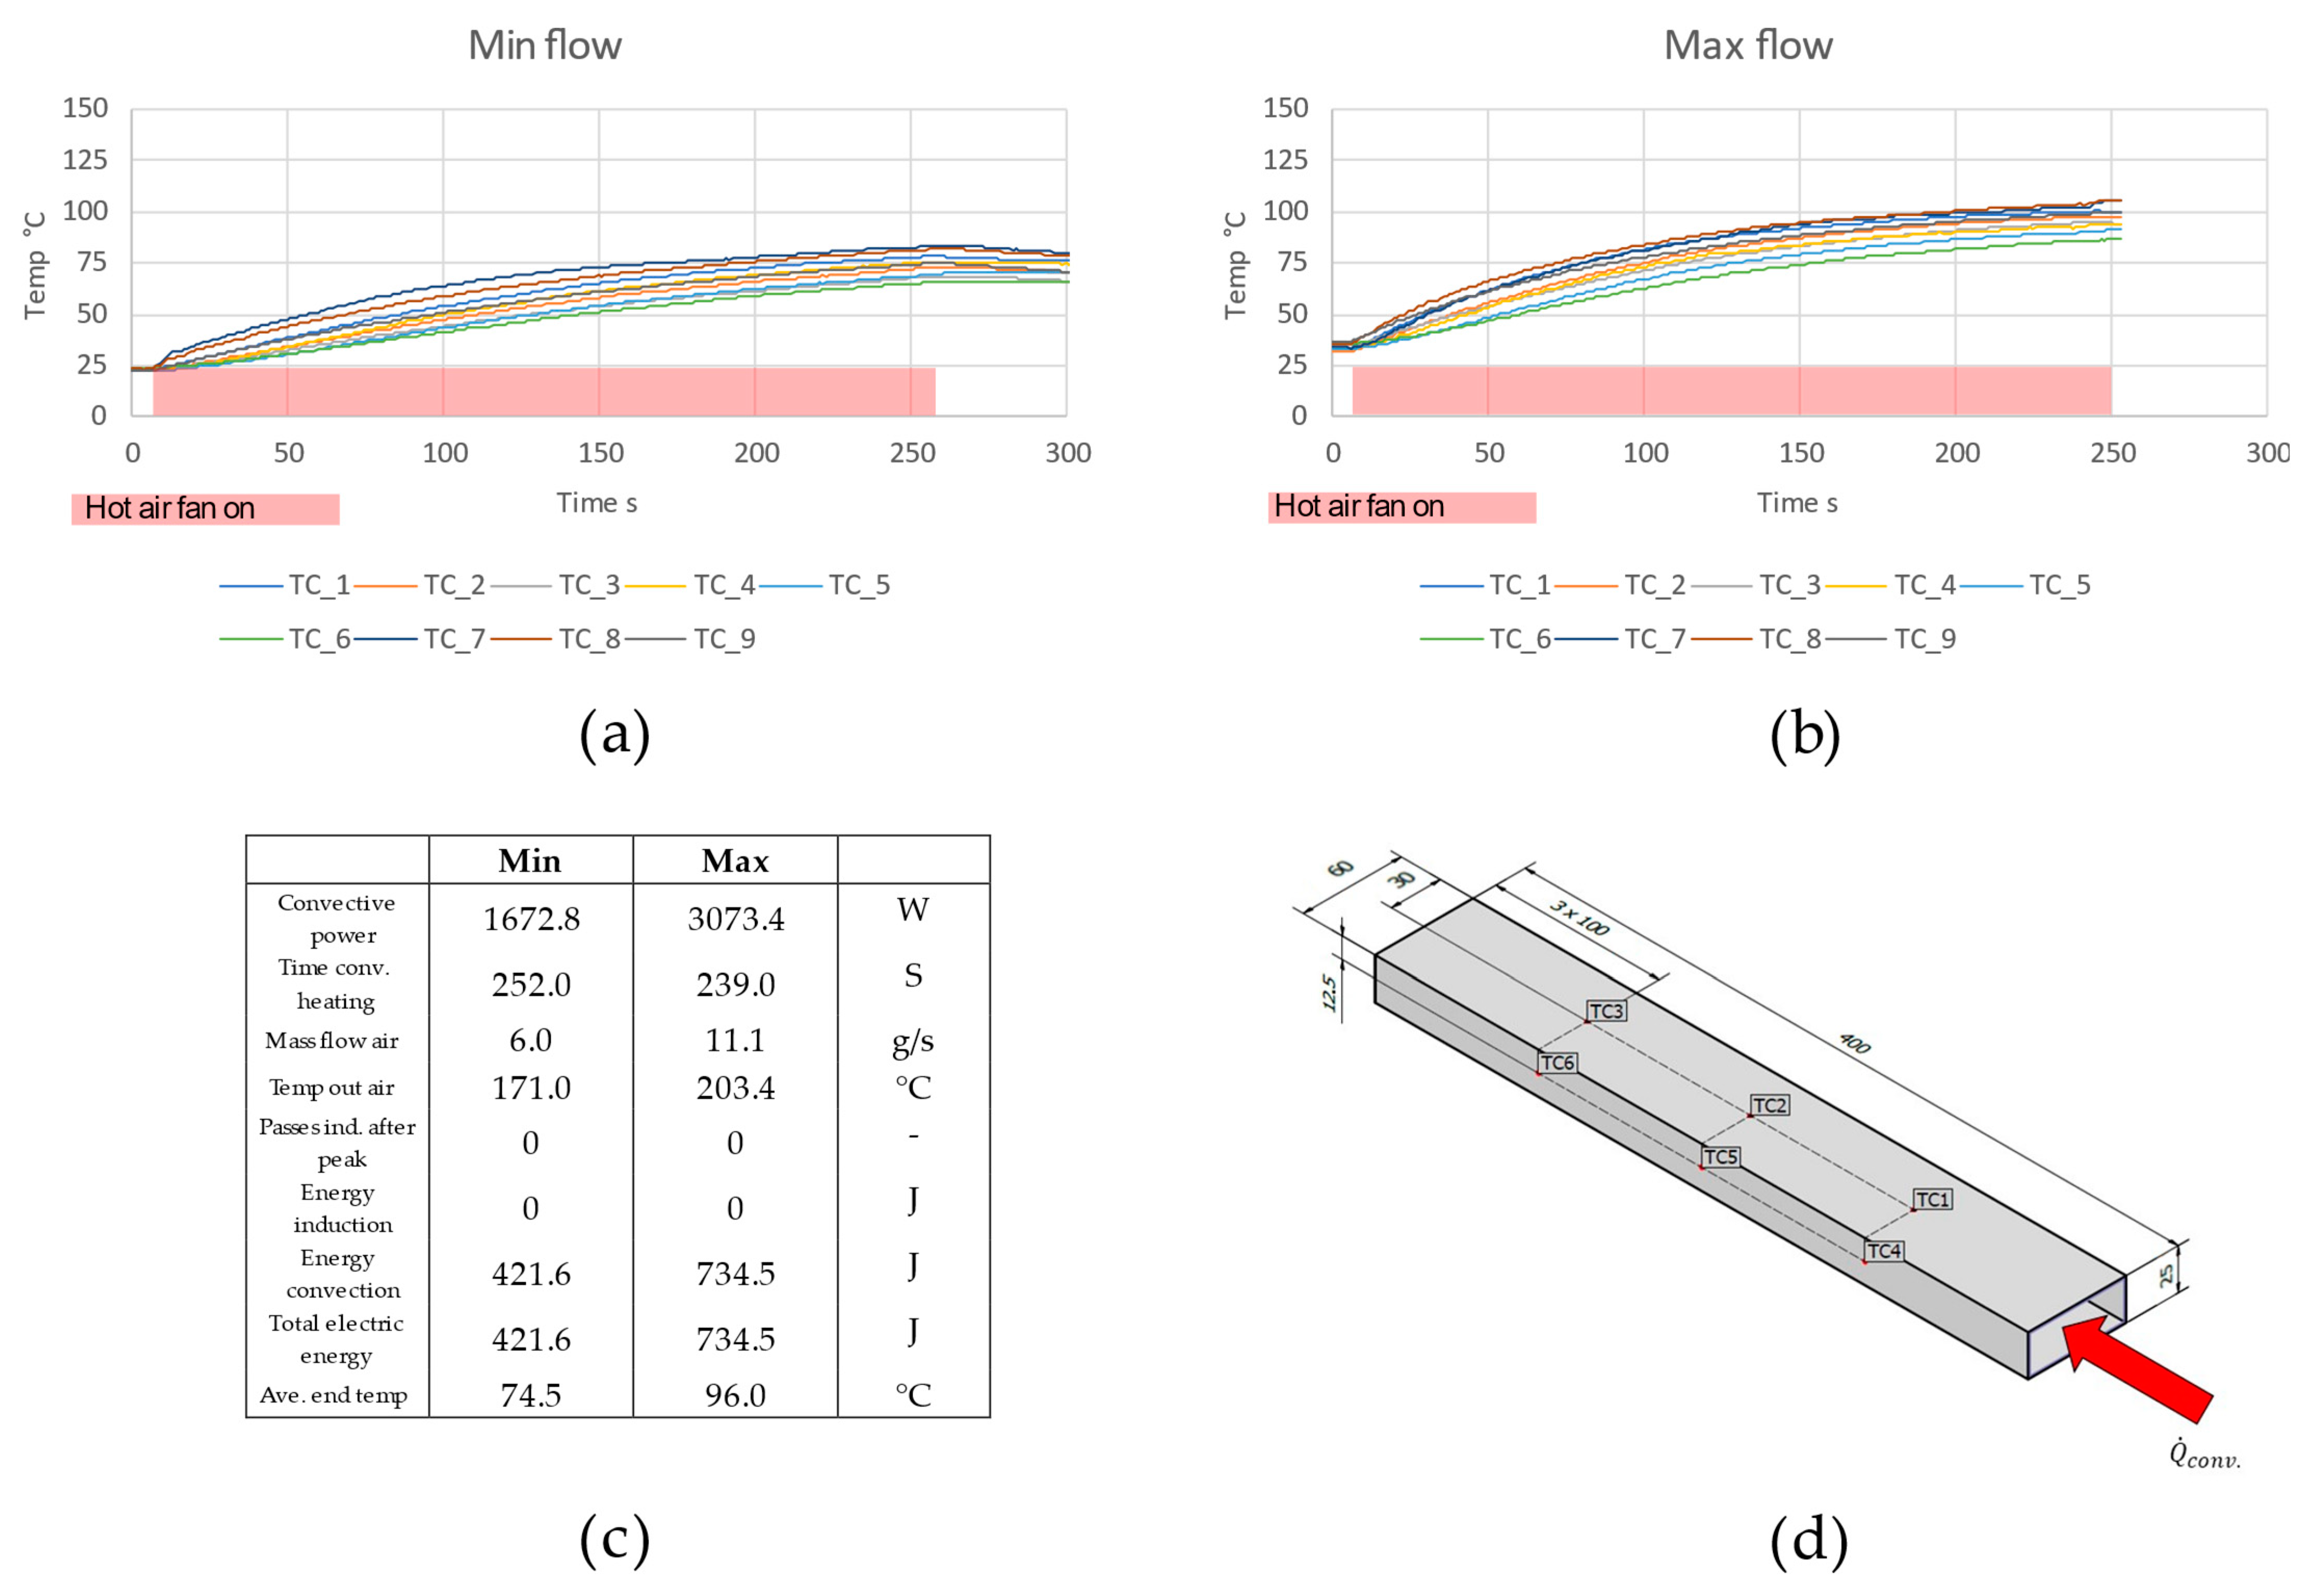
The results of the experiments were promising. Figure 9 shows the heating of the profiles for pure convection. The convective experiments are used as a basis for later comparison with the combined convection and induction experiments. The same experiments were also carried out for the angled profile shown in Figure 5. The experiments shown here were carried out with two different mass flows of hot air (the mass flow is given in the tables in Figure 9 and Figure 10), as mentioned above. With pure convection and the hot air fans at their minimum output, an average temperature of 74.46 °C was achieved; with both hot air fans at their maximum output, an average temperature of 95.98 °C was achieved. This temperature is important for the later comparison as this was then the target temperature for the experiment with the minimum output of the hot air fans coupled with induction heating. The red area in the graphs indicates when the hot air guns were switched on.
In Figure 10, the temperature curves for the combined heating can be seen. For both diagrams, the area marked in green shows the timeframe where the induction heating device is operated at 1.5 kW. In this timeframe, the surface under the coil is heated up rapidly at the target temperature, which can be seen in the thermocouples TC_1, TC_2 and TC_3. Thermocouples TC_4, TC_5 and TC_6 are located on the side of the workpiece and were also heated on this side but reached a much lower temperature as they were heated mainly by conduction in the material and not by direct induction. The thermocouples at the bottom of the workpiece (TC_7, TC_8, TC_9) were not affected in this phase of the experiment because they did not receive any inductive heating, and the conduction in the workpiece had not yet reached this point. After this first phase of heating, the hot air guns were switched on and left on until the end of the experiment, indicated by the red area of the graph. During this phase, the temperature increases for the thermocouples at the bottom and decreases for the thermocouples at the top due to conduction. In the next phase, the inductor coil moves continuously over the workpiece with reduced inductor power (as shown in Figure 4 and in the yellow areas in the graphs in Figure 10). For these combined experiments, the average temperature for the minimum flow rate of the hot air guns is 97.92 °C, which is very close to the 95.98 °C achieved with the maximum flow rate in the pure convection comparison experiment.
The heating strategy described above also results in an even temperature distribution due to the pauses between the inductive heating steps, which helps to distribute the temperature by conduction in the workpiece and also prevents the overheating of the upper part of the workpiece close to the induction coil (thermocouples TC_1, TC_2 and TC_3). Meanwhile, the rest of the workpiece is evenly heated by the hot air flow, resulting in an even distribution at the end of the heating cycle. This can be clearly seen in Figure 10a.
The total amount of electrical energy was calculated from the amount of energy consumed by the hot air fans and the inductor, as mentioned in the experimental part of this thesis. The calculation was carried out as follows: The electric energy which is used for convective can be seen in Equation (10); the energy is simply calculated by multiplying the average drawn power of both hot air fans PFan, which was logged every second during the experiment with the time the fan is turned a tcond. The electrical energy used for inductive heating is calculated in Equation (11). For this calculation, the following parameters were used: the power of the first initial heat up P1 ind, the power for the next heating steps P2 ind and the number of passes nind. The sum of this is then multiplied by the time tpass it takes the inductor to pass the workpiece because the inductor is only powered when the inductor coil is directly above the workpiece. The power logged by the inductor is without its efficiency to obtain the drawn power from the power outlet; the efficiency coefficient ηel is considered. ηel was experimentally determined to be 0.9 by measuring the power drawn from the power supply and comparing it to the set power of the inductor in previous experiments. The total amount of drawn energy is then calculated in Equation (12) by adding the convective and the inductive energy.
E c o n d = P F a n t c o n d
E i n d = ( P 1   i n d + P 2   i n d   n i n d ) t p a s s η e l
E t o t = E c o n d + E i n d
The results for both the rectangular and angled profiles can be seen in Table 3, where the average electrical power drawn by the hot air fans can be seen in the first column. The timeframe in which the convective heating was switched on is shown in the second column. For the shown experiments, the inductor was always operated at 1500 W for the first pass, and then the power was reduced to 500 W, as shown in Figure 4. In the “Passes inductor after peak”, we describe how many times the inductor passed the workpiece with the reduced power. The following columns show the total amount of electrical energy used for inductive and convective heating.
The most interesting results to compare for both profiles are the maximum flow with pure convection and the combined experiments with minimum flow.
For the rectangular profile, an average temperature of 96.0 °C was reached after 239 s of convective heating with the maximum flow of the hot air gun. This resulted in a total of 734.5 J of electrical energy. A very similar temperature of 97.9 °C was attained in the combined experiment with the minimum flow rate of the hot air gun, but this temperature was attained much faster after 153 s of convective heating. As the average power of the hot air guns was also lower, 1821.7 W compared to 3073.4 W in the max flow experiment, and the inductor required much less energy, 62.2 J, the total electrical energy used was 734.5 J for the max convective flow experiment compared to 340.9 J for the combined experiment. This represents an energy saving of 53%. Similar results were obtained for the angled profile. Here a temperature of 101.0 °C was attained after 191 s for the pure convection experiments, and a temperature of 103.1 °C was obtained after 210 s for the combined experiment. The total energy consumption for the pure convection experiment was 675.5 J, and for the combined minimum flow experiment, it was 368.5 J, which represents an energy saving of 36%. As the convection heat guns could be operated with less power, the energy saving was still quite high, even though there was no time saving. The higher energy saving with the rectangular profile can be explained by the constant small air gap between the inductor and the workpiece. Therefore, more inductive energy could reach the workpiece, while with the other profile, the air gap increases at the surface of the angle along the induction coil.

3.2. Simulation Results

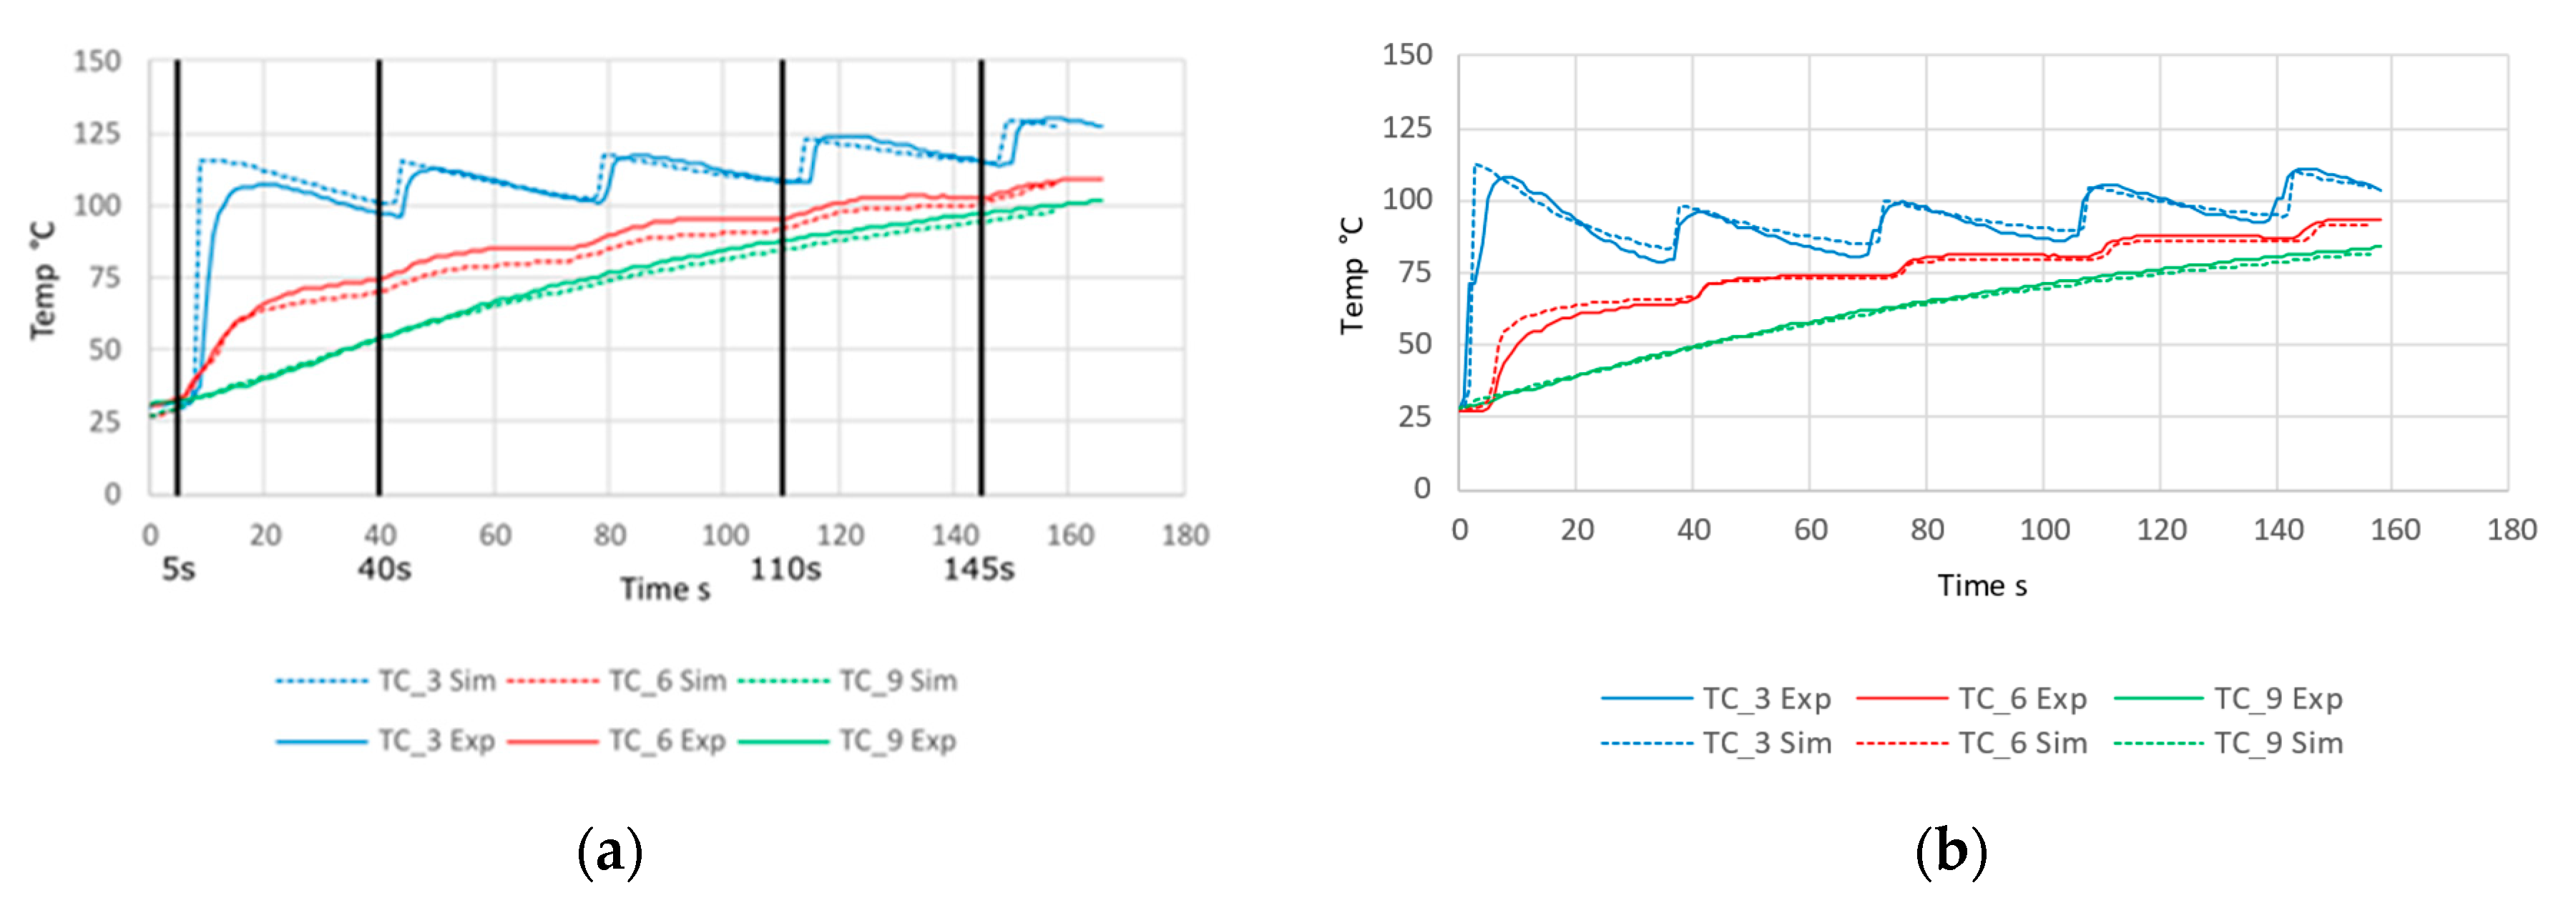
The results of the transient simulations are shown in Figure 11 and Figure 12. The diagrams show the comparison between the experiment and the transient simulation for the rectangular and for the angled profile. The positions of the thermocouples and the measuring points in the simulations correspond to the positions shown in Figure 5. The results of the simulation are shown as a dotted line, and those of the experiments are shown as a solid line. The simulations agree well with the measurement results. Only the beginning of both simulations, where the temperatures reach the first peak, showed some deviations. The peak is much more pronounced in the simulation than in the experiment for measuring point TC_1, which can be explained by the thermal inertia of the thermocouples used in the experiment and the heat transfer rate from the workpiece to the thermocouples [35]. For the angled profile, the results are very similar. The largest deviation between the simulation and experiment can also be found in the first peak for both thermocouples TC_3 and TC_5. The reasons are the same as those mentioned for the rectangular profile. After the first peak, there is a good agreement between experiment and simulation.
After this first peak, which is the result of a higher inductor power, as shown in Figure 4, the results of the simulation and the experiment are in good agreement. It is clearly visible when the inductor passes over the measurement point, as it is visible as a peak in the blue lines representing measurement point TC_3. After each peak at TC_3, the temperature drops due to conduction in the material. TC_9, the point furthest from the inductor, is not affected by the inductor, and the temperature increases due to forced convection and conduction away from the areas heated by the inductor.
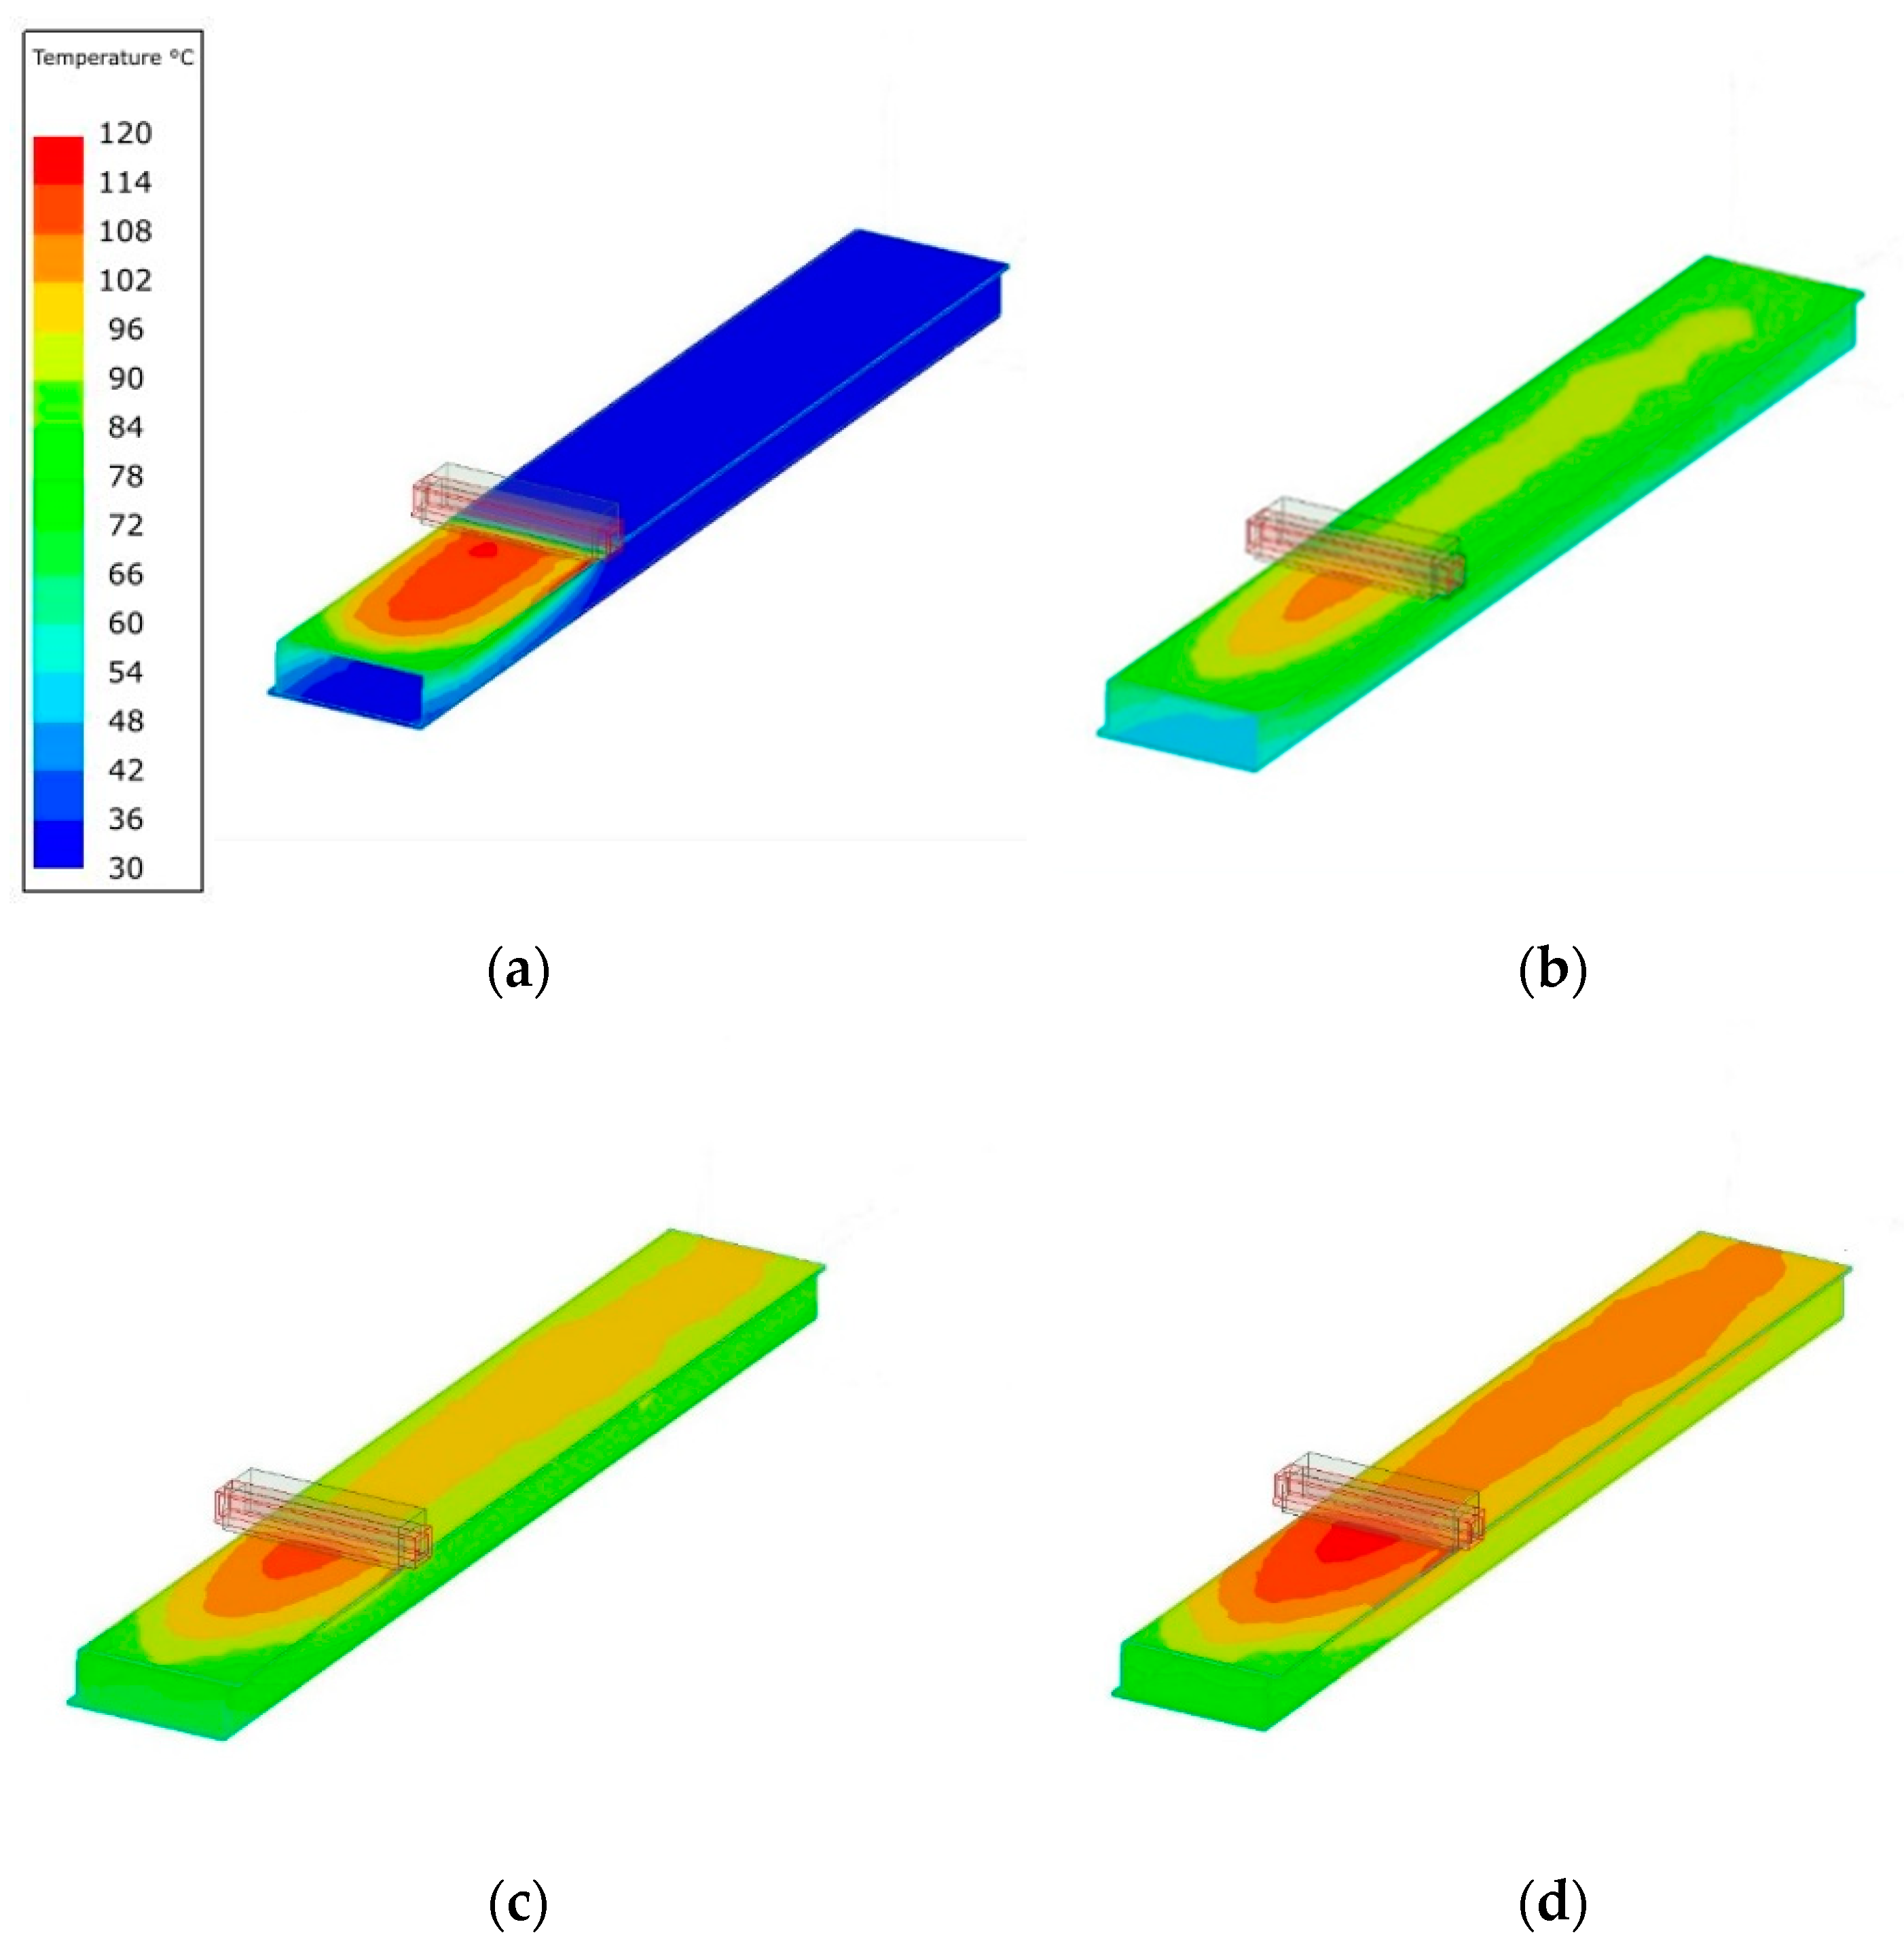
Figure 12 shows the temperature profile of 4 different time steps. These time steps correspond to the time steps marked in Figure 11. The 5 s time step shows the first pass of the inductor over the cold workpiece. The temperature rise at the surface of the inductor is clearly visible, while the bottom of the workpiece remains relatively cold due to the much slower process of forced convection compared to induction. The next pictures show the simulation for the second 4th and 5th passes. The temperature distribution becomes more uniform with each subsequent pass of the induction coil due to conduction from the hottest zones directly under the inductor to the bottom layer of the workpiece and forced convection.
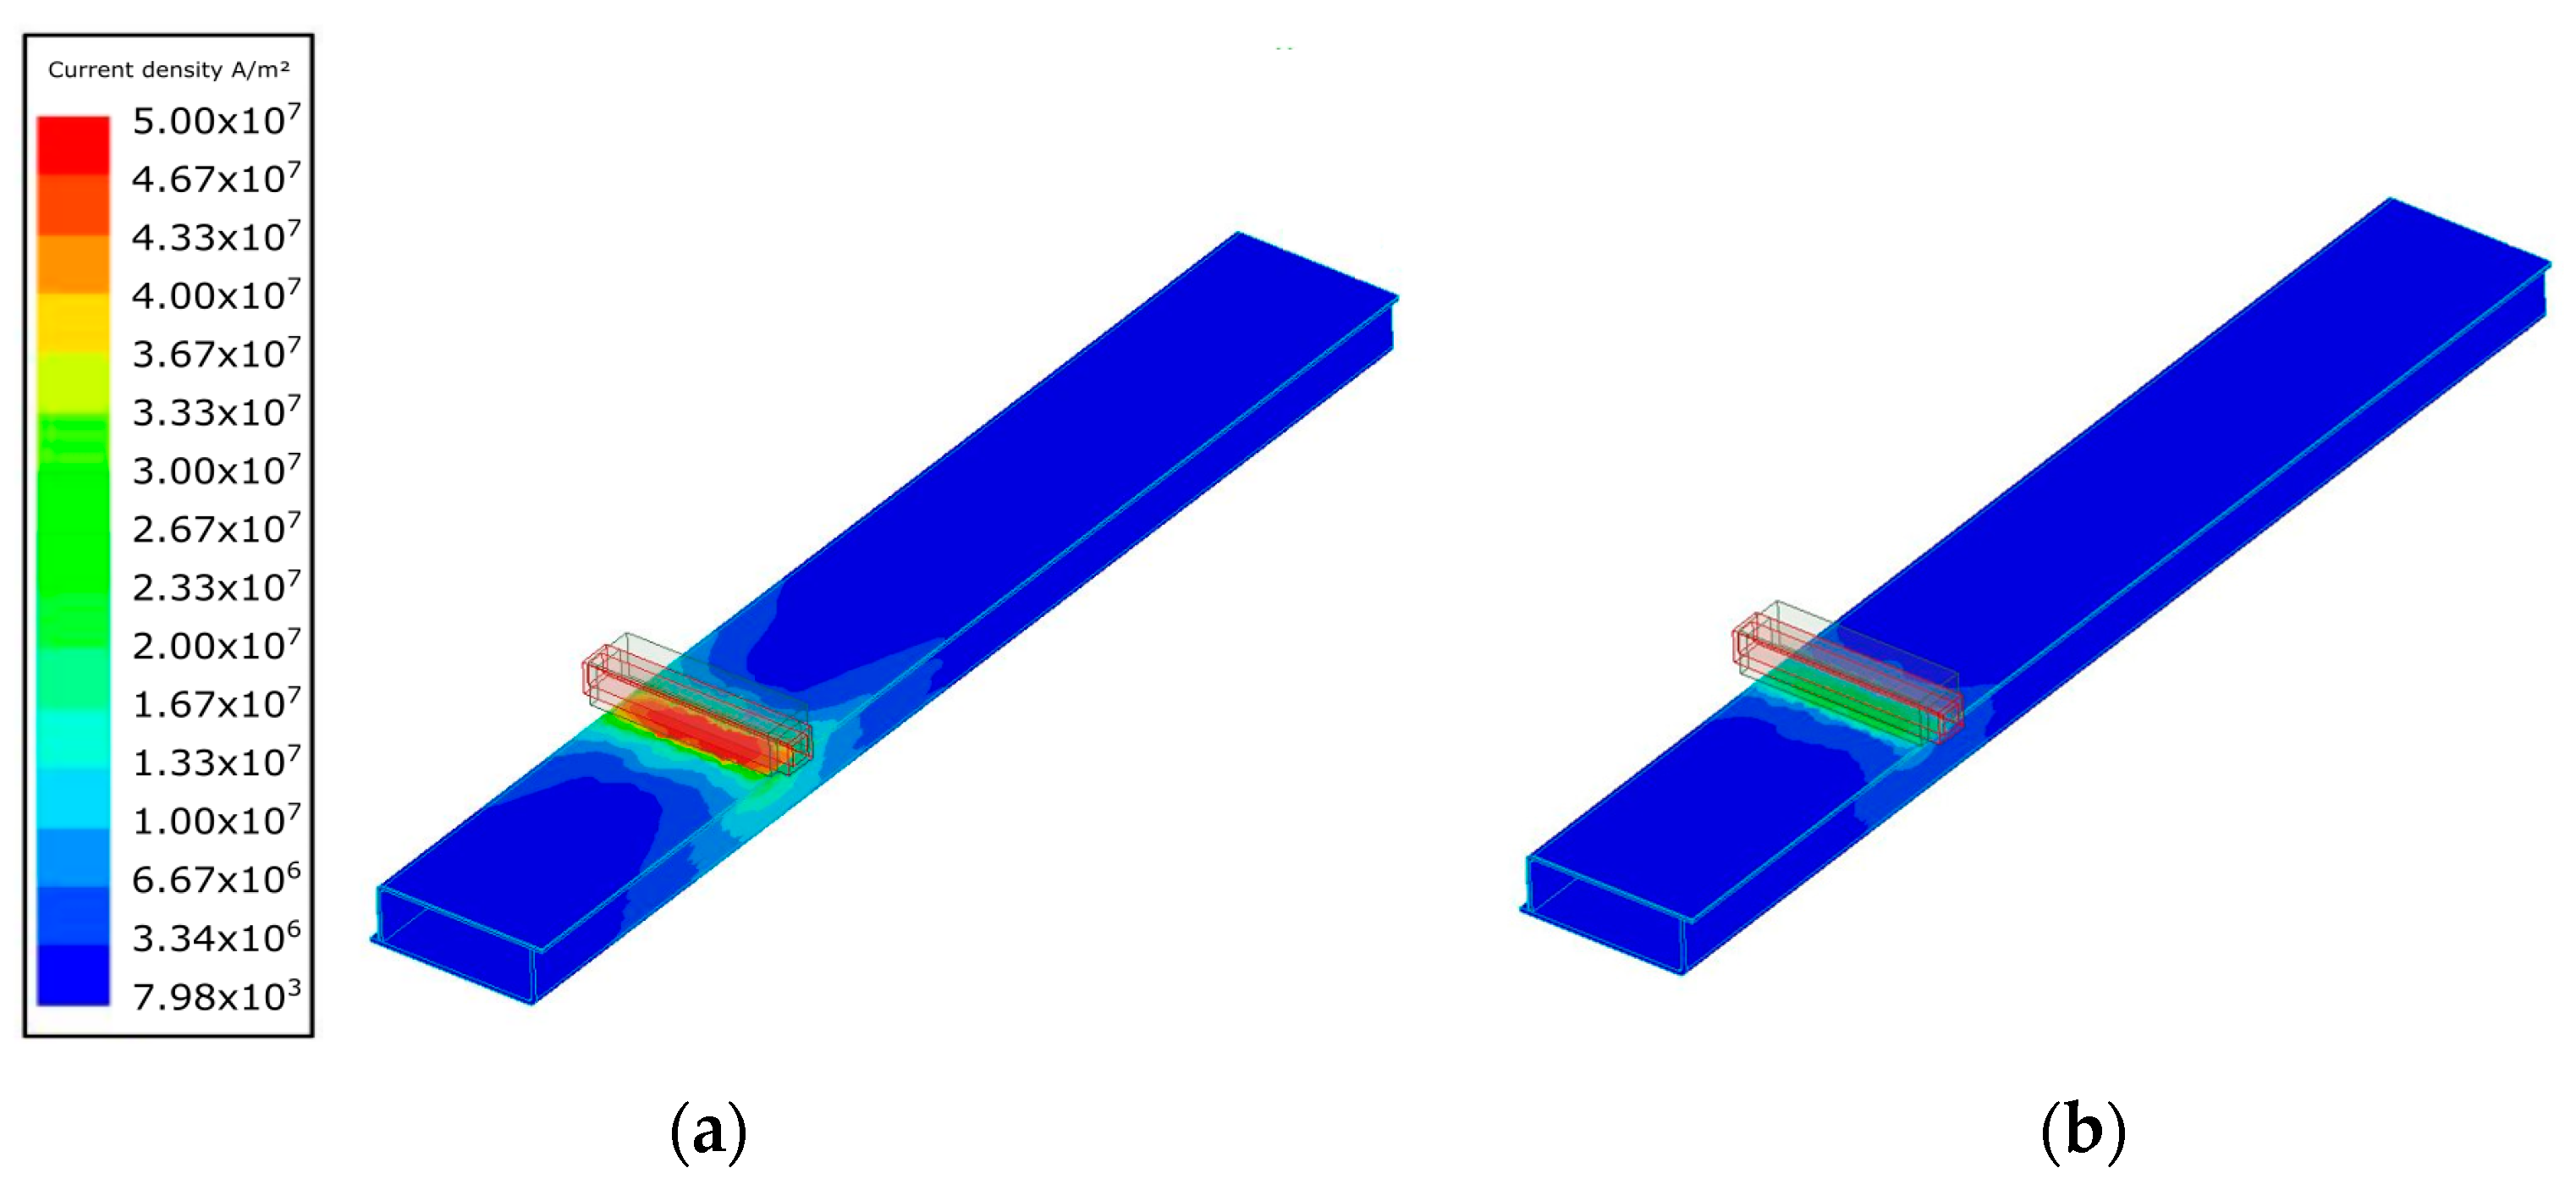
The resulting eddy currents of the workpiece are shown in Figure 13 for the 5 s and 40 s time steps. Both time steps show the same position of the inductor but with different power outputs according to the experiments, resulting in a much higher current density for the 5 s time step. It can clearly be seen that the current density is highest directly under the induction coil and that it decreases rapidly in the area further away from the coil. The reasons for this are the magnetic flux concentrators, which concentrate the electric field and the slot effect between the coil and the workpiece.
As part of this work, a mesh independence study was carried out. To ensure the accuracy of the simulations, both the mesh in Fluent for the thermal simulation and the mesh in Maxwell for the electromagnetic simulation were varied. The results are shown in Figure 14 for three different measurement points. The standard meshes used for the simulations were compared to meshes with approximately twice the number of cells due to the adaptive mesh for the electromagnetic simulations. The number of cells in Figure 14 for the Maxwell mesh is given at a time step of 5 s. Three variations of the simulation were carried out for the independent study: a finer mesh for the thermal simulation, a finer mesh for the electromagnetic simulation and a finer mesh for both simulations. The plots show the absolute temperature for each of the simulations in colour-coded lines, where the red dotted line shows the standard mesh used for the simulations in this paper. As the difference in temperature between the simulations is very small, the differences are shown as dots on a secondary scale. The temperature difference between all the simulations was well below one K for almost all the measurement points, so the coarser standard mesh gives accurate results. The mean root mean square errors between the finer mesh simulations and the standard simulation are shown in Table 4.

4. Discussion

The heating strategies developed experimentally in this thesis showed great promise in two main categories. On the one hand, the strategies made it possible to use induction heating for workpieces that are normally not suitable, such as the hollow profiles shown in this work, and the experiments also showed that the combination of inductive heating and forced convection could lead to energy savings compared to convection heating alone. For the rectangular profile, 53% of the electrical energy could be saved compared to convection alone (340 J instead of 734.5 J), while the average temperatures of the workpiece remained almost the same: 97.9 °C for the combined experiment and 96.0 °C for the experiment without additional inductive heating. The power of the hot air heat guns could be reduced from 3073.4 W to 1821.7 W for the rectangular profiles with the additional inductive heating, while the heating time was also reduced from 239 s to 153 s. The experiments also showed that the developed heating strategy also worked for profiles that were not ideal for the inductor geometry and that energy savings could be made without having to change the inductor geometry. For the experiments with the less suitable angled geometry, energy savings of 36% could be achieved (430.5 J instead of 675.2 J) with average temperatures of 103.0 °C instead of 101.0 °C for the combined experiments. The research also shows that the heating strategy developed is able to give the workpiece an even temperature distribution at the end of the heating cycle.
The energy-saving results should provide a starting point for future research. The conditions for heating were ideal, and the profiles, even the angled ones, did not have the most complex geometry for induction heating. Also, the convective heat transfer through the profile is ideal and may not be applicable to every industrial application. Another point that was not addressed in this research is the stress that is introduced into the workpiece due to the fast heating rates caused by induction.

5. Conclusions

This experimental evaluation of the heating strategy developed has shown that the addition of induction heating is very promising in reducing the energy consumption for heating the profiles while maintaining a homogeneous temperature distribution through the nine thermocouples, but it must be said that the experiments were carried out under very ideal laboratory conditions. Therefore, the results shown are optimistic and at the upper limit of the possible energy savings.
The knowledge gained from this work can be used to apply similar heating to industrial applications, such as paint drying, due to the temperature ranges shown in the experiments. Further research based on this work will be required to demonstrate the suitability of the methods for specific industrial applications.
The simulations agreed well with the experimental data and showed the possibility of simulating the coupling of induction and forced convection.

Author Contributions

The authors of this paper have contributed as follows: conceptualisation, C.H. and R.G.; methodology, R.G.; validation, C.H. and R.G.; investigation, R.G.; data curation, R.G.; writing—original draft preparation, R.G.; writing—review and editing, C.H. and R.G.; visualisation, R.G.; supervision, C.H.; project administration, C.H.; funding acquisition, C.H. All authors have read and agreed to the published version of the manuscript.

Funding

This work was financially supported by the Austrian Research Promotion Agency (FFG), Austria, “Prozess- und Energieoptimierung mittels Induktion zum Aushärten der Korrosionsschutzschicht in der Automobilindustrie” (project 881147, eCall 35451221).

Data Availability Statement

The data presented in this study are available from the corresponding author upon reasonable request.

Acknowledgments

We would like to sincerely thank Joshua Kofler for his help with the experimental part of this work. Supported by TU Graz Open Access Publishing Fund.

Conflicts of Interest

The authors declare no conflict of interest.

References

  1. Rudnev, V.; Loveless, D.; Raymond, L.C. Imprimerie noubelle associ-ation ouvriere. In Handbook of Induction Heating; CRC Press: Paris, France, 2017. [Google Scholar]
  2. Lehner, G. Elektromagnetische Feldtheorie; Springer: Berlin/Heidelberg, Germany, 2008. [Google Scholar]
  3. Benkowsky, G.; Härten, I.; Glühen, S.; Löten, S. Grundlagen und Praktische Anleitungen für Induktionserwärmungsverfahren, Insbesondere auf dem Gebiet der Hochfrequenzerwärmung, 5th ed.; Verl. Technik: Berlin, Germany, 1990. [Google Scholar]
  4. Lucia, O.; Maussion, P.; Dede, E.J.; Burdio, J.M. Induction Heating Technology and Its Applications: Past Developments, Current Technology, and Future Challenges. IEEE Trans. Ind. Electron. 2014, 61, 2509–2520. [Google Scholar] [CrossRef] [Green Version]
  5. Davies, E.J. Conduction and Induction Heating; IET: Hertfordshire, UK, 1990. [Google Scholar]
  6. Rudnev, V. Metals HandBook VOL 4—Heat Treating; Amazon Publishing: Seattle, WA, USA, 1991. [Google Scholar]
  7. Rudnev, V. Systematic Analysis of Induction Coil Failures: Part 4: Coil Copper Electromagnetic Edge Effect; 2006; pp. 27–28. Available online: https://www.inductoheat.com/wp-content/uploads/sites/11/2019/08/133-1.pdf (accessed on 9 January 2023).
  8. Plumed, E.; Lope, I.; Acero, J. Induction Heating Adaptation of a Different-Sized Load With Matching Secondary Inductor to Achieve Uniform Heating and Enhance Vertical Displacement. IEEE Trans. Power Electron. 2021, 36, 6929–6942. [Google Scholar] [CrossRef]
  9. Huang, M.-S.; Huang, Y.-L. Effect of multi-layered induction coils on efficiency and uniformity of surface heating. Int. J. Heat Mass Transf. 2010, 53, 2414–2423. [Google Scholar] [CrossRef]
  10. Shih, S.-Y.; Nian, S.-C.; Huang, M.-S. Comparison between single- and multiple-zone induction heating of largely curved mold surfaces. Int. Commun. Heat Mass Transf. 2016, 75, 24–35. [Google Scholar] [CrossRef]
  11. Xiao, Y.; Han, Y.; Zhao, D.-F.; Wang, L.-M.; Xu, D. Temperature gradient control of frequency conversion heating for a thick-walled pipe based on energy transfer. Int. J. Heat Mass Transf. 2023, 201, 123589. [Google Scholar] [CrossRef]
  12. Bui, H.-T.; Hwang, S.-J. Modeling a working coil coupled with magnetic flux concentrators for barrel induction heating in an injection molding machine. Int. J. Heat Mass Transf. 2015, 86, 16–30. [Google Scholar] [CrossRef]
  13. Gao, K.; Qin, X.; Wang, Z.; Zhu, S.; Gan, Z. Effect of magnetizer geometry on the spot induction heating process. J. Mater. Process. Technol. 2016, 231, 125–136. [Google Scholar] [CrossRef]
  14. Sun, J.; Li, S.; Qiu, C.; Peng, Y. Numerical and experimental investigation of induction heating process of heavy cylinder. Appl. Therm. Eng. 2018, 134, 341–352. [Google Scholar] [CrossRef]
  15. Thosdeekoraphat, T.; Tanthai, K.; Lhathum, K.; Kotchapradit, S.; Santalunai, S.; Thongsopa, C. The Design of a Large-Scale Induction Heating Power Source for Organic Waste Digesters to Produce Fertilizer. Energies 2023, 16, 2123. [Google Scholar] [CrossRef]
  16. Fu, X.; Wang, B.; Tang, X.; Ji, H.; Zhu, X. Study on induction heating of workpiece before gear rolling process with different coil structures. Appl. Therm. Eng. 2017, 114, 1–9. [Google Scholar] [CrossRef]
  17. Tobias, V. (PMT/T1), Induktive Erwärmung von Formplatinen für die Warmumformung: Dissertation an der Fakultät für Maschinenbau der Technischen Universität Chemnitz; Institut für Werkzeugmaschinen und Produktionsprozesse: Chemnitz, Germany, 2016. [Google Scholar]
  18. Bao, L.; Liu, W.; Wang, B.; Li, H.; You, X.; Zhou, Q.; Liu, M.; Gao, S. Experimental investigation on partition controllable induction heating-hot stamping process of high-strength boron alloyed steel plates with designable temperature patterns. J. Mater. Res. Technol. 2020, 9, 13963–13976. [Google Scholar] [CrossRef]
  19. Wang, J.; Yi, B.; Zhang, C.; Zhou, H.; Shu, Y. Experiments of double curvature plate bending with induction heating and processing parameters investigation by computational analysis. Ocean. Eng. 2019, 192, 106596. [Google Scholar] [CrossRef]
  20. Zhu, B.; Meng, L.; Zeng, X.; Hu, Q.; Liu, X.; Xu, G.; Wang, D. Laser cladding high-performance maraging-steel coatings on bainitic cross wing rails assisted with in-situ induction heating: Microstructure and performance. J. Mater. Process. Technol. 2023, 313, 117886. [Google Scholar] [CrossRef]
  21. Li, L.; Mi, G.; Wang, C. A comparison between induction pre-heating and induction post-heating of laser-induction hybrid welding on S690QL steel. J. Manuf. Process. 2019, 43, 276–291. [Google Scholar] [CrossRef]
  22. Fan, W.; Tan, H.; Zhang, F.; Feng, Z.; Wang, Y.; Hu, Y.; Lin, X.; Huang, W. Effect of synchronous induction heating on residual stress for laser-based directed energy deposition of thin-walled structures. Mater. Today Commun. 2023, 35, 105702. [Google Scholar] [CrossRef]
  23. Kawakami, H.; Llave, Y.; Fukuoka, M.; Sakai, N. CFD analysis of the convection flow in the pan during induction heating and gas range heating. J. Food Eng. 2013, 116, 726–736. [Google Scholar] [CrossRef]
  24. Elsaady, W.; Moughton, C.; Nasser, A.; Lacovides, H. Coupled numerical modelling and experimental analysis of domestic induction heating systems. Appl. Therm. Eng. 2023, 227, 120170. [Google Scholar] [CrossRef]
  25. Park, S.M.; Jang, E.; Joo, D.; Lee, B.K. Power Curve-Fitting Control Method with Temperature Compensation and Fast-Response for All-Metal Domestic Induction Heating Systems. Energies 2019, 12, 2915. [Google Scholar] [CrossRef] [Green Version]
  26. Mouallem, J.; Hickey, J.-P. Induction heating of dispersed metallic particles in a turbulent flow. Int. J. Multiph. Flow 2020, 132, 103414. [Google Scholar] [CrossRef]
  27. Cao, L.-X.; Yin, T.; Jin, M.-X.; He, Z.-Z. Flexible circulated-cooling liquid metal coil for induction heating. Appl. Therm. Eng. 2019, 162, 114260. [Google Scholar] [CrossRef]
  28. Gerhardter, H.; Prieler, R.; Schluckner, C.; Knoll, M.; Hochenauer, C.; Mühlböck, M.; Tomazic, P.; Schroettner, H. Modelling convective heat transfer to non-spherical particles. Powder Technol. 2019, 343, 245–254. [Google Scholar] [CrossRef]
  29. Haimbaugh, R.E. Practical Induction Heat Treating; ASM International: Materials Park, OH, USA, 2015. [Google Scholar]
  30. Barglik, J.; Smagór, A.; Smalcerz, A.; Desisa, D.G. Induction Heating of Gear Wheels in Consecutive Contour Hardening Process. Energies 2021, 14, 3885. [Google Scholar] [CrossRef]
  31. Ansys Inc. Ansys Maxwell, Release 2020 R2. Available online: https://www.ansys.com/products/electronics/ansys-maxwell (accessed on 1 August 2023).
  32. Ansys Inc. Ansys Fluent, Release 2020 R2. Available online: https://www.ansys.com/products/fluids/ansys-fluent (accessed on 1 August 2023).
  33. Menter, F.R.; Kuntz, M.; Langstry, R. Ten Years of Industrial Experience with the SST Turbulance Model. Turbul. Heat Mass Transf. 2003, 4, 625–632. [Google Scholar]
  34. Menter, F.R. Two-equation eddy-viscosity turbulence models for engineering applications. In Proceedings of the 23rd Fluid Dynamics, Plasmadynamics, and Lasers Conference, Orlando, FL, USA, 6 July 1993; American Institute of Aeronautics and Astronautics: Reston, VA, USA, 1993. [Google Scholar]
  35. Feurhuber, M.; Magno, M.; Miranda, M.; Hochenauer, C. CFD investigations of steam penetration, air-removal and condensation inside hollow loads and cavities. Appl. Therm. Eng. 2019, 147, 1070–1082. [Google Scholar] [CrossRef]
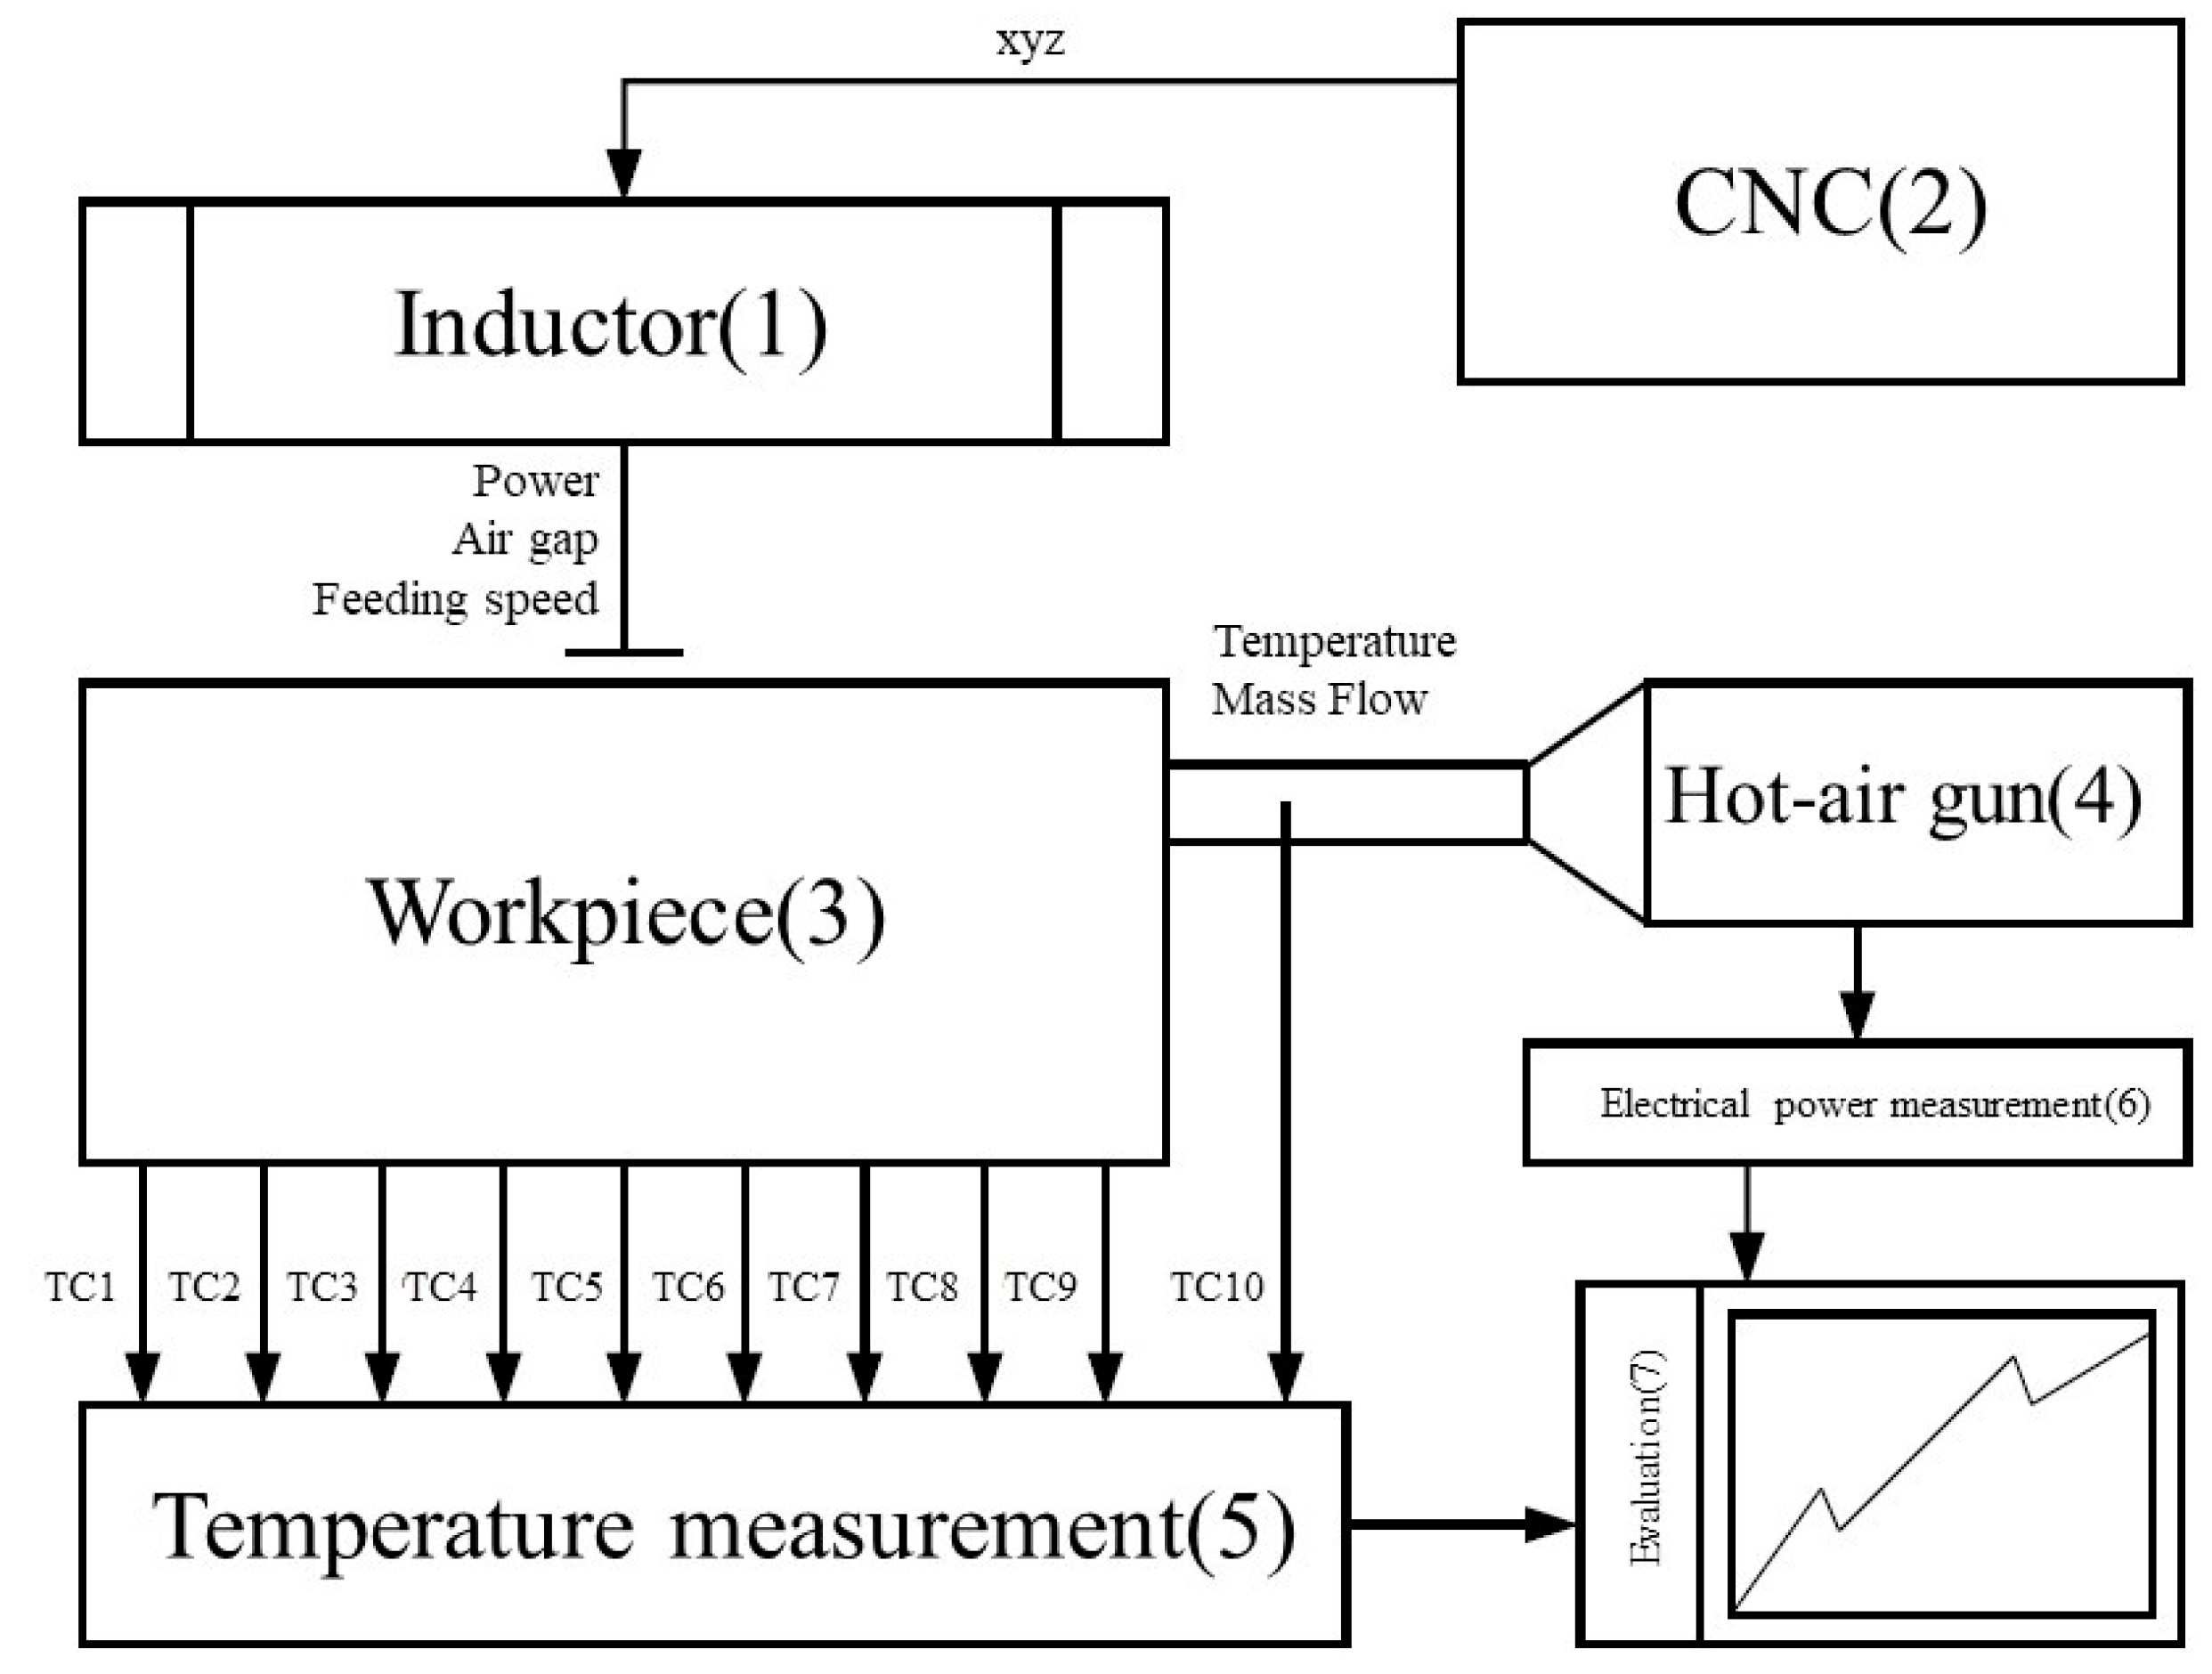
Figure 1. Schematic test rig.
Energies 16 05895 g001
Figure 2. Test rig.
Figure 2. Test rig.
Energies 16 05895 g002
Figure 3. Schematic of testbench.
Energies 16 05895 g003
Figure 4. Position and power of inductor.
Energies 16 05895 g004
Figure 5. Geometry of the workpieces: (a) rectangular; (b) angled.
Energies 16 05895 g005
Figure 6. (a) Left Y-connection test bed; (b) right inductor coil geometry.
Energies 16 05895 g006
Figure 7. (a) Maxwell model (blue workpiece, red coil, olive green MFC); (b) Fluent model (black solid, green fluid).
Energies 16 05895 g007
Figure 8. Temperature-dependent material properties of steel: (a) relative permeability; (b) bulk conductivity; (c) specific heat capacity; (d) thermal conductivity.
Energies 16 05895 g008
Figure 9. Convective heating: (a) temperature over time for experiment with min flow; (b) temperature over time for experiment with max flow; (c) table for experimental values; (d) used geometry for experiments.
Energies 16 05895 g009
Figure 10. Combined heating: (a) temperature over time for experiment with min flow; (b) temperature over time for experiment with max flow; (c) table for experimental values; (d) used geometry for experiments.
Energies 16 05895 g010
Figure 11. Comparison between simulation and experiments: (a) rectangular profile; (b) angled profile.
Energies 16 05895 g011
Figure 12. Transient simulation at different time steps: (a) 5 s; (b) 40 s; (c) 110 s; (d) 145 s.
Energies 16 05895 g012
Figure 13. Current density for different time steps: (a) 5 s; (b) 40 s.
Energies 16 05895 g013
Figure 14. Mesh independency temperature and temperature difference for different measuring points: (a) TC2; (b) TC5; (c) TC8; (d) number of cells.
Energies 16 05895 g014
Table 1. Frequency and current of the inductor for experiments.
ProfileSet PowerCurrent in CoilFrequency
Rectangular profile1500 W678.4 A15 kHz
500 W329.6 A15 kHz
Angled profile1500 W646.4 A15 kHz
500 W329.6 A15 kHz
Table 2. Material properties.
SteelCopperAir
Relative permittivity11--
Relative permeabilityTemp. dep.0.999991--
Bulk conductivityTemp. dep.58,000,000-S/m
Mass density750089331.225kg/m3
Specific heat capacityTemp. dep.-1006.43J/(kg K)
Thermal conductivityTemp. dep.-0.0242W/(m K)
Viscosity--1.79 × 10⁻⁵kg/(m s)
Table 3. Results of experiments.
ExperimentProfileConvective PowerTime Conv. HeatingMass Flow AirPasses Ind. after PeakEnergy InductionEnergy ConvectionTotal Electric EnergyAve. End Temp
Ws10−3-JJJJ
Flow min.Rectangle1672.82526.000421.5421.574.5
Flow max.Rectangle3073.423911.100734.5734.596.0
Comb. min.Rectangle1821.71536.6462.2278.7340.997.0
Comb. max.Rectangle3288.218511.8571.1608.3679.4121.7
Flow min.Angled1651.73085.900508.7508.782.8
Flow max.Angled3535.319111.100675.5675.5101.0
Comb. min.Angled1753.52106.3662.2368.2430.4103.1
Comb. max.Angled1430.621912.4680751.3831.3117.0
Table 4. Mean root square error between the finer mesh and the standard mesh.
TC2TC5TC8
Fluent finer0.3086 K0.3576 K0.1147 K
Maxw. finer0.3765 K0.4864 K0.0966 K
Both finer0.3180 K0.2080 K0.1823 K
Disclaimer/Publisher’s Note: The statements, opinions and data contained in all publications are solely those of the individual author(s) and contributor(s) and not of MDPI and/or the editor(s). MDPI and/or the editor(s) disclaim responsibility for any injury to people or property resulting from any ideas, methods, instructions or products referred to in the content.