1. Introduction
From spring 2021 to summer 2022, the prices of fossil and renewable fuels, along with electricity, surpassed unprecedented thresholds, reaching peaks 10 times higher than those recorded from 2017 to 2021 in the European market. There are different reasons for this that have not been fully investigated and have simplistically been treated as a consequence of the Ukrainian political situation with the Russian Federation or as the effect of pure speculation.
This study is based on the European situation considering the entire geographical continent and not just the EU. It includes the whole European Economic Area (EEA) and the Western Balkan countries since they are closely connected at the energy infrastructure level, with natural gas and electric grids stretching from the Atlantic Ocean and the Mediterranean Sea to the Russian Federation. The natural gas grid in this area is quite unique and has such a widespread diffusion of the pipelines that it is not encountered elsewhere in the world. Another peculiar characteristic of this energy infrastructure is that it has many physical inputs, with pipelines connecting Europe from North Africa to the North Sea, and from Russia and the Caucasian Republics to countries facing the Atlantic Ocean. The grid is also fed by internal production wells and an increasing number of liquified natural gas (LNG) terminals. Almost every European country has developed and is using natural gas storage systems to effectively control the peaks in demand and to balance potential problems on the supply side. The presence of large gas storage reservoirs has also made it possible to mitigate the effect of time-limited mismatches between supply and demand in specific areas, thus smoothing the effects of climatic and political events that might affect energy prices.
The number of different countries served by the energy grids is also unique, and more grid interconnections have been established to increase the resilience and reliability of the service.
Excluding liquefied gas, whose price is not linked to the geographical location of the suppliers, the natural gas market in Europe has offered an affordable and abundant energy source. This energy has been extensively used in energy-intensive industries, residential and commercial buildings, and power generation systems.
Past events and crises, such as the Middle East war in 1973, the September 11 attacks, the Afghanistan and Iraq wars, and the 2008 economic crisis, have indeed impacted energy prices, mostly affecting oil prices. While the effects have typically been confined in duration and in the range of price fluctuations, they have had a more widespread impact, creating economic repercussions on a global scale. The current crisis is probably the first, after the Second World War, that struck Europe without spreading immediately to the rest of the world. An essential distinction from previous crises is that, historically, global cooperation has been employed to manage any fallout. Such collaborative efforts have typically succeeded in shortening the duration of turmoil, reinforcing the world population’s trust in governments and their proposed solutions. This, in turn, has led to a decrease in negative expectations, which are a primary driver of price instability in financial and commodity markets.
In the current political crisis, there is a strong consensus that it is difficult to predict the end of hostilities. There is no global agreement on a direction to take, with major countries becoming increasingly divided. This division extends not only to potential solutions but also to the methods that should be employed to achieve them.
This study is based on two main assumptions:
This crisis does not help the confidence of the European population that both a political and economic resolution will be reached soon. It is seen more as an ongoing market disruption rather than a temporary disturbance.
The period of interest for the analysis is from 1 January 2017 to 31 December 2022. Examining longer periods could have a number of drawbacks for the following reasons: (1) 2017 is quite representative of a stable economic period since it follows the recovery from the 2008 economic crisis, (2) it is posterior to the period of the main deployment of renewable energy sources in Europe, which occurred between 2005 and 2015, and (3) it represents a period with increased maturity of the legislation concerning environmental goals and the application of the emission trading system directive.
The chosen end of the period under study is the end of 2022 in order to be able to present the longest possible time from 2017 while having enough data to draw some hypotheses and preliminary conclusions. Although studying a period that has not yet seen a return to a stable situation is not optimal for fully understanding the reasons and the future consequences of geopolitical and economic events, the authors decided to publish this paper to stimulate an open discussion at the scientific and academic level with the aim of starting a debate which could identify the reasons and the short- and long-term consequences of the events that occurred in the European energy markets in 2022.
Based on an examination of the scientific literature that explores the dynamics of the energy markets, we can divide the publications into three main groups. The first group studies market volatility from a mathematical point of view, with techniques that are commonly applied to financial markets. These approaches try to predict mathematically the trends and the evolution of the market so that market operators can maximize their profits and prevent small crises. The second group is more focused on predicting the prices from the perspective of supply/demand variations at seasonal and yearly levels, including the forecast of consumption due to weather changes. The third group of analysts is more focused on the spillover effects of prices on demand or among different fuels. Notably, in all previous studies, no event that caused the prices to jump up to ten times in a few months has been analyzed, since such an event has never happened before.
The volatility in the price of energy commodities has been studied by several authors worldwide with the aim of predicting short-term seasonal variations due to climatic and macroeconomic trends. It is important to note that, differently from the oil and coal markets, natural gas has a regional structure, and the US market differs significantly from the EU market. The studies that are referenced in this paper were aimed at helping market operators to manage their purchases in a timely manner and their ability to provide energy to customers at affordable and stable prices. This is useful when the long-term economic development model is clear and stable, but it is not in a transition period when the use of natural gas in the future raises some doubts. Susmel and Thompson [
1] were among the first to address the problem of the liberalization of the market and its effects on volatility. Ewing et al. [
2] have studied volatility in oil and gas markets, showing the differences in terms of duration and that the volatility in gas markets is more dependent on specific technical events than on political events. The resulting volatility from shocks in the gas market is more prolonged compared to the oil market. The approach is mainly focused on understanding market fluctuations to help investors rather than consumers.
Pindyck [
3] compared oil and gas volatility and highlighted that volatility in the natural gas market was significantly less important than in the oil market. Over a decade, it only increased by 3%, and events such as the Enron bankruptcy had no significant effect. In addition, the author did not identify any specific interdependence between oil and gas volatility. The author also noted that shocks caused a volatility time span for both gas and oil shorter than 10 weeks, and in most cases shorter than 5 weeks. Geman and Ohana have shown that natural gas has seasonal volatility mostly linked to weather conditions that could affect storage and create a possible shortage of gas in the late winter months. By contrast, oil volatility is more linked to structural problems and to expectations concerning oil reserves depletion or critical situations in refineries [
4]. Nonetheless, the reasons behind the increased volatility in the gas markets are highly linked to the level of storage during the winter season.
Efimova and Serletis included the volatility of electrical markets in their analysis, and they showed that there is a stronger correlation between electricity and gas prices than with oil. However, the impact of renewable energy on gas markets has been highlighted and this is quite understandable considering the period studied in the paper when most natural gas combined cycle projects were either downscaled or interrupted, leading to expectations of a contracted gas market in the subsequent years [
5].
The link between different gas markets (residential, industrial, and power generation) was studied by Van Goor and Scholtens and the authors correctly showed that fuel-switching capabilities could greatly affect the volatility and its impact on utility markets [
6].
Some studies have focused their interest on volatility spillover among energy markets. [
7,
8,
9,
10]. Oil and gas markets are the most influential markets that drive all other oil derivatives, coal, and electricity. The effect on electricity remains questionable and mostly depends on market structure, organizational structure, fuel-switching capabilities, and renewable energy’s share. This will be addressed in a future paper, but it is important to note that the electrical energy mix can create a much more resilient energy price output compared to the volatility of oil and gas.
Other authors have studied the effect of the EU emission trading system on gas prices. The direct spillover from European Union allowances for CO
2 emissions (EUA) prices to coal and gas prices has been demonstrated by Zhang and Sun [
11]. This direct spillover of carbon prices significantly affects the gas market in the EU and has a more indirect and partial influence on other regions. Other contributions to this particular area were provided in [
12,
13,
14].
The impact of natural gas prices on other commodities, such as food, has been well described by Etienne et al. [
15]. This has become incredibly important in the last year and should be carefully studied and analyzed.
In a report by Fulwood [
16], the surge in prices in 2021 was attributed to a flow reduction in the Yamal pipeline, concluding with hope for its restoration and the opening of Nordstream 2. Nonetheless, the price considered in the report was abnormally high at a quarterly average of 26.90 USD/MMBTU.
Some preliminary analyses of the effects of the COVID-19 pandemic have not fully explained or foreseen the turmoil in the pricing landscape for 2022 [
17,
18].
When the financial energy storm passes, it will be clearer where it originated and how and where it spread. The uniqueness of this crisis can be mainly attributed to the relative aversion to global cooperation as a solution of the crisis and to the acceptance that most of its consequences will not be recovered in the future.
Due to the high level of interconnection between the natural gas and electricity grids, and the general applications of policies to control carbon emissions by using the EU Emission Trading Systems (ETS), any long-term consequence of political and economic events may create a disturbance in the operation and stability of the energy markets. This interconnectedness affects the CO2 allowances market, which in turn is linked to other energy commodities.
Observation of the dynamics of the prices of coal, natural gas, oil, biomass, carbon emissions, and electricity show how interconnected they are and how a significant change in one commodity’s price can create a spillover effect. Electricity prices are not only influenced by the price of coal and natural gas, which are the most used fuels in large- and small-scale power generation and CHP plants but also by the carbon emissions auctions prices whose unexpected values may, in turn, impact fuel prices. Even countries that have achieved a high share of renewable power generation (over 30% of generated electricity) are not immune to the consequences of high coal and natural gas prices. This is due to the characteristics of electricity markets, where market prices are fixed by fossil-fired marginal generation technologies for over 50% of the hours in the year.
In this study, we will focus on analyzing the fuel market and not the electricity prices since electricity prices are normally determined by fuel prices and not vice versa.
This study concentrates on Italy since its energy system relies heavily on natural gas, constituting 41.5% of the imported primary energy in 2021 and 30.5% of final energy consumption [
19]. The country has suffered from the high volatility of the energy markets that has spread to fuels such as biomass. It also had a strict approach to dealing with the COVID-19 pandemic, which has significantly affected energy use and the stability of energy prices. COVID-19 lockdowns in Italy have clearly defined a baseline of energy use which represents a bottom threshold that could produce additional negative consequences if surpassed.
The effect on energy prices in Sweden can be considered even more peculiar since Italy and Sweden are almost in two opposite situations, with the latter having a contribution of only 3.8% of the energy imports from natural gas and only 1.9% of final energy consumption in 2021 [
20]. Nonetheless, Sweden suffered from a price increase in fuels, including biomass, which is a very important resource in the country, although there were no structural reasons for being affected by natural gas prices. This paper is the first of a series mostly focused on the different energy mixes and future perspectives of the Italian and Swedish energy systems, which are very different in the use of fossil and nuclear fuels and in renewable energy availability.
The aim of this paper is to stimulate a discussion about the real causes of the surge and the subsequent fall in prices in the European natural gas market, which has been often simplified and ascribed to the events in Ukraine. We show that the increase in the price started much earlier than February 2022 and was probably due to other reasons and issues that we have highlighted. At the same time, the political uncertainty and the high inflation in a pre-recession economic situation created concerns in energy-intensive industries that caused a significant reduction in natural gas consumption in that sector. More than one year after the onset of the Russia–Ukraine crisis, it is probably time to start a discussion on how energy markets work and how to prevent future crises, as well as understand the short- and long-term consequences of the 2021/2022 events.
The authors have not yet found a similar discussion or critical presentation of such recent data in the existing scientific literature as of the paper’s submission date. In addition, the authors consider the opinions presented in this paper to be novel since even the most recent studies published in 2023 have continued addressing the volatility in mathematical terms. These recent studies’ discussions of the reasons mostly focus on the Russia–Ukraine crisis or examine the effect on the US or world markets that were not facing the same risks as the EU.
The paper is divided into the following sections:
Section 2, “Data sources and infrastructure”, describes the sources of information from which raw data were extracted and elaborated and the main information about the Italian natural gas grid.
Section 3, “Method of analysis”, describes the statistical analysis method, cross-correlation, that is used to evaluate the relationships between our time series, i.e., natural gas pricing on the one hand, and coal, oil, biomass, and carbon pricing on the other.
Section 4, “The fuel demand in Italy” presents the main data on the demand between 2017 and 2022. Data on market prices for natural gas, as well as oil, coal, and biomass, are also included.
Section 5 mostly focuses on the changes and critical issues in the supply of natural gas, and
Section 6 contains a discussion and some comments on the reasons and consequences of the turmoil that affected the prices of fuels.
Section 7 concludes the paper, summarizing the key findings and insights.
4. The Fuel Demand in Italy
4.1. Annual Data for Natural Gas
Data on the Italian demand and supply of natural gas are described very carefully on the SNAM website [
21]. Hourly data are available for all entry points, the flows in and out of the storage, the exports, and the demand aggregated in three main sectors: energy-intensive industries where natural gas is necessary for the process, power generation plants, and other uses, which include residential, tertiary, commercial, and SME mostly using gas for space heating or in small amounts.
These data were processed to study annual, monthly, and daily trends.
Italy has a yearly natural gas demand slightly exceeding 70 billion cubic meters. In the period 2017–2022, we may note a stable demand from 2017 to 2019, and then a decline in 2020, mainly caused by the COVID-19 lockdown. There was a strong recovery in 2021 with respect to 2020, even surpassing the preceding years. However, in 2022 there was a steep decline of 10.6% with respect to 2021, and even a decrease of 3.8% compared to 2020 (
Figure 1).
With such stable demand, natural gas dealers and buyers can program annual purchases quite well. Nevertheless, slight changes in the total or in the sectorial demand may cause price changes. This is because the storage is also managed by considering the main needs and trends, and the system is not so flexible to adapt to quick changes.
Even with such stable demand and the consequent simplicity of programming the contracts, the prices have followed a different trend.
Figure 2 shows the day-ahead price of natural gas in Italy during the period 2017–2022.
It can be clearly seen that the price was stable throughout 2017 and 2018. The two spikes before the end of 2017 and in late February 2018 can be attributed to an earlier and longer than usual anticipated cold season from the end of November to mid-December, and to a second cold wave in February. Those are normal reasons for temporary increases in gas prices due to unexpected mismatches of supply and demand forecasts.
The decline in the gas price in 2019 can be partially attributed to a mild 2018–19 heating season but other reasons will be discussed later, after the analysis of other factors.
The decline in the prices in 2019 was not reversed in the fall of 2019 and early 2020. In fact, the start of the lockdown at the end of March 2020 prolonged the decline until the end of the restrictions. The tourist sector and many services were strongly affected by the lockdown, whereas the industrial sector continued to operate quite normally. With the recovery after the lockdown, prices returned to 2018 values at the end of 2020. The short spike in January was mainly due to climatic reasons with a cold and snowy winter season at the beginning of the year. After April 2021, the market price began a sharp upward trend, doubling the average 2017–2019 price (of 20 EUR/MWh) in August and continued to reach 100 EUR/MWh by mid-autumn. Two additional very high spikes (of 184 EUR/MWh and 238 EUR/MWh, respectively) occurred around late February 2022. The events in that period could have been expected to cause a peak in the price, but the baseline from which it started was already three times the average 2017–2019 price.
Although there were no signs of an imminent resolution, the price of gas decreased to almost one-third of its peak value. However, by the beginning of the summer, there was a second strong increase in the price, surpassing 250 EUR/MWh, with a spike that was longer and higher than the previous ones, until September. The data of the last two months analyzed in this study show the price falling steeply and continuously, returning to the price of October 2021. This decline does not appear to be connected to political factors but rather to issues related to supply and demand, which will be discussed subsequently.
Figure 3 shows that the reduction in natural gas demand for other uses is compensated for by the demand for power generation. This normally happens when there is milder winter, leading to a reduction in gas consumption for heating purposes, or when gas prices are lower, as seen in the year 2019 in
Figure 2. In those cases, power generation from natural gas becomes more convenient and it is possible to bid more aggressively in the electricity market, thus increasing natural gas consumption in the power generation sector. The increase in natural gas demand for power generation is mostly due to the reduction in natural gas costs rather than the other way around. It must be noted that the decrease in price is anyway larger than expected, and this can also be explained by the bar chart in
Figure 4, which shows the exports peaking in 2019 and 2021. This means that, both before and after the onset of the pandemic, and despite substantially stable overall demand, there has been an excess of gas introduced into the grid. This not only depressed the prices and led to an internal switch between other uses and power generation, but also led to the export of a larger amount of gas. It is not easy to understand why the supply exceeded the demand to such an extent. One reason could be the optimistic expectations regarding the economy with the new government elected in 2018 or with the new EU Commission, but this remains speculative. The net result is that the supply was higher than the demand, causing the prices to sink.
Figure 5 explains and confirms that in 2019 there was a substantial increase in the imports from the Netherlands (of 28% compared to 2018) and from LNG terminals (of 43.6% compared to 2018). This might have been caused by a higher availability of LNG in the market that has lowered the price of this kind of supply. Consequently, this attracted more buyers to import LNG and gas from Northern Europe instead of Algerian gas, where fixed price contracts dominate. Thus, low prices have continued to be paid throughout 2020, pushing the market price further to the lowest value in the decade. This decline in prices can also be attributed to uncertainty about the economic situation and the progression of the COVID-19 pandemic. In any case, the structure of the market in 2020 mirrored that of the previous year.
What happened in 2021 is worth discussing. The annual demand in the three sectors increased, pushing up the overall demand (
Figure 1 and
Figure 3). Additionally, the supply side experienced a significant change in Italy with the inauguration of the South Stream pipeline that connects southeastern Italy to the Balkans through Albania, thus making the Caspian Sea resources directly available and bypassing Ukraine. This pipeline had not been put into service before due to political opposition from environmental protection associations and the majority party in the Italian Parliament. With the prices of natural gas on an upward trajectory, it was assumed that the opening of the new pipeline would stabilize the market, which did not happen. Nonetheless,
Figure 5 shows a major change with a significant reduction in imports from the Netherlands, a further reduction in national production, and a minor reduction in LNG imports. The blue bar has become the prevailing route of imports into Italy. It is worth noting that the blue bar simplifies the geographical routes of gas to Italy, combining the southwestern flow from Algeria through Sicily and the southeastern flow from the Balkans to Puglia. The Libyan pipeline is not in operation due to the political turmoil in that country, but it could provide additional input to Italy from the south.
It is also interesting to describe the situation of the national production of natural gas. Italy has been a natural gas producer since the Second World War, and there are approximately 700 extraction wells mostly located along the Adriatic coast and the Ionian Sea in the southeastern area. The political opposition to the extraction of national gas to promote the decarbonization of the country has not only prevented the exploration and activation of new wells but a large majority of the available wells have also ceased operation. This trend was not opposed by major operators in the national market due to the abundance of gas at a lower price on the international market. In fact, the cost of extraction from Italian wells is generally higher than the market price of other routes and a market characterized by an abundance of gas has never pushed for reversing the trend of shutting down national wells. With the current prices of natural gas, domestic extraction is now much more convenient.
In 2022, a very different situation in terms of inputs of gas to the national grid can be observed. The consequences of the embargo on Russian gas have further increased the gas flow from the south, with a return of Algerian gas imports to the levels of 2017–2018. On the other hand, imports from Russia were reduced to a minimum after declining during the whole year, and stopped completely in late summer.
Imports from the Netherlands and through LNG carriers have risen back to the 2020 levels. In the end, the overall supply to the Italian market has been guaranteed mostly by the African and Caspian gas and partly by LNG carriers and northern imports. Therefore, the Italian natural gas infrastructure was able to cope with a significant reduction in imports from Russia. The effect of supply/demand mismatch was not a fundamental reason explaining the increase in gas prices in the first eight months of 2022.
The European gas price appears to be strongly affected by countries, such as Germany, that are huge natural gas consumers and depend to a much larger extent on Russian supply. It is nonetheless quite surprising that the blowing up of both North Stream pipelines on 26 September 2022, did not affect the gas price fall during the entire month of October, although North Stream 2 had never been commissioned and Germany had not yet installed any LNG gasifiers. This means that other factors were affecting the market in October 2022.
4.2. Effect and Feedback of the Monthly Demand
Another driver of the price formation of natural gas has always been the amount of gas stored in underground reservoirs. The volatility of gas prices has often been attributed to the expectations of the effect of weather on the amount of gas stored. For example, anticipated consumption due to an early cold season could affect gas prices due to fears of shortages in the late winter. On the contrary, a mild late autumn period normally causes the prices in late winter to fall. In a recent report by the EU commission [
29], the news that attributed the high 2021 gas prices to an insufficient filling of storage at the beginning of the heating season in 2021, a situation that was also linked to a stronger economic recovery after the lockdown periods, has been partially dismissed. This could also be attributed to a more significant emptying of the storage to earn back lost profits from the previous year.
Figure 6 shows the level of storage from 2017 to 2022. The data start from zero on 1 January 2017, which does not mean that reservoirs were empty on that date, but rather that the zero point is a conventional value to track the changes in input and output to/from the storage.
Figure 7 also shows the total amount charged (numbers in black) and discharged (numbers in red) during the spring/summer and fall/winter seasons, respectively. This mode of gas storage has always been used since the price of gas during the summer is normally lower than in winter. This has always been true until the summer of 2021, when prices began to increase. Those figures can be used to estimate the capacity of the Italian storage system.
Referring to 2017 and 2018, it can be observed that a colder winter season in 2017/18 caused two price spikes on the market, as well as an additional use of stored gas reaching the maximum depletion of the reservoirs, a level also reached during the 2020/21 winter season.
From 2018 to 2021, the flow from the grid into the storage in spring/summer was always larger than the reverse flow during the winter. However, the spring/summer of 2021 was the period with the smallest replenishment of storage. This may be due to the gas price starting to increase in the spring and remaining high during the whole summer, preventing sufficient gas storage for the next winter. The insufficient filling of storage can also be blamed on the economic uncertainties following COVID-19. As a matter of fact, the weather conditions in the fall/winter season of 2020/21, with abundant snowfall, caused an increase in the demand for natural gas and additional depletion of storage. This, combined with the already very high prices of natural gas and the fear that the situation between Ukraine and Russia could become critical, caused a sequence of two high spikes in the price in late fall and around the end of the year.
A third spike is evident after 24 February 2022 and the announcement of sanctions against Russia, which were expected to cause a shortage of gas in the future. This did not happen immediately in Italy, but the prices jumped to 250 EUR/MWh before the end of February.
The gas prices then decreased until mid-June, when a new rally began due to fears over the winter of 2022/23 following the announcement by the Italian government of forced energy-saving measures, reduction in the heating period and heating hours during the day, and possible occurrences of blackouts.
The whole 2022 summer season was characterized by a long period of high prices just when the storages should have been filled. Notwithstanding sky-high prices, the storage system received the largest amount of gas since 2017, thus creating the conditions for a safer winter.
After reaching a peak of 312.45 EUR/MWh in mid-August, the price of gas started a decline that continued until the end of October. The last October 2022 price decreased to the levels of June 2021 and despite a last spike in late November, the decline in prices continued until the end of the year.
The above considerations were mostly based on the potential causality of international events and changes on the supply side. We cannot neglect the effects of the demand, which is normally a driver in normal economic conditions. Industrial demand was not strongly affected by the COVID-19 pandemic since the global markets of goods did not suffer as much as the tertiary sector. The economic consequences of the lockdowns on energy-intensive industries did not surpass the effects of previous economic crises.
Looking at the overall natural gas demand (
Figure 7), we may notice that the effects of the lockdown in 2020 only lasted two months (April and May). The rest of the year was characterized by a recovery and a higher demand than before the pandemic. In fall 2020, the demand was even higher than those of the same period in 2018 and 2017. The demand was not affected until Summer 2022, notwithstanding two years of uncertainties and high volatility of gas prices. In the spring of 2022, the demand remained at the level of previous years until July. In August, a steep decline in demand started and is still ongoing as of the time of observation. The sustained high prices during the summer have strongly affected the demand.
Trying to understand the distribution of the demand in
Figure 2 and
Figure 8, we may observe some of the interactions between gas price and demand. Looking at the other uses (
Figure 8a), we may see the effect of colder temperatures in February and March 2018 that affected the prices, as described earlier. We may also see the effect of gas prices on the increase in power generation (
Figure 8c). Power generation companies normally have long-term contracts with fixed prices and will capitalize on the market if it is profitable. When gas prices are low, power generation companies increase their margin, especially with reference to residential users who have fixed price contracts. This can be observed in 2019 and after the lockdown. Since most of the contracts are now linked to the energy market price, power generation companies are profiting, to a lesser extent, from their share in fixed price contracts by selling when prices are higher, as at the end of 2021 and through the first six months of 2022. The abundance of gas in storage after the 2020 lockdown also appears to have stimulated additional power generation using natural gas.
The most important index to understand the reactions of the market is industrial demand in energy-intensive activities, which is normally quite stable and more resistant to price volatility. However, the influence of the price of energy on the price of products is the highest, and energy-intensive industries often have mass production that is based on quite advanced or long-term purchasing agreements. At the same time, low natural gas costs in 2019 and 2020 (
Figure 2) pushed companies to change contracts to variable prices, thus amplifying the consequences of the volatility on the final production cost. The huge increase in gas prices started in the spring of 2021, with an average of over four times the price of 2017–2018 from the summer of 2021 to the spring of 2022. The subsequent increase to over six times the price of 2017–2018 in the summer of 2022 strongly affected industrial demand. A first slowdown can be observed in the spring/summer of 2021 (
Figure 8b) when companies tried to maintain the purchase agreements with their customers and compensate for the increase in gas prices by reducing their margins. A second drop can be clearly observed during 2022, with a dramatic fall in August and the following months. The month of August, the Italian holiday season, is normally dedicated to maintenance and sees a significant reduction in production levels. Industrial demand in August 2022 shows a sharp decline demonstrating that more factories stopped production starting from the summer holiday period. In August 2022, the demand was even lower than in the midst of the April 2020 lockdown. The critical situation is further shown by the absence of any recovery of demand after August, which had always happened in previous years, including 2020. In the last four months of 2022, the demand was slightly higher than in April 2020, but that period was the worst in the previous five years.
The response of energy-intensive industries is generally not affected by spikes in fuel prices. However, these industrial activities are dramatically affected by long-term trends and changes in the baseline of prices. When energy-intensive companies shut down their plants, resuming operation takes a long time, and in some cases, they may shut down completely in the absence of energy price stability or a long-term positive outlook. The effect of such prices zeros the profit margin and the losses make it impossible to sustain long-term production, particularly since the credit and financial system is not equipped to cover such a situation for a long time.
While the natural gas demand for power generation does not show any significant variation compared to previous years (
Figure 8c), the other uses of natural gas declined considerably after the summer of 2022 (
Figure 8a). The fall in that sector can be partially attributed to residential users, who may have reduced their consumption due to the mild Autumn of 2022. However, the amplitude of the decline can also be attributed to the slowdown of all the other industrial sectors, which are not included in the energy-intensive industries.
The decline in industrial demand is the most worrisome outcome of the turbulence in natural gas energy prices over the last two years.
4.3. Coal and Oil
The price of coal was affected by the price of natural gas with a similar trend during the last two years but with a smaller range between the maximum and the baseline price before 2021. This is a quite clear spillover from the gas to the coal price in the power generation market since coal is not used in other industrial activities in Europe.
Figure 9 shows the coal price in the period 2017–2022.
By contrast, the oil price is normally unlinked from the natural gas price since the reference market is completely different. Oil is the main fuel for transportation, and it is no longer used in power generation, where it has been replaced by gas and/or coal. The oil price is more influenced by OPEC decisions and by events affecting the global economy than natural gas. The oil price also has no direct influence on and is not influenced by the coal price.
Figure 10 shows the Brent price of oil, which is more representative of the European market, but is strongly correlated with the WTI price.
Even though the peaking values during 2021 may look like those in the gas and coal charts, the rest of the line is poorly correlated (as evidenced by the cross-correlation factor, shown in
Table 1, with values of 0.7 and 0.67 for Periods 2 and 3, respectively, compared to 0.86 for Period 1). The 2020 lockdown during the spring had a significant but brief impact. In fact, the WTI oil price had a negative minimum of −37.63 USD/barrel which represents a singularity in the history of energy markets.
4.4. Biomass
The price of wood chips traded for biomass is shown in
Figure 11. Biomass is mainly used in the heating sector and is affected by the weather conditions like natural gas. Wood chips prices are correlated with natural gas prices during different time periods, as shown in
Table 1. The price increases from the end of 2017 to March 2018 follow the peaks of natural gas prices during the same period. And since the prices of natural gas started to increase in 2021, the wood chips prices followed, almost steadily (with a cross-correlation factor of 0.88 for Period 2). This can be partly attributed to the increasing cost of the energy necessary to transform raw biomass into fuel. However, the price increase in 2022 can also be blamed on the export ban on Belarus biomass materials. This led to competition between the biomass market and the timber industry, especially as the economy was recovering from the pandemic.
Many authors who studied the energy markets before 2005 could only guess but had no data on the influence of the carbon dioxide allowance quotation in Emission Trading System ETS auctions on the gas price. In fact, the fear that the introduction of the environmental market of carbon dioxide allowance could cause an increase in energy prices has never been demonstrated by real facts until 2021. Due to some errors in the allocation of carbon credits to emitters in the first phases of the application of the Kyoto Protocol and ETS in Europe, the value of a traded ton of CO2 in the emission markets has always been too low to either push innovation in the mitigation technologies or to directly influence the cost of energy.
However, this changed when the EU Commission announced the launch of the “Fit for 55” initiative in September 2020. Fears of very strong restrictions on the use of fossil fuels, stemming from an immediate reduction in the number of allowances distributed to the emitters, caused an increasing trend in the price of the carbon credit. This trend started from a baseline between 20 and 30 EUR/ton and has lasted during the whole of 2021 to almost reach the 100 EUR/ton value. Such a significant increase had a direct spillover on energy costs and pushed the price of fossil fuels up.
Figure 12 shows the price of carbon credits in the period 2017–2022, reflecting this significant change.
5. The Supply Side of the Natural Gas Market
After the analysis of the demand and the price of energy commodities, it is important to observe how the supply has been changing and to try to explain how the energy prices could also be affected by a new structure of the supply side.
From what has been discussed above, the real origin of the increase in natural gas prices from 2021 until the summer of 2022 cannot be attributed to specific events, but rather to a series of reasons that may not be fully linked to each other.
We can summarize some of the potential reasons for such a huge long-term increase in energy prices, which has influenced not only fossil fuels but all energy prices:
An unexpected recovery in 2021 after the lockdown left gas companies unprepared and the storage unfilled at the beginning of the 2021/22 heating season. This could have generated price volatility with an increase due to fears of gas shortages in the winter of 2022.
The launch of the “Fit for 55” program caused a continuous increase in the EUA price from September 2020 to the beginning of 2022.
The uncertainties about the opening of the Nordstream 2 pipeline have been discussed since January 2021. However, the decision to stop the project was taken only in early 2022 and does not, by itself, justify the price rise in 2021. The explosion of the pipeline did not significantly affect natural gas prices, and only for a very short period.
The Asian economy did not require additional energy throughout most of 2021 and positive expectations of recovery in China emerged only at the end of 2022.
For all the above reasons, it is necessary to include potential changes on the supply side in the analysis to understand if the new market structure affected prices since the beginning of 2021 or only during the second half of 2022.
We have already discussed the changes in the distribution of the gas inputs to the Italian grid depicted in
Figure 5. The annual aggregated amounts do not show the complete picture, which is made clearer by analyzing the monthly changes in the last two years.
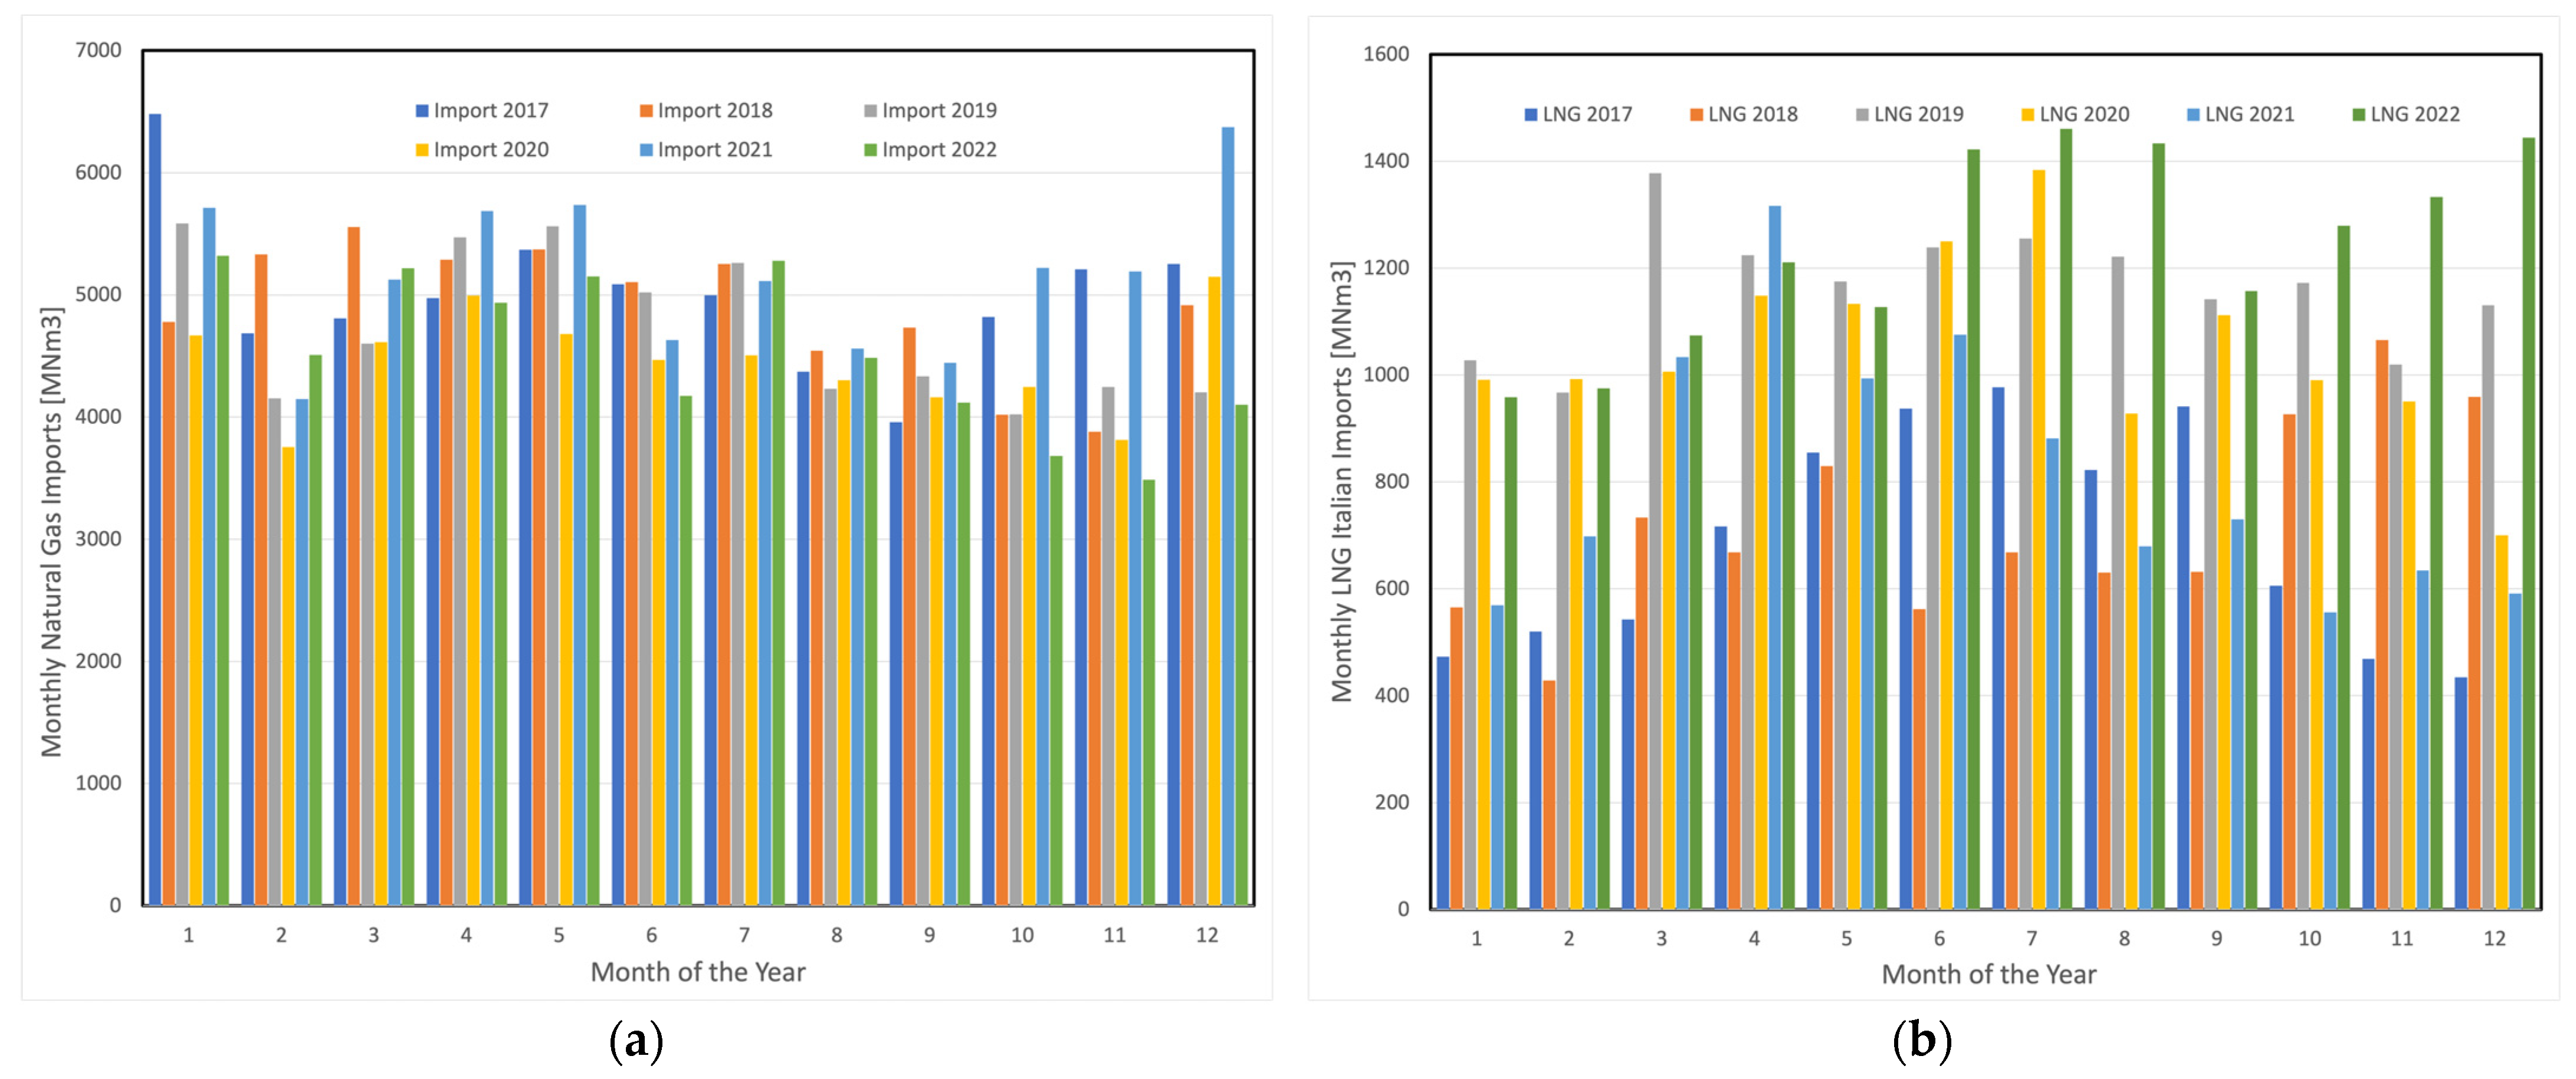
Monthly imports from pipelines in the Italian natural gas grid were the major source of gas until October 2018 (
Figure 13a), when there was a significant increase in the volume entering Italy through LNG terminals, which continued until the end of the winter heating season of 2021 (
Figure 13b). An inversion of the trend is visible from May 2021 until the end of the year. The fluctuations in LNG imports can be mostly explained by the prices of natural gas. Low prices pushed the market to look for LNG, but as prices rose, the market moved back to imports via pipelines since their contracts generally guarantee a more predictable market less influenced by global changes.
The real change in the market structure happened after February 2022 when the embargo on Russian gas was declared and imports from Russia were continuously reduced until an almost complete stop in the autumn 2022. This change has modified the market rules so that LNG has been imported notwithstanding very high gas prices during the summer of 2022.
This change was forced by political reasons and the economic convenience of the supply-side market structure has been completely transformed. The market is no longer based on economic rules but only on political decisions affecting costs and imports from specific sources.
When the market changes its rules, predictions of the volatility of energy prices cannot be based on mathematical models developed for different conditions or well-assessed previous rules. The role of political and economic uncertainties becomes overwhelming and most energy-intensive industries reduce or cease operations, causing a simultaneous slowdown of other economic sectors linked to them.
In contrast to the past, where economic crises or weather conditions caused price volatility, it was an organized embargo that changed the supply side of the energy market directly causing an economic crisis, with a significant reduction in demand affected by high energy prices.
Forecasting future prices has now become much more difficult. An economic recovery with an increase in gas demand may not be possible at reasonable energy prices, and a slowed-down European economy might not be sustained for a long time by the current political and financial institutions. It is not clear to what extent increasing the numbers of LNG terminals and the capacity of existing pipelines could contribute to a secure supply of energy for the transition to a future structure of European society and industrial activities. Within this structure, the basic quality of life and services can be assured for present and future generations.


