Article

Economic and Energy Analysis of the Construction of a Wind Farm with Infrastructure in the Baltic Sea

1
Department of Renewable Energy Engineering, West Pomeranian University of Technology in Szczecin, 71-459 Szczecin, Poland
2
Institute of Automation and Electronics and Electrical Engineering, University of Zielona Góra, 65-417 Zielona Góra, Poland
3
Institute of Management, University of Szczecin, 70-453 Szczecin, Poland
4
Faculty of Economics and Management, Opole University of Technology, 45-758 Opole, Poland
5
Institute of Management, University of Social Sciences, 9 Sienkiewicza Str., 90-113 Lodz, Poland
6
Institute of Economics and Finance, University of Szczecin, 70-453 Szczecin, Poland
7
Faculty of Economics, The Jacob of Paradies University in Gorzów Wielkopolski, 66-400 Gorzów Wielkopolski, Poland
*
Author to whom correspondence should be addressed.
Energies 2023, 16(16), 6088; https://doi.org/10.3390/en16166088
Submission received: 8 July 2023 / Revised: 7 August 2023 / Accepted: 11 August 2023 / Published: 21 August 2023
(This article belongs to the Special Issue Sustainable Energy & Society II)

Abstract

:
The constantly growing demand for energy, the need to ensure the security of its supply, and the progressing climate changes related to the emission of carbon dioxide and other pollutants have caused, in recent years, an increase in interest in offshore wind energy. This paper presents all the work that needs to be done to build a wind farm in the Baltic Sea. The work focuses on the description of the equipment and the necessary tests to perform in order to analyze the obtained data. The data will allow for unambiguous interpretation and the selection of a convenient location for the construction of a wind farm. The final product of the work is a cost estimate, in which the costs of undertaking such an undertaking are shown.

1. Introduction

Increased use of wind energy both globally and in the EU seems inevitable at the moment. An undeniable and one of the most basic effects of the use of wind energy are the ecological benefits associated with avoiding the emission of greenhouse gases and other harmful substances in the energy production process. Another effect is to increase the energy security of the country or individual regions (communes, districts, or voivodships) [1]. Energy security manifests itself as a result of diversification of energy supply (reducing the need to import primary energy from fossil fuels) and decentralization of its production (distributed generation—energy production in systems close to direct users). It is also clear that the use of wind energy reduces the need for fossil fuels and is characterized by the renewal of resources over time. These features of wind energy, especially in the face of increasingly frequent increases in fossil fuel prices, are becoming very important [2,3].
At the moment, Polish companies are opening up offshore wind energy in Poland. Next to solar energy, offshore windmills are the fastest-growing renewable technology in Europe [4]. The most important reasons for success are the increase in production efficiency and the decrease in costs. Currently, the entire European Union has adopted ambitious goals for the development of energy in 2030 in the fields of RES and reduction of CO2 emissions. Additional methods of reducing costs can be sought, e.g., through synergy with other Baltic projects to reduce the costs of connection to the grid. Offshore energy has significant industrial potential, and Polish companies can benefit from the creation of an offshore sector in Poland [5,6].
The subject and purpose of the research were to determine the costs and human and equipment resources needed to carry out measurements used further for the construction of a wind farm in the Baltic Sea [7,8]. To determine the possibility of building an offshore wind farm and assess the risk associated with it, depth measurements with a multi-beam echo sounder, geological measurements with a device called a sub-bottom profiler, thanks to which you can learn about the layers of the seabed located under the upper layer of sand and silt [9,10], and measurements with scanned side sonar to detect potential obstacles such as boulders, wrecks, etc. are necessary. Magnetometric measurements are used to detect unexploded ordnance lying at the bottom of a water reservoir, and geological boreholes are used to confirm the presence of detected geological layers. The scope of work includes a number of measurement activities undertaken before the construction of the wind farm. In addition, in order to obtain reliable total construction costs, the cost estimate also assumed the costs of the wind turbines themselves as well as elements preceding the installation of the power plant itself, i.e., piling of foundations, and elements finishing and allowing the operation of the power plant, i.e., connections, laying of transmission infrastructure, etc.
Multi-beam sonar, scanned side sonar, sub-bottom profiler, magnetometer, vibroprobe, and GNSS receivers were used to precisely determine the position of the conducted tests with an accuracy of 10 cm.

2. Literature Review

Renewable energy sources are developing much faster than conventional energy sources around the world, and among them, wind energy is characterized by the highest growth rate [11,12,13]. Wind energy is an important ecological alternative to fossil fuels and makes it possible to increase the energy independence of countries using it. It is assumed that the global potential of wind energy is equal to the current demand for electricity [14,15,16]. The current development of wind energy around the world takes place in two basic directions:
(a)
Onshore wind power—within this category, we can distinguish:
-
Large-scale wind energy—single turbines with capacities usually above 1 MW or wind farms (consisting of several or several dozen wind turbines) producing electricity in order to sell it to the grid;
-
Small (distributed) wind energy—single wind turbines with a capacity not exceeding 100 kW, located mainly near homes as an alternative energy source; small wind farms are also used where there is no economic justification for supplying energy from the power grid (e.g., supplying lighting for road signs, billboards, etc.);
-
Medium-scale wind energy—individual turbines with capacities in the range of 200–600 kW, connected to the power grid, owned by individuals, small enterprises, or local communities;
(b)
Offshore wind power—wind farms located in open sea waters; currently, these are structures permanently connected to the seabed, but the possibility of building floating turbines is also being studied, intended for installation in places far from land at greater depths [17,18,19].
Offshore wind energy is today considered to be the most energy-efficient and safe source of renewable energy, and its development is becoming a determinant of the economic growth of countries around the world [20,21]. The biggest advantages of the intensive development of offshore wind turbines include: the use of higher wind speeds in offshore areas, resulting in higher efficiency; offshore wind conditions being more stable compared to land; the possibility of using turbines with higher power; and no controversy related to the installation of power plants in close proximity to residential areas [22,23,24].
In the literature on the subject, we find many articles on the use of offshore wind energy. Korovkin et al. explore the development potential of offshore wind energy in the Baltic Sea from a technical and economic perspective. The authors analyze various factors, such as the availability of wind resources, technological options, and regulatory frameworks, to determine the feasibility of offshore wind projects in the region [25]. Zikmanis et al. focus on the environmental impact of offshore wind development in the Baltic Sea. The authors assess potential impacts on marine ecosystems, wildlife, and local communities and propose mitigation strategies to minimize negative impacts [26]. Shafiei et al. are exploring the use of power-to-gas energy storage as a solution for intermittent generation from offshore wind farms in the Baltic Sea. The authors discuss the technical and economic feasibility of this approach and suggest that it could be a cost-effective way of balancing the electricity grid [27].
Jiménez-Arroyo et al. are analyzing the potential of floating wind energy in the Baltic Sea. The authors analyze the advantages and disadvantages of this technology and discuss the technical and economic feasibility of deploying floating wind turbines in the region [28]. Bezrukovs et al. focus on the socio-economic effects of offshore wind development in the Baltic Sea. The authors analyze the potential benefits and costs of offshore wind projects and discuss the implications for local communities, businesses, and governments [29].
Currently, in Poland, we cannot yet boast of energy production from offshore wind farms, although the conditions prevailing in the Baltic Sea are very conducive to the development of this technology. However, the situation in the EU energy mix is much more dynamic, as energy produced from offshore wind farms shows the potential for large-scale development [30,31,32].

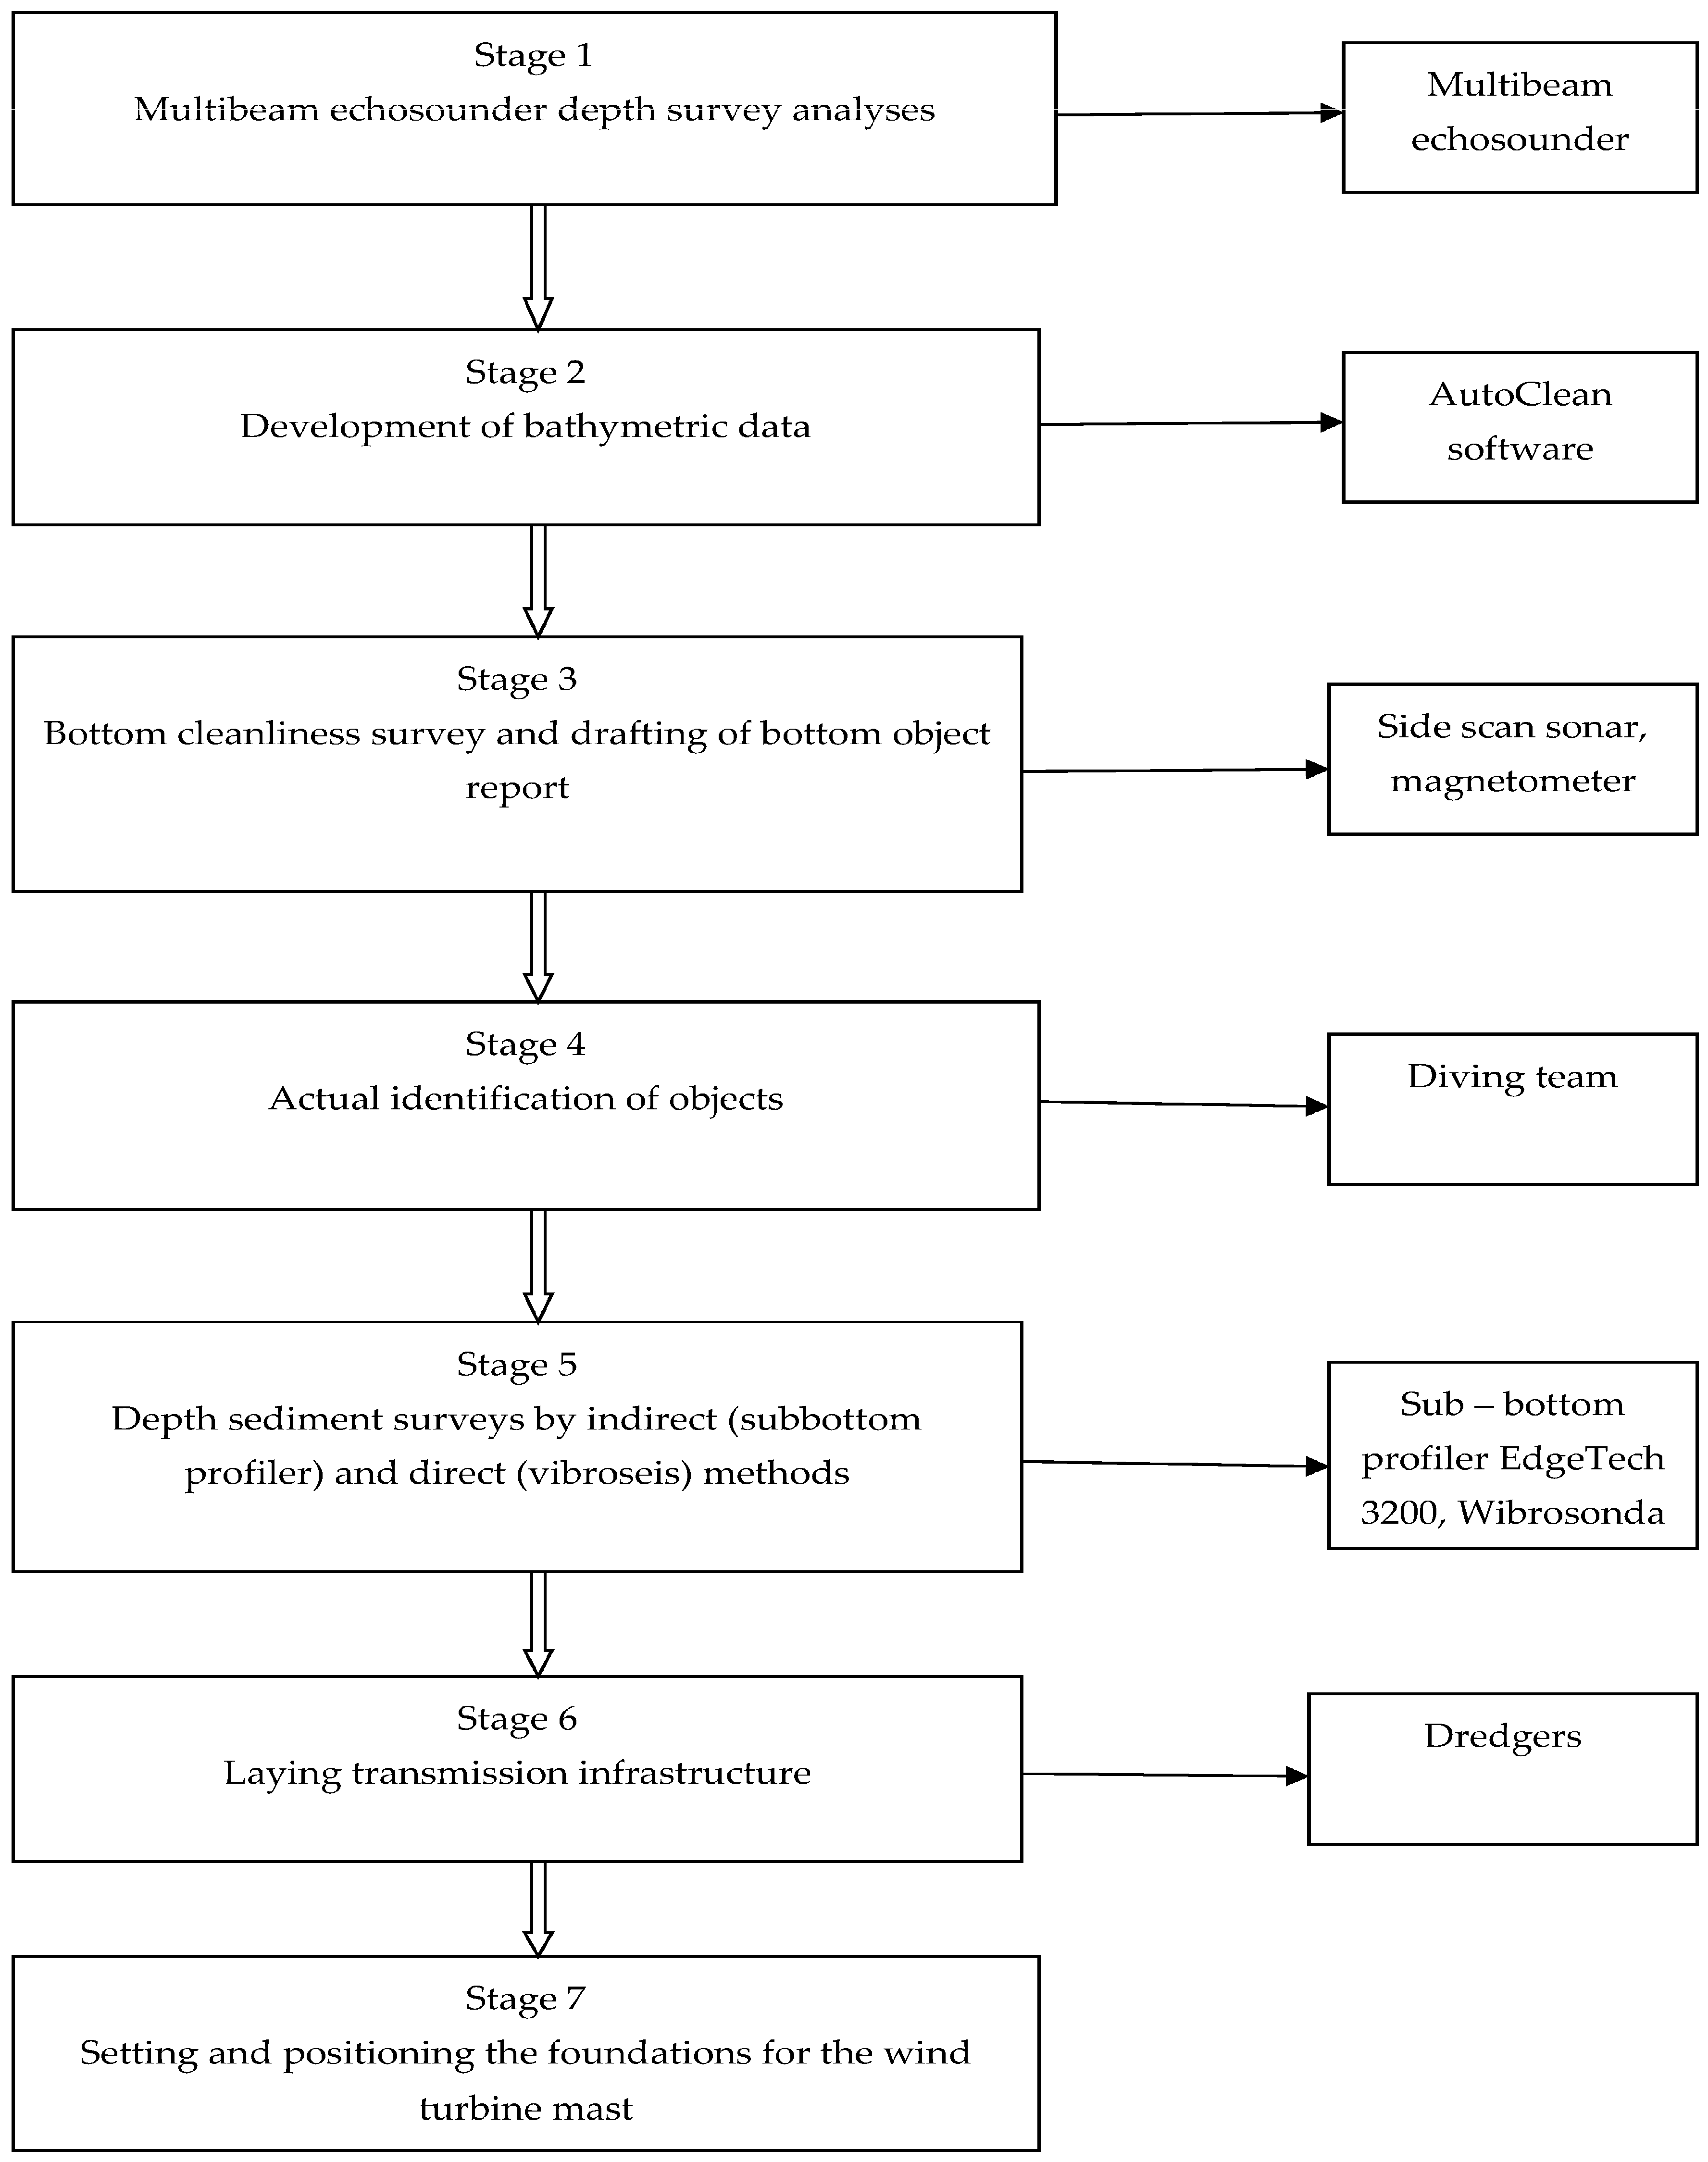
3. Seabed Measurements and Surveys

3.1. Multibeam Echo Sounder Depth Testing

Depth surveys are usually the first measurements made to determine the depth of the studied water. They are usually performed with a multi-beam sonar, although they can also be performed with a single-beam sonar. Single-beam sonar is characterized by sending only a single beam, which affects the low accuracy of measurements as a result of unscanned large terrain [33,34]. A multi-beam sonar eliminates this problem by sending multiple measurement beams at the same time. Their number depends on the type and parameters of the sonar and the operator. The principle of operation of a multi-beam echo sounder is based on the emission of a pulse created in a piezoelectric transducer, which, after bouncing off the bottom, returns to the device in the form of an echo. “Based on the measurement of the time of passage of the signal to the bottom and back to the transducer and the knowledge of the speed of propagation of the sound wave in water, the depth is calculated” [35].
An important aspect from the point of view of the hydrographer’s work is the control of depth, and thus the number of beams sent and received, in order to avoid places affected by the lack of data. This may be influenced by a sudden change in depth to a smaller one, which causes a sudden reduction in the search lane [36,37].
An important fact when conducting bathymetric measurements are also the parameters of the echo sounder, such as the operating temperature range, the width of the trace of a single beam, the so-called footprint, the number of beams (the number of which can vary from several dozen to several hundred), and the angle of the strip [38]. The smaller the footprint and the greater the number of beams, the more accurate the measurements. The larger angle of the search lane increases the speed of measurement generation by reducing the number of individual passes per measurement unit, but it may also reduce the accuracy of measurements due to large deviations and uncertainties on the outer beams. Therefore, it is important to use the so-called overlap [38,39].

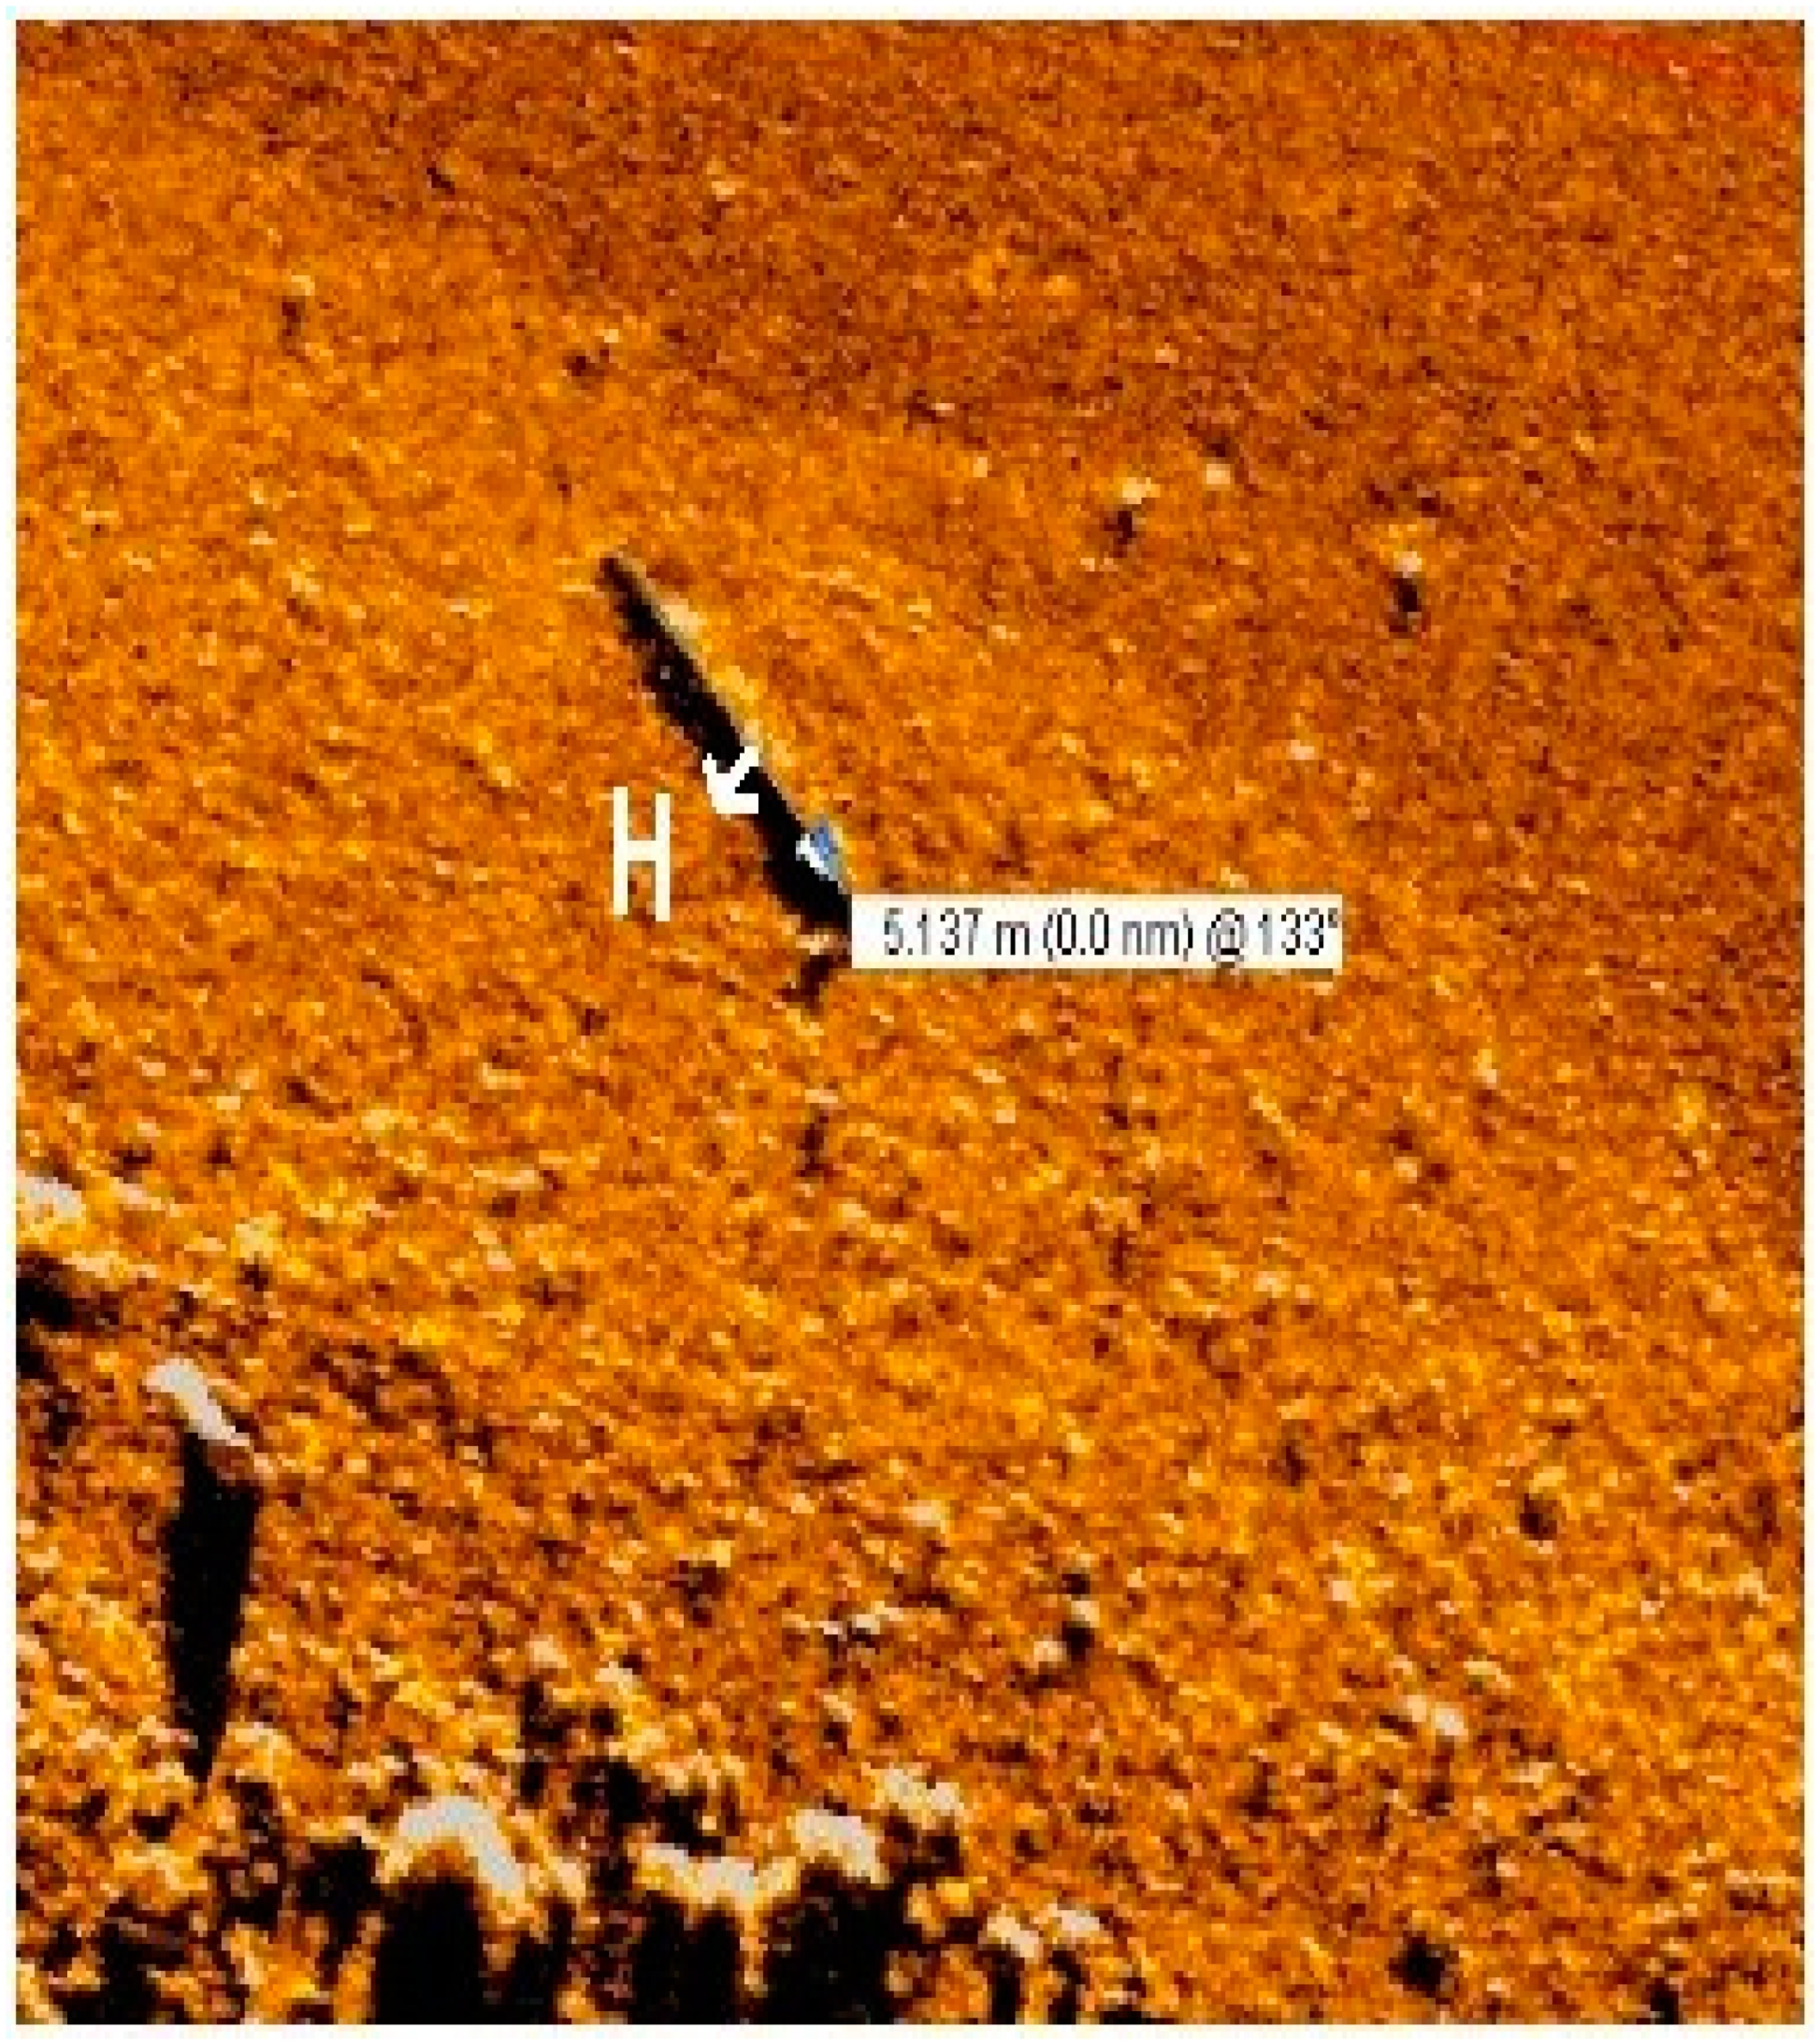
3.2. Bottom Cleanliness Tests and Report of Objects Resting on the Bottom

Bottom cleanliness tests—a set of works leading to the “cleaning” of the bottom in the place of the planned construction of a wind farm, port, construction of bridge supports, etc.—from residual undesirable objects such as mines, unexploded ordnance, boulders, stones, wrecks, tires, branches, and other unidentified objects that may cause a problem or be on the route or construction site. The bottom purity test begins with indirect tests using special equipment. The second part of the research—direct—focuses on the possible examination of the object by divers and the direct pulling of objects out of the water [40,41].
Returning to the first part, it is basically divided into sonar measurements (usually side scanning) and measurements of the magnitude, direction, and changes in the properties of the magnetic field—magnetometer. Sonar can detect very small objects, up to 10 cm.
The operation of the device itself is based on the emission of the beam and the subsequent measurement of the difference in the amplitude of the signal sent from the transducer relative to the signal reflected from the bottom or an obstacle located at the bottom [42]. The resulting difference is visualized on the screen as a single pixel. The intensity of the pixel is influenced by the structure, the materials from which the object is built, and its size. In this direction, it is easy to imagine that an object made of metal will produce a stronger echo and, as a result, a pixel of much greater intensity than a wooden bough or a rubber tire that does not echo the signal with such intensity. However, as described above, the size of the object is also important, so it will be easier to find a wooden bough than an object 30 cm long made of metal (such as a tool or an unexploded ordnance) [43,44].
Such an object, under the influence of unfavorable positioning or covering with a thick layer of silt, can become practically imperceptible, so it is necessary to use a magnetometer that detects all metal objects characterized by ferromagnetic properties, regardless of their position. Sonar allows for quick inspection of a large area of land; however, it is characterized by the occurrence of the so-called dead zone located directly below it. This zone results in a lack of data [45]. To avoid such a phenomenon, measurements should be carried out in one of the schemes with the so-called Overlaps [46].
Magnetometric measurements, on the other hand, consist of detecting sources that increase the magnetic field in the studied area. Such studies are difficult to carry out due to the need to determine the local magnetic field because the results may be influenced by, for example, the device’s own disturbances, interference from metal parts of the ship (that is why boats made of laminate are used for measurements), [47] daily variations of the Earth’s magnetic field by the sun, noise caused by sea waves, etc. Therefore, an important step is to determine the local magnetic field by reducing influencing factors to a minimum and normalizing the data by applying Butterworth filters, whose main task is to eliminate the average values generated by the Earth’s magnetic field and leave low-frequency data allowing for the location of ferromagnetic objects. Localized sources of signal changes are used to show them on an anomaly map, which shows where the magnetic field strength changes. In addition, it is possible to determine the mass of the ferromagnet by using the correlation between the location of the anomaly, the distance of the sensors from the object, and the value measured by the device, which allows estimating the size and type of the object and estimating the forces and human and equipment resources needed to extract the object from the bottom [48].

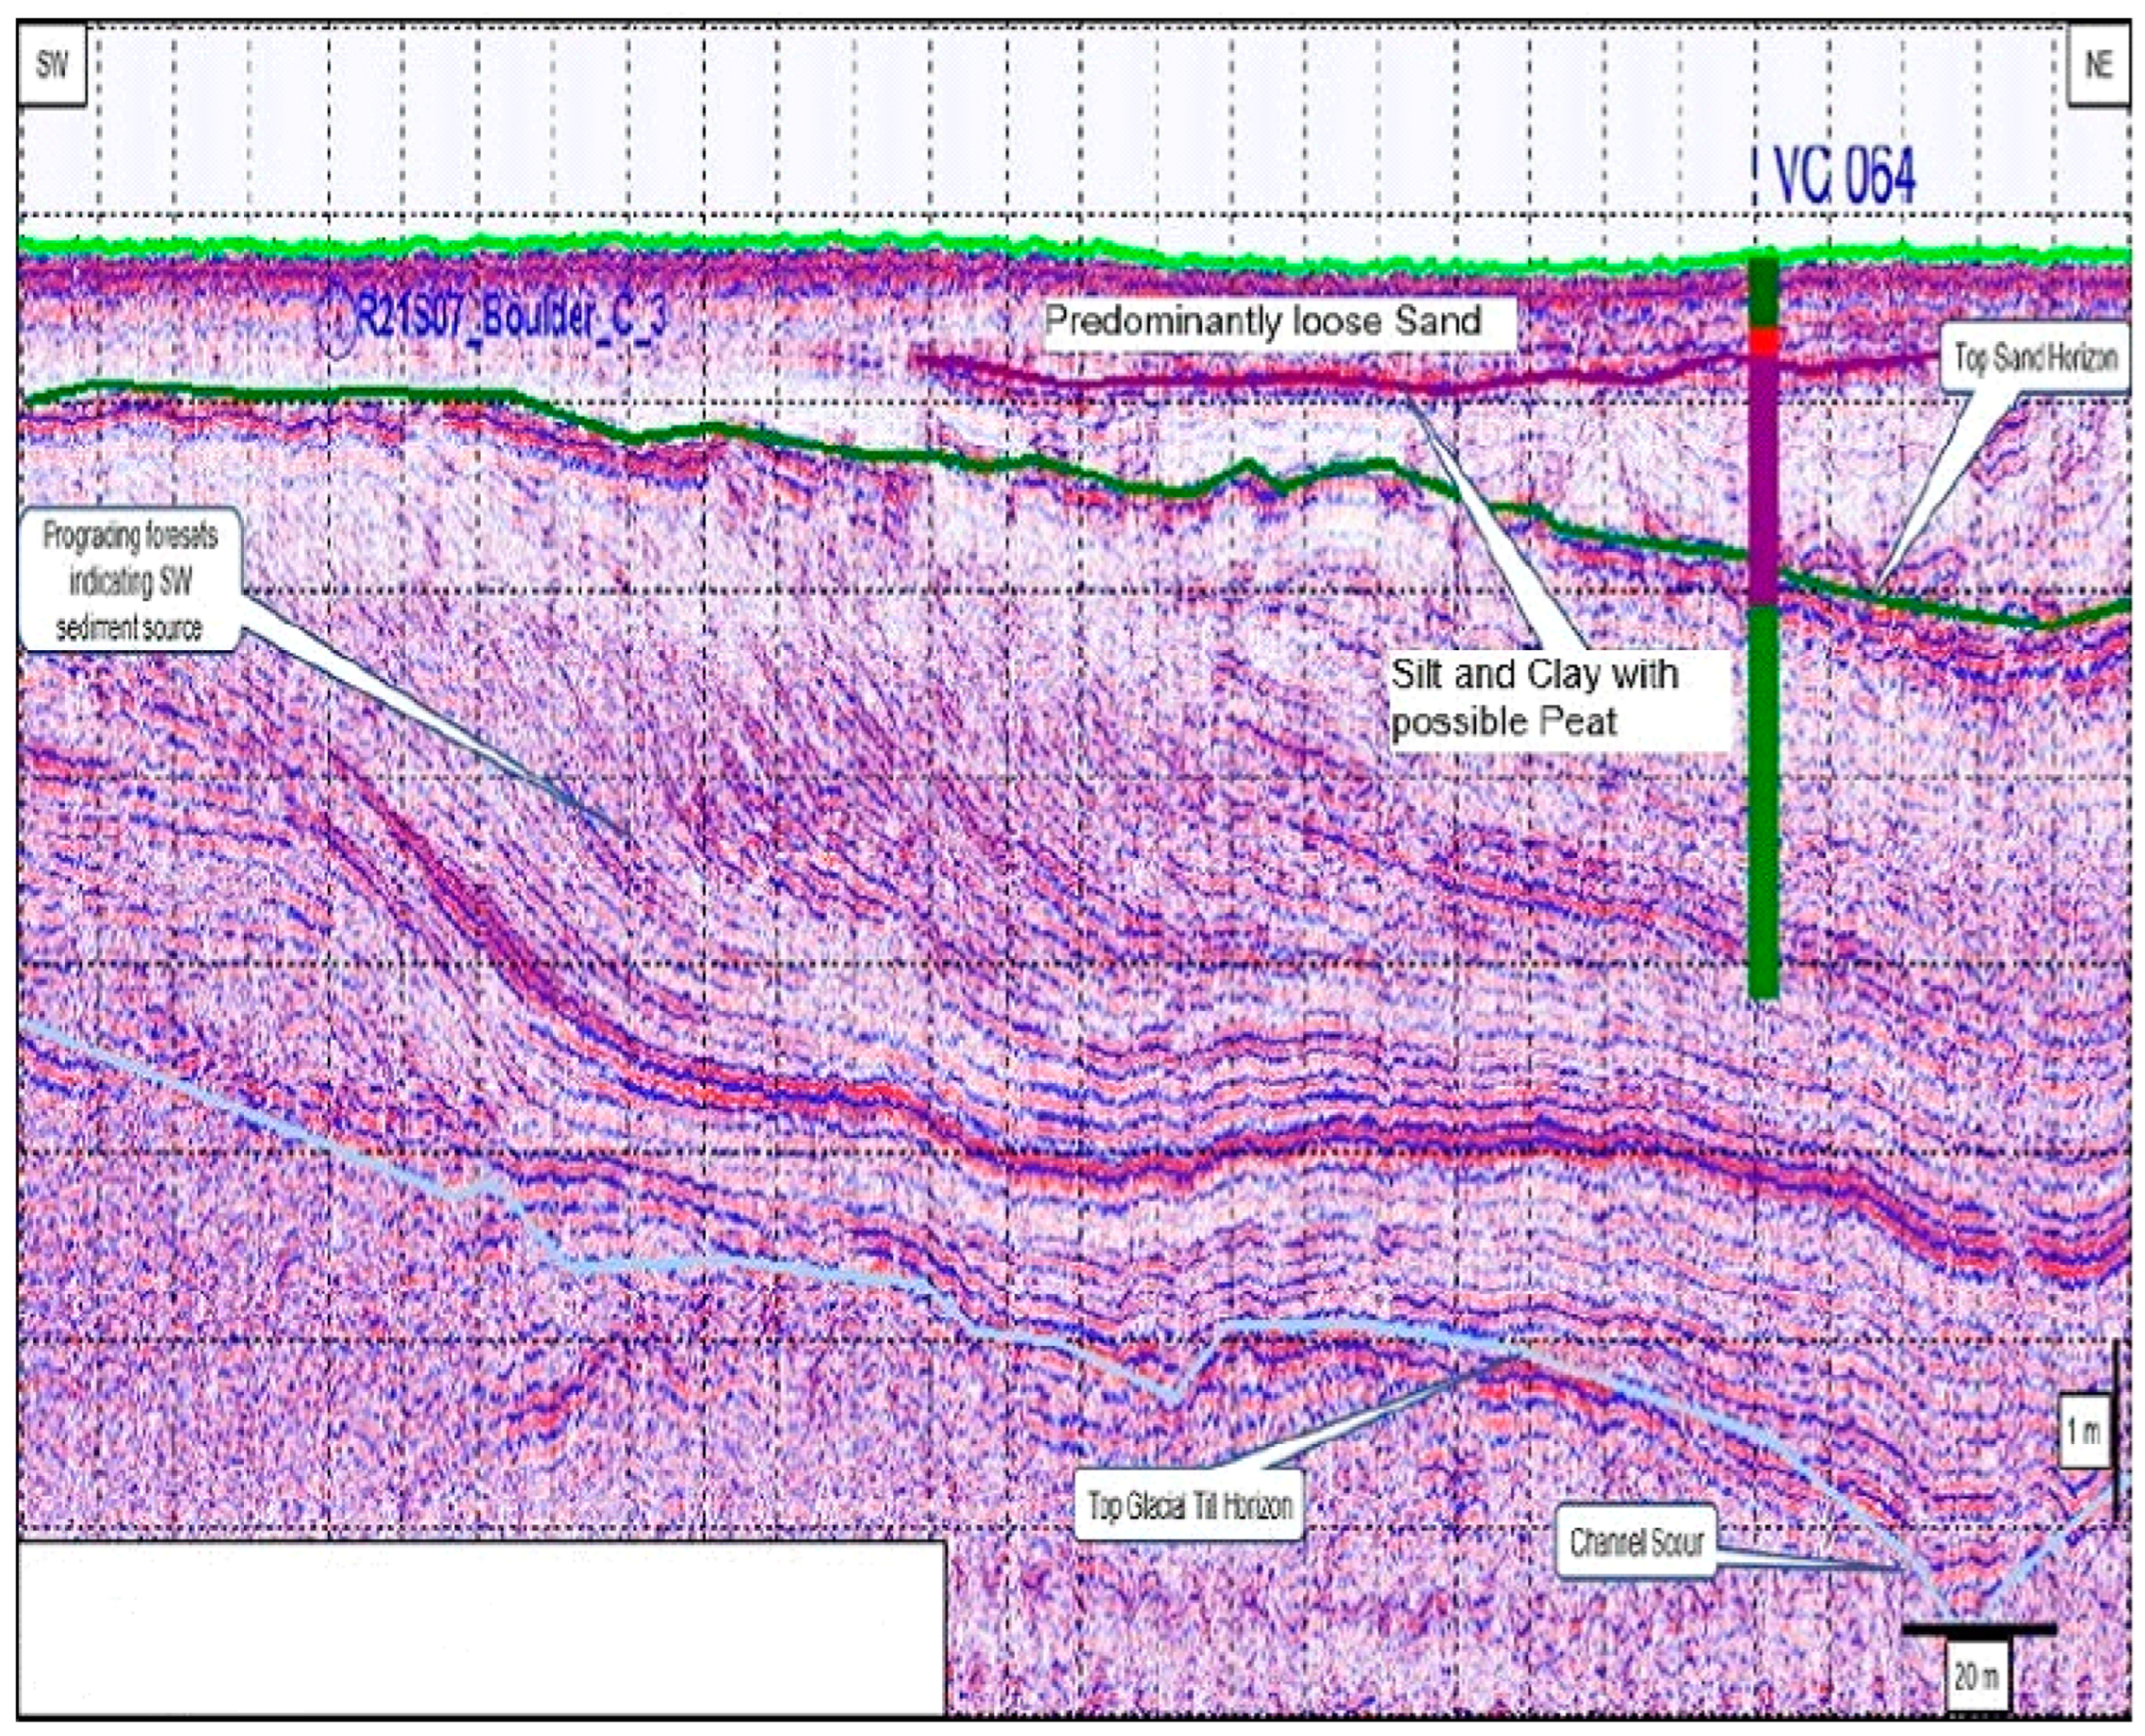
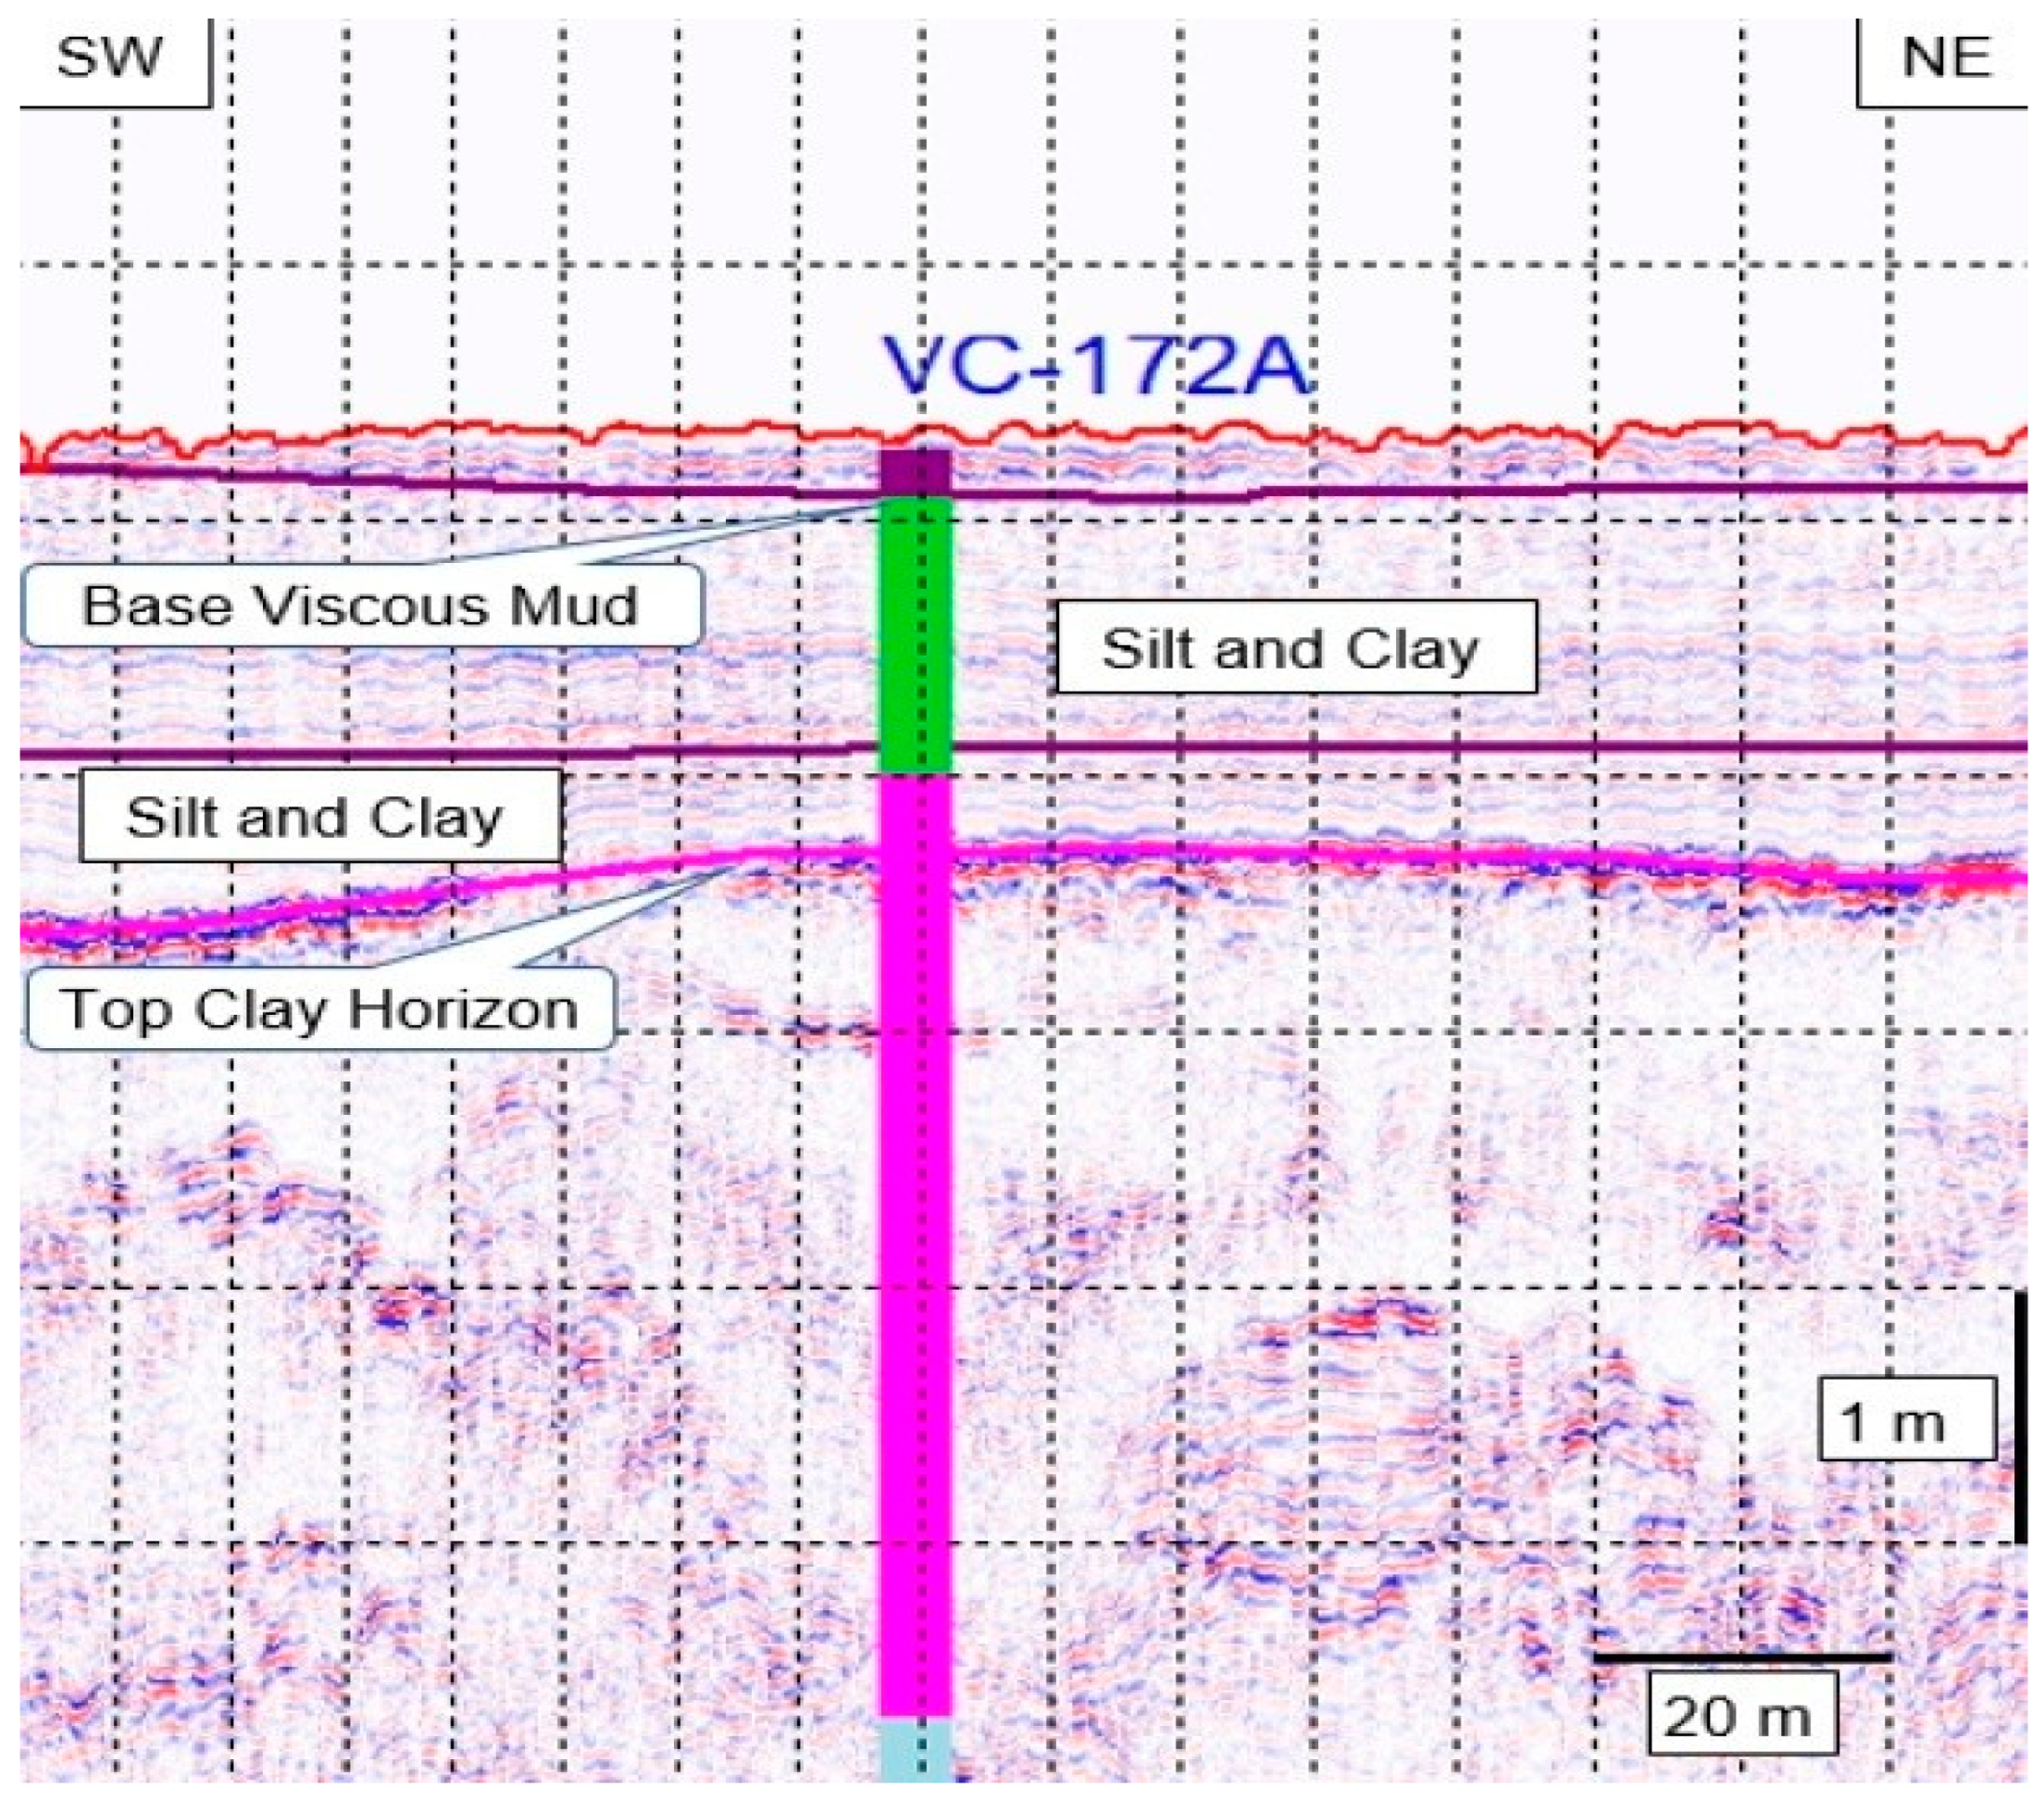
3.3. Sub-Bottom Profiler and Drilling with a Vibro Probe
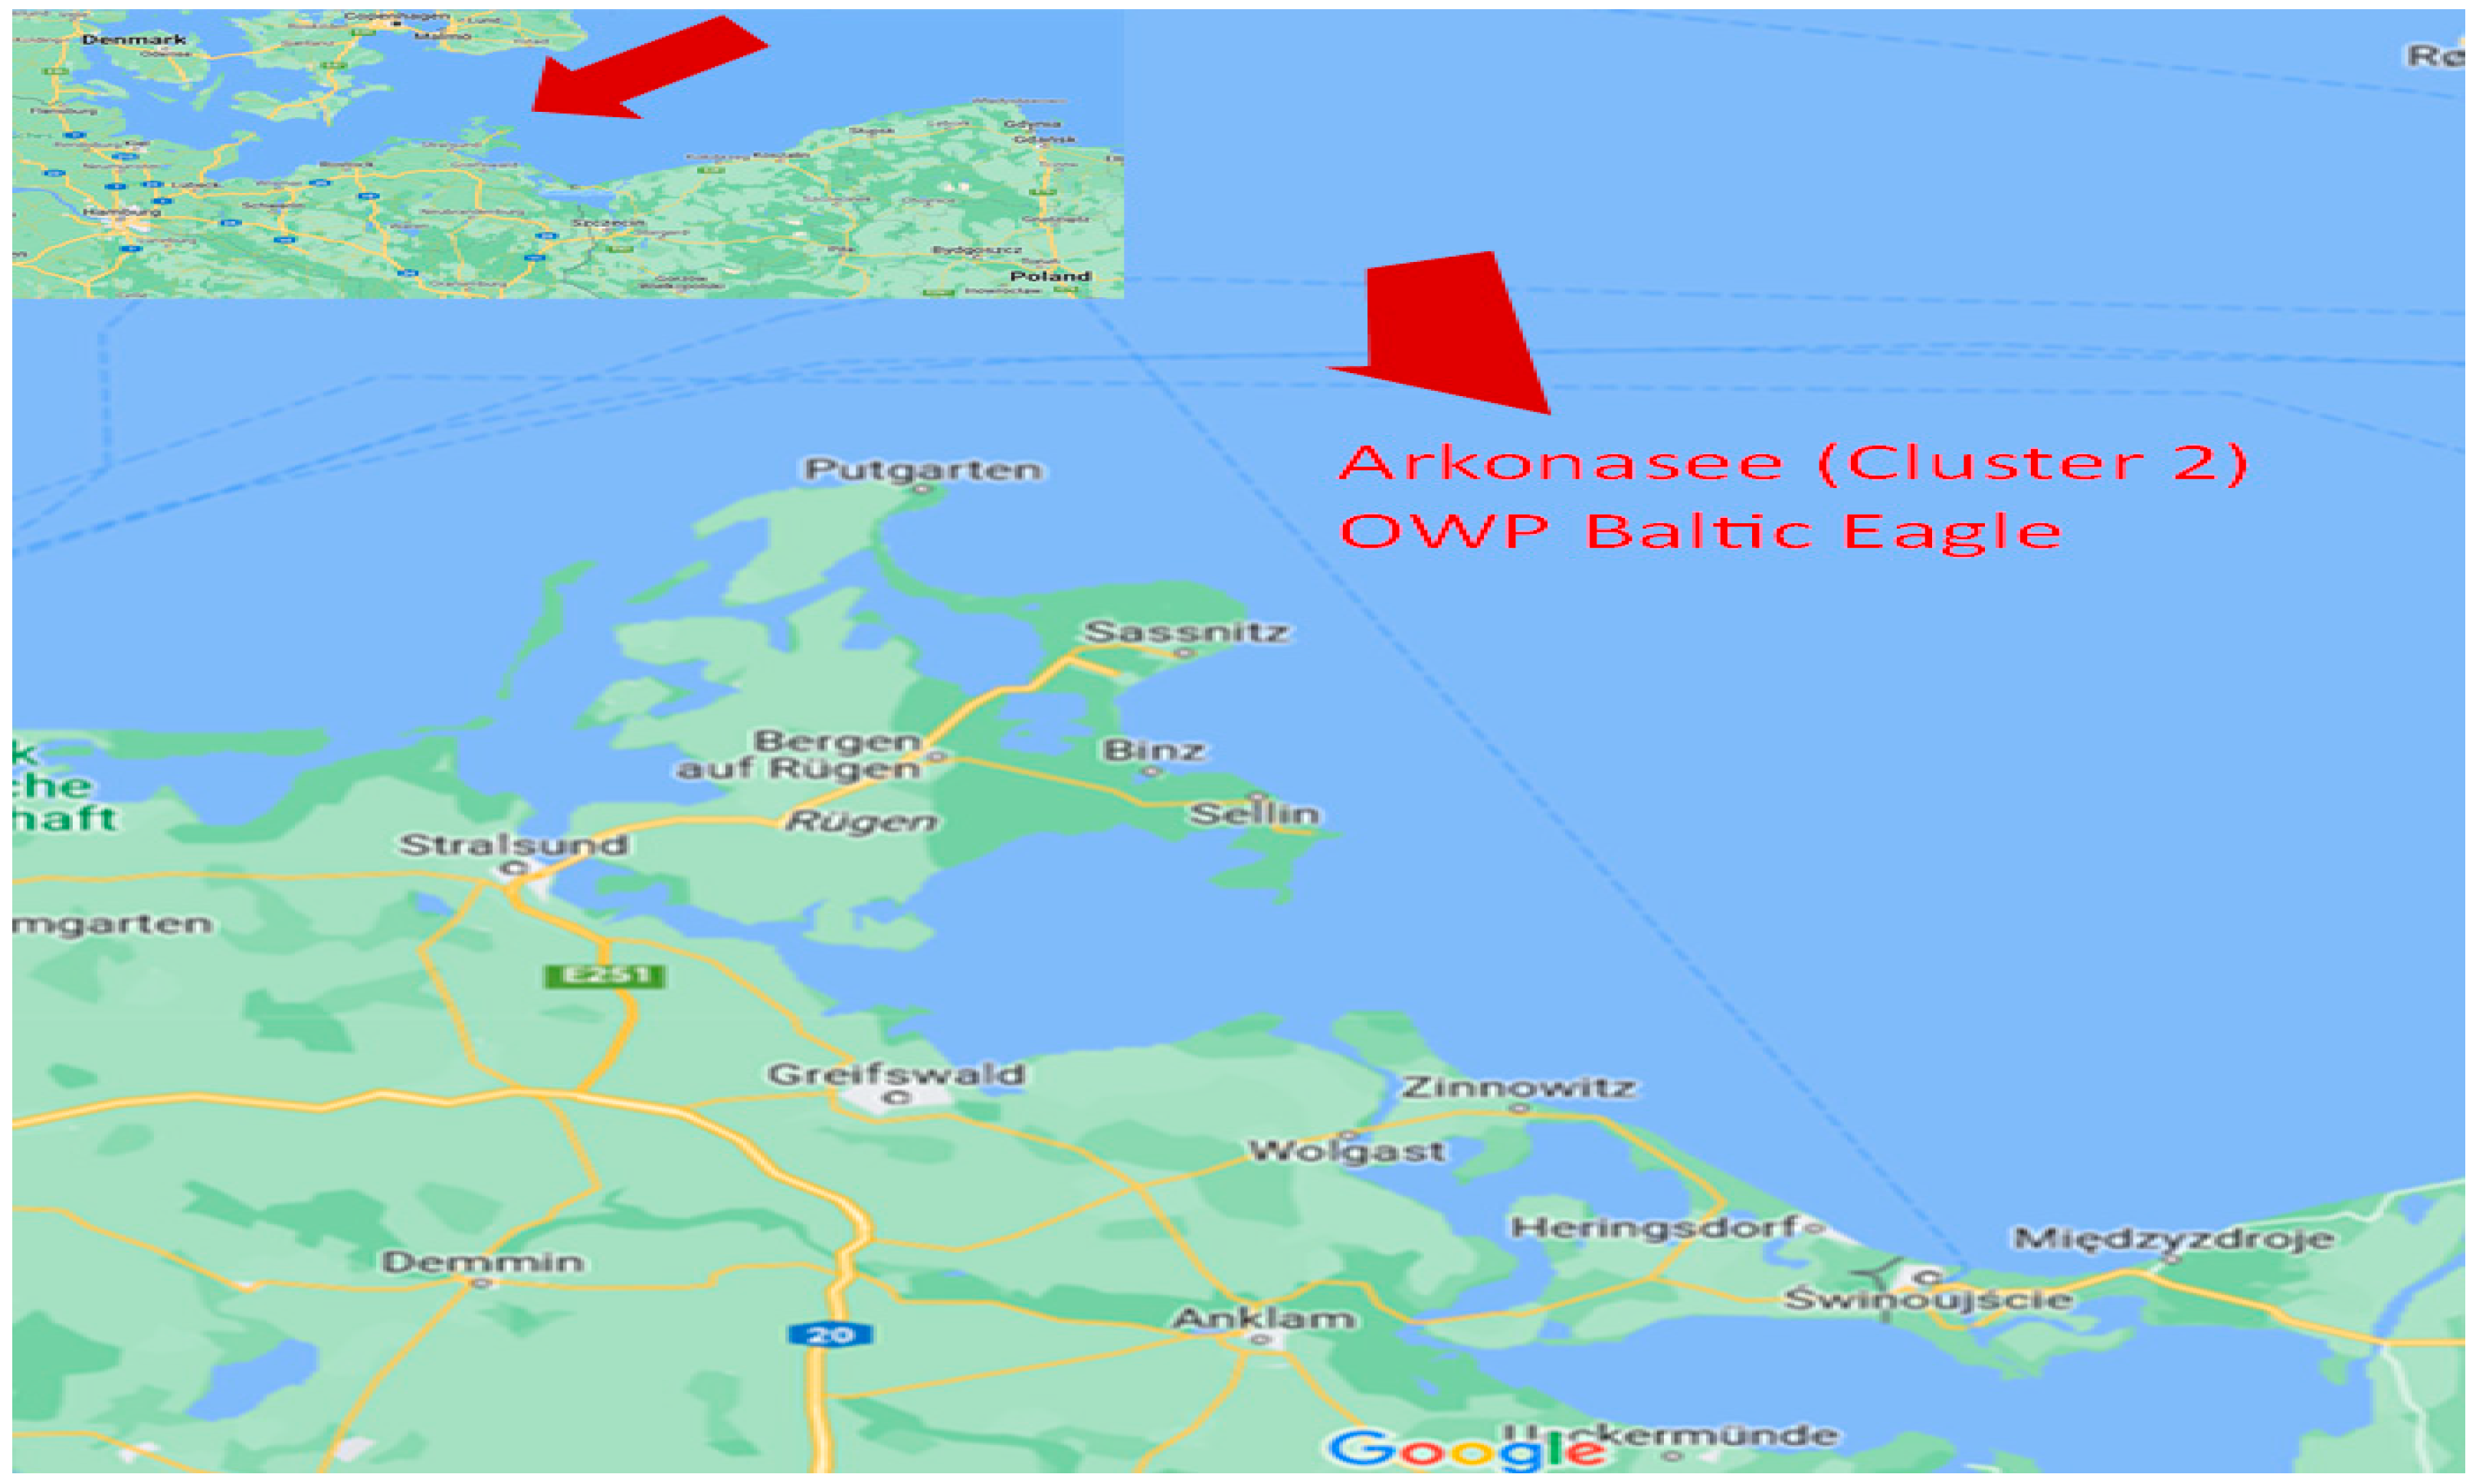
A sub-bottom profiler is a device used to determine the physical properties of the seabed and the geological characteristics of bottom layers. The device itself works at different frequencies. Low frequency provides deep penetration of the bottom at weaker resolution (with a large accumulation of deposits, their boundaries may blur), while a higher frequency provides less penetration and higher resolution. The penetration of the acoustic signal is also conditioned by the sediment at the bottom [49,50]. In the case of coarse deposits or heavily compacted sands, the penetration of the acoustic signal can be very difficult and limited. SBP devices are widely used in marine, coastal, and port engineering for conducting geotechnical surveys of the terrain, dredging research, and mineral exploration [51,52,53].
Vibro-probe boreholes are used to take bottom samples to determine bottom sediments. Deposits affect the stability of wind turbine structures and transmission infrastructure, preventing lines from overheating. The vibro sounder itself can be mounted on a special winch/guide or on a crane placed on the ship. The vibro probe consists of a vibrator that vibrates at a frequency of approx. 50–60 Hz and introduces a stainless-steel pipe into the bottom. Inside the pipe, there is another pipe, this time a plastic one called a sleeve. The end of the pipes ends with a one-way valve that prevents the test from getting out when pulling out the vibro probe. If compacted sediment or scale is found, the measurement should be repeated to complete the entire sample with bottom sediment [54,55,56].

4. Research Area

The test area where the measurements were carried out is marked with a yellow circle in the figure below (Figure 1). This area is located in German waters, approx. 90 km from Lubmin, where the transformer plant is located and to which the electricity obtained from the wind farm will go. The nearest coast of Rügen is only 20 km away. The farm itself is surrounded from the west by the largest German island, Rügen, and from the east by an already operating wind farm. In the future, it is planned to build another wind farm and create a complex of three wind farms. The wind farm area is located within the borders of the German economic zone.

5. Research Methodology

Seabed research is complete research used to learn about the parameters of the basin, which are extremely important from the point of view of navigation safety, as well as the location of the structure on the bottom of the basin. Bottom research is aimed at providing information about the depth of the basin, sediments on the bottom, and obstacles or objects resting on the bottom. Figure 2 shows the stages of a seabed survey from the perspective of wind turbines.

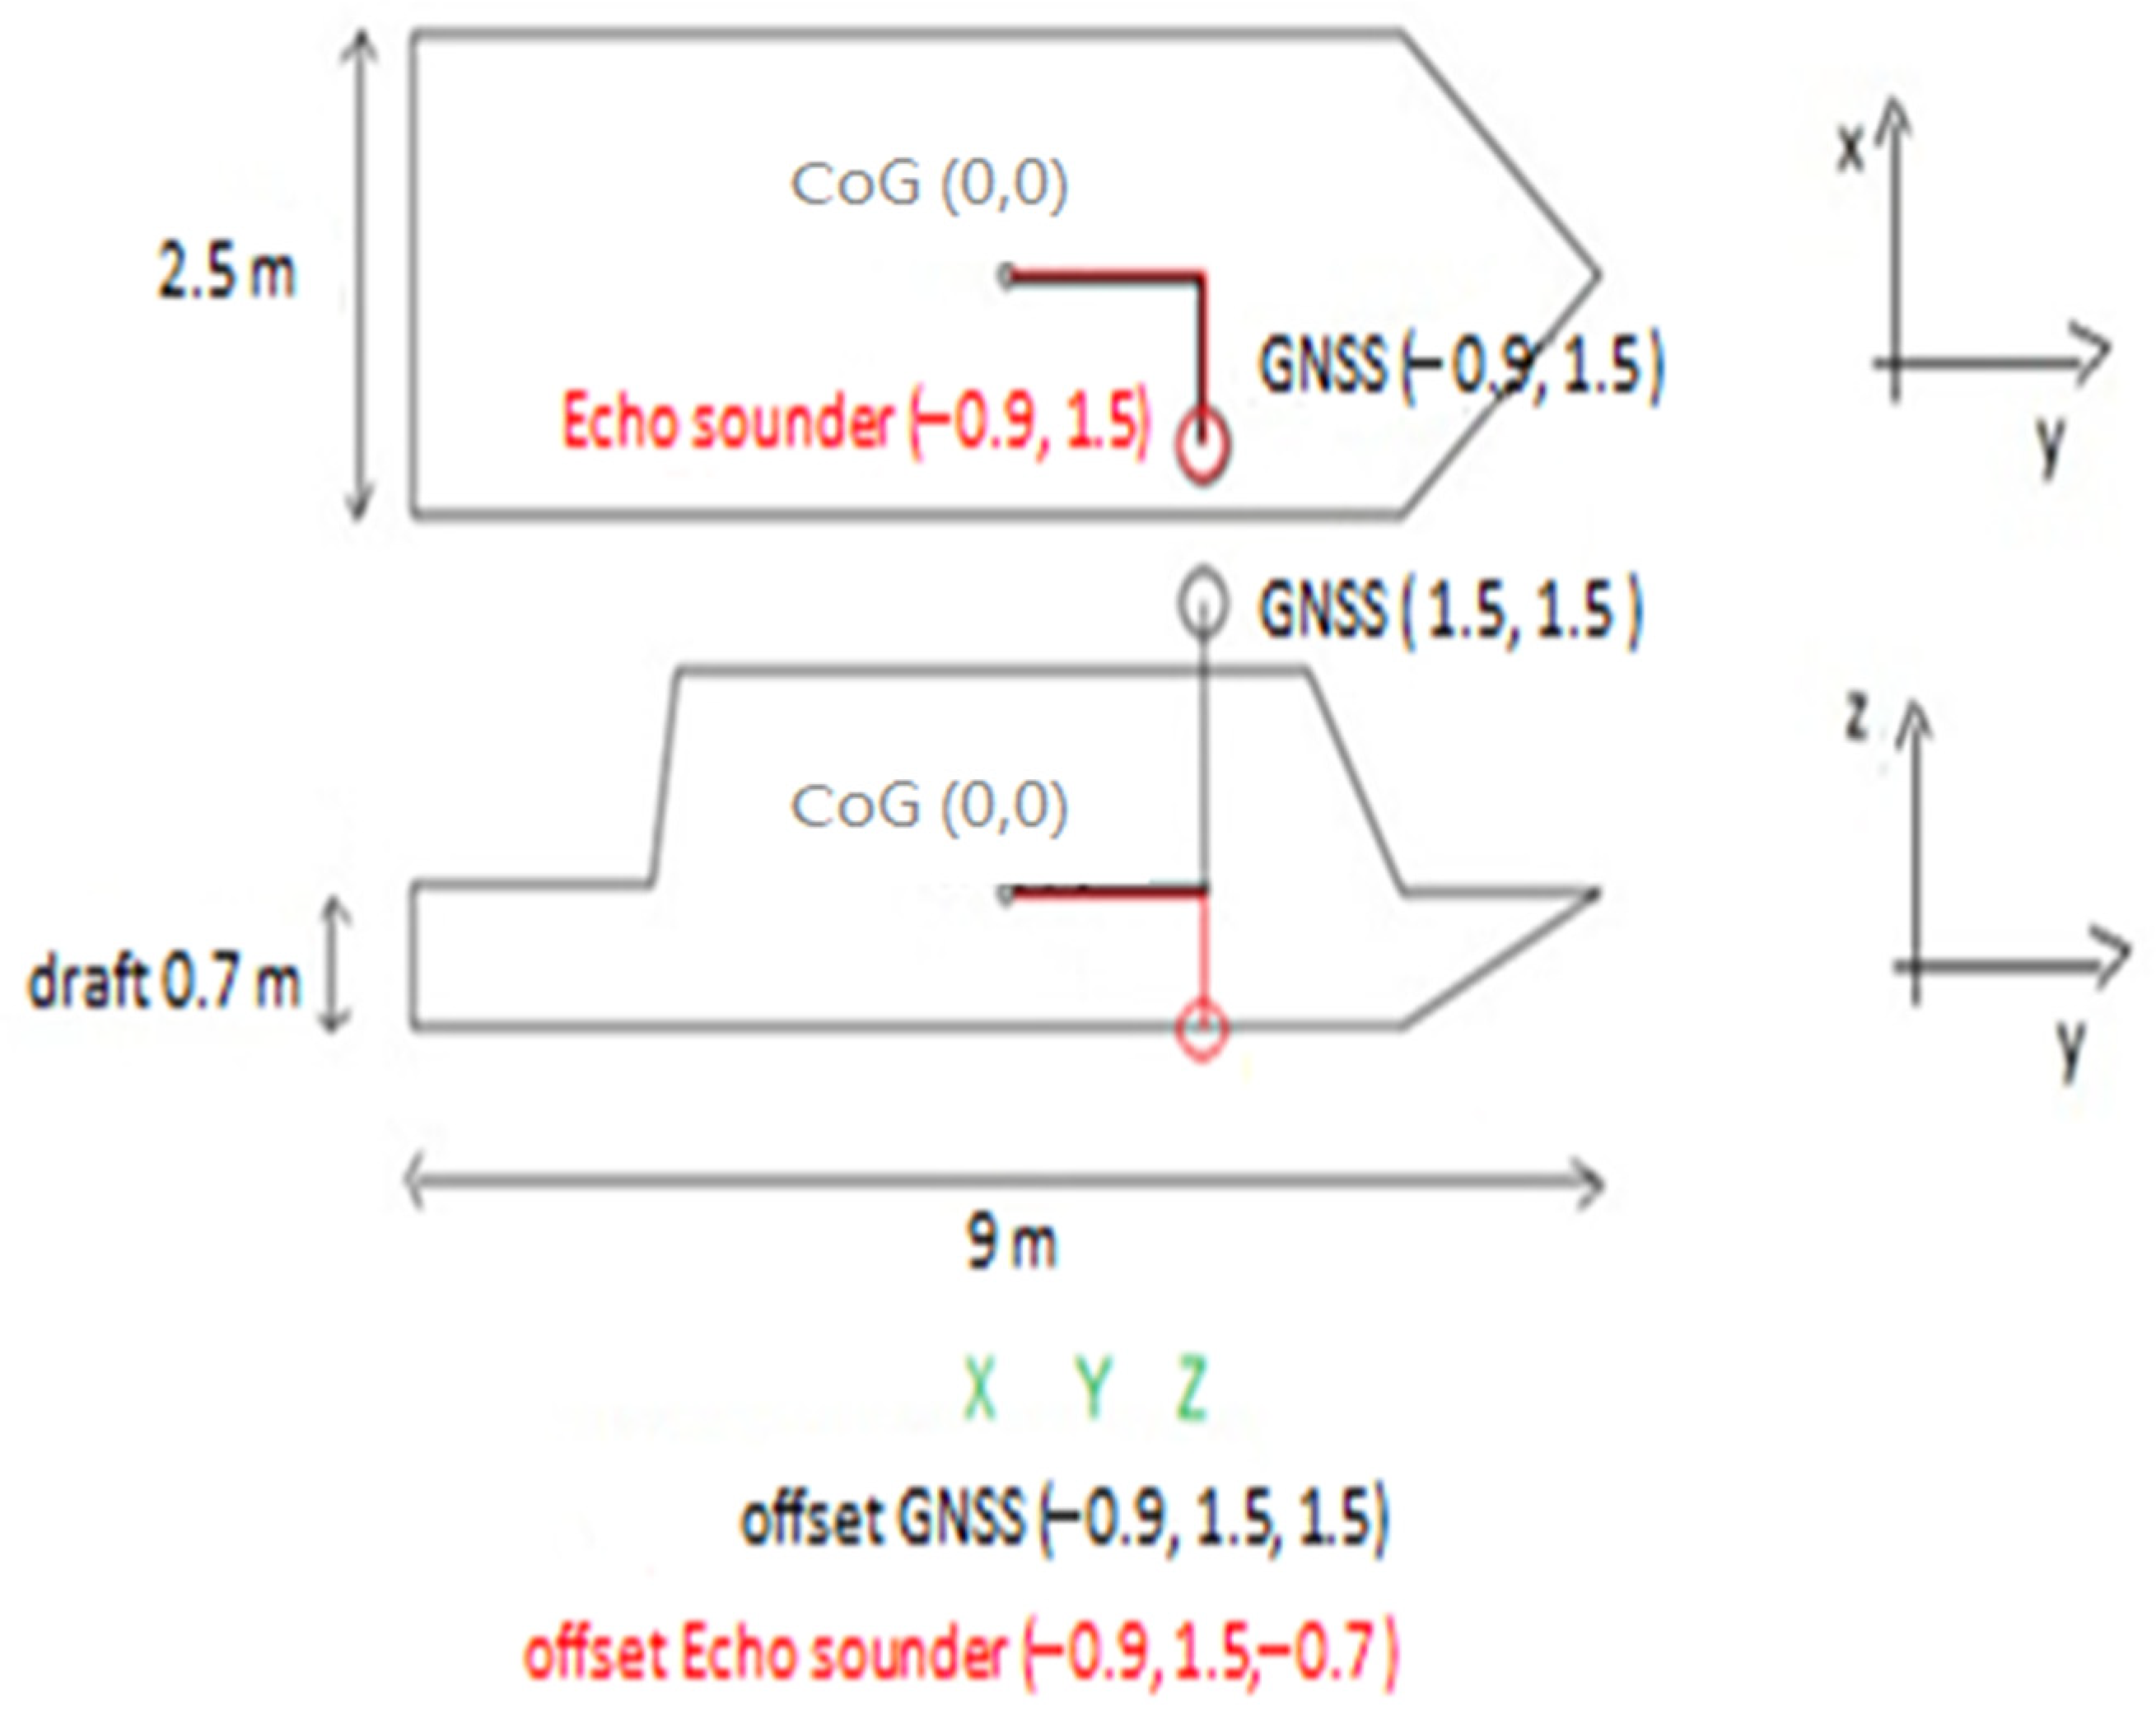
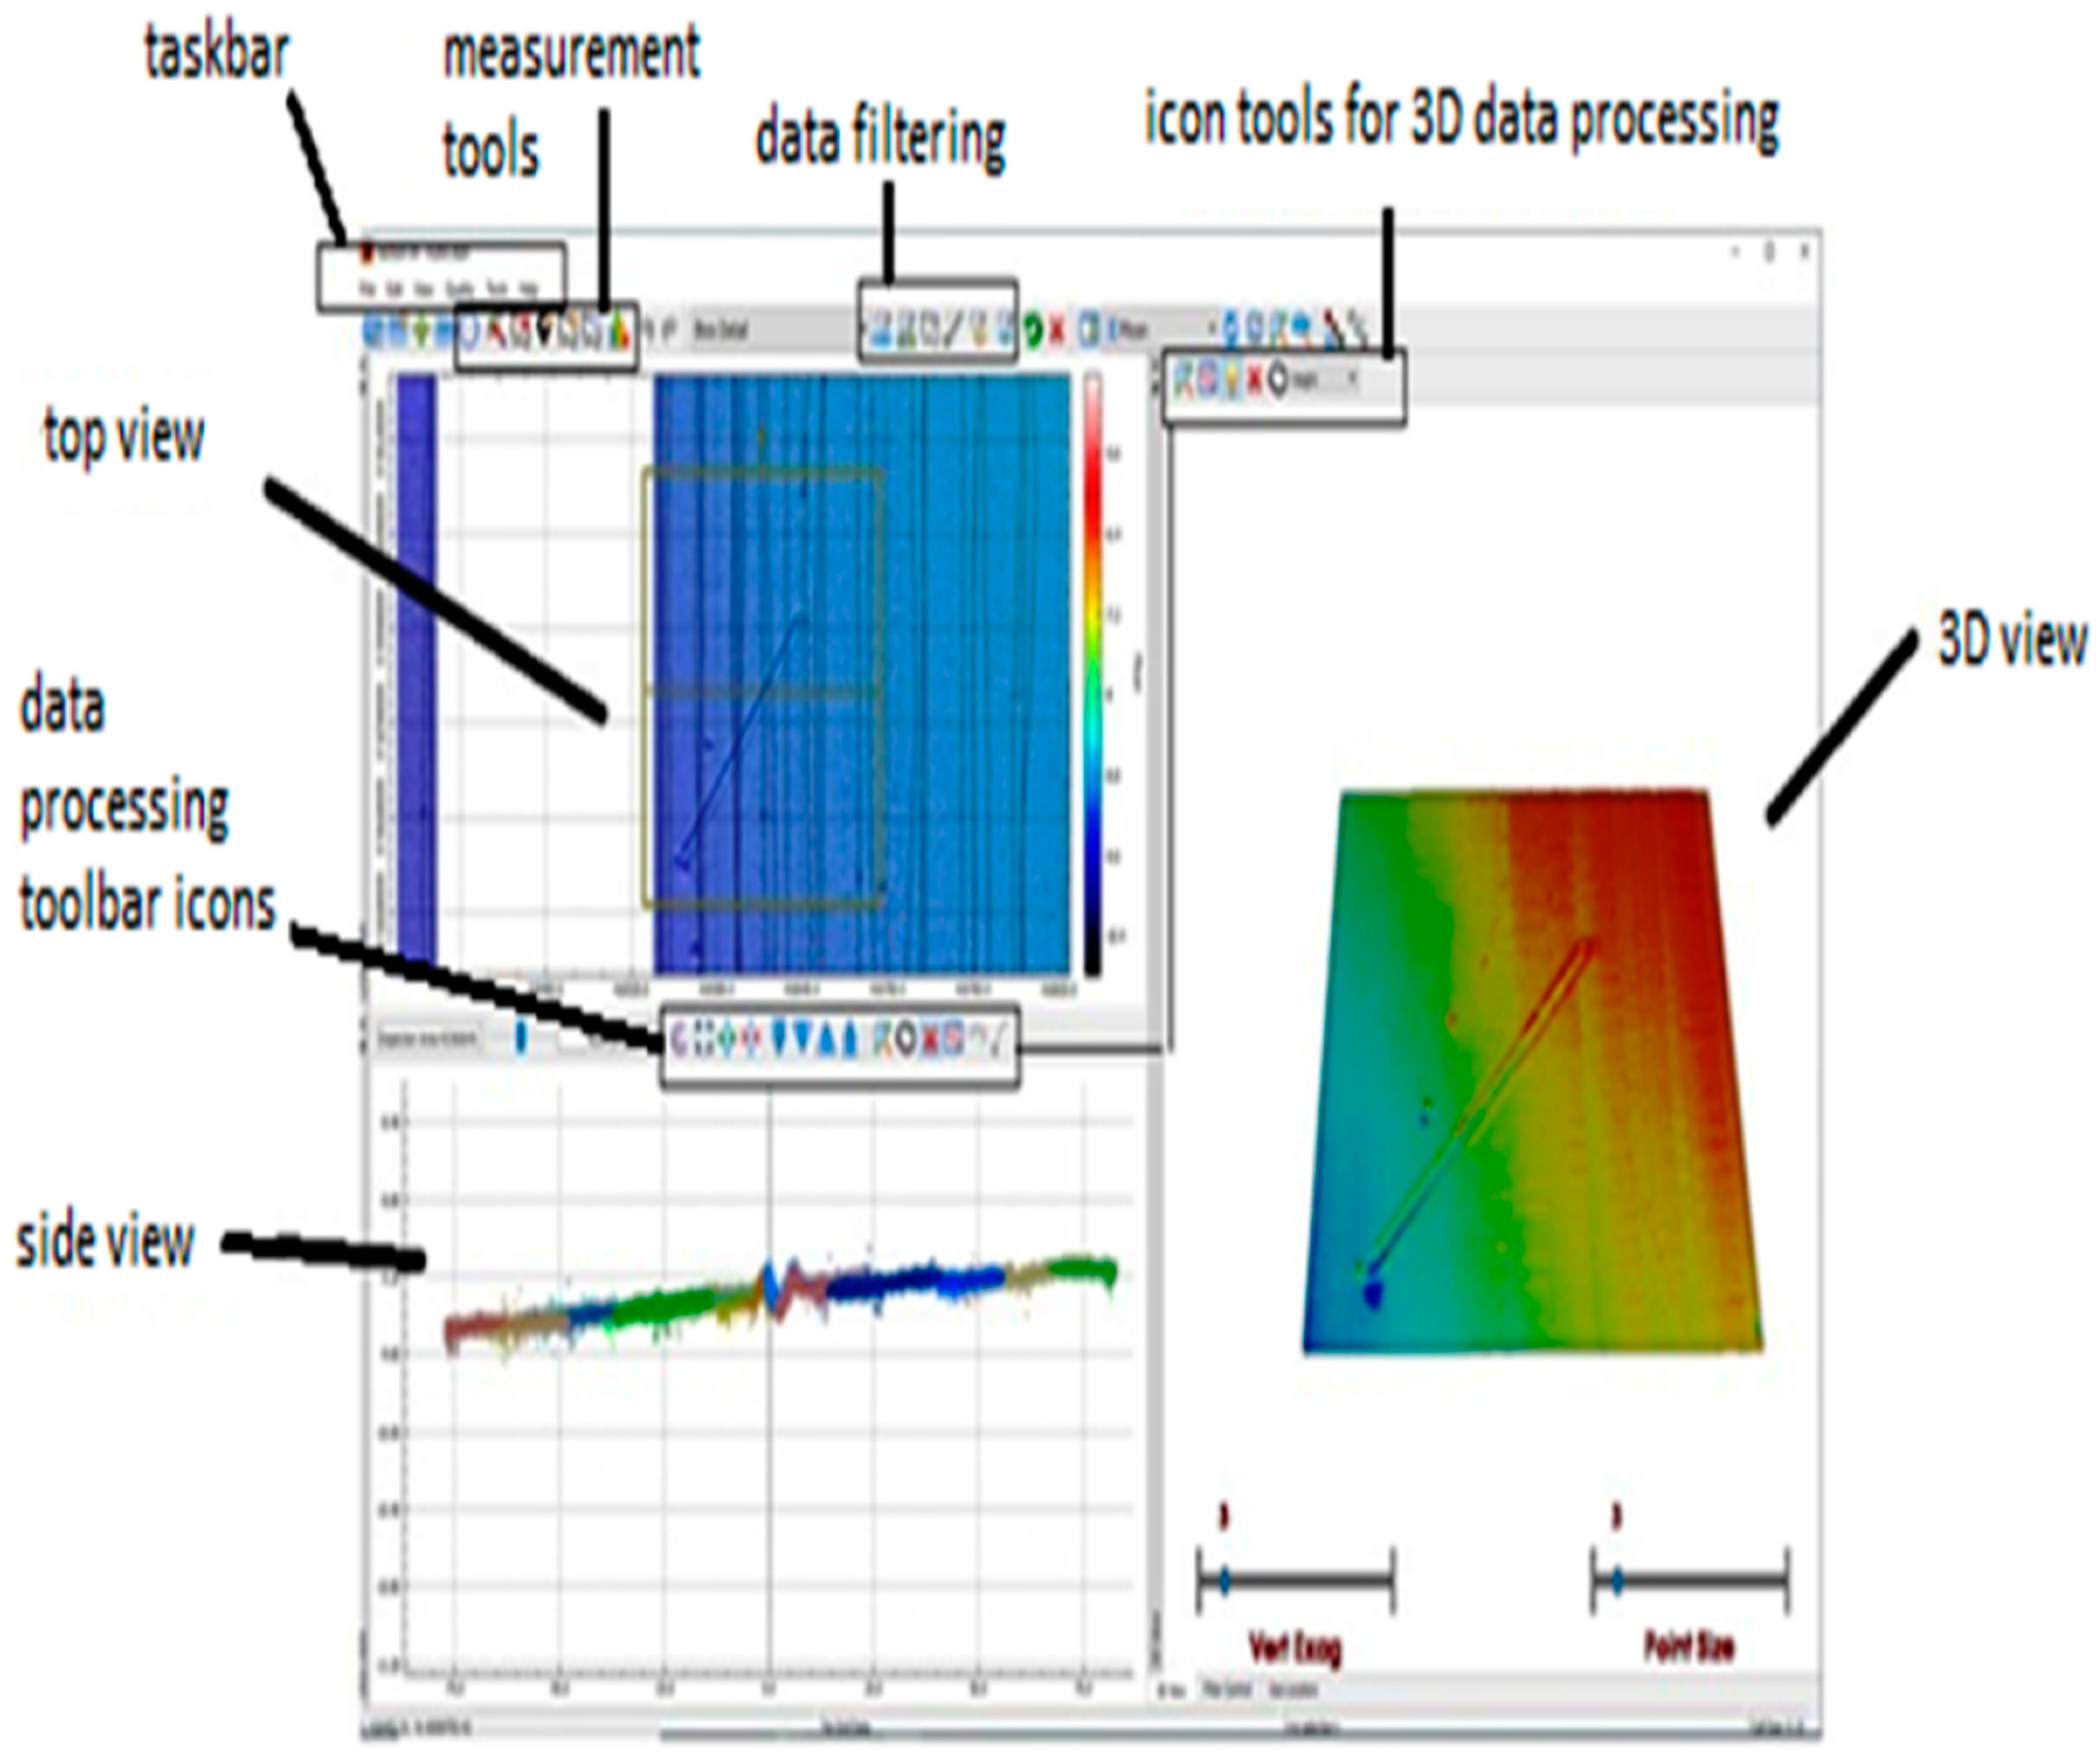
5.1. Methodology of Conducting and Analyzing Depth Surveys with Multibeam Echo Sounder

Multi-beam sonar measurements consist of connecting the device to the power supply, a computer, and a GNSS system that provides the correct measurement coordinates. In addition, system offsets should be adopted, i.e., the distance of the sonar from the GNSS system in three planes (X, Y, and Z), so that the collected data refer to the place where the sonar is mounted and not the place where the GNSS receiver is mounted. A good practice, if possible, is to install an echo sounder on the GNSS receiver to make it easier to determine offsets. Figure 3 shows examples of equipment offsets.
After proper acquisition of bathymetric measurements, i.e., scanning the entire area in accordance with the project and guidelines, the so-called bathymetric data development (post-processing) was shown in the example of AutoClean 6.4.3.10318 software. The post-processing of the data itself consists of removing defective data, which consists of disturbances caused by, for example, floating schools of fish as well as echo sounder errors manifested as an unnatural shape of the terrain in the form of a sharp spike. After obtaining satisfactory data, the data is exported to GIS software (AutoClean 6.4.3.10318), in which the data is shown as the final product in the form of a georeferral map (i.e., having a coordinate system that makes it easier for every user to find themselves in the measurement space using even a simple and free tool such as Google Earth).
In the figure below (Figure 4), you can see the layout of AutoClean 6.4.3.10318. At the top, there is a taskbar and the entire menu, with individual program functions allowing for general and detailed data filtration, which automatically removes errors after indicating its specific parameters. However, if incorrect parameters are implemented, the filtering function can also remove data that is correct. Therefore, knowledge of filters should be demonstrated. It is also good practice to test their operation in a small area to avoid removing a large part of the actual measurements.
The Autoclean program is divided into three screens. The screen in the upper left corner is used to select where the data is processed and to select unusual places in detail in order to carry out an accurate study and a preliminary estimate of what it may be. The right part of the screen presents a three-dimensional, or 3D, view. It is used to roughly remove erroneous data as well as to illustrate the shape of the bottom and objects resting on it. The image in the lower left corner is a cross-section of the profile; it is like a single line on which we can make a detailed removal of erroneous data step by step. The width of the cross-section can be selected depending on the degree of accuracy with which the measurements must be made. The values of the cross-section belt can oscillate from 0.3 m practically to infinity; however, the wider we choose, the less accurate and detailed the study will be, and the more it will load the RAM of our computer, causing at best the software to be disabled.

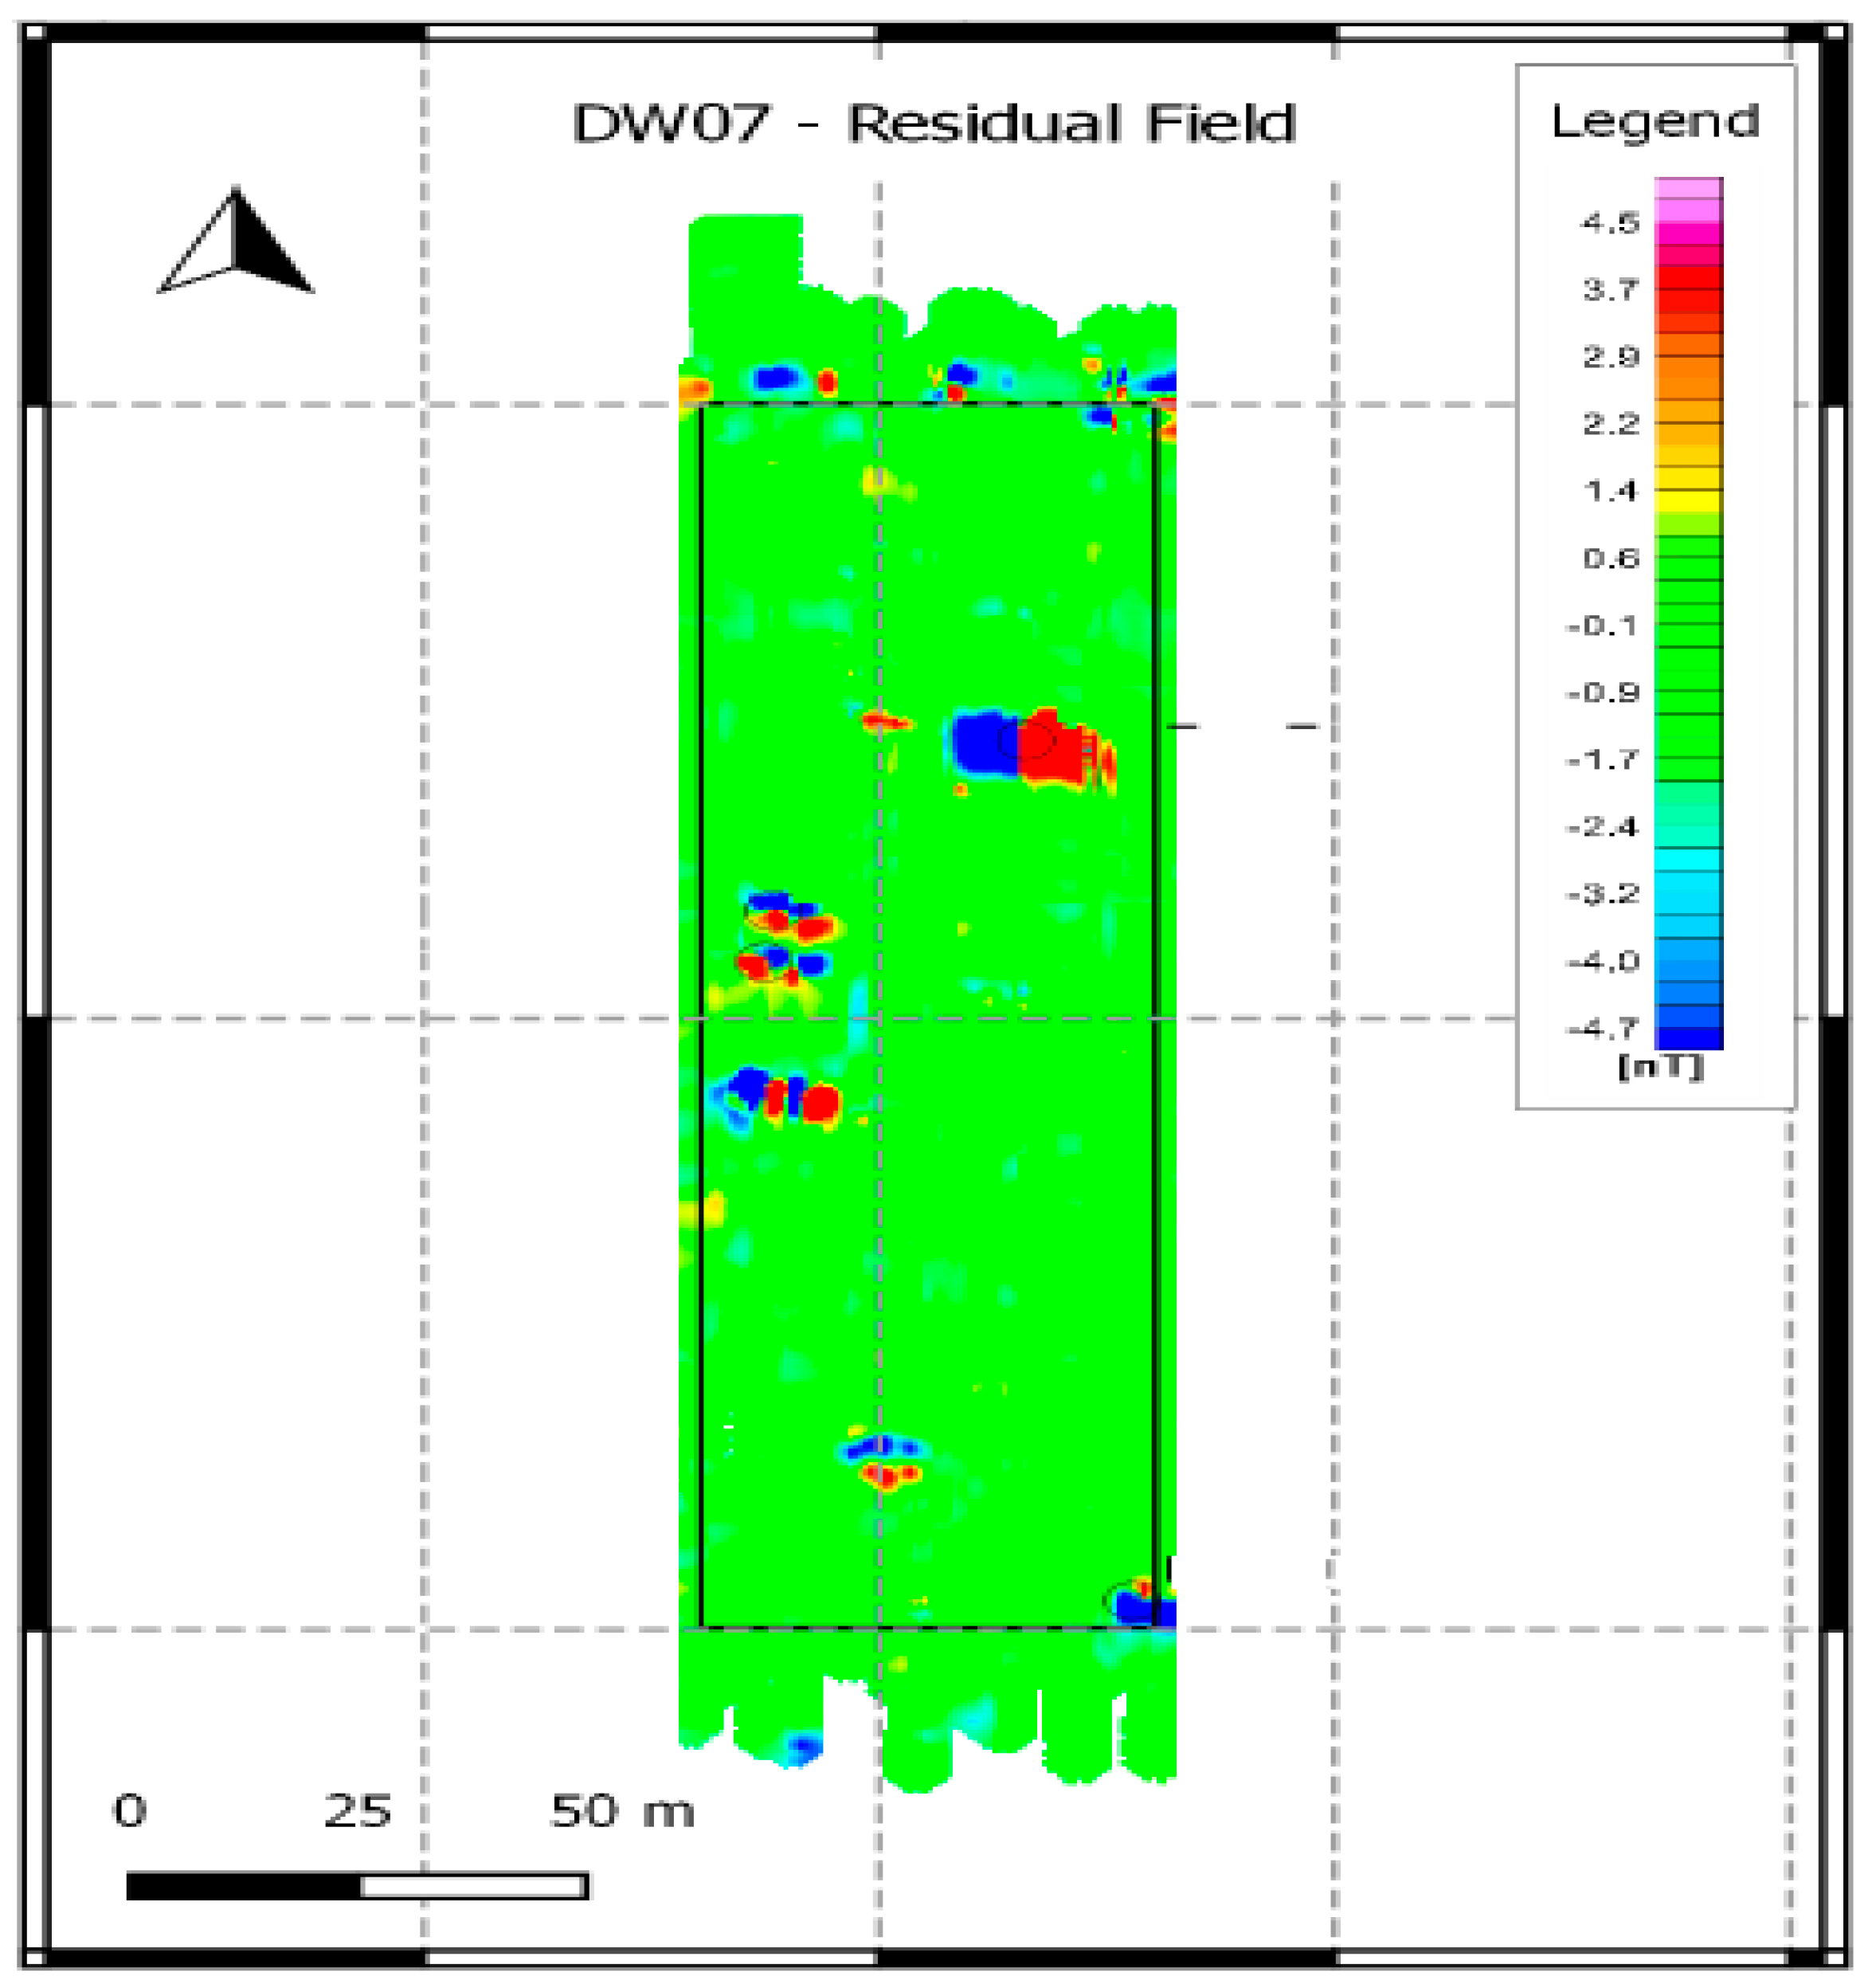
5.2. Methodology of Testing the Purity of the Bottom and Resting on the Bottom of the Magnetometer

Conducting magnetometer tests is very similar to tests carried out with a multi-beam echo sounder. After mounting the magnetometer permanently on the unit (the unit must be made of laminate so that it does not emit interference) the offsets of the device are determined, and data collection begins. The data on the monitor screen is drawn as shown below (Figure 5).
The circle marked in red suggests that in this place lies an object with properties strongly affecting the magnetic field. It can be either an anchor, a metal element, or an unexploded ordnance. After collecting material from the entire area, a map of magnetic anomalies is made in GIS software. The field marked with a green color is a field on which there are no anomalies, while the appearance of red–blue fields is a signal that there is an object with ferromagnetic properties in this place. Exactly as in the case of magnets, two poles are marked—north in red and south in blue—and the same is true on the map. You can read the arrangement of the object and its size based on the magnitude of magnetic interactions.
After drawing up the map, a team of divers starts working, whose task is to actually identify the object and decide on its extraction or subsequent detonation. However, before magnetometric measurements, it is customary to perform sonar measurements to identify all places where there are objects or obstacles hindering the work of dredgers involved in laying transmission infrastructure or piling, setting, and positioning foundations for the mast of a wind power plant.
Before starting the measurements, connect the sonar to the trigger, which provides us with a connection to the computer, power supply, and GNSS system. Once connected, run a quick test to verify that the sonar transducers are working by running them for a few seconds and rubbing the transducers with your hand. It is important that the test last only a few seconds so as not to burn the transducers.
After the test and departure for the water, the hypothetical position of the sonar should be determined. As it is an element towed behind the ship, we cannot determine a permanent offset from the GNSS device but only an approximate position using the “playback” method. The sonar distance behind the unit is calculated using the formula shown below. Knowing the distance, you should put it in the hydrographic software 6.4.0.2, which will move the measurements to the right place.
Layback = DT + √ [WO2 − DS2]
where:
DT—horizontal distance from the position measurement point to the stern of the unit
WO—total length of the cable (issued from the stern of the unit)
DS—sonar depth below the surface
As was the case with other measurements, the data acquisition is followed by their processing in the SonarWizz software version 7.04.08. In the case of towed-side sonar, the processing of data consists primarily of removing the dead zone, i.e., the black belt without data. After removing the dead zone, the data should overlap (of course, if you applied the overlay to adjacent profiles beforehand). The merged image from all profiles is called a sonar mosaic. (However, it has only a presence function). A more important aspect of the development of sonar data is the preparation of a report of objects resting on the bottom.
In the figure below (Figure 6), you can probably see the pipe. For both the pipe and any other object, three measurements must be taken. Measurement of object length, width, and shadow length (marked with a white arrow and the letter H).
After taking these measurements, the software automatically calculates the height of the object above the bottom based on the relationship of similar triangles.
After selecting and measuring all potential objects from the study area, export a report from the software containing all details such as X and Y coordinates, Dimensions, length, width, and height, a description of the potential object, and optionally the number of the measurement line. The finished report is then analyzed and compared with the report and map of magnetic anomalies in order to determine the location of unexploded ordnance for their subsequent neutralization.

5.3. Methodology of Conducting Underground Sediment Research Using Indirect (Subbottom Profiler) and Direct (Vibroprobe) Methods

The last stage of hydrographic research and measurements is the examination of underground sediments with the sub-bottom profiler device and soil sampling in places of great importance (i.e., in places where a wind turbine is located or on the route of transmission infrastructure) and in places where the results obtained with the SBP did not provide clearly interpretable data. When starting the SBP measurements, we proceed similarly to the side sonar towed after departure; we determine its hypothetical position using the layback method (you can also use the more expensive USBL method consisting of locating the device using transponders mounted on the device and on the ship in a place with known coordinates). After determining the position, you can proceed to the measurements.
The obtained data appears on the screen in the form of pink lines of different densities and intensities. Only after data acquisition can the results be developed. It consists of determining the type of rock/sediment using the intensity of color and density of the line because the device shows what is under the bottom and the first top layer of sediment and silt (which is drawn with a green line). Then, after analyzing the data, lines corresponding to the layer with a description of the probable material/sediment are applied. Figure 7 shows the obtained data from the SBP.
The next step is to conduct research with a vibro probe, which is the device shown in the figure below (Figure 8). The test/borehole itself consists of sailing the unit with a crane placed on it and a vibro probe mounted to the boom to the right position, designated (as mentioned above) in key places. After the vessel is properly seated and anchored, coordinated measurements are made over the drilling site. The crane immerses the arm with the virosonda in the water and starts it. As a result of vibrations, the probe goes deeper and deeper into the layer of silt and bottom sediment, collecting the sample in a tube 5 m long and about 20 cm wide.
After drilling, the sample is pulled to the surface of the unit, where it is quartered into 5 samples about 1 m long. They are immediately handed over to the geologist on board for an unambiguous interpretation of the results.
The last step after the geologist examines and describes the samples is to plot their cross-sections on the map. The cross-section should correspond to what was previously marked on the map obtained from the sub-bottom profiler. If there are major differences, inaccuracies, or doubts, the sampling should be repeated at a straight distance of 10–20 m from the place of original measurement in order to verify and obtain an unambiguous answer.

6. Results

The cost estimate of seabed exploration works is a comprehensive approach and statement of costs, time, and human and equipment resources needed to perform specific research on a water reservoir in order to find a suitable place and the subsequent construction of an offshore wind farm.

6.1. Analysis of the Scope of Seabed Research

Seabed research necessary before planning and subsequent construction of a wind farm should start with familiarization with the materials already available, i.e., sea maps, aviation, etc. After reviewing the available data, potential sites should be identified that could be used for the construction of an offshore wind farm. Such a place should not lie on the route of navigable waterways or in their immediate vicinity. Then you should choose a place characterized by not-too-great depths. It is worth getting acquainted with information on wind speed and direction, as well as information on sea currents and the possible freezing of the reservoir in the indicated area. Freezing of the tank and strong sea currents negatively affect the turbine located at sea, accelerating the process of its wear and also complicating the maintenance of the turbines due to the crew’s problems reaching the damaged turbine. After getting acquainted with this data and determining the location of the power plant, you should also think about connecting it to the network located on land.
It is good practice to locate the power plant at such a distance that it does not interfere with the view while not being too far from the shore. It is worth bearing in mind that the greater the distance of the farm from the place of electricity supply, the greater the loss of electricity. The power grid should be placed at the bottom of the water body in a way that does not threaten or interfere with water traffic. Power cables must not cross shipping routes or access ports where vessels with a large draught are moored. In addition, it should be noted that power cables are not permanently located on the bottom. They are constantly working and moving, which is why an important element is to locate them away from layers of peat and heavy silt, which cause limited possibilities of work and movement of the power cable, which in turn may lead to the adverse phenomenon of overheating and thus the loss of a large amount of energy obtained, and later to the destruction of the transmission infrastructure. But to find out what lies at the bottom, you need to do detailed research on the pre-selected terrain. The initial phase consists of an initial data set from a multibeam sonar. They provide depth information with a high accuracy of up to 10 cm. In addition, multibeam sonar data helps to image wrecks or other large obstacles at the bottom in three dimensions.
The next important step is to scan the area with side-scan sonar. This device allows you to quickly image the surface of the bottom and determine the dimensions of obstacles lying on the bottom. An important element is also to determine the height of the wreck or obstacle based on the simple dependence of similar triangles. The next step is to conduct sub-bottom profiler research and obtain data on geological layers under the top layer of the bottom. At the same time, when conducting measurements on water, people in the office dealing with data processing (i.e., processing) process the collected data. After preliminary geological surveys, geological research is carried out properly, i.e., by collecting appropriate soil samples from boreholes called Vibrocore made with a vibroprobe. These wells are used to compare data from the sub-bottom profiler and determine the appropriate bottom parameters.
The last and most time-consuming study is to scan the seabed for metal elements with a magnetometer. This is important because the main goal of such a study is to find unexploded ordnance, the so-called UXO (unexploded ordance). After carrying out all tests, they are processed, the process of data verification takes place, changes in the route of transmission cables and/or wind farms take place, and as a last resort, if it is impossible to avoid obstacles, the bottom cleaning process takes place by professional diving teams, whose task is to remove permanently deposited elements such as unexploded ordnance, wrecks, and boulders. After carrying out the above operations, piling of the foundations takes place, which can take place only during a period that does not interfere with the movement and reproduction of fish and marine mammals. After the foundation is laid, the mast is embedded, and on it is the nacelle with rotors. When placing structures on water, accurate positioning is important to avoid problems with inaccurate or non-horizontal placement of the Wind Power Plant.

6.2. Analysis of the Human and Equipment Resources Needed to Perform the Research

Nowadays, the costs of building wind farms both onshore and offshore have decreased significantly compared to the same construction five years ago. Which does not change the fact that they are still at a high level. In the case of a power plant built on land, prices oscillate around EUR 1.4 million per 1 MW of energy obtained, while at sea, the price is EUR 1.1 million higher and amounts to an average of EUR 2.5 million. The largest share of costs is absorbed by the turbines themselves, which account for about 80% of the total construction costs.
Other costs include measurements and surveys of the seabed, the project of building a wind farm, the costs of constructing, laying, and connecting the necessary transmission infrastructure, and the final location of wind turbines, together with the location of foundations or foundation structures ensuring a stable location of the wind power plant, regardless of weather conditions and factors such as sea currents or storms [55].
The human and equipment resources used in the measurements shall include all the people and equipment that were used in the conduct of the research. Considering the human resources needed to conduct the research, it was assumed that people working on the ship work two shifts each, while people involved in data post-processing work on one 12 h shift.
In the case of research works, which consist of both indirect measurements with units equipped with appropriate measuring devices as well as direct measurements with the use of diving teams, approx. 145 people will be needed. The forecast number of working days is, depending on the type of examination:
-
7 days—measurements with the multibeam echo sounder (MBES)—using four measurement teams working in two shifts on two units;
-
15 days—measurements with side sonar towed (SSS)—using two measurement teams working in two shifts on one unit;
-
15 days—sub-bottom profiler (SBP) measurements—using two measurement teams working in two shifts on one unit
-
17 days—magnetometer measurements—using two measurement teams working in two shifts on one unit;
-
30 days—collection of Vibrocore seabed samples—using two measurement teams working in two shifts on one vessel;
-
80 days—data processing—by 25 people involved in data post-processing working on one 12-h shift.
In addition, diving work will be consumed by:
-
15 days—removal of wrecks and other large elements—using two measurement teams working in two shifts on one unit;
-
30 days—removal of boulders and stones—using two measurement teams working in two shifts on one unit;
-
45 days—removal of probable mines/unexploded ordnance—using two measurement teams working in two shifts on one unit.

6.3. Hardware Resources

The hardware resources consist of measuring units as well as measuring devices. Units are adapted to different purposes and tasks. The barge can be used both for collecting Vibrocore samples and for diving work involving the removal of unexploded ordnance from the bottom and other structures. The measuring unit should be adapted to carry out measurements with any device, from a multi-beam sonar to a magnetometer. The dredge should be strictly adapted to remove stones, sediments, and silt in order to level the seabed for the location of foundations for a wind power plant.
2X barge (dredge) with crane + drilling rig—2X Surveyboat—2X Dredge—2X Multibeam Sonar—1X Towed Side Sonar—1X Sub—bottom profiler—1X Magnetometer—30X computer −3*30X software (i.e., multibeam sonar software “Autoclean”, sonar and sub-bottom profiler software “SonarWizz”, GIS program for presenting results “ArcGis”)—20X container for storing unexploded ordnance (reusable).

7. Applications

The cost estimate for research preceding the construction of an offshore wind farm (Appendix A, Table A1) includes all the work and equipment, including:
-
Preliminary design work consisting of the delineation of the wind farm site and the route of the underwater transmission line, taking into account ship traffic, sea currents, wind, tides, etc., as well as final design work consisting of the approval of the demarcated area and transmission route or a change of any of the factors due to too high costs of removing wrecks or an inconvenient route of the transmission line, cost EUR 2,016,000;
-
Research work consisting of a complete scan of the study area in order to obtain information about the depths of the water reservoir in the designated places, about potential objects at the bottom, about the dimensions of objects located on the bottom, about potentially dangerous objects exhibiting ferromagnetic properties, which may turn out to be unexploded ordnance or underwater mines, and about accurate soil sampling to check the tectonic stability of the soil and prevent overheating of the transmission line, the total cost is EUR 3,326,080;
-
Diving and further research work involving the removal of disturbing objects, boulders, stones, unexploded ordnance, wrecks, structures, etc. Total cost: EUR 2,146,500;
-
Construction works consist of piling foundations, embedding masts of wind turbines, installing nacelles, blades, and wind turbine accessories, laying and connecting transmission cables and transformers (both on land and on water), obtaining the necessary permits for commissioning the construction, and connecting the power plant to the network. Total cost: EUR 11,868,100;
-
The cost of research and diving equipment is EUR 611,000;
-
The costs of the measuring units were calculated as a flat rental, with fuel for each working day oscillating around EUR 400 per unit per day.
In addition, the cost estimate included calculations regarding the purchase and final installation of 30 wind turbines with connection infrastructure, which consumed as much as EUR 451,950,000.

8. Summary

Summing up the whole work, it can be concluded that conducting research on the seabed is extremely important to the safe and environmentally appropriate location of a potential wind farm in the right place. At the beginning, it is recommended to roughly select a place that is not interfering with water transport, is relatively close to land, and has appropriate depths. Then, based on the data collected in the past (if any), you should choose more accurately the location of the farm. After making a rough selection, you need to proceed with the proper measurements. It is best to first proceed to measurements with a multi-beam echo sounder, which will show us the appearance of the bottom in the form of a cloud of points and depth in each place with an accuracy of up to 10 cm. The next step is measurements with scanned side sonar, whose task is to visualize the examined area in terms of any objects, wrecks, or stones that are a kind of obstacle during construction. The next step is to search the area of the planned construction with a magnetometer in order to find all metal elements or objects that need to be removed from the bottom. Their extraction is carried out by a special group of divers with sappers. This is an important measurement because any metal object at the bottom can be a potential bomb or mine that has not exploded in the past, and in the event of any interference, it may turn out to be a huge threat. The last measurement is to conduct sub-bottom profiler studies of sub-bottom sediments in order to check whether the geological layers hidden under the outer layer of silt will allow for permanent foundations and ensure safe transmission of large amounts of electricity through an underwater electric line. In addition, in order to verify bottom sediments, wells are carried out with a vibro probe, both at the construction site of the wind farm and at the site of the planned underwater transmission line, to clearly determine whether the geological layer allows such an investment to be carried out. In case of any difficulties, whether in terms of geological, natural, transport, etc., additional measurements should be carried out at the next potential site.

Author Contributions

Conceptualization, C.B., A.G. and Y.B.; methodology, P.S., M.R. and K.W.; formal analysis, C.B., A.G. and P.S.; resources, C.B. and M.R.; data curation, K.W. and A.Ł.; writing—original draft preparation, C.B., A.G., P.S. and M.R.; writing—review and editing, M.R., K.W. and Y.B.; visualization, C.B., E.G. and A.Ł. All authors have read and agreed to the published version of the manuscript.

Funding

This study was carried out as part of the project: Construction of wind farms in the Baltic Sea.

Informed Consent Statement

Informed consent was obtained from all subjects involved in the study.

Data Availability Statement

Data sharing is not applicable.

Acknowledgments

The authors would like to thank all the quality professionals who helped with the research.

Conflicts of Interest

The authors declare no conflict of interest.

Appendix A

Table A1. Cost Estimates for Studies Preceding the Construction of an Offshore Windfarm.
NumberDescriptionLabour—Number of People **Man-HourDaily CostsMaterialsPriceEquipment *PriceDaily TotalTotal * DaysProjected Number of DaysOne-Time Cost
1.data analysis and design402800 €67,200 €sea charts, flights500 €-=67,200 €2,016,000 €303000 €
environmental data2500 €
2.research91------82,920 €3,326,080 €-
2.1MBES measurement16960 €23,040 €--MBES x2150,000 €23,840 €166,880 €7150,000 €
ship x2800 €
2.2SSS measurement8480 €11,520 €--SSS x1100,00011,920 €178,800 €15100,000 €
ship x1400 €
2.3SBP measurement8480 €11,520 €--SBP x155,000 €11,920 €178,800 €1555,000 €
ship x1400 €
2.4magnetometric measurement10600 €14,400 €--magnetometer x175,000 €14,800 €251,600 €1775,000 €
ship x1400 €
2.5vibrocore samples241440 €34,560 €--ship x1400 €2440 €1,110,000 €30-
vibro sounder excavator x1600 €
2.6data processing251500 €18,000 €software x9063,000 €computer x3045,000 €18,000 €1,440,000 €80108,000 €
3.diving work54----==84,360 €2,146,500 €--
3.1removal of wrecks301800 €43,200 €--tug x41300 €45,200 €678,000 €15-
crane on board x1700 €
3.2removal of stones12720 €17,280 €--dredge x22300 €19,580 €587,400 €30-
3.3removal of unexploded ordnance12720 €17,280 €containers for unexploded ordnance x2070,000 €dredge x22300 €19,580 €881,100 €45120,000 €
winch on the ship x250,000 €
4construction100------155,800 €11,868,100 €--
4.1piling of foundations241440 €34,560 €connecting cylinders7000 €drilling rig x1400 €35,760 €3,218,400 €9042,000,000 €
reinforcement so-called monopiles35,000 €ship x2800 €
4.2erecting masts241440 €34,560 €mastx3090,000 €ship with crane x33000 €35,560 €3,380,400 €9090,000,000 €
4.3installation of gondolas and accessories241440 €34,560 €carrycot + shovels + x30 attachments300,000,000 €ship with crane x33000 €35,560 €3,380,400 €90300,000,000 €
4.4location of transmission cables12720 €17,280 €cablex39319,530,000 €dredge x22300 €19,580 €1,762,200 €9019,530,000 €
4.5transformer network setting12720 €17,280 €transformer plant x3220,000 €vessel with crane x22000 €19,280 €96,400 €5220,000 €
4.6network connection4240 €5760 €cost of permits and connections200,000 €tools300 €6060 €30,300 €5200,000 €
* for ships, dredgers and cranes, average operating and fuel costs per day (1 man/day).labor cost€19,356,680Total cost471,917,680 €
** in the case of humans, the cost of 1 man-hour.cost of fittings608 000 PLN
* cable price approx. 80 $ per meter.amount€19,964,680
** Siemens Gamesa/SG 6.0–154/30 × 6 MW.
Source: own elaboration.

References

  1. Gutkowski, B.; Barmański, M.; Witoński, M. Possibilities of Offshore Energy Development in the Baltic Sea, “Czysta Energia”; 2009; No. 1. Available online: http://yadda.icm.edu.pl/baztech/element/bwmeta1.element.baztech-year-1643-126X-czysta_energia-2009 (accessed on 10 May 2023).
  2. Czyżak, P.; Sikorski, M.; Wrona, A. Wind in Your Sails. The 10H Principle and the Potential of Onshore Wind Energy in Poland; Instrat Policy Note 01/2021. 2021, p. 3. Available online: https://instrat.pl/wp-content/uploads/2021/05/Instrat-Wiatr-w-z%CC%87agle.pdf (accessed on 15 May 2023).
  3. Global Wind Energy Council. Capturing Green Recovery Opportunities from Wind Power in Developing Economies; Global Wind Energy Council: Brussels, Belgium, 2022; p. 11. [Google Scholar]
  4. Soliński, I.; Soliński, B.; Solińska, M. The role and significance of wind energy in the renewable energy sector. Polityka Energetyczna 2008, 11, 1. [Google Scholar]
  5. Bukowski, M.; Gąska, J.; Kosuń, M.; Śniegocki, A. The Impact of Wind Energy on the Polish Labour Market; Warsaw Institute of Economic Studies: Warsaw, Poland, 2015. [Google Scholar]
  6. McKinsey & Company. Development of Offshore Wind Energy in Poland. Prospects and Assessment of the Impact on the Local Economy; McKinsey & Company: New York, NY, USA, 2016. [Google Scholar]
  7. Streimikiene, D. Comparative Assessment of Energy Poverty in Baltic States and Visegrad Countries. Montenegrin J. Econ. 2023, 19, 185–194. [Google Scholar] [CrossRef]
  8. Streimikiene, D.; Mikalauskiene, A. Comparative assessment of renewable energy development in Baltic States. Montenegrin J. Econ. 2022, 17, 95–106. [Google Scholar] [CrossRef]
  9. Jones, S.L.; Petrel, A. Sub-Basin Marine Survey (GA0335/SOL5463) SubBottom Profiler Processing Report; Australian Ocean Data Network: Hobart, Australia, 2014. [Google Scholar]
  10. O’Kelly, B.; Arshad, M. Offshore wind turbine foundations–analysis and design. In Offshore Wind Farms; Elsevier: Amsterdam, The Netherlands, 2016; pp. 589–610. [Google Scholar]
  11. Štreimikienė, D. Externalities of power generation in Visegrad countries and their integration through support of renewables. Econ. Sociol. 2021, 14, 89–102. [Google Scholar] [CrossRef]
  12. Streimikiene, D. Renewable energy technologies in households: Challenges and low carbon energy transition justice. Econ. Sociol. 2022, 15, 108–120. [Google Scholar] [CrossRef]
  13. Streimikiene, D. Ranking of Baltic States on progress towards the main energy security goals of European energy union strategy. J. Int. Stud. 2020, 13, 24–37. [Google Scholar] [CrossRef]
  14. Musial, W.; Spitsen, P.; Beiter, P.; Duffy, P.; Marquis, M.; Cooperman, A.; Hammond, R.; Shields, M. Offshore Wind Market Report: 2021 Edition; Department of Energy: Washington, DC, USA, 2021.
  15. Da, Z.; Xiliang, Z.; Jiankun, H.; Qimin, C. Offshore wind energy development in China: Current status and future perspective. Renew. Sustain. Energy Rev. 2011, 15, 4673–4684. [Google Scholar] [CrossRef]
  16. Janekova, J.; Fabianova, J.; Rosova, A. Environmental and economic aspects in decision making of the investment project “wind park”. Pol. J. Manag. Stud. 2016, 13, 90–100. [Google Scholar] [CrossRef]
  17. Bayati, I.; Facchinetti, A.; Fontanella, A.; Giberti, H.; Belloli, M. A wind tunnel/HIL setup for integrated tests of Floating Offshore Wind Turbines. J. Phys. Conf. Ser. 2018, 1037, 052025. [Google Scholar] [CrossRef]
  18. Bayati, I.; Belloli, M.; Facchinetti, A.; Giberti, H. A 6DOF/Hil setup for wind tunnel hybrid tests on a 1/75 scale model of a 10 MW floating wind turbine. In Proceedings of the 23rd Conference of the Italian Association of Theoretical and Applied Mechanics, Salerno, Italy, 4–7 September 2017; Centro Servizi d’Ateneo Srl: Cagliari, Italy, 2017; Volume 4, pp. 611–624. [Google Scholar]
  19. Stewart, G.M.; Lackner, M.A.; Robertson, A.; Jonkman, J.; Goupee, A.J. Calibration and validation of a FAST floating wind turbine model of the DeepCwind scaled tension-leg platform. In Proceedings of the 22nd International Offshore and Polar Engineering Conference, Rhodes, Greece, 17–22 June 2012. [Google Scholar]
  20. Jasińska-Biliczak, A. Smart-City Citizen Engagement: The Answer to Energy Savings in an Economic Crisis? Energies 2022, 15, 8828. [Google Scholar] [CrossRef]
  21. Androniceanu, A.; Georgescu, I.; Dobrin, C.; Dragulanescu, I.V. Multifactorial components analysis of the renewable energy sector in the oecd countries and managerial implications. Pol. J. Manag. Stud. 2020, 22, 36–49. [Google Scholar] [CrossRef]
  22. Choe, D.E.; Kim, H.C.; Kim, M.H. Sequence-based modeling of deep learning with LSTM and GRU networks for structural damage detection of floating offshore wind turbine blades. Renew. Energy 2021, 174, 218–235. [Google Scholar] [CrossRef]
  23. Chen, H.; Liu, H.; Chu, X.; Liu, Q.; Xue, D. Anomaly detection and critical SCADA parameters identification for wind turbines based on LSTM-AE neural network. Renew. Energy 2021, 172, 829–840. [Google Scholar] [CrossRef]
  24. IEC 61400-3-1:2019; Design Requirements for Offshore Wind Turbines. International Electrotechnical Commission: Geneva, Switzerland, 2009.
  25. Korovkin, K.; Dulebenets, E.; Bezrukovs, M.; Zikmanis, A.; Blumberga, J. Techno-economic assessment of offshore wind energy development in the Baltic Sea. Renew. Energy 2022, 184, 711–722. [Google Scholar] [CrossRef]
  26. Zikmanis, A.; Bezrukovs, M.; Korovkin, K.; Blumberga, J. Assessing the environmental impact of offshore wind energy in the Baltic Sea. J. Environ. Manag. 2021, 298, 113558. [Google Scholar] [CrossRef]
  27. Shafiei, A.; Fuso Nerini, F.; Möller, T. Power-to-gas energy storage for offshore wind farms in the Baltic Sea. J. Energy Storage 2022, 47, 103367. [Google Scholar]
  28. Jiménez-Arroyo, M.P.; Ortigueira, M.P.; Burgos-Montes, J.C. The potential of floating wind energy in the Baltic Sea. J. Renew. Sustain. Energy 2022, 14, 054704. [Google Scholar] [CrossRef]
  29. Bezrukovs, M.; Korovkin, K.; Zikmanis, A.; Blumberga, J. Socio-economic impacts of offshore wind energy development in the Baltic Sea. Energy Policy 2022, 161, 163–173. [Google Scholar]
  30. Jonkman, J.M. Dynamics of offshore floating wind turbines—Model development and verification. Wind. Energy Int. J. Prog. Appl. Wind. Power Convers. Technol. 2009, 12, 459–492. [Google Scholar] [CrossRef]
  31. Barooni, M.; Ali, N.A.; Ashuri, T. An open-source comprehensive numerical model for dynamic response and loads analysis of floating offshore wind turbines. Energy 2018, 154, 442–454. [Google Scholar] [CrossRef]
  32. Johlas, H.M.; Martínez-Tossas, L.A.; Churchfield, M.J.; Lackner, M.A.; Schmidt, D.P. Floating platform effects on power generation in spar and semisubmersible wind turbines. Wind Energy 2021, 24, 901–916. [Google Scholar] [CrossRef]
  33. Grządel, A. Single-beam sonar in hydrographic measurements. Prz. Mor. 2006, 4, 11–28. Available online: https://scholar.google.pl/scholar?hl=pl&as_sdt=0,5&cluster=14351008529271935887 (accessed on 15 May 2023).
  34. Shah, K.A.; Meng, F.; Li, Y.; Nagamune, R.; Zhou, Y.; Rhine, Z.; Jiang, Z. A synthesis of feasible control methods for floating offshore wind turbine system dynamics. Renew. Sustain. Energy Rev. 2021, 151, 111525. [Google Scholar] [CrossRef]
  35. Grządel, A.; Nowak, D.; Snake, M. Detection and Location of Underwater Objects with Side Sonar as an Element of Navigation Safety Buses: Technology, Operation, Transport Systems, No 1/2017. pp. 42–47. Available online: http://yadda.icm.edu.pl/baztech/element/bwmeta1.element.baztech-f21758d0-3e0d-4f67-bb6e-af272297fac1 (accessed on 15 May 2023).
  36. Kim, B.; Yu, S.C. Imaging sonar based real-time underwater object detection utilizing AdaBoost method. In Proceedings of the 2017 IEEE Underwater Technology (UT), Busan, Republic of Korea, 21–24 February 2017; pp. 1–5. [Google Scholar] [CrossRef]
  37. Valdenegro, M. Object recognition in forward-looking sonar images with Convolutional Neural Networks. In Proceedings of the OCEANS 2016 MTS/IEEE Monterey, Monterey, CA, USA, 19–23 September 2016; pp. 1–6. [Google Scholar] [CrossRef]
  38. Rajkoomar, M.; Marimuthu, F.; Naicker, N.; Mvunabandi, J.D. A meta-analysis of the economic impact of carbon emissions in Africa. Environ. Econ. 2022, 13, 89–100. [Google Scholar] [CrossRef]
  39. Uijlings, J.; Sande, K.; Gevers, T.; Smeulders, A. Selective Search for Object Recognition. Int. J. Comput. Vis. 2013, 104, 154–171. [Google Scholar] [CrossRef]
  40. Liljeback, P.; Haugstuen, I.U.; Pettersen, K.Y. Path following control of planar snake robots using a cascaded approach. IEEE Trans. Control. Syst. Technol. 2012, 20, 111–126. [Google Scholar]
  41. Zhang, G.Q.; Zhang, X.K. Concise robust adaptive pathfollowing control of underactuated ships using DSC and MLP. IEEE J. Ocean. Eng. 2014, 39, 685–694. [Google Scholar] [CrossRef]
  42. McKay, J.; Gerg, I.; Monga, V.; Raj, R. What’s Mine is Yours: Pretrained CNNs for Limited Training Sonar ATR. In Proceedings of the OCEANS 2017—Anchorage, Anchorage, AK, USA, 18–21 September 2017. [Google Scholar]
  43. Alshalali, T.; Josyula, D. Fine-Tuning of Pre-Trained Deep Learning Models with Extreme Learning Machine. In Proceedings of the 2018 International Conference on Computational Science and Computational Intelligence (CSCI), Las Vegas, NV, USA, 12–14 December 2018; pp. 469–473. [Google Scholar] [CrossRef]
  44. Liu, W.; Anguelov, D.; Erhan, D.; Szegedy, C.; Reed, S.; Fu, C.Y.; Berg, A. SSD: Single Shot MultiBox Detector. In Proceedings of the Computer Vision–ECCV 2016: 14th European Conference, Amsterdam, The Netherlands, 11–14 October 2016; Springer: Cham, Swizerland, 2016; Volume 9905, pp. 21–37. [Google Scholar]
  45. Hu, G.; Wang, K.; Peng, Y.; Qiu, M.; Shi, J.; Liu, L. Deep Learning Methods for Underwater Target Feature Extraction and Recognition. Comput. Intell. Neurosci. 2018, 2018, 1214301. [Google Scholar] [CrossRef]
  46. Cubuk, E.D.; Zoph, B.; Mane, D.; Vasudevan, V.; Le, Q.V. AutoAugment: Learning Augmentation Policies from Data. arXiv 2018, arXiv:1805.09501. [Google Scholar]
  47. Tontini, F.C.; Carmisciano, C.; Ciminale, M.; Grassi, M.; Lusiani, P.; Monti, S.; Stefanelli, P. High resolution Marine magneticsurveys for searching underwater cultural resources. Ann. Geophys. 2006, 49, 1167–1168. [Google Scholar]
  48. Brzezińska, A.; Cichowska, D.; Gajewski, Ł.; Konieczny, W.; Kubacka, M.; Nowak, J. Report on Marine Magnetometric Measurements in the Gdańsk Deep Region; Department of Operational Oceanography, Maritime Institute in Gdańsk: Gdańsk, Poland, 2012. [Google Scholar]
  49. Müller, S.; Wunderlich, J.; Hümbs, P.; Erdmann, S. High-Resolution Sub- Bottom Profiling for the “Shallow Survey” Common Data Set using the Parametric Echosounder SES-2000. In Proceedings of the Shallow Survey 2005 4th International Conference, Plymouth, UK, 12–15 September 2005; pp. 1–4. [Google Scholar]
  50. Sohn, S.I.; Oh, J.H.; Lee, Y.S. Design of a full-cellpowered catamaran-type unmanned surface vehicle. IEEE J. Ocean. Eng. 2015, 40, 388–396. [Google Scholar] [CrossRef]
  51. Li, J.H.; Lee, P.M.; Jun, B.H.; Lim, Y.K. Point-to-point navigation of underactuated ships. Automatica 2008, 44, 3201–3205. [Google Scholar] [CrossRef]
  52. Xu, H.T.; Soares, C.G. Vector field path following for surface marine vessel and parameter identification based on LS-SVM. Ocean. Eng. 2016, 113, 151–161. [Google Scholar] [CrossRef]
  53. Perera, A.D.; Gunathilaka, M.D.E.K. Rapid Assessment Survey Using Side Scan Sonar: International Obligations and Role of Hydrography in Ensuring Safety of Navigation–Case Study of the Aftermath of MV X-Press Pearl Incident. J. Geospat. Surv. 2022, 2, 7–10. [Google Scholar] [CrossRef]
  54. Davis, K.J.; Vianna, G.M.S.; Meeuwig, J.J.; Meekan, M.; Pannell, D. Estimating the economic benefits and costs of highly-protected marine protected areas. Ecosphere 2019, 10, e02879. [Google Scholar] [CrossRef]
  55. Medeiros, P.R.; Souza, A.T.; Ilarri, M.I. Habitat use and behavioral ecology of the juveniles of two sympatric damselfishes (Actinopterygii: Pomacentridae) in the south-western Atlantic Ocean. J. Fish Biol. 2010, 77, 1599–1615. [Google Scholar] [CrossRef] [PubMed]
  56. Zoph, B.; Cubuk, E.D.; Ghiasi, G.; Lin, T.Y.; Shlens, J.; Le, Q.V. Learning Data Augmentation Strategies for Object Detection. arXiv 2019, arXiv:1906.11172. [Google Scholar]
Figure 1. Measurement area. Source: Own elaboration.
Energies 16 06088 g001
Figure 2. Stages of seabed exploration for wind turbines. Source: Own elaboration.
Energies 16 06088 g002
Figure 3. Examples of device offsets. Source: own elaboration.
Energies 16 06088 g003
Figure 4. AutoClean menu overview. Source: own elaboration.
Energies 16 06088 g004
Figure 5. Data obtained from the magnetometer. Amplitude of magnetic interactions. Source: own elaboration.
Energies 16 06088 g005
Figure 6. Locational facility. Source: own elaboration.
Energies 16 06088 g006
Figure 7. Obtained data from SBP. Source: own elaboration.
Energies 16 06088 g007
Figure 8. Bottom cross-section map with vibrocore sample. Source: own elaboration.
Energies 16 06088 g008
Disclaimer/Publisher’s Note: The statements, opinions and data contained in all publications are solely those of the individual author(s) and contributor(s) and not of MDPI and/or the editor(s). MDPI and/or the editor(s) disclaim responsibility for any injury to people or property resulting from any ideas, methods, instructions or products referred to in the content.

