Abstract
Urban simulations play an important role on the way to a climate neutral society. To enable early assessment of different energy concepts for urban developments, energy profiles for different building types are needed. This work describes the development and use of a new engineering tool GenSim to quickly and reliably generate energy profiles for urban simulations and early building energy predictions. While GenSim is a standalone tool to create energy profiles for early design assessment, it was developed in the context of urban simulations to primarily support energy efficient urban developments within Germany. Energy engineers quickly embraced the tool due to its simplicity and comprehensible results. The development of the tool was recently switched to open source to enable its usage to a broader audience. In order to foster its development and use, a detailed testing framework has been established to ensure the quality of the results of the tool. The paper includes a detailed validation section to demonstrate the validity of the results compared to a detailed building energy simulation model and actual measured performance data.
1. Introduction
To achieve climate neutral societies, urban scale assessment plays a key role [1]. In this context, urban simulation tools are distinguished as “reliable urban planning tools” [2] and can provide more insights [3] than the assessment of single buildings only. Through the connection of different buildings, building types and building occupancies in the urban context synergies effects are created [4]. Especially for storage systems, the demand plays a significant role and can enable synergy effects at an urban scale. At the scale of a single building, some new technologies are not yet cost effective but become more feasible at an urban scale (e.g., hydrogen generation). In order to perform such urban energy simulations, the energy demand profiles of the buildings in a given district need to be known. At the same time, especially in early design phases, reliable and available data about the buildings in question are spare [5]. In combination with a potentially large number of buildings within an urban district, an efficient software approach is essential to rapidly generate building demand profiles based on the available, limited information about the investigated buildings.
Bourdeau et al. [6] describe three general approaches for building energy consumption modelling:
- Physics-based (white-box)
- Hybrid (grey-box)
- Data-driven (black-box)
Bourdeau et al. conclude that each modelling approach has its strengths and weaknesses, especially data-driven approaches which require enough valid data to produce reasonable modelling output. Considering that only very limited energy data from climate neutral buildings exist, using a data-driven approach does not seem to be useful when trying to push the boundaries towards climate neutral operation of urban districts. Furthermore, physics-based models enable parameter adjustments and sensitivity analysis that are directly related to real-world parameters and control systems. Hence, we selected a mainly physics-based approach by using the EnergyPlus [7] simulation engine. This approach allows us to use current data standards for high efficient buildings, enabling the simulation of climate neutral operating urban districts.
Fernando et al. [8] reviewed physics-based urban modelling tools and identified three heat-balanced driven tools: umi, CityBES and URBANopt. umi is an add-on to a commercial CAD software (Rhino) and does not allow independent generation of energy demand profiles with simple building shapes. CityBES is focused on retrofit scenarios at a city scale [9]. URBANopt was developed as an SDK to simulate the energy performance of low-energy districts [10]. All three tools aim for specialized applications in the urban context. The spatial resolution of all mentioned tools is either at the level of single buildings or at group of buildings, except for umi, which uses floor levels for daylight analysis. TEASER—another well-know urban simulation tool—uses reduced order models representing each building as a single zone and mostly statistical data for defaulting [11]. It is also lacking to provide a graphical visualization of the results. Other similar approaches are mainly based on data (such as [12,13,14]) or combine data with statistics [15]. A detailed literature review by Verwiebe et al. [16] concluded that many existing approaches focus on electric energy demand profiles and that heating demand needs to be considered as well.
Therefore, the authors of this work developed the GenSim tool to enable quick assessment based on a minimum set of input data during an early design stage. GenSim (stands for “Generic Simulation”) is an open source and freely available independent tool. Its spatial resolution allows for simplified automated zoning at the floor level (thus, it is more detailed than previous approaches) and it provides a user-friendly GUI. Furthermore, the physics-based approach with simple building models enables quick processing times and is focused on the German market using German and other standards.
GenSim is based on a generic building model that includes all necessary building features and the necessary parameter templates to create individual building types. In addition to the parametric geometry model itself, users can select a predefined set of standard templates enabling a fast creation of new building type models without the need to perform time-consuming data research. A number of parameter templates for typical building types for Germany were developed. User input must include crucial aspects such as the building’s location and the associated weather data, a simplified geometry model of the building, construction definitions and the designated building function (e.g., residential, office or education). In the following section, an overview of GenSim’s workflow is presented, which includes a detailed description of the model itself along with the input parameters, their default values and the standard building typologies. In addition, a validation based on an existing building block against simulation results from DesignBuilder [17] and measurement data are described. A discussion and conclusion finalise the paper.
2. Materials and Methods
This section describes our methodology to generate energy demand profiles for early urban and early building energy simulations. Considering the highly fluctuating power of renewables in a district level, the time resolution of those energy demand profiles needs to be defined at the same temporal level of granularity (e.g., 15 min intervals). First, we provide an overview of the tool’s processes and workflows, then we discuss the required input data as well as interface details.
2.1. Overview
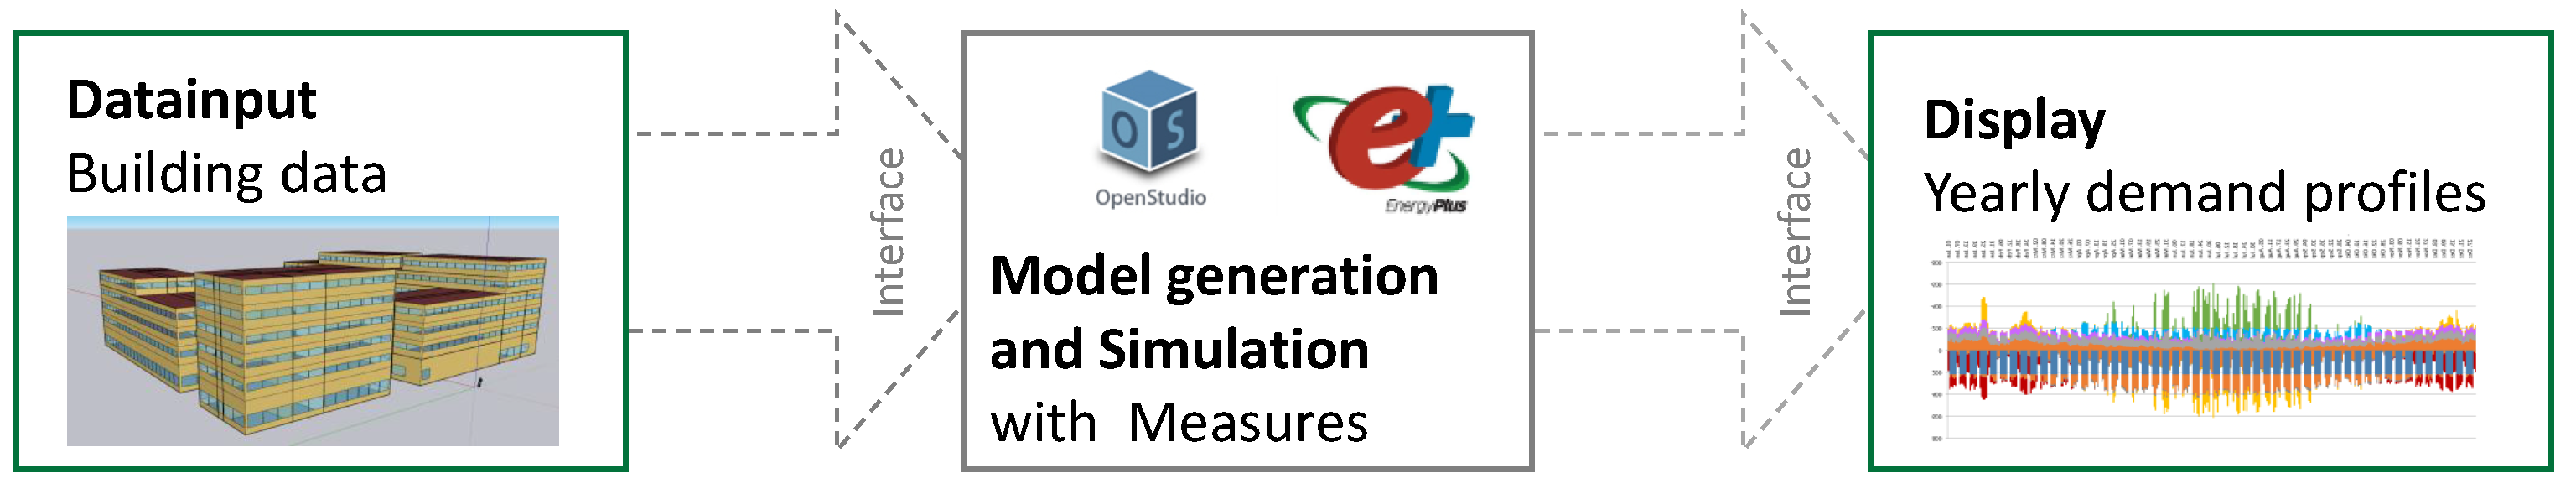
The main focus is on generating yearly energy demand profiles for an urban energy supply simulation. To generate those profiles, GenSim uses the process described in Figure 1, with EnergyPlus acting as an energy performance simulation engine. In addition to EnergyPlus, the OpenStudio SDK [18] is utilised to simplify the implementation via the provided OS API and to use the embedded OS-Measure approach to generate EnergyPlus models quickly. These measures are defined in a way to simplify the data input as much as possible, but still generate accurate and reasonable demand profiles. A measure is written in the programming language Ruby, defines some input parameters and contains executable code that uses these input parameters. Each measure manipulates theOS model to perform the intended function of the measure. For example, a measure could add infiltration objects to each perimeter zone to add the infiltration feature to a given OS model. The OS API provides functionality and data access both on a low and a high level. The low-level API mostly replicates and exposes the EnergyPlus data model parameters, which is useful to allow detailed access to all objects and parameters. The high-level API hides some of the EnergyPlus data model details and has proven to be more stable across different EnergyPlus versions. A simple GUI for GenSim provides the user with basic functions for entering values, creating the EnergyPlus model, running a simulation and reviewing the results.
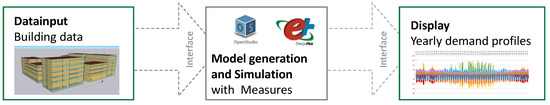
Figure 1.
Overview of the GenSim tool.
2.2. Overall Process
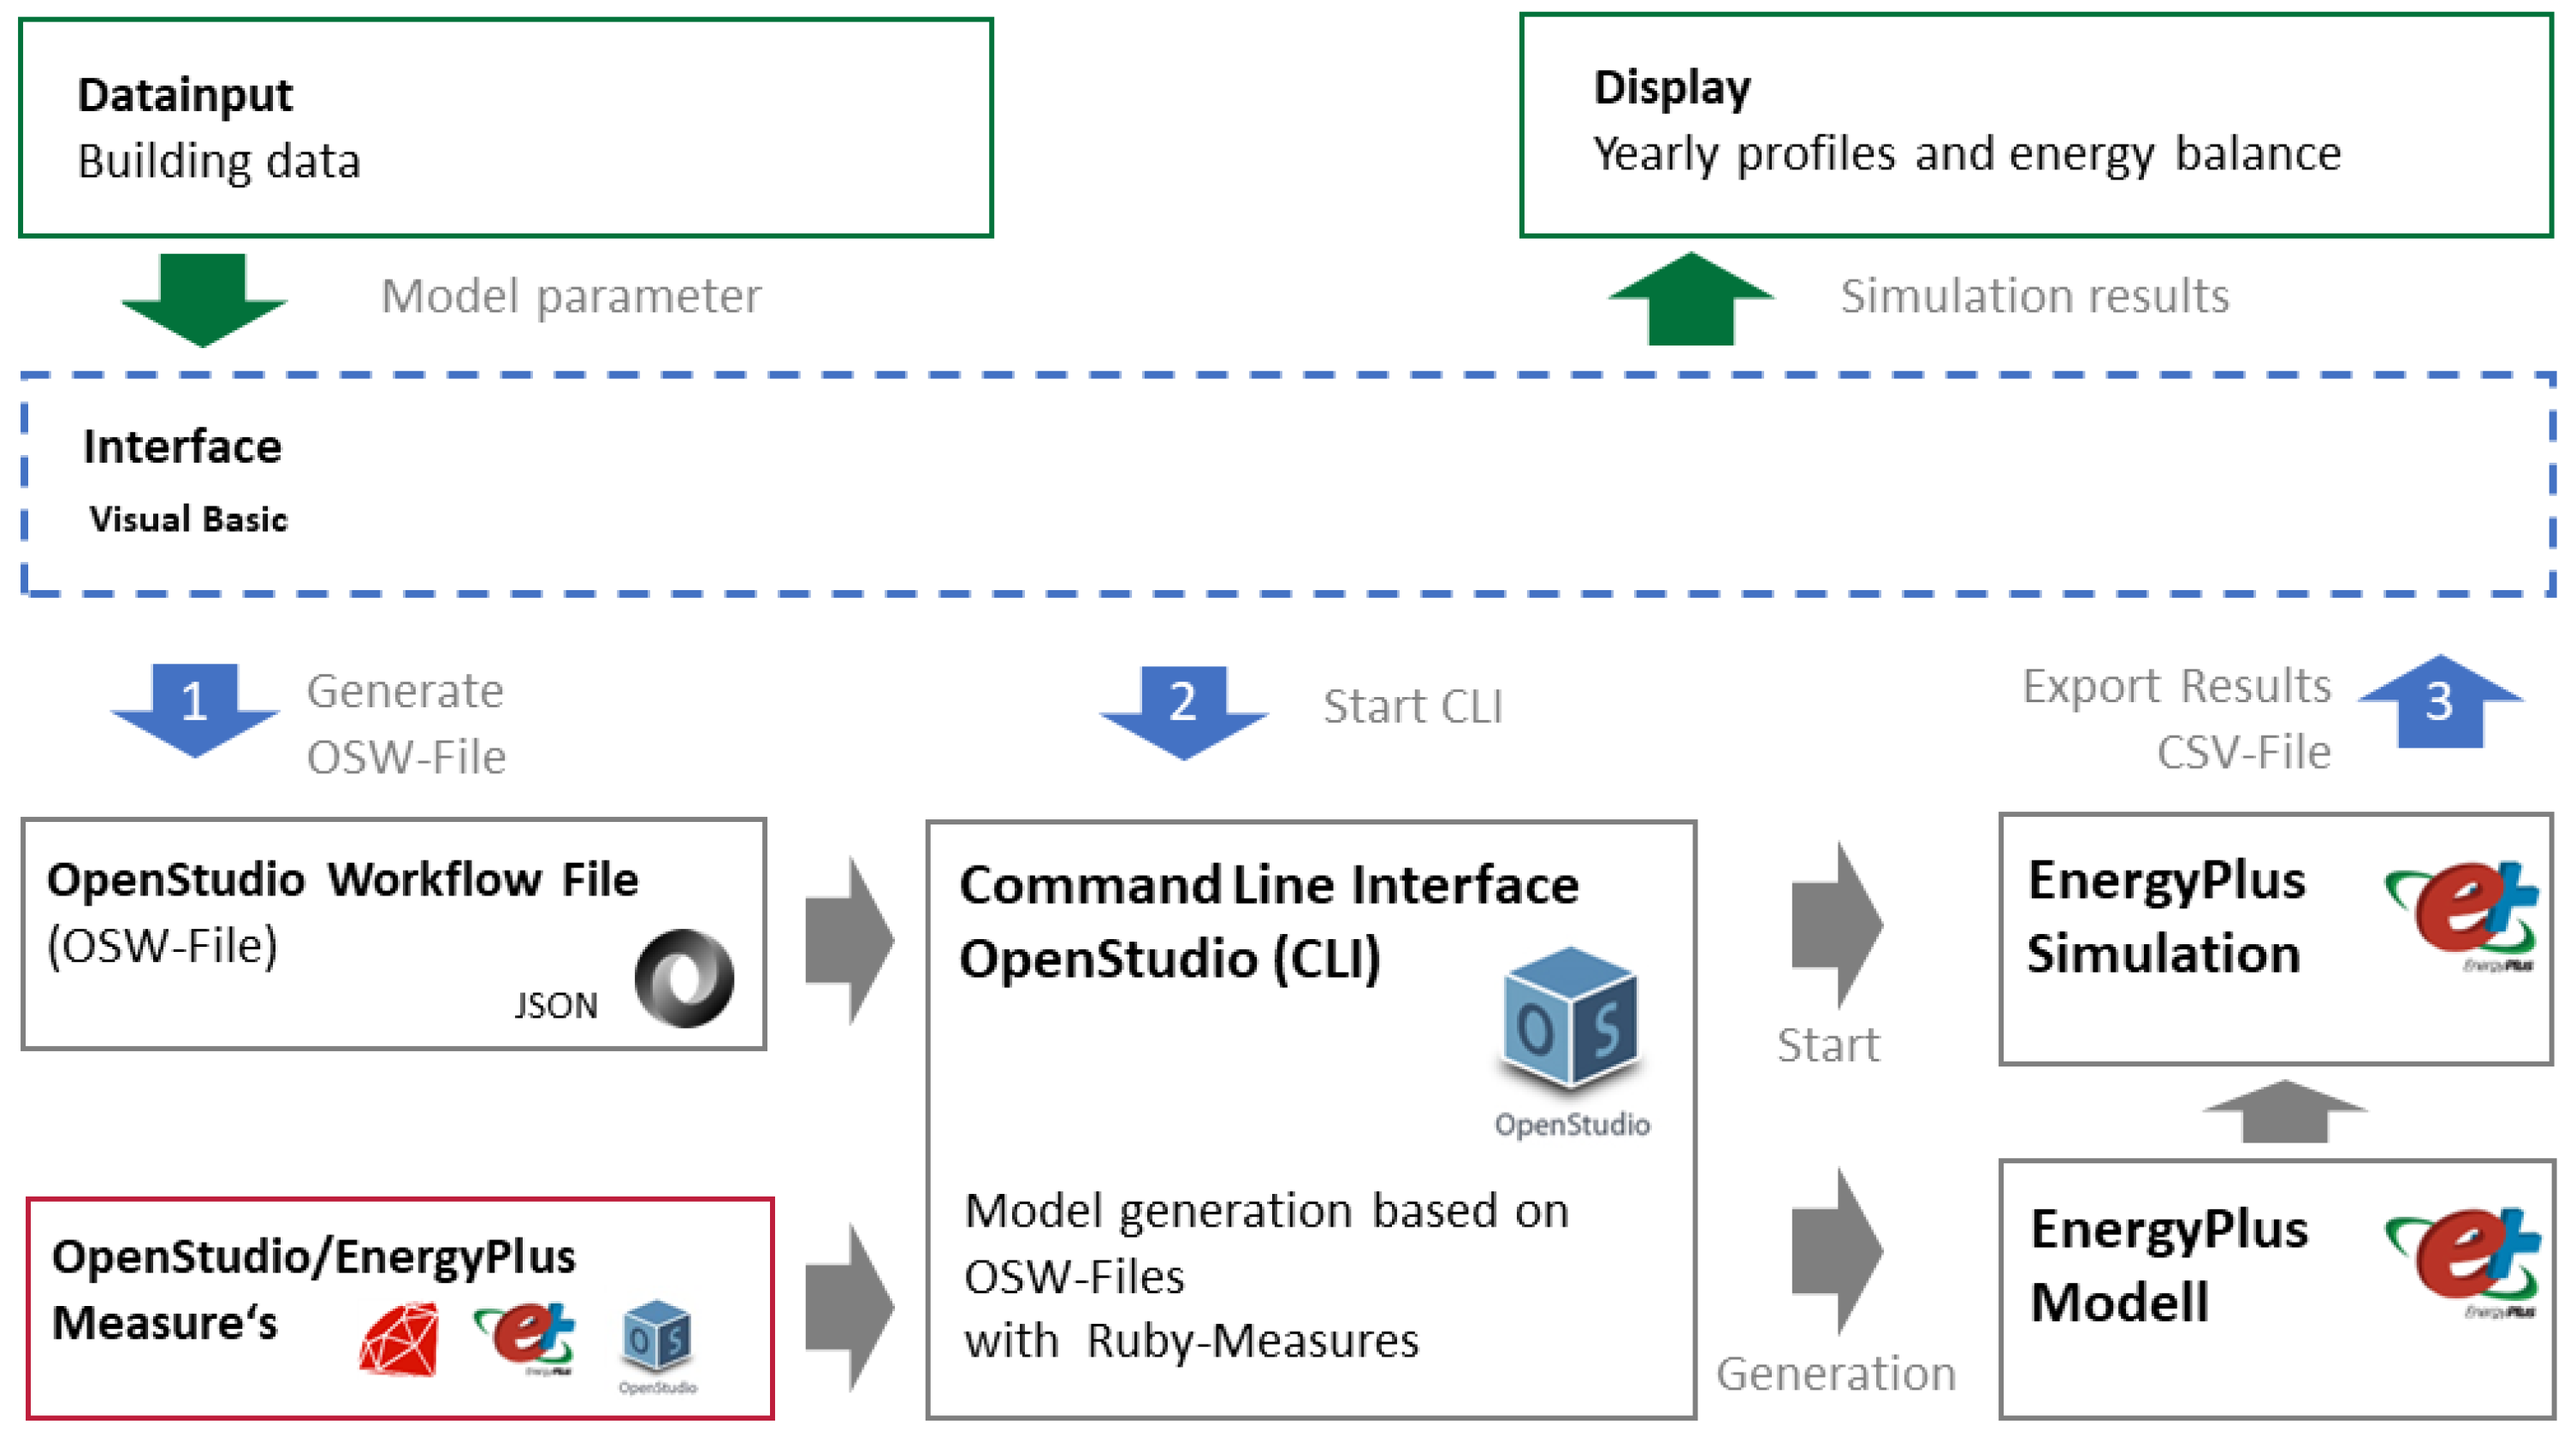
Figure 2 shows more details about this overall process driven by the GUI. The software interface between the GUI to input the data and to view the results and OS is written in VBA. This code collects the input data and generates a JSON (JavaScript Object Notation, a file format for text-based hierarchical key-value store of data.) file. This so-called OSW file contains all of the necessary data about the OS workflow and the parametric EnergyPlus model.
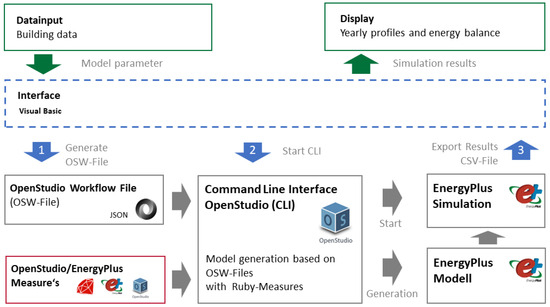
Figure 2.
Overall process of GenSim.
An OSW file defines the OS-measures that are used for the model generation, their order and their parameters. In combination with the measures themselves (Ruby scripts), this OSW file is executed via the OS CLI to generate the EnergyPlus Model and to execute the energy performance simulation. The resulting CSV file exported by EnergyPlus is then processed by theGUI to show the yearly demand profiles in a convenient manner to the user. During the development of GenSim, the inclusion of an annual energy balance into the GUI emerged as a highly valuable addition. This inclusion serves a twofold purpose: it provides users with a comprehensive overview of the building’s energy usage and, simultaneously, acted as an essential debugging feature during the tool’s development phase. Thus, the strategic integration of the annual energy balance into the GUI enhances GenSim’s user-friendliness and functionality.
2.3. Detailed OS-Measures Workflow
This subsection describes the workflow based on the OS-measures in more detail. Overall, there are two major variations in this detailed workflow:
- Simplified geometry generation
- Geometry import via OSM file
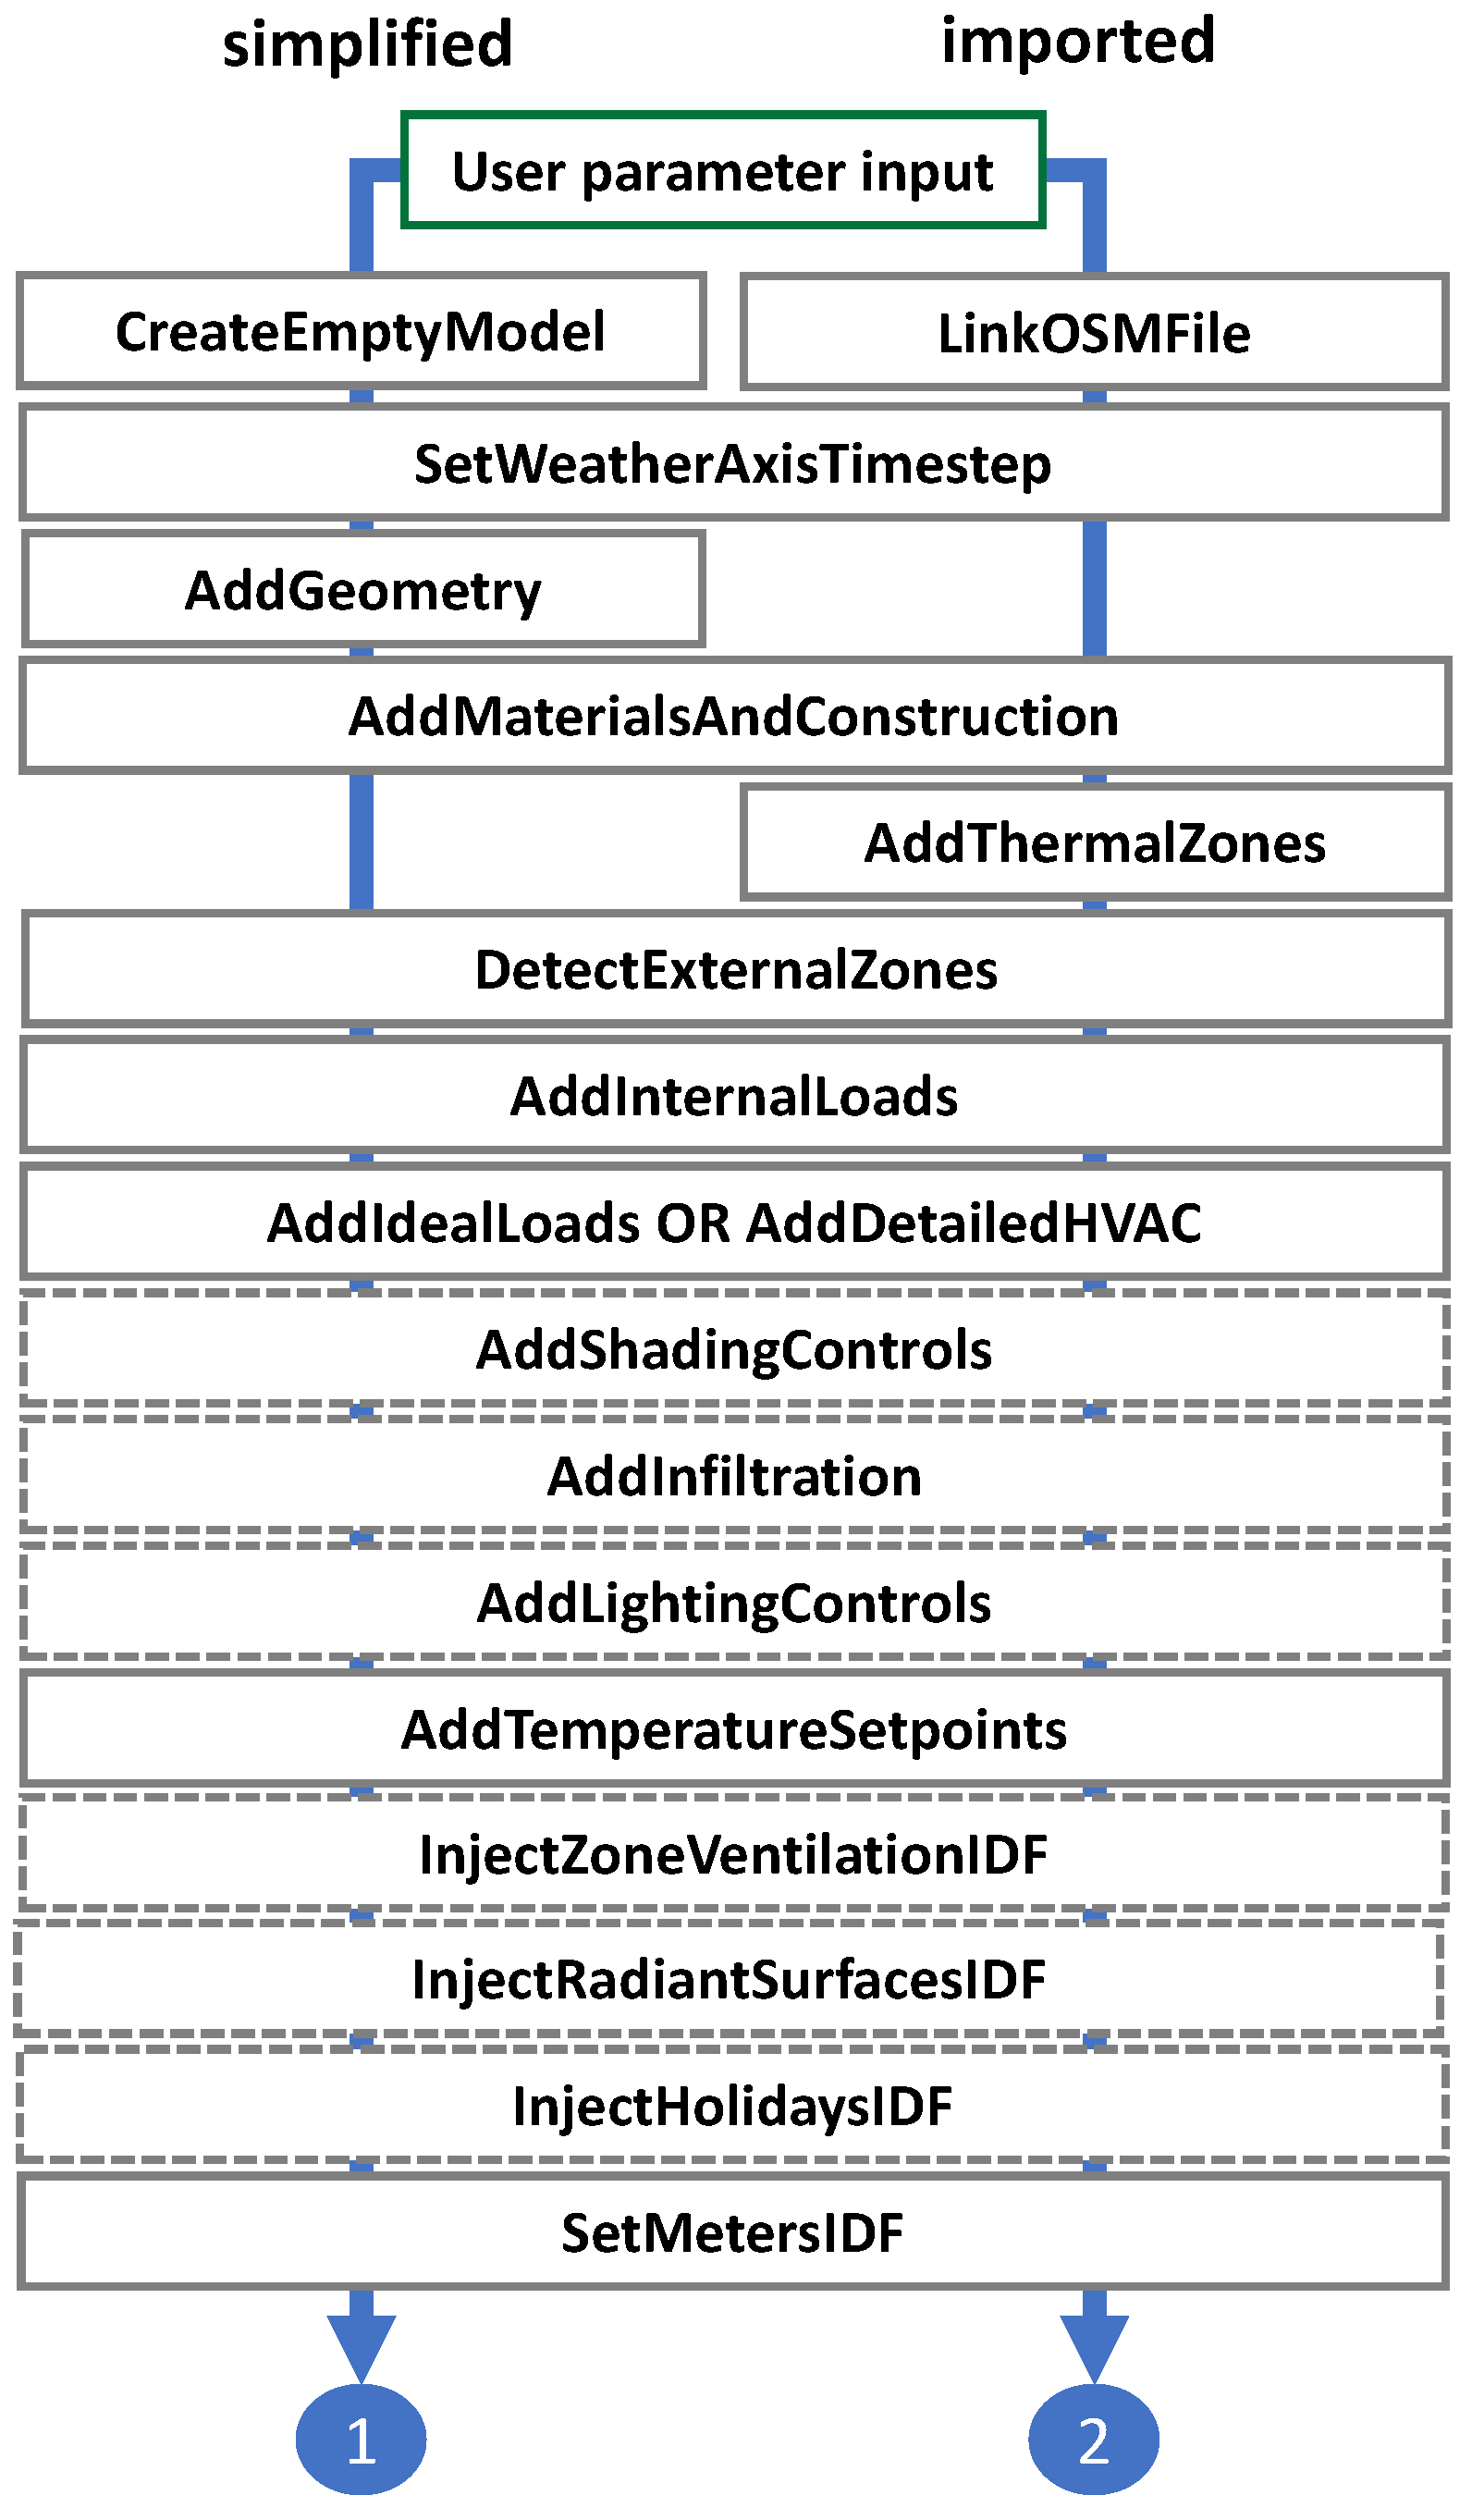
As indicated in Figure 3, the user can either import an existing OSM file (right side) or generate a simplified geometry based on a number of building geometry parameters (left side of the figure). Based on these two options, a number of measures are required while some others are optional.
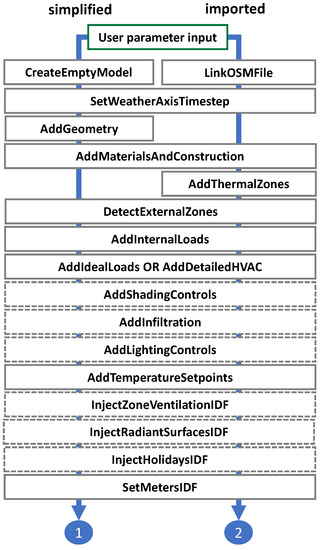
Figure 3.
The detailed workflow inside of GenSim.
Figure 3 shows the details of the OS-measure workflow including all optional measures. As mentioned above, there are two major options. Creating a model from scratch first generates an empty model and then uses the so-called AddGeometry measure to generate simplified geometry (see Section 2.3.1). Alternatively, geometry defined in an OSM file can be used to start the second workflow option. The OSM file needs to contain at least the geometrical information and can also be generated from native EnergyPlus IDF. When using an OSM file, only the geometrical data are used and all other objects are ignored. For both options, the weather file and the timestep are set (SetWeatherAxisTimestep) as well as constructions and materials (AddMaterialsAndConstruction), which are defined. For the imported file, thermal zones need to be generated (AddThermalZones), which is not needed for the simplified workflow since the zones get generated automatically at an earlier stage (AddGeometry). For both workflows, zones with external windows are identified (DetectExternalZones). The workflow continues to add internal loads (AddInternalLoads) to the model. The next step adds HVAC systems (AddDetailedHVAC). In early development stages of the tool, a simplified approach to model HVAC systems was used, but it has been eventually replaced by a more complex one due to its limitations (see Section 2.3.2).
The next three measures are optional and depend on the user input. They can add shading (AddShadingControl), infiltration (AddInfiltration) and lighting control (AddLightingControl). A mandatory measure is to add temperature setpoints (AddTemperatureSetpoints) which define the goals for the conditioning of the zones in the model. While all measures up to this point are using the high-level API, which hides some of the technicalities of EnergyPlus, the remaining measures are directly performed at the EnergyPlus object and parameter level. These include the optional measure to add zone ventilation (InjectZoneVentilationIDF), which is used to model ventilation through open windows. The next measure (InjectRadiantSurfacesIDF) adjusts some parameters in the detailed HVAC scenario that are not available in the high-level API. Prior to the final measure, an optional measure (InjectHolidaysIDF) is for adding holidays to all schedules by defining the actual days in a given year. Finally, the last measure is adding meters (SetMetersIDF) and output variables to trigger the output data that is later displayed in the GUI.
2.3.1. Generation of Simplified Geometry
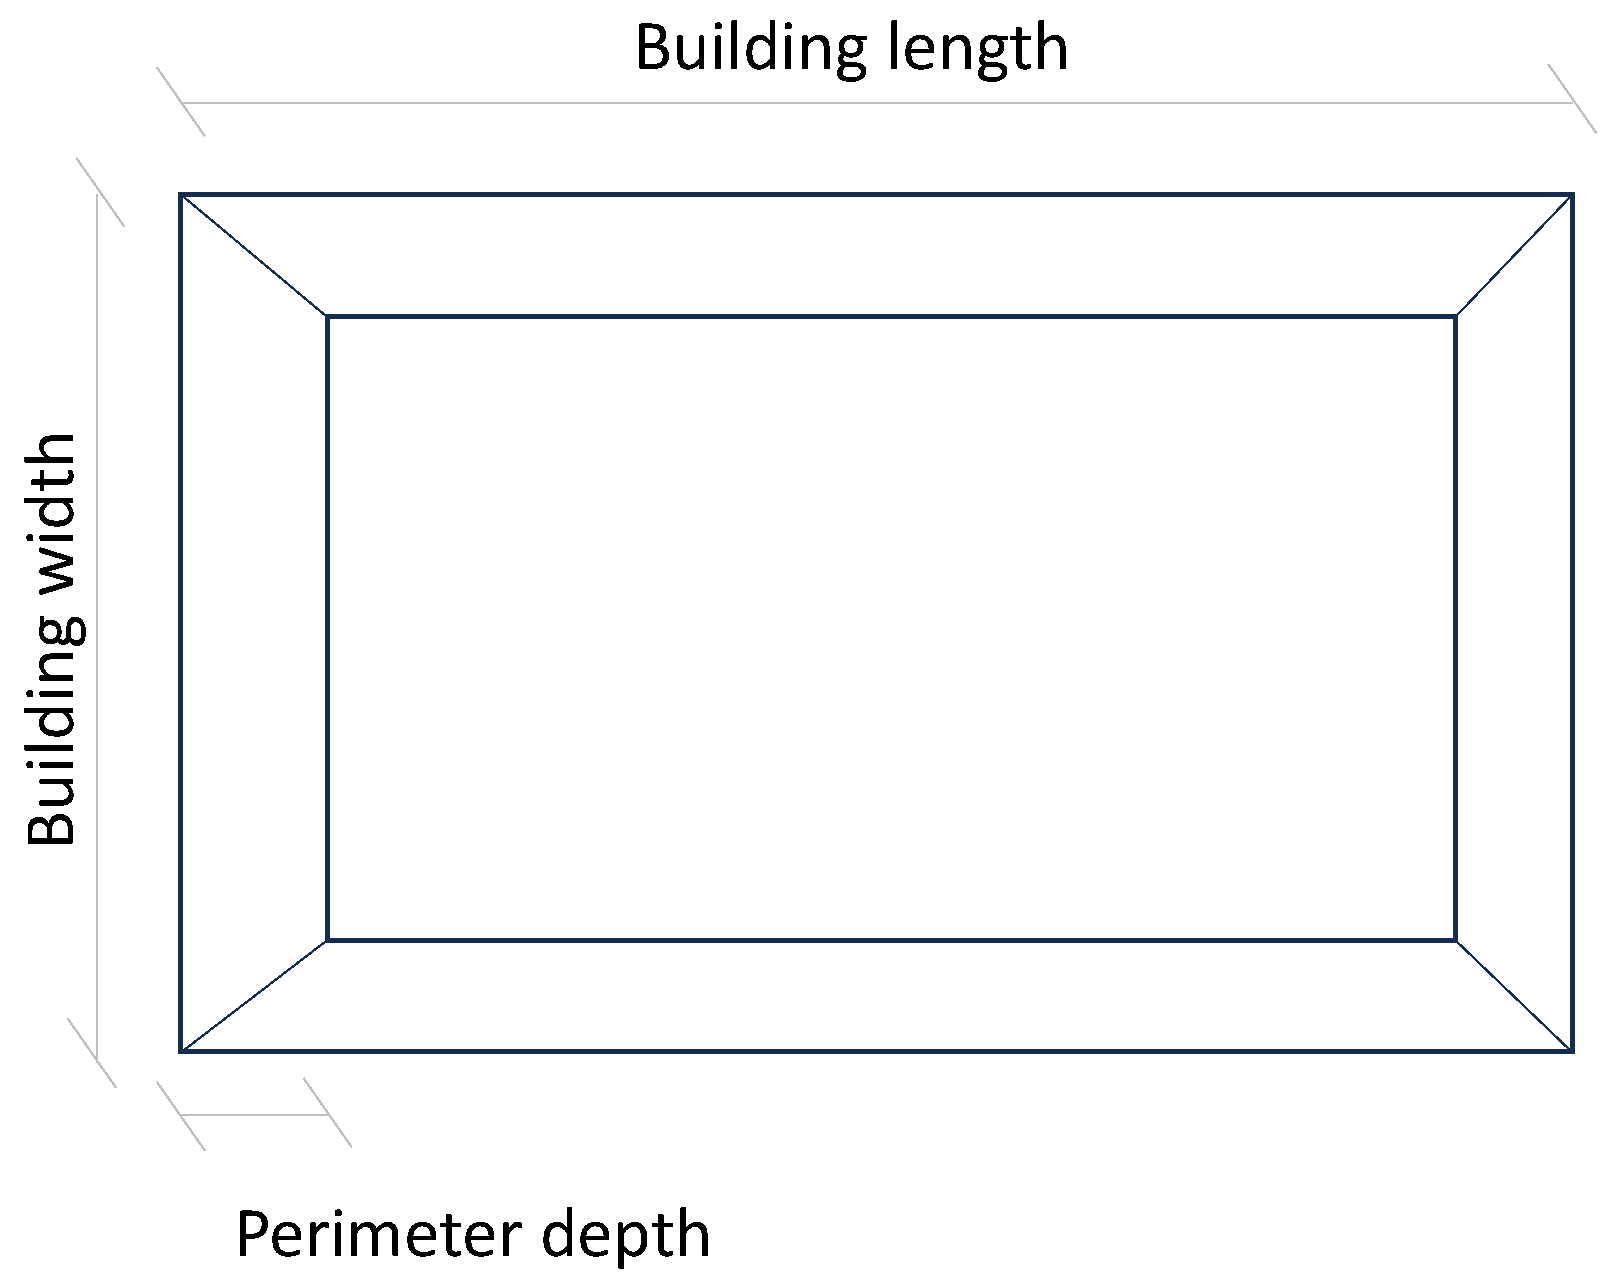
In the early design stage, we are interested in simplified geometries at an urban scale. Therefore, the geometry measure currently generates rectangular building shapes with either one zone per floor or core and perimeter zoning (see Figure 4). Core and perimeter zoning ([19]) is a commonly used strategy of zone-based building energy simulation models when details about spaces in the building are not yet known. This approach generates a core zone that is assumed to have very limited solar gains and multiple perimeter zones, each facing in a different orientation. By doing this, the model is divided into typically five thermal zones per floor, each having a unique and distinct daily solar profile. Since we are primarily interested in energy demand profiles, it is easily achievable to divide buildings into different rectangular segments with different functions and sum up the resulting profiles to an overall profile. To support this feature, we added the option to convert each facade, as well as the ground floor and the roof, into an adiabatic element to enable flexible configuration of rectangular building blocks. Typically, the heat transfer between different building blocks is minimal and can be ignored.
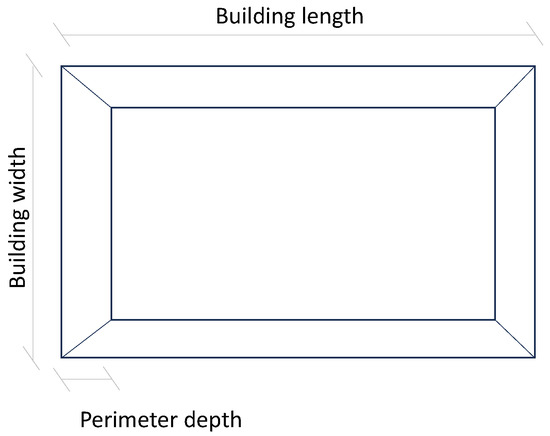
Figure 4.
Core and perimeter zoning.
2.3.2. Simplified versus Detailed HVAC
The initial version of GenSim used a simplified approach on HVAC modelling. EnergyPlus provides a so-called IdealLoads object that enables the simplified simulation of the thermal performance of a building. During the development, we discovered that this simplified approach assumes that heating and cooling is provided to a space via the medium air. While this may be the prominent configuration in the US, in Europe heating and cooling is mostly conducted via the medium water. Especially, the combination of water-based heating and cooling with a fresh air ventilation has different characteristics compared to an air-only system. Specifically, the IdealLoad object does not allow to differentiate between energy flows for the fresh air system versus the heating and cooling system. For this reason, two or three separate systems are used in the current implementation: a fresh air system, a heating water system and, optionally, a cooling water system to gain better results for the use cases in Germany and Europe.
The current detailed HVAC configuration consists of the following:
- An air loop with heat recovery, a return and (optionally) a supply fan
- A hot water loop with district heating and a pump
- A chilled water loop with district cooling and a pump
- Each thermal zone is connected to
- –
- The air loop via an air terminal;
- –
- The hot water loop via a baseboard heater;
- –
- The chilled water loop via a radiant cooling. panel.
2.4. Input Data and User Interface
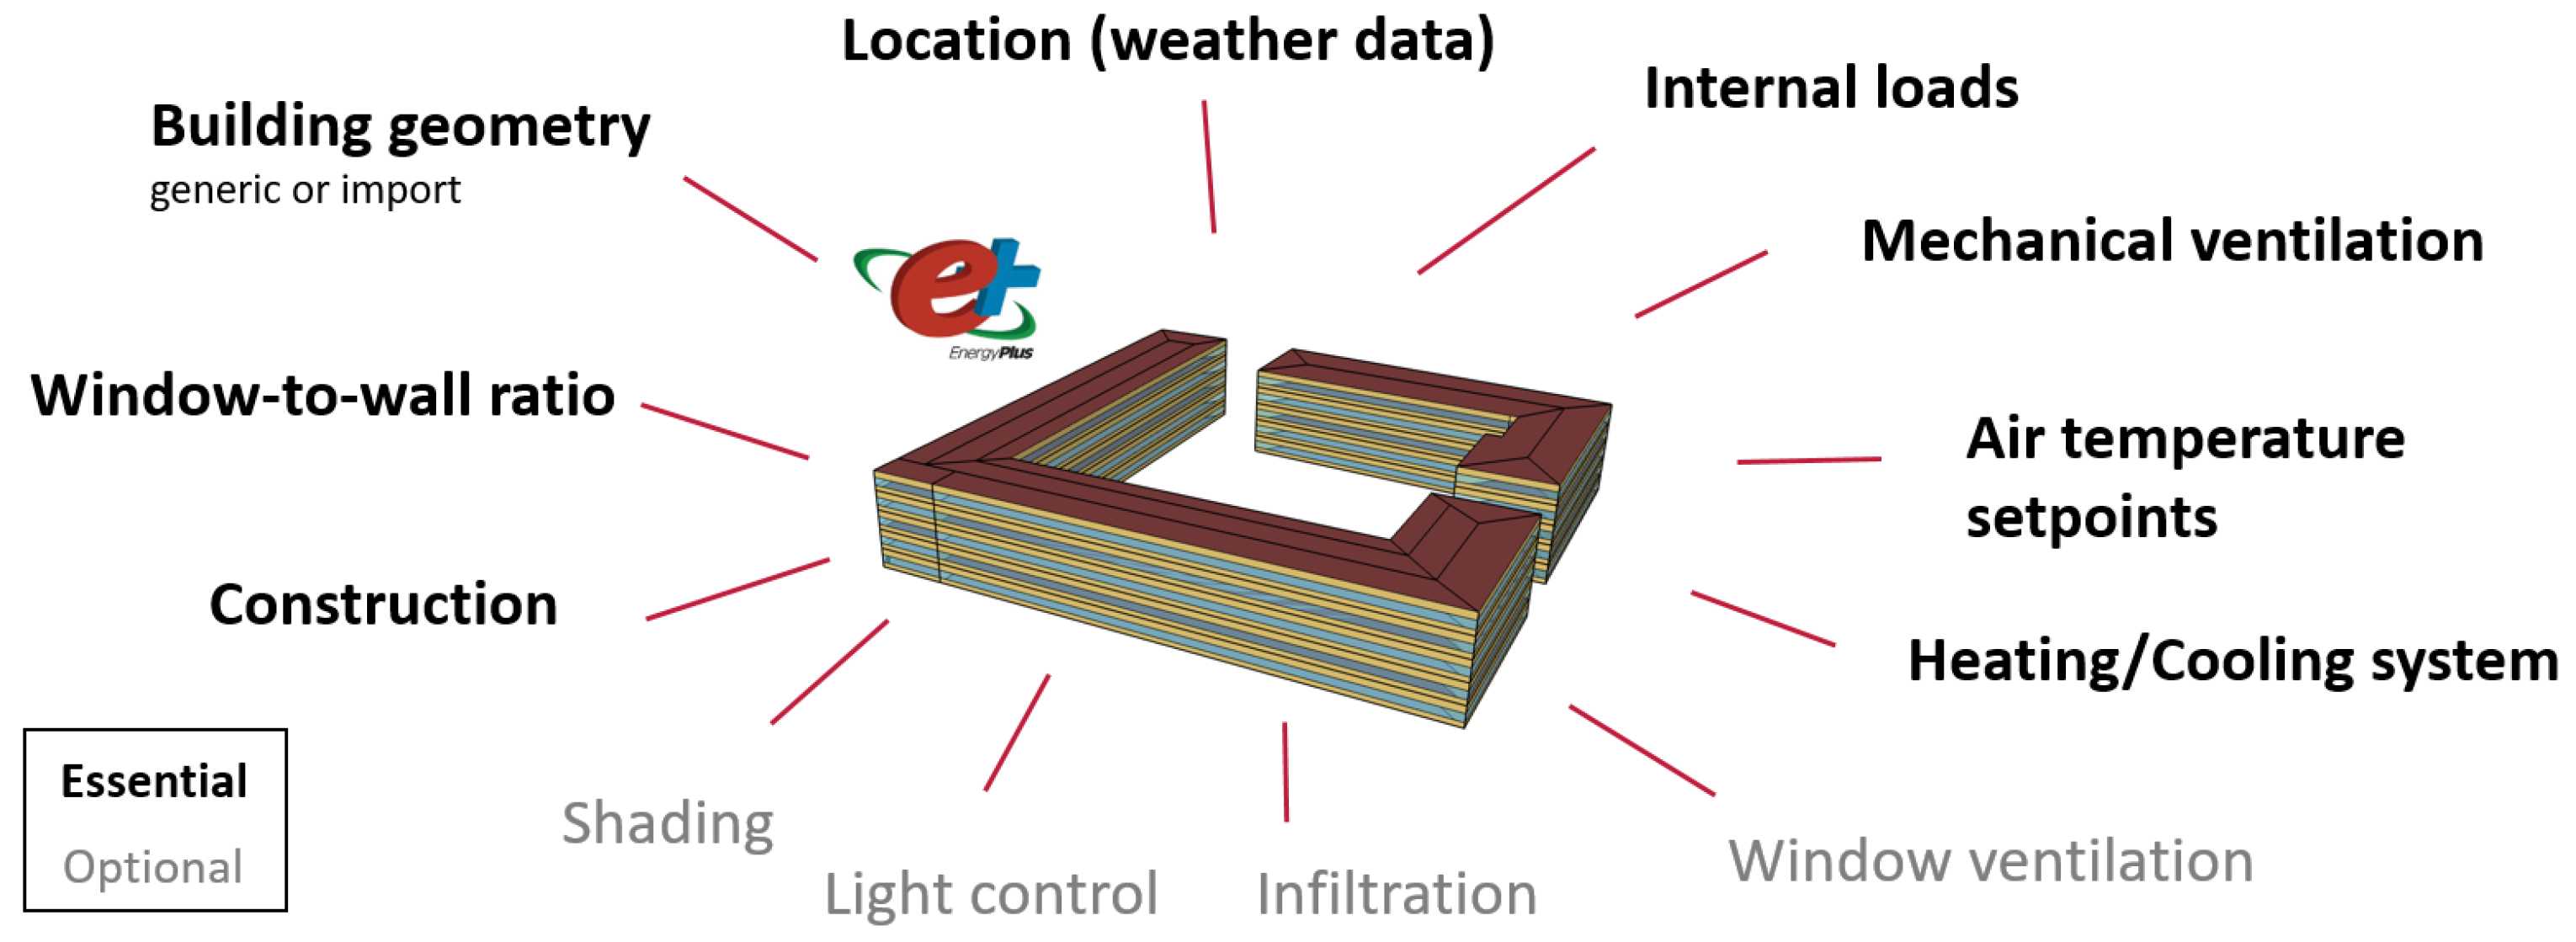
Figure 5 provides an overview of data input that are needed for a simulation with GenSim. This section describes these topics in more detail.
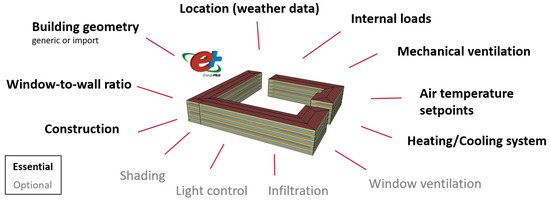
Figure 5.
Overview of essential and optional input data and parameters of GenSim.
To properly place and describe the building, a location (Section 2.4.1) and the building geometry (Section 2.4.2) must be given. In context of building geometry, the window-to-wall ratio as well as construction (Section 2.4.3) information are needed. Typically, thermal energy models rely heavily on thermal zones and related data such as internal loads (Section 2.4.4), lighting control, infiltration and window ventilation. On the system side, which connects to the thermal zones, the user needs to define the heating/cooling system types, indoor air temperature setpoints (Section 2.4.5) and mechanical ventilation. In addition, the simulation time step must be defined, which is limited by the GUI to either 60 or 15 min. However, the simulation model itself supports time steps down to 1 min.
2.4.1. Location
The geographical location of the project is of interest for the selection of location-accurate weather data. The required input to the simulation are EPW files, which are selected from a built-in list. Optionally, the user can use additional weather files from other sources.
2.4.2. Building Geometry
The building geometry can either be provided in the form of an OSM file or be automatically constructed from a set of basic geometric parameters. For the automatic construction of a model, the required parameters include: building width, building length, perimeter depth (the distance in a perimeter zone from the exterior wall inward, see Figure 4), azimuth, number of floors, floor height and the window-to-wall ratio on the north/south/west/east facades. If the adiabatic interfaces between blocks are used as described in Section 2.3.1, these can be toggled in any configuration of the six interfaces.
Since energy performance simulation models use different approaches in terms of floor area, it is important to allow the user to differentiate between GFA and NFA. This is especially important since the floor area is the basis for volume calculations and, thus, the conditioned volume of a building. The floor area acts as basic driver for density input values such as light loads per area. For imported models it is, therefore, important to define the NFA and the ratio of NFA over GFA.
2.4.3. Construction and Materials
The building envelope is characterised by the total energy transfer (heat transfer coefficient and solar heat gain coefficient) of windows, external walls, roofs and the ground floor. The characteristics are selected from a list of available standards and other common data sources for buildings (see Section 3). Similarly, the GUI provides construction definitions for internal walls, which are used for thermal mass simulation.
2.4.4. Internal Loads
Another important input for buildings are the internal heat gains, were three sources are considered:
- Electric devices (also know as plug loads);
- Artificial lighting;
- People (body heat from people performing activities in the building).
Internal loads are typically defined by providing an absolute value or density values per floor area and a related schedule. In our case, we simplified the yearly schedules but using only four daily profiles: workday, Saturday, Sunday and holiday. To describe the three loads, the following daily profiles are needed:
- Utilisation of electric devices ;
- Utilisation of artificial lighting ;
- Presence of people ;
- Body heat power per person .
Schedules are available to select from standard specifications or can be customised within the GUI (see Section 2.4.6).
2.4.5. Setpoints, Ventilation System and Optional Building Functions
Various operational and control parameters of the HVAC system can be set to customise its behaviour.
Setpoint for heating and cooling:
- Setpoint for the heating system, as daily schedules;
- Setpoint for the cooling system, as daily schedules.
Mechanical ventilation:
- Specification of the ventilation system and optionally a heat recovery subsystem as well as its efficiency factor;
- Air changes per hour;
- Conditioned room height;
- Operation time of the ventilation system, as daily schedules.
Optional building functions:
- Parameters for window ventilation and air infiltration;
- Reduction of artificial lighting when a given daylighting setpoint is met;
- Activation of shading elements when the radiation on the facades reaches a given setpoint.
2.4.6. Parts Library and Profile Editor
While the selection of standard values is useful to reduce the effort to model buildings, it is also necessary to allow for finer-grained input options. In general, standard definitions can be copied and modified to build custom configurations, which then can be reused in other models or for other scenarios.
The various daily schedules used as inputs are displayed both in tabular and chart form within the GUI. Figure 6 shows an example of the chart form of a profile for the utilisation of electric devices. This visualisation helps when comparing different scenarios or interpreting simulation results.
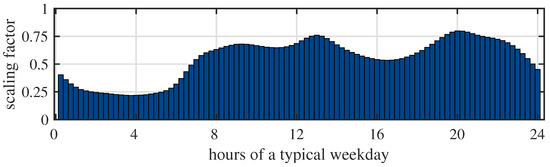
Figure 6.
An example of a daily schedule with a resolution of 15 min for the utilisation of electric devices in a residential building, according to standard schedules by [20], for multiplication with a specific energy demand.
Some of the required parameters of the building envelope, namely the heat transfer coefficients (U-values) for external walls, the roof and the ground floor, are calculated based on parameters of the construction materials. Each building element, e.g., an external wall, is modelled as being composed of up to four material layers. Each material layer has four attributes: thickness, density, heat conductivity and mass-specific heat capacity. Figure 7 shows an example of a wall construction with four material layers.
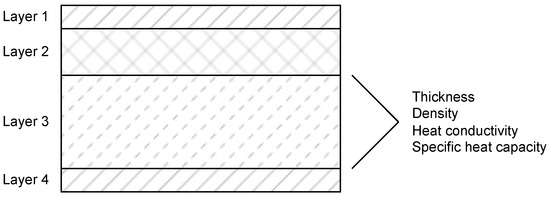
Figure 7.
Visualisation of a material layer set of an external wall.
For windows, the U-value and the solar heat gain coefficient are not calculated in this manner and has to be given as scalar values.
2.5. Result Data
The simulation results are generated by EnergyPlus, processed and displayed by the GUI. Beside profiles of all relevant energy flows, specific key performance indicators related to NFA and GFA are displayed. The output data include the
- Heating and cooling energy;
- Internal loads (from electrical devices, lighting and people);
- Energy gains and losses caused by:
- –
- Heat transfer;
- –
- Solar gains;
- –
- Infiltration;
- –
- Mechanical ventilation;
- –
- Window ventilation.
An important part of the simulation process in EnergyPlus is the auto-sizing of HVAC component capacities. To ensure these capacities are meaningful, unmet load hours for heating and cooling are calculated and shown as result in the GUI. In addition, the displayed results include the required energy demand for heating and, if enabled, for cooling. Optionally, detailed output data of all zones of the EnergyPlus model can be made available within the GUI for more detailed analysis.
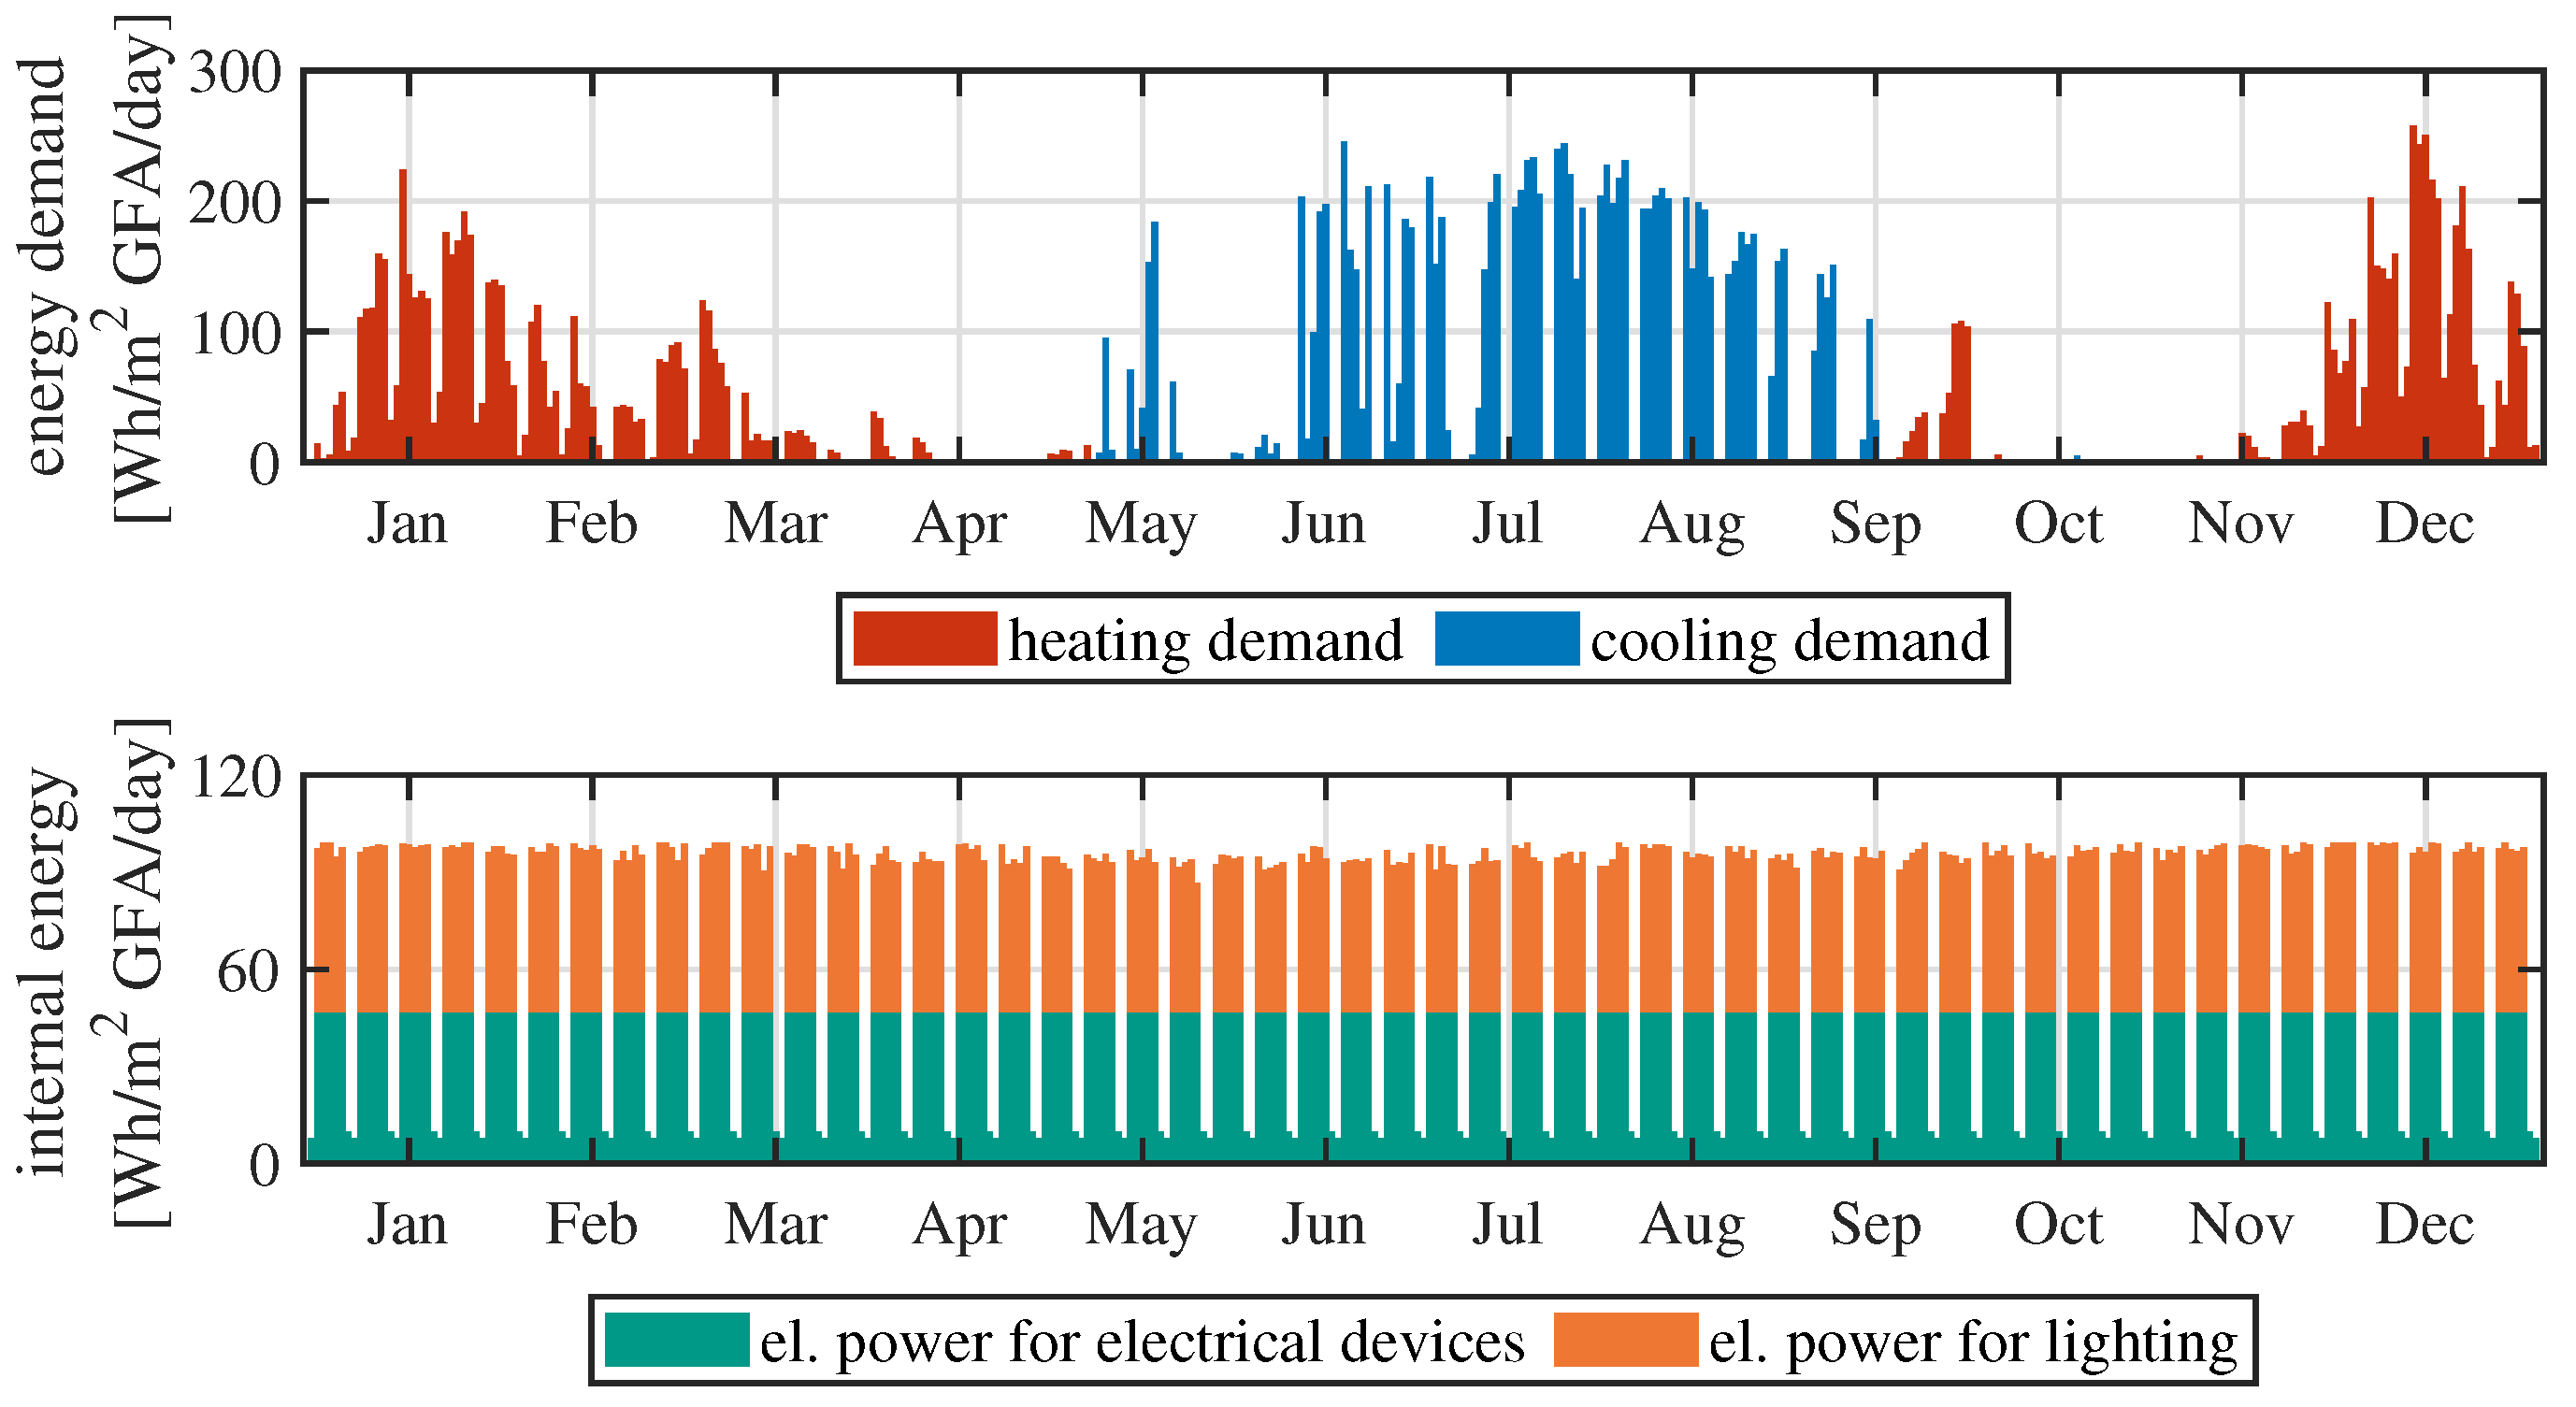
For example, the resulting heating and cooling demand as well as electric power of devices and lighting are shown in Figure 8 as daily aggregated annual profiles. Although representing the simulation results of the commercial section of the building block “Béla” described in Section 4, they are here shown as exemplary output of GenSim’s GUI. The internal loads are evenly distributed throughout the year following a weekly pattern, whereas the heating and cooling demand represents a seasonal weather-related trend. More details on the results of this building block as well as comparisons to measurement data are shown in Section 4.
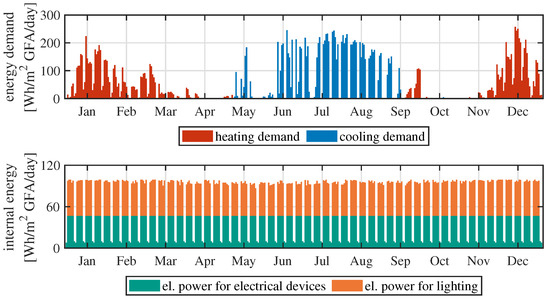
Figure 8.
Yearly energy demand profiles generated with GenSim, aggregated daily, for the commercial section of building block “Béla” with weather data of 2022 described in Section 4.
3. Standard Parameters and Building Typology
Due to the primary purpose of the GenSim tool, which is to generate yearly demand profiles for urban simulations, our foremost objective was to ensure simplicity in the data-input process. To achieve this, we put significant emphasis on providing users with selection inputs featuring predefined parameter values, drawn from relevant data sources wherever feasible. This approach was implemented to streamline the user experience and facilitate quick and efficient data entry. GenSim’s generic building model (described in Section 2) supports the generation of a wide range of different building typologies by using different parameter templates. Therefore, a key feature of this work is to provide standardised parameter templates for a diverse range of building typologies. This allows users to develop new building configurations by starting with an existing building type and modify it according to specific project needs.
The following subsections include the sources of the included standardised parameters, referring mainly to German and Swiss standards. Exemplary, the building typologies for multi-family as well as for office buildings are explained in detail.
3.1. Default Parameters from Standards
Usually, many of the input data required to simulate the energy demand of buildings are unknown during the early design stage. In particular, the actual user behaviour and operating hours of HVAC systems can be difficult to define. Therefore, for building energy performance simulation, default parameters from data standards are used as input for the models. In situations where no useful data standards are available, empirical values based on the modellers experience are a common fallback.
3.1.1. Location
Weather data for the 25 biggest German cities are included in GenSim. These are TMY weather files based on the standard reference year of 2015 and 2045, provided by the DWD [21]. The DWD web-service [21] provides data for any location in Germany. To use these TMY weather files, a manual process outside of GenSim is needed for conversion. There are also additional sources for EPW files that can be used with GenSim.
3.1.2. Building Geometry
Geometry in EnergyPlus is typically modelled with a GFA approach. In order to use standard template values, that are based on NFA, a ratio converting between the two is needed. Standard values for this ratio from different sources ([22,23]) are included, which are valid in a Germany context. The transferability of these default ratio values to other countries was not assessed.
3.1.3. Internal Loads
Data sources for internal loads, occupancy and activity schedules, (described in Section 2.4.4) are included as follows:
- Standardised electricity load profiles from the BDEW [20] (German Federal Association of the Energy and Water Industries);
- Prototype Building Models for residential and commercial buildings published by the DOE [24];
- DIN V 18599-10—Nutzungsprofile für Nichtwohngebäude (load profiles for non residential buildings—a standard for energy assessment of buildings published by the DIN [25] (German Institute for Standardization));
- DIN V 18599-10—Nutzungsrandbedingungen Wohngebäude (load conditions for residential buildings) [25].
Parameters for the NFA-specific power of electrical equipment and lighting as well as occupancy density (as NFA per person) from the following standards are included:
- ASHRAE 90.1 2013: U.S. Energy Standard for Sites and Buildings Except Low-Rise Residential Buildings [19];
- DIN V 18599-10—Nutzungsprofile für Nichtwohngebäude (load profiles for non residential buildings) [25];
- SIA 2024—Raumnutzungsdaten für die Energie- und Gebäudetechnik (standards for room usage data for energy and building engineering provided by the SIA [26] (Swiss Society of Engineers and Architects)).
3.1.4. Construction
Construction data sets for Germany of the following data sources are included:
- German residential building stock based on a typology published by the IWU [27] (Institute for Housing and Environment);
- German new residential building construction templates based on empirical expert knowledge to achieve the German standards “efficiency house” 40 or 55 according to the KfW [28] (Credit Institute for Reconstruction) and the German Building Energy Act [29].
3.1.5. Air Temperature Setpoints
For the air temperature setpoints, empirical schedules are included, referring to the static standard setpoint temperatures from DIN V 18599 [25]. For the heating setpoint, typical nighttime temperature reset schedules are also included.
3.1.6. Mechanical Ventilation Schedules
The mechanical ventilation schedules of the following sources are included:
- Prototype Building Models for residential and commercial buildings published by the DOE [24];
- DIN V 18599-10—Nutzungsprofile für Nichtwohngebäude (load profiles for non residential buildings) [25];
- DIN V 18599-10—Nutzungsrandbedingungen Wohngebäude (load conditions for residential buildings) [25].
3.2. Building Typology
Based on the standard parameters described in Section 3.1, different building typologies for Germany are defined. The typologies are published as part of the open source project “QuaSi-Software” [30] and include:
- Residential single-family house;
- Residential multi-family house;
- Office building;
- Retail store;
- Restaurant;
- Hotel;
- Kindergarten;
- School;
- Sports facilities.
The default parameter values of a building typology for a typical German residential multi-family house are shown in Table 1. Table 2 shows the same default parameters values for an office building. Both were used in Section 4 for validation. Detailed information on the default values for the parameter templates for all typologies are included within our repository. These templates are created with engineering expertise and empirical values from actual projects in Germany.

Table 1.
Essential parameters of the German multi-family house type.
Table 2.
Essential parameters of the German office type.
4. Verification
In order to validate the accuracy of the presented simulation tool and the chosen approach, a comparative analysis on the basis of a real building block is presented in the following chapter. The validation focuses solely on the heating demand as this is the main output of the building energy performance simulation. The simulation results generated by GenSim are compared with actual measurements and to those derived from a detailed building energy performance simulation using DesignBuilder [17].
4.1. Project Context
The validation is based on the project EsWest [31], the newly built “climate city district” in Esslingen near Stuttgart, Germany. For the validation, the building block “Béla”, that was first built and occupied in 2020, was selected. Its GFA is 13,000 square meters and it is a mixed use building with 85% residential and 15% commercial usage, including offices, orthopedics and a dentist.
4.2. Simulation Methodology and Modelling Assumptions
For the selected building block, the energy demand for heating was simulated during early design with GenSim. Basic available information about the building block included GFA, number of stories, standard of constructions and the anticipated building usage (residential and commercial). Due to the early design stage the simulation expert had to make various assumptions about the HVAC system, NFA, detailed building usage, window-to-wall ratio, external geometry shape and others. Using Euclid [32], a Sketchup [33] plugin, a simplified geometry model was created for both the commercial and residential section of the building, allowing to represent each as single-zone models in GenSim. The interfaces between building elements of the two sections are assumed to be adiabatic.
At a later design phase, the investigated building block was modelled and simulated in DesignBuilder with additional available data about the project, mainly more detailed geometry of the building. In addition to these two simulation models, measurement data of the heating demand (residential and commercial) from 2021 and 2022 are available. In both years, the investigated building block “Béla” was fully occupied. Figure 9 shows all three simulated variants, the simplified GenSim model (a), the detailed DesignBuilder model (b) and an image of the actual building block (c), which was provided by Kamps in 2020 [34].
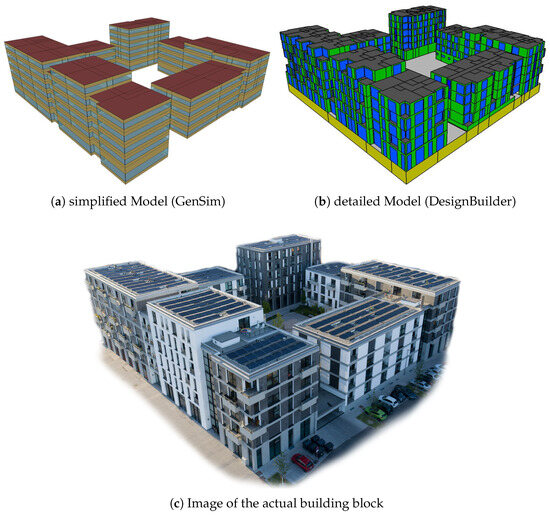
Figure 9.
Simplified single-zone (a) and detailed multi-zone (b) Model of the analysed building block “Béla” used for the energy performance simulation in GenSim and DesignBuilder as well as an image of the actual building block (c), provided by Kamps in 2020 [34].
The GenSim model’s commercial section of the building was simulated using the standard typology for office buildings, described in Section 3, with the parameters given in Table 2. The parameters for the residential section are based on the standard topology for multi-family houses, specified in Table 1, with slight adjustments regarding the power density for lighting and electrical devices as well as for the occupancy rate and the air exchange rate, as listed in Table 3. These adjustments are due to the project-specific characteristics, in this case the rather upscale apartments. This resulted in the assumption of more technical equipment as well as more light. In addition, the central location of the building block also resulted in a reduced amount of floor space per person. For the residential section of the building, an indoor design temperature of 20 °C during daytime and a reduction to 18 °C at night was assumed within the early design due to the overall energy-efficiency goal of the project. The parameters for the building envelope of the investigated building are given in Table 4. For a valid comparison between these three data sources, we updated the two simulations by using actual weather data. To further enable a meaningful comparison, some input data in the DesignBuilder model had to be adjusted to align with the assumptions made in the earlier and simpler GenSim model. For this reason, we set the major input values for the DesignBuilder model to be the same as the GenSim model, including the space air temperature setpoints, ventilation schedules, building construction standard and occupancy density. In GenSim, the residential as well as the commercial section of the building were assumed to be heated by water radiators. In reality, underfloor heating is installed in the residential section and water radiators in the commercial section. In order to eliminate a known difference between the simulation results of DesignBuilder and GenSim, the DesignBuilder model was adapted to ensure that all rooms requiring heating were equipped with water radiators.
Table 3.
Assumptions made in GenSim and DesignBuilder for residential usage in EsWest, block Béla”, only changes from the standard typology given in Table 1 are shown here.
Table 4.
Assumptions made in GenSim and DesignBuilder for the building envelope of EsWest, block “Béla”.
4.3. Weather Data Integration and Comparison Metrics
For both initial simulations in GenSim and DesignBuilder, a location-specific TMY weather file was used. This file is based on 2015 and originated from the DWD [21]. To reflect the actual weather during the investigated years, two EPW files were created for the comparison of the heating demand between the simulation results and the measured data of 2021 and 2022. Therefore, measured weather data provided by the DWD from the nearby WMO Station 10738 in “Stuttgart-Echterdingen” (direct distance to the investigated building is 8.0 km) were used. As solar radiation data were not available from this station, those data were taken from another weather station: WMO-Station 10736 “Schnarrenberg” (direct distance 12.0 km) [35]. The files were created using the EnergyPlus Weather Converter [36] and python-pvlib [37]. The latter was used to calculate the solar direct normal irradiation from the measurements. Using the two EPW files with actual measured weather data allows direct comparison between the simulation results calculated by GenSim and DesignBuilder to the measurement data of the heating demand in the years 2021 and 2022. To ensure consistency, all data were normalised to the GFA of the actual building. For this comparison, we focused on the energy demand for heating, excluding domestic hot water demand. In the project context, the latter was manually calculated using standard load profiles.
4.4. Comparative Analysis: GenSim versus DesignBuilder and Measurement Data
For the comparative analysis, we started with total annual data (Section 4.4.1). To gain more insights, total monthly data (Section 4.4.2) as well as annual profiles of daily sums and daily profiles at a time resolution of one hour (Section 4.4.3) are compared. To be able to better evaluate the different results of the year 2021 compared to 2022 and to the TMY weather, daily, monthly and yearly degree days were calculated according to standard VDI 3807-1 [38], published by the VDI (Association of German Engineers).
4.4.1. Analysis of Annual Results
The validation process shows a high level of agreement between the yearly heating demand for residential and commercial usage obtained from GenSim and DesignBuilder as shown in Figure 10, superscripts 1. The relative error of the yearly heating demand for the whole building block was found to be −0.6% for 2021, −0.2% for 2022 and −1.7% for the TMY weather data set.
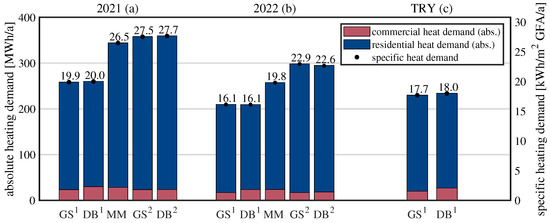
Figure 10.
Heating demand of building block “Béla” calculated using GenSim (GS), DesignBuilder (DB) compared to measurement data (MM) for 2021 (a), 2022 (b) and TMY (c). room temperature residential: 20 °C (daytime), 18 °C (night). room temperature residential: 22 °C (all day).
The annual heating demand calculated using the TMY weather data set is between those computed for the years 2021 and 2022. This outcome is consistent with the number of degree days: 3610 in 2021, 3132 in 2022, and 3228 in the TMY dataset. This underscores the accurate representation of different weather files. The comparison of the results from GenSim with DesignBuilder indicates, that the initial assumptions and simplified modelling approach employed in GenSim, especially a simplified building geometry and combined thermal zones, provided reliable estimates of the annual heating demand.
A comparison of these results to the actual measurement data, as also shown in Figure 10, reveals a significant difference. In 2021, the measured heating demand is 32.5% higher compared to the initial simulation results (superscript 1), and a 23.0% increase was observed in 2022. These differences can be explained by several factors. However, we found that a likely cause could be the room air temperature setpoints of the residential section of the building. Initially, a design indoor temperature of 20 °C with a nightly reduction to 18 °C was used for residential usage. Although, the actual temperature settings in the real apartments are not known. As discussed in Section 4.4.3 concerning the daily patterns of energy use, a nightly reset is not present in the residential section of the real building. By adjusting the temperature setpoints in both simulation models to 22 °C during day- and nighttime, the resulting simulated annual heating demands in 2021 are very close to the measured values with differences from 3.8% to 4.5% (shown in Figure 10 with superscript 2). However, for the year 2022, the adjusted simulation results show significantly higher values compared to the measurement data (compare to Figure 10). Therefore, in 2022, the actual room temperatures appear to be lower compared to 2021, possibly due to efforts in energy-savings as a result of significantly higher heating costs due to the European energy crisis.
For all other simulation results shown in this paper, the initial room temperatures of 20 °C at daytime and 18 °C during the night were used.
In the commercial section of the “Béla” building block, uncertainties were significantly higher during the design phase compared to the residential section. This is due to the unknown specific use case within the commercial area. Despite these uncertainties, both DesignBuilder and GenSim provided good approximations of the thermal heating energy demand. Given that the commercial sector represents only about 15 % of the total GFA, its influence on the overall thermal energy demand is relatively minor.
4.4.2. Analysis of Monthly Data
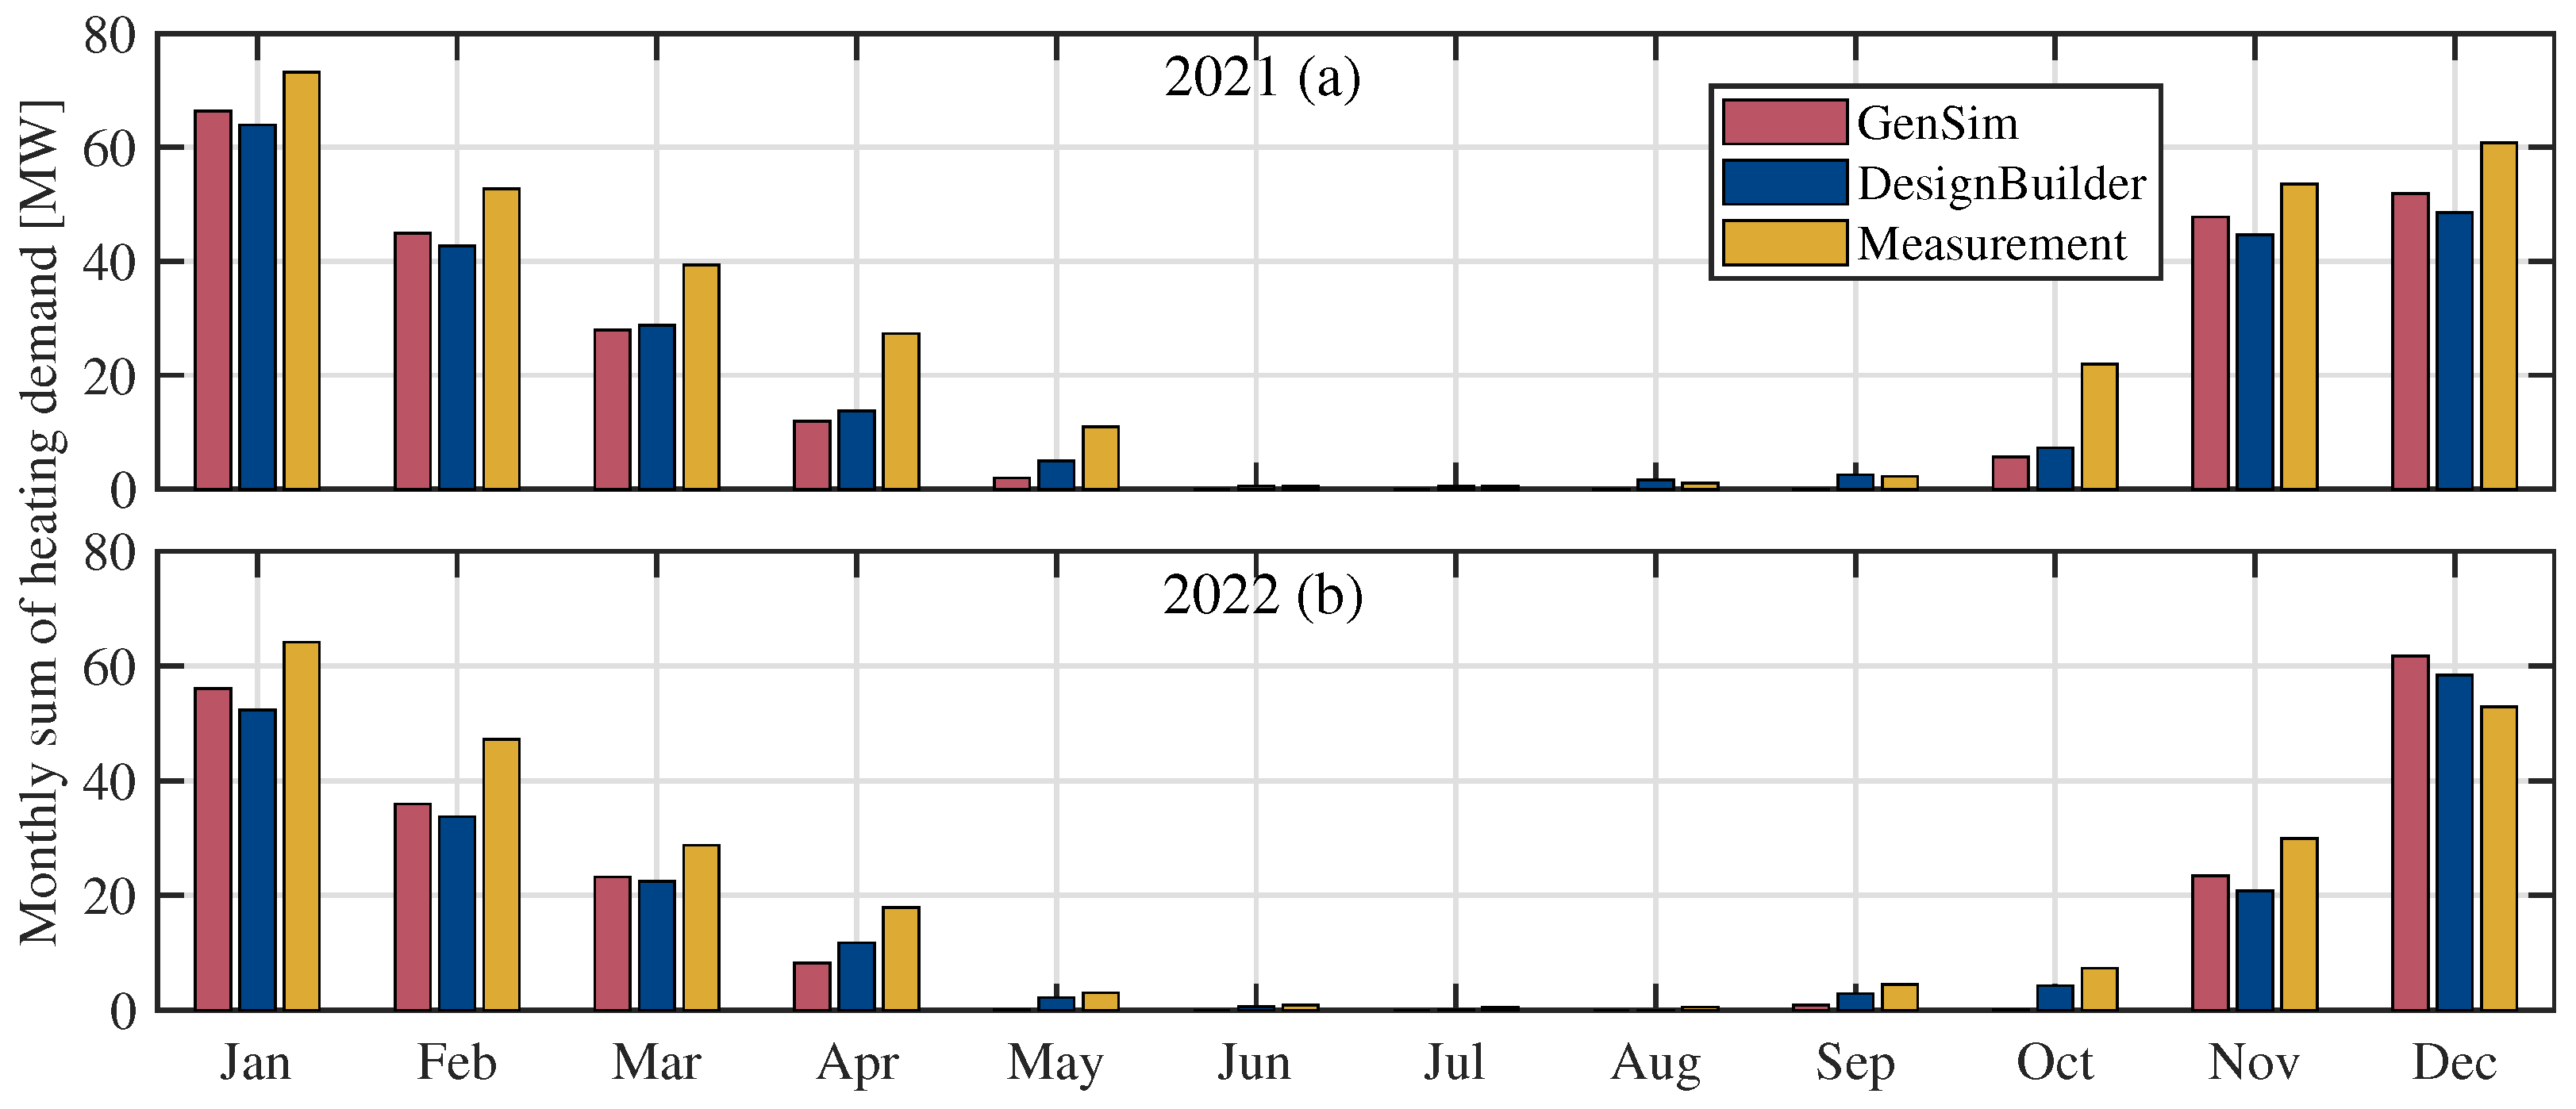
Comparing the demand of the heating energy with a higher temporal resolution of monthly aggregated values, the pattern are quite comparable but differences become identifiable as shown in Figure 11. Here, monthly sums of the heating energy demand simulated by GenSim and DesignBuilder are compared to the measurement data both for the years 2021 and 2022. The tendency of higher measured data for heating energy demand compared to the simulated ones, as already discussed in the previous section, are clearly visible. An exception occurs in the winter of 2022, especially in December, where the measured energy demand is lower than the simulated one. This underlines the earlier argument for energy saving efforts by the inhabitants due to the energy crisis in Europe.

Figure 11.
Monthly sums of simulated heating demand of the building “Béla” calculated by GenSim and DesignBuilder and compared to measurement data for 2021 and 2022.
It is notable that in winter, the energy demand calculated by GenSim is slightly higher compared to the one calculated by DesignBuilder, while this effect is reversed in the transition period. As shown in the previous subsection, these effects are balanced out when analyzed cumulatively. Looking at daily profiles as shown in the next section, a reason for this effect can be derived.
4.4.3. Analysis of Daily Profile Data
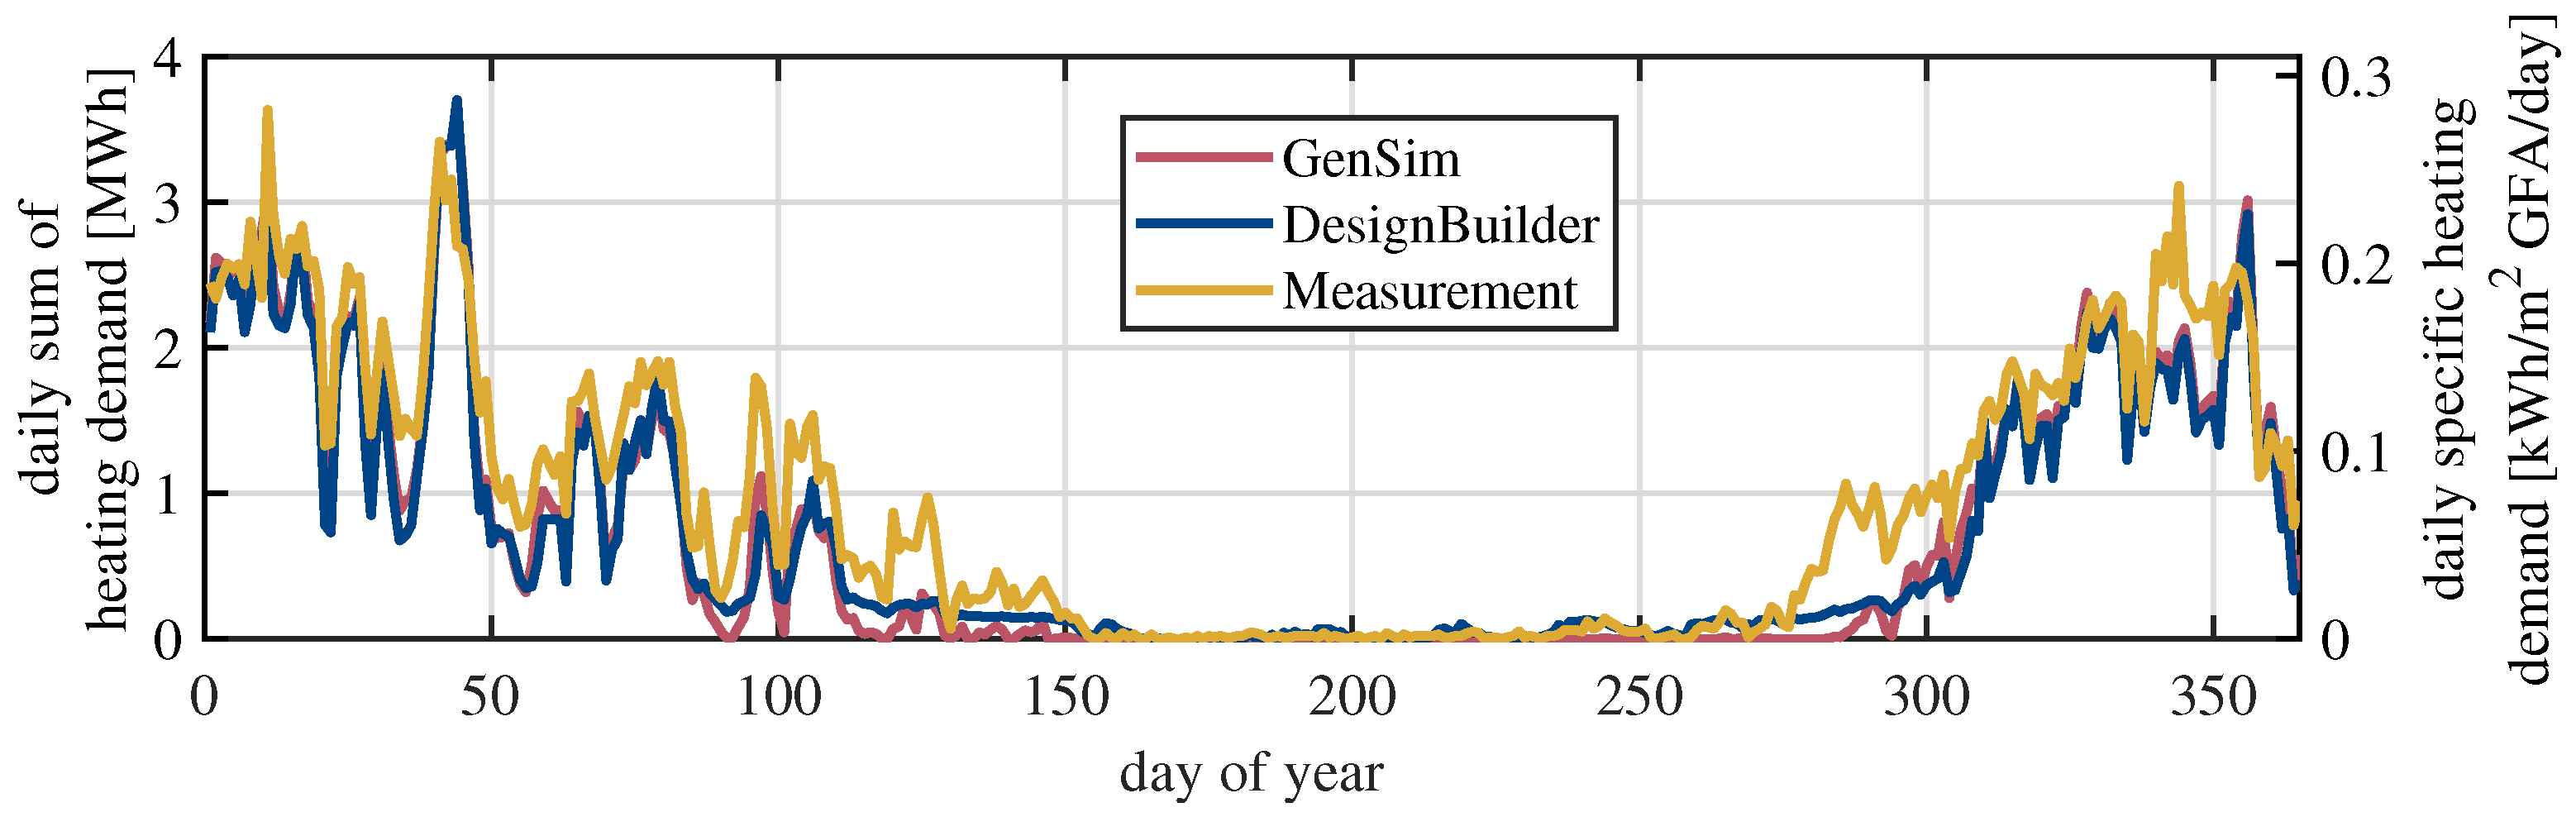
The annual profiles of the heating energy demand of the whole investigated building are shown as daily sums in Figure 12 for the two simulation models and the measured data. In general, the overall patterns of the three profiles have mostly similar characteristics. While in winter the profiles of the heating demand of GenSim and DesignBuilder match closely, there is a difference in the transitional periods between the two models. It appears, that in the GenSim model the heating system deactivates earlier (and activates later) in the transition periods compared to the DesignBuilder model. The measured heating demand profile shows higher deviations compared to the simulation results of the two simulation tools, especially in the transitional period. This does fit with the overall pattern of the monthly data due to the discussed differences in temperature setpoints.
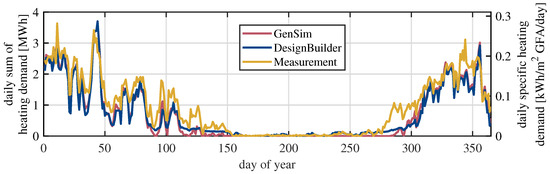
Figure 12.
Daily sums of annual heating demand profiles in 2021 of simulation results derived from GenSim and DesignBuilder as well as from measurement data.
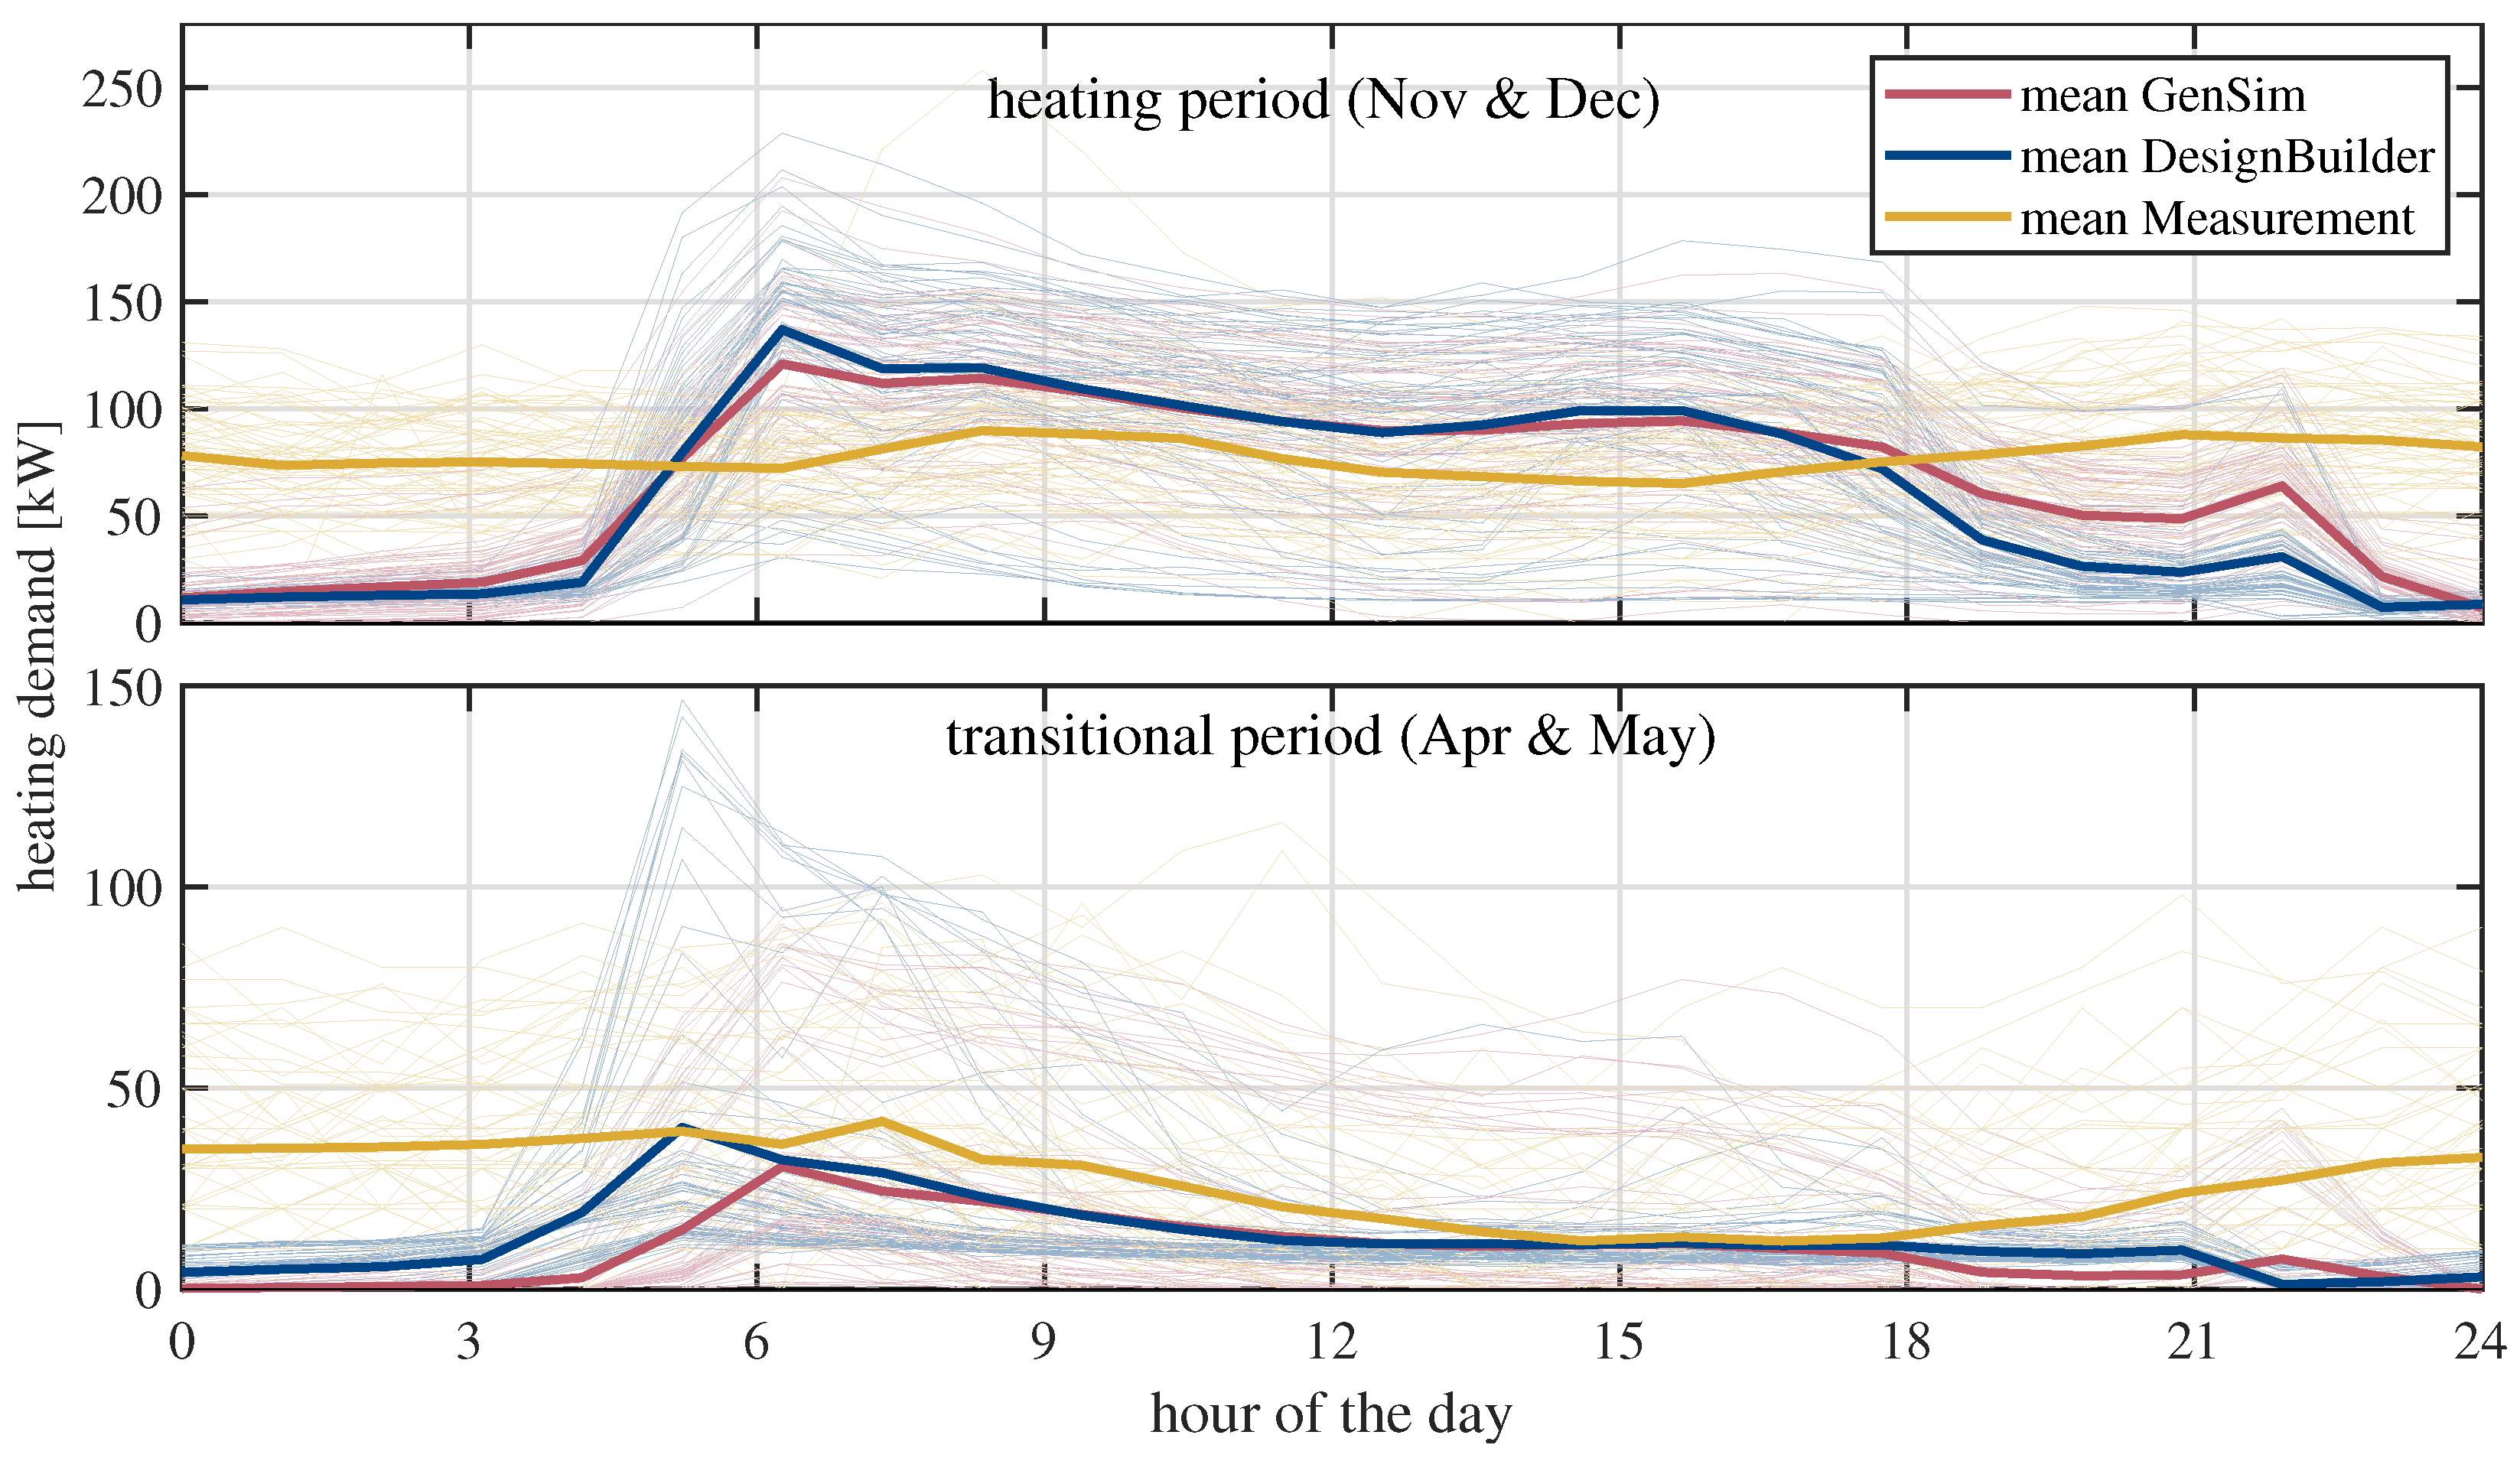
Looking at the characteristic of the daily heating demand in Figure 13 offers deeper insights and more possible explanations for the observed deviations. Here, daily profiles for the heating period (upper graph) and the transitional period (lower graph) are shown. The two graphs contain the overlain heating demand curves for each day as well as a mean heating curve for the specified time period as thick line. It is visible, that in average, the peaks of the heating demand calculated by DesignBuilder are higher, while the calculated thermal energy demand during the nighttime within the heating period are lower. This effect can be explained by different control mechanisms in both simulation tools, which affect the gradients of the heating energy demand curves and the hot water flow rate through the water radiators at certain room temperatures. Especially in the transitional period, the heating demand of DesignBuilder is increasing earlier in the morning with considerably higher gradients and peak loads compared to GenSim.
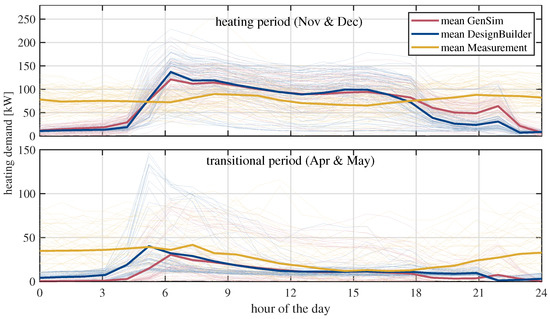
Figure 13.
Daily and mean profiles of two 60-day periods from heating demand in 2021, one in winter and one in the transitional season, of simulation results derived from GenSim and DesignBuilder.
Comparing the measured mean daily heating energy demand curves to the simulated ones, it can be observed that the measured values are mostly constant throughout the day. This implies that there is no setpoint temperature reset during nighttime. In addition, this effect could also be caused by the different heating system of the simulation models. Water radiators, as used in the simulation models, react much faster to heating demands compared to the underfloor heating system of the real building that has quite slow reaction times due to its attached thermal masses. Moreover, the measurement data are recorded directly after the heating system before distribution, while the simulation tools neglect the losses of the distribution system as they provide the sum of the thermal energy of each room within the model.
4.5. Summary of Validation
The validation described in this section shows the effectiveness of GenSim in simulating the energy demand for heating during the early design of the project EsWest. The high level of agreement between the simulated annual sum of the heating demand from GenSim and the results obtained from DesignBuilder during the actual design phase indicates the reliability of the simulation approach of GenSim. The results show, that the simplifications made in GenSim are appropriate during early design.
The consistency of the simulation outcomes between GenSim and DesignBuilder suggests that the geometric simplifications—primarily the assumed window-to-wall ratio and exterior wall-to-volume ratio—are valid. In addition, the simplified representation of the occupancy type in a single-zone model in GenSim are acceptable and appropriate given the early design stages.
Minor uncertainties exist in the course of the intraday heat demand profiles comparing GenSim and DesignBuilder, which, however, have a large dependence on the control system and the installed heating system. For the use of the profiles in an early planning stage of an urban simulation, these rather small differences in the intraday heating demand profile are not considered to be significant on the overall results.
The differences between the measurement and the simulation data illustrate the difficulty of performing these comparisons. The lessons learned from this comparison is that actual user behaviour, namely the air temperature setpoint during the winter, highly affects the total heating energy demand. Interestingly, the willingness or knowledge to save energy with a lower temperature setpoint became only relevant to the occupants with increasing heating costs. This underlines the difficulty for setting these temperature setpoints correctly in the early design phases since a resulting underestimation of the energy demand of a building is not beneficial.
The investigated building block is a newly built structure with a high performing construction standard. Obviously, GenSim can also simulate heating energy demand of existing buildings. For existing buildings, parameters like air exchange rate or the construction details can be much harder to determine. A validation study for existing buildings to verify GenSim’s applicability is planned for the future.
5. Discussion
The development and use of the GenSim tool enables energy consultants and engineers to quickly generate energy profiles for buildings or building blocks. The simple data input and automated process to generate EnergyPlus models provides a stable and reliable application. GenSim was developed as open source software (accessible at [30]) within the related project [39] and was successfully used in several urban development projects, e.g., in [31,40,41].
To offer the tools functionality to a wider audience, the authors are driving the open source publication of the tool. It is also planned to use the tool in a teaching context to enable students to learn and understand the different aspects of energy balances in buildings as well as their implications of the results. GenSim can be sufficiently used in early planing stages since the input data are defaulted to data originating from standards and the use of different building typologies as starting point for new projects. In addition, the quick processing and simulation times of only a few minutes allow the user to quickly assess different options and parameter settings.
One major initial limitation of the tool was its dependence on the high-level OS API. This API does not support the full functionality of the EnergyPlus engine and thus required workarounds with the lower level API even with simple HVAC objects. The necessary workarounds make the tool more complex and error prone. Based on these workarounds and to ensure the current functionality of the tool, a major test development was initiated to perform automated test in a modern Git-based software development process.
Besides the open source and testing push for the tool, various other enhancements are currently ongoing. A more advanced data exchange from geometric data are currently under development that will enable more advanced geometric configurations. Additional integration with other related tools to further ease the user experience is being considered. A number of other enhancements in terms of simulation features are also on the horizon. Further enhancement options for the HVAC system modelling are currently under investigation, such as adding heating and cooling coils to the fresh air system. Another likely enhancement would be the option to provide surface heating in addition to the existing water radiators.
6. Conclusions
GenSim, the user-friendly tool for urban energy demand simulations, has demonstrated its effectiveness in generating yearly energy demand profiles for buildings using EnergyPlus and OpenStudio SDK. By simplifying the input data through predefined parameters and standardised templates, GenSim streamlines the simulation process, enabling energy consultants and engineers to quickly generate accurate demand profiles for various building types. These resulting energy demand profiles can be used for the subsequent design, sizing and evaluation of different energy supply systems and are already utilised in the “QuaSi Software” [30] to simulate the energy supply for urban districts.
The validation study comparing GenSim’s simulations with DesignBuilder’s results showcased a high level of agreement in yearly heating demand calculations (ranging from −1.7% to −0.2% relative error). Despite some discrepancies at higher temporal resolutions, GenSim proved reliability during the early design stage, making it a valuable tool for assessing energy demand options and parameter settings in real-world projects. In addition to the comparison with a more detailed building energy performance simulation, the comparison to measurement values showed slightly higher variations (ranging from 3.8% to 4.5% in 2021). This comparison also revealed that high performing buildings are highly dependent on occupant behaviour. A missing reduction of the temperature setpoint during nighttime and higher temperature setpoints in general have a high influence on the heating energy demand. This validation analysis shows the benefit of using a physics-based model that allows to adjust parameters meaningfully, since they are directly relate to real-world control values and allow sensitivity analyses with regard to input variables that are subject to uncertainties.
Energy simulation for an urban context using tools like GenSim offer greater opportunities compared to single building simulations. Urban simulations allow for the analysis of complex interactions among multiple buildings, infrastructures and environmental factors. This holistic approach helps to identify synergies and potential energy-saving measures on a larger scale, such as district-level energy systems, shared resources and optimised energy distribution.
Our work emphases the significance of realistic assumptions and accurate data in energy simulations, especially for existing buildings with many unknowns. The tool’s flexibility in handling simplified geometry models and assumptions highlights its applicability during the initial design phases of a buildings or district life-cycle.
GenSim’s utility extends to energy consultants and engineers, enabling efficient data input, automated processes and swift simulations. Its open source nature and integration into teaching contexts further promote its accessibility and usability, positioning GenSim as a valuable asset in the field of urban energy profile and energy performance simulations.
Author Contributions
Conceptualization, T.M., M.W.S. and C.K.; methodology, T.M. and M.W.S.; software, T.M., H.S., M.W.S. and E.O.; validation, T.M., H.S. and M.W.S.; formal analysis, T.M., H.S. and M.W.S.; investigation, T.M., H.S. and M.W.S.; resources, M.W.S. and C.K.; data curation, H.S., M.W.S. and E.O.; writing—original draft preparation, T.M., H.S., M.W.S. and E.O.; writing—review and editing, T.M., H.S., M.W.S., E.O. and C.K.; visualization, T.M., H.S., M.W.S. and E.O.; supervision, T.M., M.W.S. and C.K.; project administration, T.M., M.W.S. and C.K.; funding acquisition, M.W.S., E.O. and C.K. All authors have read and agreed to the published version of the manuscript.
Funding
This research was funded by the German Federal Ministry for Education and Research (BMBF) and the German Federal Ministry for Economic Affairs and Climate Action (BMWK)—grant number 03EN3053 and grant number 03SBE115.
Data Availability Statement
Measurement data used in Section 4 is available for research purposes on request to info@siz-energieplus.de. Standard parameter values and profiles referred to in Section 3.2 and GenSim itself are available as part of the open source project QuaSi released at [30].
Acknowledgments
We would like to thank Thilo Sautter for the original idea behind GenSim and M. Norbert Fisch for supervision and advise during development of the project. Furthermore, we would like to thank all additional contributors to GenSim for their work, who are at time of writing: Simon Marx, Moira Peter and Judith Kramer.
Conflicts of Interest
The authors declare no conflict of interest. The funders had no role in the design of the study; in the collection, analyses, or interpretation of data; in the writing of the manuscript; or in the decision to publish the results.
Abbreviations
The following abbreviations are used in this manuscript:
| API | Application Programming Interface |
| BDEW | Bundesverband der Energie- und Wasserwirtschaft e.V. |
| CLI | Command Line Interface |
| CSV | Comma-separated Values |
| DIN | Deutsches Institut für Normung e.V. |
| DOE | U.S. Department of Energy |
| DWD | German Weather Service |
| EPW | EnergyPlus Weather |
| EsWest | Klimaquartier Esslingen Weststadt |
| GFA | Gross Floor Area |
| GUI | Graphical User Interface |
| HVAC | Heating, Ventilation and Air Conditioning |
| IDF | Input Data Format |
| IWU | Institut Wohnen und Umwelt |
| KfW | Kasse für Wiederaufbau |
| NFA | Net Floor Area |
| OS | OpenStudio |
| OSM | OpenStudio Model |
| OSW | OpenStudio Workflow |
| SDK | Software Development Kit |
| SIA | Schweizerischer Ingenieur- und Architektenverein |
| TMY | Typical Meteorological Year |
| VBA | Visual Basic for Applications |
| VDI | Verein Deutscher Ingenieure e.V. |
| WMO | World Meteorological Organization |
References
- Koutra, S.; Becue, V.; Gallas, M.; Ioakimidis, C.S. Towards the development of a net-zero energy district evaluation approach: A review of sustainable approaches and assessment tools. Sustain. Cities Soc. 2018, 39, 784–800. [Google Scholar] [CrossRef]
- Reinhart, C.F.; Cerezo Davila, D. Urban building energy modeling—A review of a nascent field. Build. Environ. 2016, 97, 196–202. [Google Scholar] [CrossRef]
- Risch, S.; Remmen, P.; Müller, D. Influence of data acquisition on the Bayesian calibration of urban building energy models. Energy Build. 2021, 230, 110512. [Google Scholar] [CrossRef]
- Hong, T.; Chen, Y.; Luo, X.; Luo, N.; Lee, S.H. Ten questions on urban building energy modeling. Build. Environ. 2020, 168, 106508. [Google Scholar] [CrossRef]
- Bazjanac, V.; Maile, T.; Rose, C.; O’Donnell, J.; Mrazović, N.; Morrissey, E.; Welle, B. An assessment of the use of building energy performance simulation in early design. In Proceedings of the Building Simulation 2011: 12th Conference of International Building Performance Simulation Association, Sydney, Australia, 14–16 November 2011; p. 1579. [Google Scholar]
- Bourdeau, M.; Zhai, X.; Nefzaoui, E.; Guo, X.; Chatellier, P. Modeling and forecasting building energy consumption: A review of data-driven techniques. Sustain. Cities Soc. 2019, 48, 101533. [Google Scholar] [CrossRef]
- U.S. Department of Energy. EnergyPlus™ Version 22.1.0 Documentation: Engineering Reference; U.S. Department of Energy: Washington, DC, USA, 2022. [Google Scholar]
- Ferrando, M.; Causone, F.; Hong, T.; Chen, Y. Urban building energy modeling (UBEM) tools: A state-of-the-art review of bottom-up physics-based approaches. Sustain. Cities Soc. 2020, 62, 102408. [Google Scholar] [CrossRef]
- Hong, T.; Chen, Y.; Lee, S.H.; Piette, M.A. CityBES: A Web-based Platform to Support City-Scale Building Energy Efficiency. Urban Comput. 2016, 14, 2016. [Google Scholar]
- El Kontar, R.; Polly, B.; Charan, T.; Fleming, K.; Moore, N.; Long, N.; Goldwasser, D. URBANopt: An Open-Source Software Development Kit for Community and Urban District Energy Modeling. In Building Performance Modeling Conference and SimBuild Co-Organized by ASHRAE and IBPSA-USA; National Renewable Energy Laboratory (NREL): Golden, CO, USA, 2020. [Google Scholar]
- Remmen, P.; Lauster, M.; Mans, M.; Fuchs, M.; Osterhage, T.; Müller, D. TEASER: An open tool for urban energy modelling of building stocks. J. Build. Perform. Simul. 2017, 11, 84–98. [Google Scholar] [CrossRef]
- synPRO. Fraunhofer-Institut für Solare Energiesysteme ISE, Freiburg, Germany. Available online: https://synpro-lastprofile.de (accessed on 24 July 2023).
- Tabula. Institut Wohnen und Umwelt, Darmstadt, Germany. Available online: https://webtool.building-typology.eu/ (accessed on 24 July 2023).
- Barsanti, M.; Schwarz, J.S.; Constantin, L.G.; Kasturi, P.; Binder, C.R.; Lehnhoff, S. Socio-technical modeling of smart energy systems: A co-simulation design for domestic energy demand. Energy Inform. 2021, 4, 12. [Google Scholar] [CrossRef]
- nPro. nPro Energy GmbH, Erkelenz, Germany. Available online: https://www.npro.energy/main/en/ (accessed on 24 July 2023).
- Verwiebe, P.A.; Seim, S.; Burges, S.; Schulz, L.; Müller-Kirchenbauer, J. Modeling Energy Demand—A Systematic Literature Review. Energies 2021, 14, 7859. [Google Scholar] [CrossRef]
- DesignBuilder, v7.0.2.006; DesignBuilder Software Ltd.: Stroud, UK, 2022.
- NREL. OpenStudio. Available online: https://openstudio.net/ (accessed on 23 July 2023).
- ASHRAE 90.1; Energy Standard for Sites and Buildings Except Low-Rise Residential Buildings. American Society of Heating, Refrigerating and Air-Conditioning Engineer: Peachtree Corners, GA, USA, 2013.
- Meier, H.; Fünfgeld, C.; Adam, T.; Schieferdecker, B. Repräsentative VDEW-Lastprofile; Brandenburgische Technische Universität Cottbus: Cottbus, Germany, 1999. [Google Scholar]
- Deutscher Wetterdienst: Ortsgenaue Testreferenzjahre von Deutschland für Mittlere, Extreme und Zukünftige Witterungsverhältnisse. Available online: https://www.dwd.de/DE/leistungen/testreferenzjahre/testreferenzjahre.html (accessed on 7 June 2023).
- VDI 3807 Part 2:2014-11; Characteristic Consumption Values for Buildings Characteristic Heating-Energy, Electrical-Energy and Water Consumption Values. Beuth Verlag: Berlin, Germany, 2014.
- BKI. Baukosten Gebäude Neubau—Statistische Kostenkennwerte für Gebäude; Baukosteninformationszentrum Deutscher Architektenkammern Stuttgart: Stuttgart, Germany, 2015. [Google Scholar]
- U.S. Department of Energy. Prototype Building Models, ANSI/ASHRAE/IES Standard 90.1-2013; U.S. Department of Energy: Washington, DC, USA, 2013. [Google Scholar]
- DIN V 18599 (2007-02); Energetische Bewertung von Gebäuden—Berechnung des Nutz-, End- und Primärenergiebedarfs für Heizung, Kühlung, Lüftung, Trinkwarmwasser und Beleuchtung. Beuth Verlag: Berlin, Germany, 2007.
- SIA 2024:2015; Raumnutzungsdaten für die Energie- und Gebäudetechnik. Schweizerischer Ingenieur- und Architektenverein (SIA): Zurich, Switzerland, 2015.
- Loga, T.; Stein, B.; Diefanbach, N.; Born, R. Deutsche Wohngebäudetypologie: Beispielhafte Maßnahmen zur Verbesserung der Energieeffizienz von typischen Wohngebäuden, 2nd ed.; IWU Institut Wohnen und Umwelt: Darmstadt, Germany, 2015. [Google Scholar]
- KfW. Anlage zum Merkblatt Energieeffizient Bauen—Technische Mindestanforderungen (600 000 3465); KfW: Frankfurt, Germany, 2020. [Google Scholar]
- Bundesministerium der Justiz. Gesetz zur Einsparung von Energie und zur Nutzung erneuerbarer Energien zur Wärme- und Kälteerzeugung in Gebäuden (Gebäudeenergiegesetz—GEG); Bundesamt für Justiz: Bonn, Germany, 2020. [Google Scholar]
- Official Website of the Presented Simulation Tool. Available online: www.quasi-software.org (accessed on 17 July 2023).
- Climate Neutral Urban District—Neue Weststadt Esslingen. 2023. Available online: https://neue-weststadt.de/en/ (accessed on 3 July 2023).
- Big Ladder Software LLC. Euclid; Big Ladder Software LLC: Denver, CO, USA, 2022. [Google Scholar]
- Trimble Inc. SketchUp Make 2017, Trimble Inc.: Westminster, CO, USA, 2017.
- Agentur Blumberg GmbH. Picture by Maximilian Kamps; Agentur Blumberg GmbH: Stuttgart, Germany, 2020. [Google Scholar]
- Climate Measurement Data of Germany, Climate Data Centers (CDC) of Deutscher Wetterdienst (DWD). Available online: https://opendata.dwd.de/climate_environment (accessed on 15 June 2023).
- Crawley, D.B.; Lawrie, L.K. EnergyPlus Weather Converter v8.1.0, EnergyPlus Auxiliary Program; U.S. Department of Energy: Washington, DC, USA, 2022. [Google Scholar]
- Holmgren, W.F.; Hansen, C.W.; Mikofski, M.A. Pvlib python: A python package for modeling solar energy systems. J. Open Source Softw. 2018, 3, 884. [Google Scholar] [CrossRef]
- VDI 3807 Part 1:2009-03; Characteristic Values of Energy and Water Consumption in Buildings—Fundamentals. Beuth Verlag: Berlin, Germany, 2007.
- Stickel, M.; Marx, S.; Mayer, F.; Fisch, M.N. Simulation tool for planning smart urban districts in a sustainable energy supply—Integrating several sectors in high resolution. J. Phys. Conf. Ser. 2019, 1343, 12110. [Google Scholar] [CrossRef]
- Vorspel, L.; Bücker, J. District-Heating-Grid Simulation in Python: DiGriPy. Computation 2021, 9, 72. [Google Scholar] [CrossRef]
- Schmeling, L.; Schönfeldt, P.; Klement, P.; Vorspel, L.; Hanke, B.; von Maydell, K.; Agert, C. A generalised optimal design methodology for distributed energy systems. Renew. Energy 2022, 200, 1223–1239. [Google Scholar] [CrossRef]


Disclaimer/Publisher’s Note: The statements, opinions and data contained in all publications are solely those of the individual author(s) and contributor(s) and not of MDPI and/or the editor(s). MDPI and/or the editor(s) disclaim responsibility for any injury to people or property resulting from any ideas, methods, instructions or products referred to in the content. |
© 2023 by the authors. Licensee MDPI, Basel, Switzerland. This article is an open access article distributed under the terms and conditions of the Creative Commons Attribution (CC BY) license (https://creativecommons.org/licenses/by/4.0/).