Article

Impact of Distributed Generation on the Effectiveness of Electric Distribution System Reconfiguration

by
Matheus Diniz Gonçalves-Leite
1,
Edgar Manuel Carreño-Franco
1 and
Jesús M. López-Lezama
2,*
1
Centro de Engenharias e Ciencias Exatas (CECE), Universidade Estadual do Oeste do Paraná (UNIOESTE), Av. Tarquínio Joslin dos Santos, 1300, Foz do Iguaçu 85870-650, Brazil
2
Grupo de Investigación en Manejo Eficiente de la Energía (GIMEL), Departamento de Ingeniería Eléctrica, Universidad de Antioquia (UdeA), Calle 70 No. 52-21, Medellin 050010, Colombia
*
Author to whom correspondence should be addressed.
Energies 2023, 16(17), 6154; https://doi.org/10.3390/en16176154
Submission received: 16 June 2023 / Revised: 3 August 2023 / Accepted: 22 August 2023 / Published: 24 August 2023
(This article belongs to the Section F: Electrical Engineering)

Abstract

:
Distribution system reconfiguration (DSR) is an essential activity in the operation of distribution utilities, usually carried out to lower active power losses and improve reliability metrics. The insertion of distributed generation (DG) units in electric power distribution systems (EPDS) causes the rearrangement of power flows through the conductors and changes the real power losses and voltage profile; therefore, up to a certain point, the insertion of certain quantities of DG may potentially delay or change the reconfiguration strategy of EPDS. This article presents an analysis of the impact of DG, for different locations of the units and different levels of active power supplied by them, on real power losses and on the effectiveness of DSR. The article presents tests with different distribution systems with varying sizes and topologies, showing that the allocation of DG units in buses far from the substation provided the best cost–benefit results. The DSR impact changes depending on the installment location and the generation level of the DG units, corroborating that DSR must be considered and performed using certain criteria, to maximize its efficiency.

1. Introduction

1.1. Motivation

Electric power distribution systems (EPDS) constitute a crucial part of the modern electrical grid. They are designed to deliver electrical energy from middle-voltage distribution lines to end-users such as homes, businesses, and factories. EPDS involve a complex network of transformers, cables, switches, and protective devices that work together to ensure the proper delivery of electricity; they are responsible for delivering electricity to the final consumers efficiently and reliably, while meeting quality criteria [1].
The modern world is increasingly dependent on electrical energy for a wide range of processes and applications, from powering homes and businesses to running transportation and communication systems. The growing dependence on electricity has created a pressing need for the optimization of the available energy and its efficient distribution. In addition to the need to optimize energy sources, efficient means of distributing electrical energy are also critical. The distribution of electricity involves a complex network of elements that are costly to install, operate, and maintain, underlining the importance of designing strategies to optimize their performance [2,3,4].
The operational efficiency of EPDS can be enhanced through the minimization of active power losses and the improvement of voltage profiles. EPDS utilities use different mechanisms to this end. These strategies include the optimal adjustment of transformer taps [5,6,7], reactive power compensation through the optimal allocation and sizing of capacitor banks [8,9,10], reconductoring or repowering of existing lines [11,12,13], optimal allocation of voltage regulators [14,15,16], optimal allocation of distributed generation (DG) [17,18], and optimal distribution system reconfiguration (DSR) [19].
DSR is performed by opening and closing the sectionalizing (normally closed) and tie (normally open) switches of the network, keeping a radial topology. Through DSR it is possible to reduce active power losses, redistribute power flows, improve current balance through the conductors, and enhance the voltage profile. This paper focuses on the impact of DG on the effectiveness of DSR.
DG can be defined as generation carried out together with, or close to, the final consumer [20]. Most of the benefits obtained through DSR are also achieved through the efficient allocation of DG units. In addition to improving the voltage profile, reducing real power losses, and balancing the power flow and current through the conductors, the efficient insertion of DG units makes it possible to supply demand locally in the case of contingencies and to relieve the system at peak load times.
Since the insertion of DG units and the DSR share common goals, understanding how these processes interrelate is of paramount importance for the optimization of an EPDS’s operability. There is extensive literature on DSR; however, few works have approached the relationship between DG and DSR. The most relevant research works on this issue are mentioned in the next subsection.

1.2. Literature Review

There are several drivers for the deployment of DG in electric EPDS. One of them is the limited availability of natural resources used to generate electricity. Fossil fuels, which have traditionally been the primary source of electrical energy, are finite and are becoming increasingly scarce and expensive to extract. As a result, there is a growing focus on alternative sources of energy. This has motivated the proliferation of DG, especially based on renewable resources such as solar, wind, and hydroelectric power. The optimal location and sizing of DG in EPDS has been widely explored in the specialized literature.
Although there are analytical approximations for the optimal placement of DG, such as those reported in [18,21], due to the non-convex nature of the problem, metaheuristic techniques have been mostly used to solve the optimal placement of DG in EPDS. Metaheuristics are search techniques designed to solve complex problems where traditional methods struggle, due to their computational intractability or lack of a specific problem structure. They are usually inspired by natural or physical phenomena, such as the behavior of certain organisms or the evolution of species.
Particle swarm optimization (PSO) is a metaheuristic inspired by the social behavior of birds flocking or fish schooling. In this technique, solution candidates to the optimization problem are represented by a group of particles that move through the search space to find the best solution. Each particle adjusts its position based on its own best-known solution (local best) and the best-known solution found by any particle in the swarm (global best). In [22], the authors used a two-step PSO and differential evolution (DE) to determine the optimal allocation and generation level of DG units. PSO was also used in [23] for the optimal allocation of DG, aiming for active loss reduction through a linearized AC load flow. A multi-objective PSO was proposed in [24] for the optimal location and placement of DG in EPDS; as a novelty, the optimization was carried out from both the owner’s and distribution company’s viewpoints.
Genetic and evolutionary algorithms are search techniques inspired by the process of natural selection and evolution. These algorithms mimic the principles of genetics, reproduction, mutation, and survival of the fittest to solve complex optimization problems [25]. In [26], the optimal allocation of DG is carried out using a genetic algorithm (GA) and PSO. In this case, the objective is to minimize annual energy losses and the voltage deviation index. In [27], the authors developed an adaptive GA for the optimal DG allocation in radial distribution networks under uncertainties of load and generation, which were modeled using a fuzzy-based approach. Other applications of GA for the optimal location of DG in EPDS were reported in [28,29,30,31].
Harmony search (HS) is a metaheuristic optimization algorithm inspired by the process of musicians improvising harmonious melodies. In HS, potential solutions to the optimization problem are represented as musical harmonies that evolve over iterations. The harmonies are evaluated based on their fitness, representing how well they satisfy the objective function. New harmonies are generated through a combination of elements from existing harmonies, imitating improvisation in music. The process continues until convergence, and the best harmony represents the solution to the optimization problem. In [32], the authors presented a multi-objective HS for optimal placement of DG in PDS. In this case, minimum power losses, minimum voltage deviation, and maximal voltage stability margin are considered as the optimization objectives.
In [33], a gravitational search algorithm was proposed for the optimal placement and sizing of DG. In [34], the optimal location and sizing of DG was carried out as a multi-objective optimization problem through an improved decomposition-based evolutionary algorithm. In this case, the authors pretended to minimize real power losses and voltage deviation, while maximizing the voltage stability index. Other metaheuristic techniques used for the optimal placement and sizing of DG include the Kalman filter algorithm [35], grey wolf optimizer [36], artificial bee colony algorithm [37], shark optimization algorithm [38], and moth flame optimization [39], among others. Literature reviews on the optimal allocation and sizing of DG can be consulted in [40,41,42,43].
EPDN operate radially to facilitate protection coordination and lower investment costs [44]; nonetheless, these systems are designed in a meshed fashion, so that different substations or feeders can take some extra load from users. The optimal reconfiguration of distribution networks allows the redistribution of loads among feeders, which may result in lower active power losses, increased reliability, and better voltage profiles.
In 1957, Prim presented an algorithm capable of finding the minimum spanning tree connecting a set of points [45]. The proposed algorithm is especially interesting for application in EPDS, since the spanning tree obtained is always radial. Civanlar et al. [46] presented, for the first time, the branch exchange (BE) heuristic that allows finding new radial configurations through state permutations of the system switches. The BE approach requires few parameters for its execution and has a simple and robust implementation. In [47], a mathematical expression is presented for the approximate calculation of the real power loss variation after the execution of the BE, which greatly reduces the computational effort. In [48], the authors presented a heuristic that uses the meshed configuration, where the real power losses are lower than those in the radial configuration. This heuristic is used as a guide to choose which switch should be opened in each iteration. The heuristic presents low computational effort and is able to significantly reduce the real power losses of an EPDS compared to its initial configuration. The authors in [49] presented a metaheuristic applied to the DSR that hybridizes the concepts presented in [46,48].
In [50], a discrete PSO was proposed to carry out DSR for loss reduction and load balancing. In [51], the authors presented a DSR strategy using a hybrid PSO algorithm, which was compared with a GA and a cuckoo search algorithm. In [52], the authors implemented an enhanced artificial immune system to solve the DSR problem. In this case, multi-objective optimization was carried out with fuzzy variables, minimizing power losses, voltage deviation, and feeder load balancing. In [53], a refined GA was proposed to solve the DNR problem for power loss minimization. The authors in [54] proposed a non-revisiting GA to determine the best distribution network configuration for power loss reduction. Other applications of GAs to solve the DNR problem are presented in [55,56].
The combined DSR and optimal allocation of DG units has also been explored in the specialized literature, mainly with the aim of reducing active power losses. A HS algorithm was proposed in [57] for the simultaneous DNR and optimal placement of DG units in EPDS. In this case, sensitivity analyses were carried out to identify optimal locations for the installation of the DG units. In [58], a variation of the moth swarm algorithm (MSA) was used with the multi-goal function of reducing real power losses, minimizing voltage deviation and the number of switching operations, as well as improving the load balance. In [59], the optimal reconfiguration and DG allocation were combined in a multi-objective approach that considered system loadability enhancement and network loss minimization. In [60], the DNR problem was solved by means of a firefly optimization (FO) algorithm considering the optimal DG sizing. In [61], the DNR and optimal DG sizing problems were solved simultaneously considering the objectives of minimizing active power loss, voltage deviation, and carbon emission, while in [62], a whale optimization algorithm was implemented for the DG sizing and placement, along with network reconfiguration for loss reduction and improvement of the voltage profile. In [63], the authors proposed a distribution reconfiguration approach based on a hybrid optimization algorithm, which combined a GA with PSO for minimizing active power losses and improving voltage profiles in EPDS.
The optimal location and sizing of DG, as well as the optimal DSR, have been extensively studied in the specialized literature. Nonetheless, as evidenced in the literature review, few studies have approached both problems simultaneously; and out of these, none assessed the impact of DG on the effectiveness of DSR. Instead, they combined both optimization problems to find a single solution that usually aimed at minimizing power losses and improving voltage profiles.

1.3. Paper Contributions and Organization

Although DSR, as well as the optimal allocation of DG in EPDS, are two widely studied topics, there are no papers that analyze in detail the impact of sub-optimal allocations of DG units on the effectiveness of DSR. Therefore, the main contribution of this work is an analysis of the impact of the insertion of DG units on active power losses and on the effectiveness of DSR. This was carried out using several test systems, with the objective of drawing relevant conclusions that make it possible to consider which technique (DSR and optimal allocation of DG), or both, is more efficient in reducing active power losses.
The rest of this document is organized as follows: Section 2 presents the general mathematical formulation of DSR; Section 3 describes the metaheuristic approach used to solve DSR; Section 4 presents a detailed description of the test systems; in Section 5, the results obtained are discussed; and, finally, the conclusions of the study are presented in Section 6.

2. Mathematical Formulation

DSR is usually carried out with the aim of reducing active power losses. Therefore, the objective function considered in this paper is presented in Equation (1). In this case, n s represents the set of branches that are either initially open or closed, which in turn are associated with sectionalizing and tie switches, respectively. R n is the resistance of the nth branch, I R , n and I I , n are the real and imaginary components of the current associated with the nth branch.
M i n n = 1 n = n s R n · I R , n 2 + I I , n 2
The objective function presented above is subject to a set of equality and inequality constraints that are described as follows.

2.1. Equality Constraints

Equation (2) indicates the apparent power flow balance in all buses of the network. In this case, S j , i n is the total apparent power that flows towards bus j, S j , G is the total apparent power that is generated at bus j, S j , o u t is the total apparent power going out from bus j, S j , d m n d is the total apparent power that is demanded at bus j, and n b is the number of buses. Furthermore, Equations (3) and (4) are necessary conditions to guarantee the radiality of the network. In this case, B j is a binary variable that assumes one (1) if the bus j is energized and zero (0) otherwise, and B n is a binary variable that assumes one (1) if the branch n is closed (sectionalizing switch) and zero (0) otherwise (tie switch).
S j , i n + S j , G S j , o u t = S j , d m n d j n b
n = 0 n = n s B n = n b 1
j = 0 j = n n B j = n b

2.2. Inequality Constraints

The inequality constraints of DSR are indicated by Equations (5) and (6), which indicate the voltage and current limits, respectively. In this case, V j is the voltage magnitude at bus j, V m i n and V m a x indicate the minimum and maximum voltage magnitudes allowed, respectively; I n is the current flowing through branch n; and, finally, I n m i n and I n m a x are the minimum and maximum current limits of branch n, respectively. Minimum and maximum voltage limits are usually between 0.9 and 1.1 p.u, respectively; on the other hand, the maximum current limit is given by the rms thermal limit of the nth branch ampacity, while the minimum current limit is usually taken as this same value in the opposite direction.
V m i n V j V m a x j n b
I n m i n I n I n m a x j n s

3. Methodology

In order to measure the impact of DG in the DSR problem, the latter was implemented using a well-known technique; then, different penetration scenarios of DG were evaluated. This section describes both, the proposed technique to solve the DSR problem and the participation scenarios of DG.

3.1. Metaheuristic Approach Used to Solve the DSR Problem

The metaheuristic used for the tests in this paper was based on methodologies widely established in the specialized literature. The reason for using this approach to solve the DSR problem lies in the fact that it achieved the most common solutions for the different test systems found in the specialized literature; therefore, it is considered a proven methodology. Note that the objective of this paper was not to solve DSR but to analyze the impact of DG within DSR; therefore, any other proven methodology to solve DSR may be adopted. The Prim methodology was used to generate an initial reconfiguration [45]. In this case, the goal is to find a maximum spanning tree where the weights assigned to the branches are numerically equal to the power that flows through each branch in the meshed configuration. The solutions found using the Prim algorithm are radial connected graphs, or trees, with one, and only one, path between each pair of nodes. Thus, the Prim method is especially interesting for applications related to distribution systems, where the radiality constraint is commonly present. Figure 1 illustrates a flowchart of the adopted Prim algorithm. In this case, the weights are assigned as follows: the branch with the highest power flow in the meshed configuration (with all candidate branches closed) is assigned the lowest weight. Then, sequentially and in decreasing order of power flow magnitude, increasing and integer weights are assigned to all branches. The proposed assignment of weights prioritizes the selection of branches through which the largest power flows in the meshed configuration. In this heuristic, the configuration in which the active losses are lower than in the radial configuration serves as a guide for decision-making, aiming for a radial configuration in which the system is minimally disturbed compared to the meshed configuration.
For the local search stage, the algorithm uses the branch exchange heuristic and the approximate loss variation equation presented in [46]. The power flow algorithm is solved using the traditional backward forward sweep (BFS), a consolidated and widely used tool in DSR problems. The implementation used is similar to the one presented in [64].
The BFS power flow approach is an iterative algorithm used to compute power flows in distribution systems. It is particularly suitable for radial distribution networks, where power only flows in one direction from the substation to the loads. As the name suggests, this algorithm proceeds in two steps: the backward and forward sweep.
In the backward sweep, the algorithm starts at the load buses and propagates the known load information towards the substation. At each node, the real and reactive power demands are subtracted from the incoming line’s power, allowing the calculation of the voltage magnitude and phase angle at each node. This process continues until reaching the substation, where the initial voltage values are known.
Once the backward sweep is carried out, the forward sweep begins from the substation. It starts with the known voltage values at the substation and propagates towards the load nodes. At each node, the real and reactive power injections are calculated based on the incoming line’s voltage and the impedance of the lines. The process continues until the voltages at all nodes converge to a stable solution. The process repeats iteratively until the convergence criteria are met.
Table 1 presents the real power losses of the initial configuration, the configuration obtained after using the Prim algorithm, the configuration obtained after the local search (branch exchange), and the results available in the specialized literature for the same test systems in the absence of DG.
Note that for the 14- and 33-bus test systems, the algorithm found the same optimal solutions reported in the specialized literature. For the 84- and 415-bus test systems, the algorithm found high-quality sub-optimal solutions. These results are presented to validate the implemented methodology.

3.2. Proposed Methodology to Measure the Impact of DG

To measure the impact of DG on DSR, first, the DSR problem is solved without DG to obtain a base case; then, DG is increased systematically in different scenarios chosen strategically to determine for which DG insertion levels and scenarios it is necessary to perform a reconfiguration. In each iteration, the generation level of the DG units is increased, in previously defined increment steps, until 100% of the system’s active power demand is supplied by DG. In each iteration, the local search (branch exchange) is performed again. The final solution found in each iteration is the initial solution for the next one. A flowchart of the proposed algorithm is presented in Figure 2. Each test system is submitted to three scenarios of DG unit allocation.
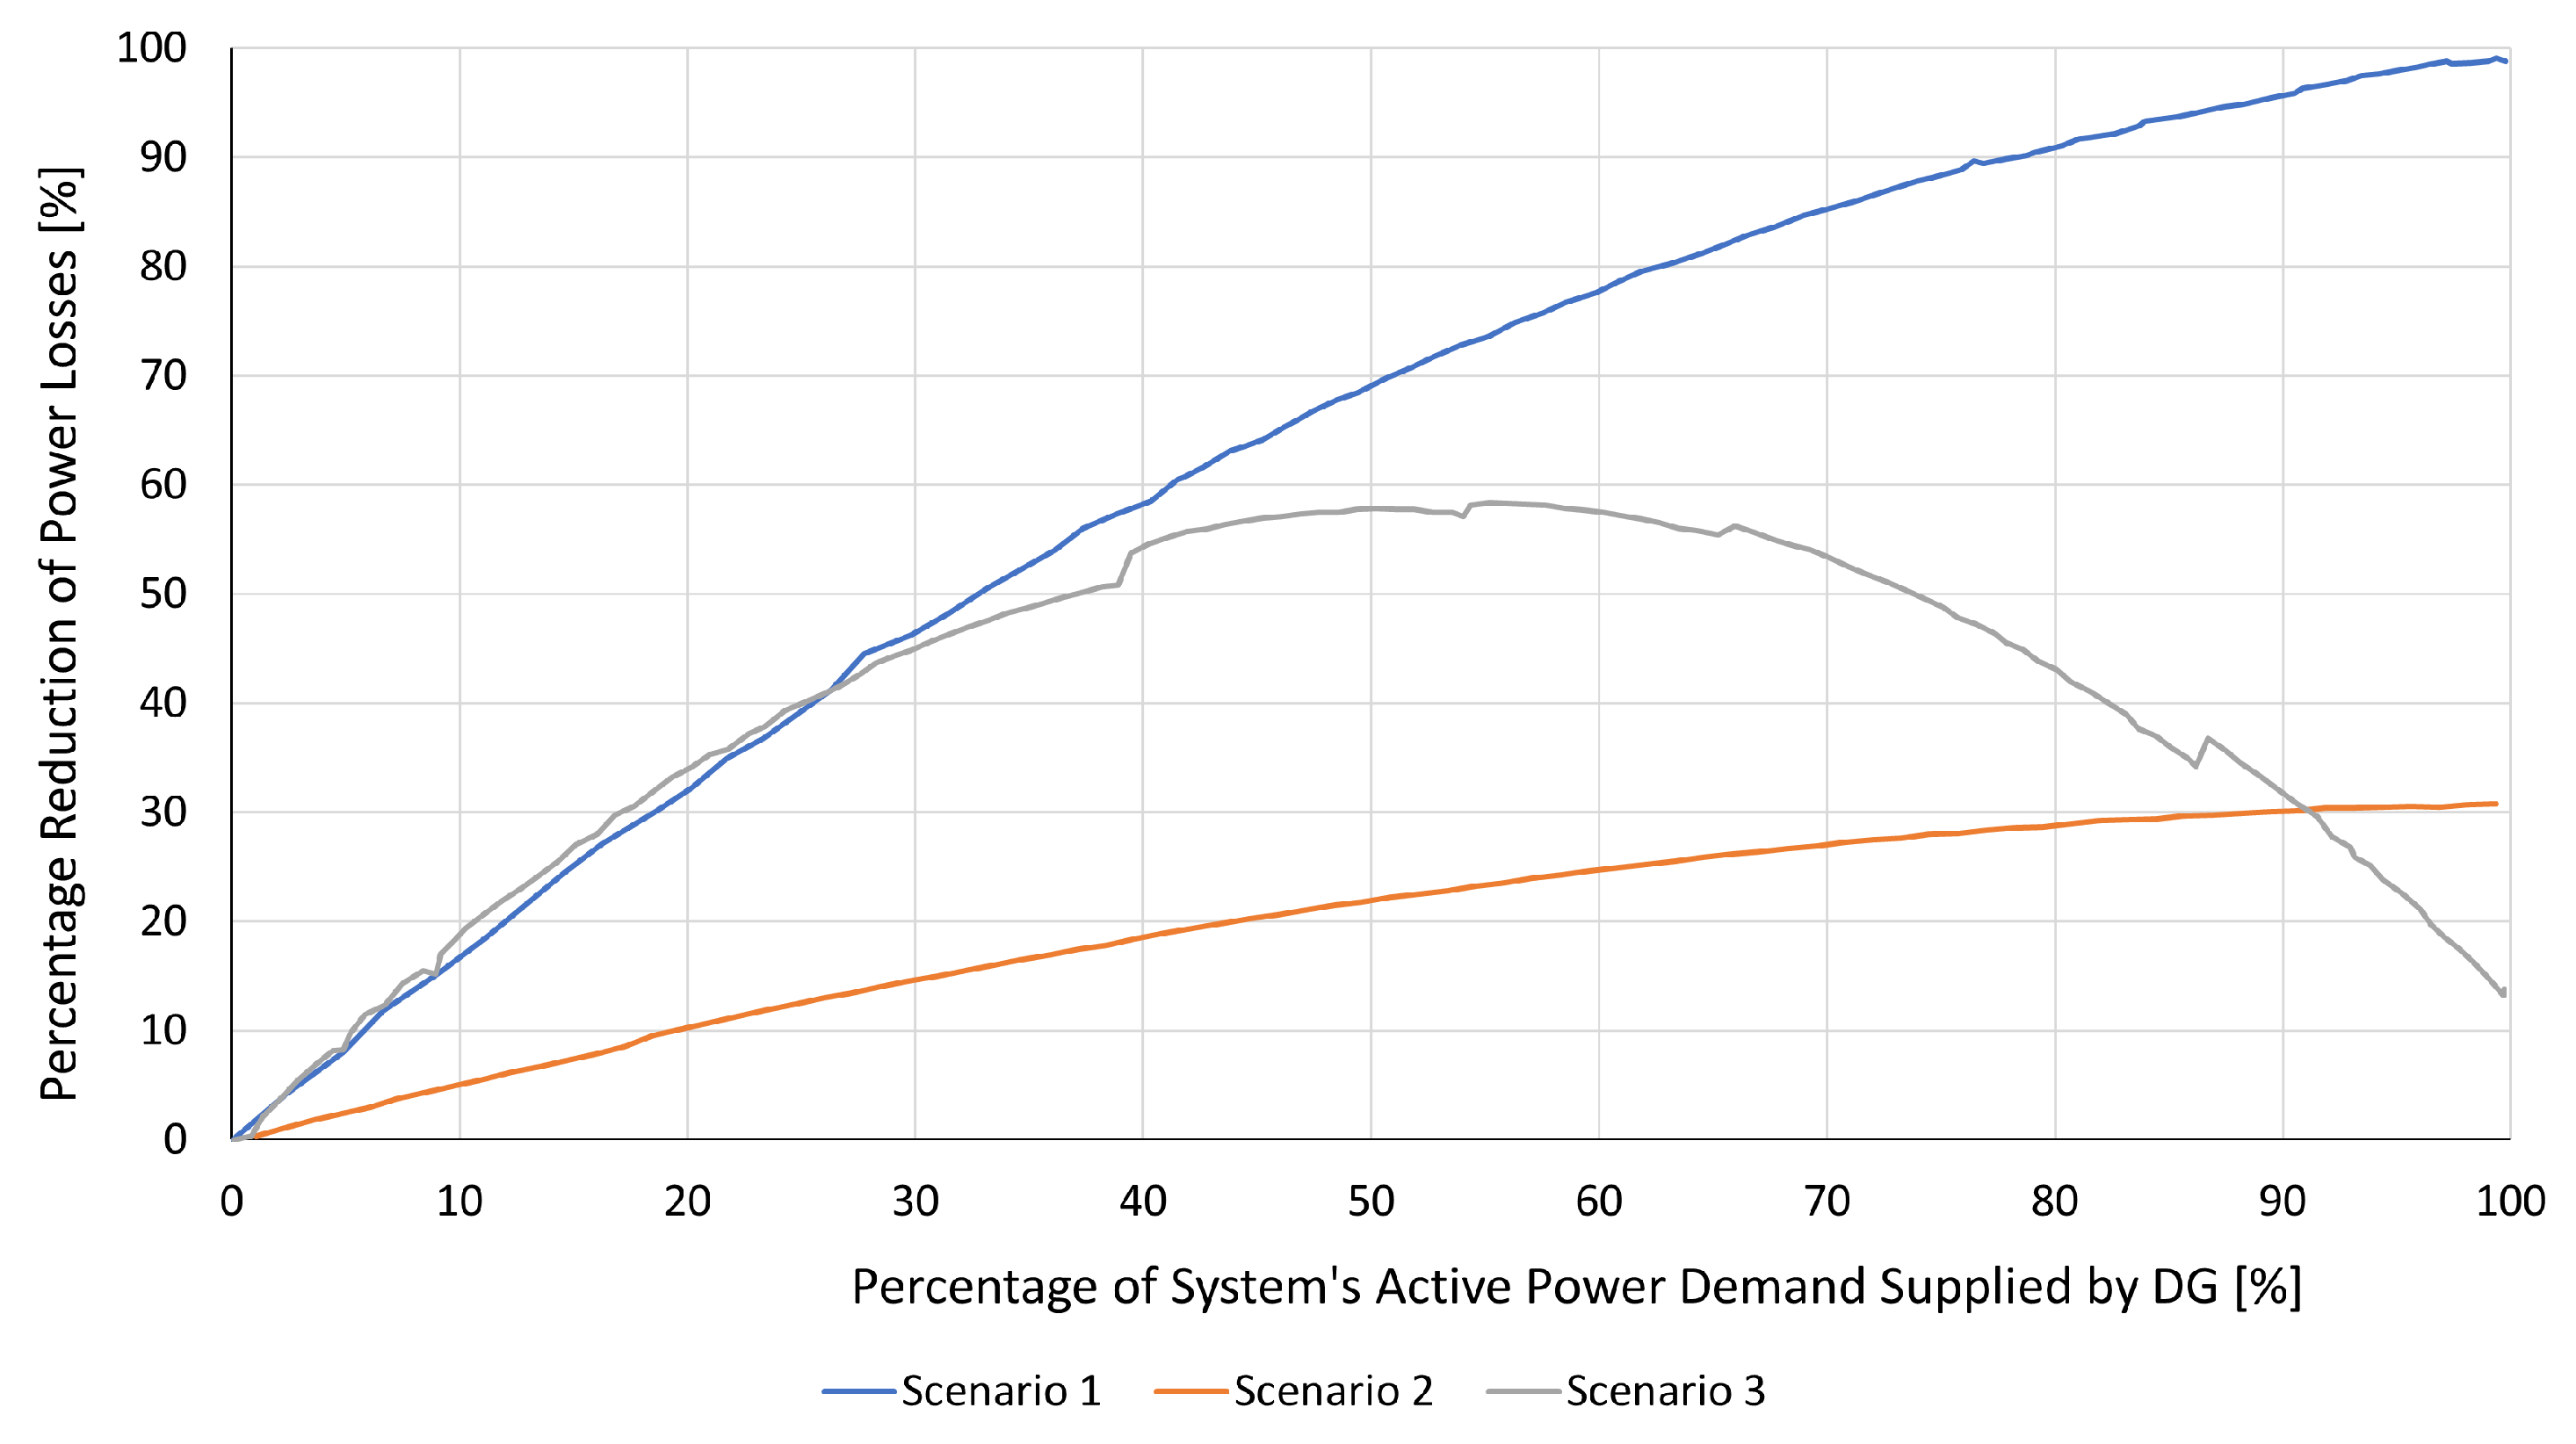
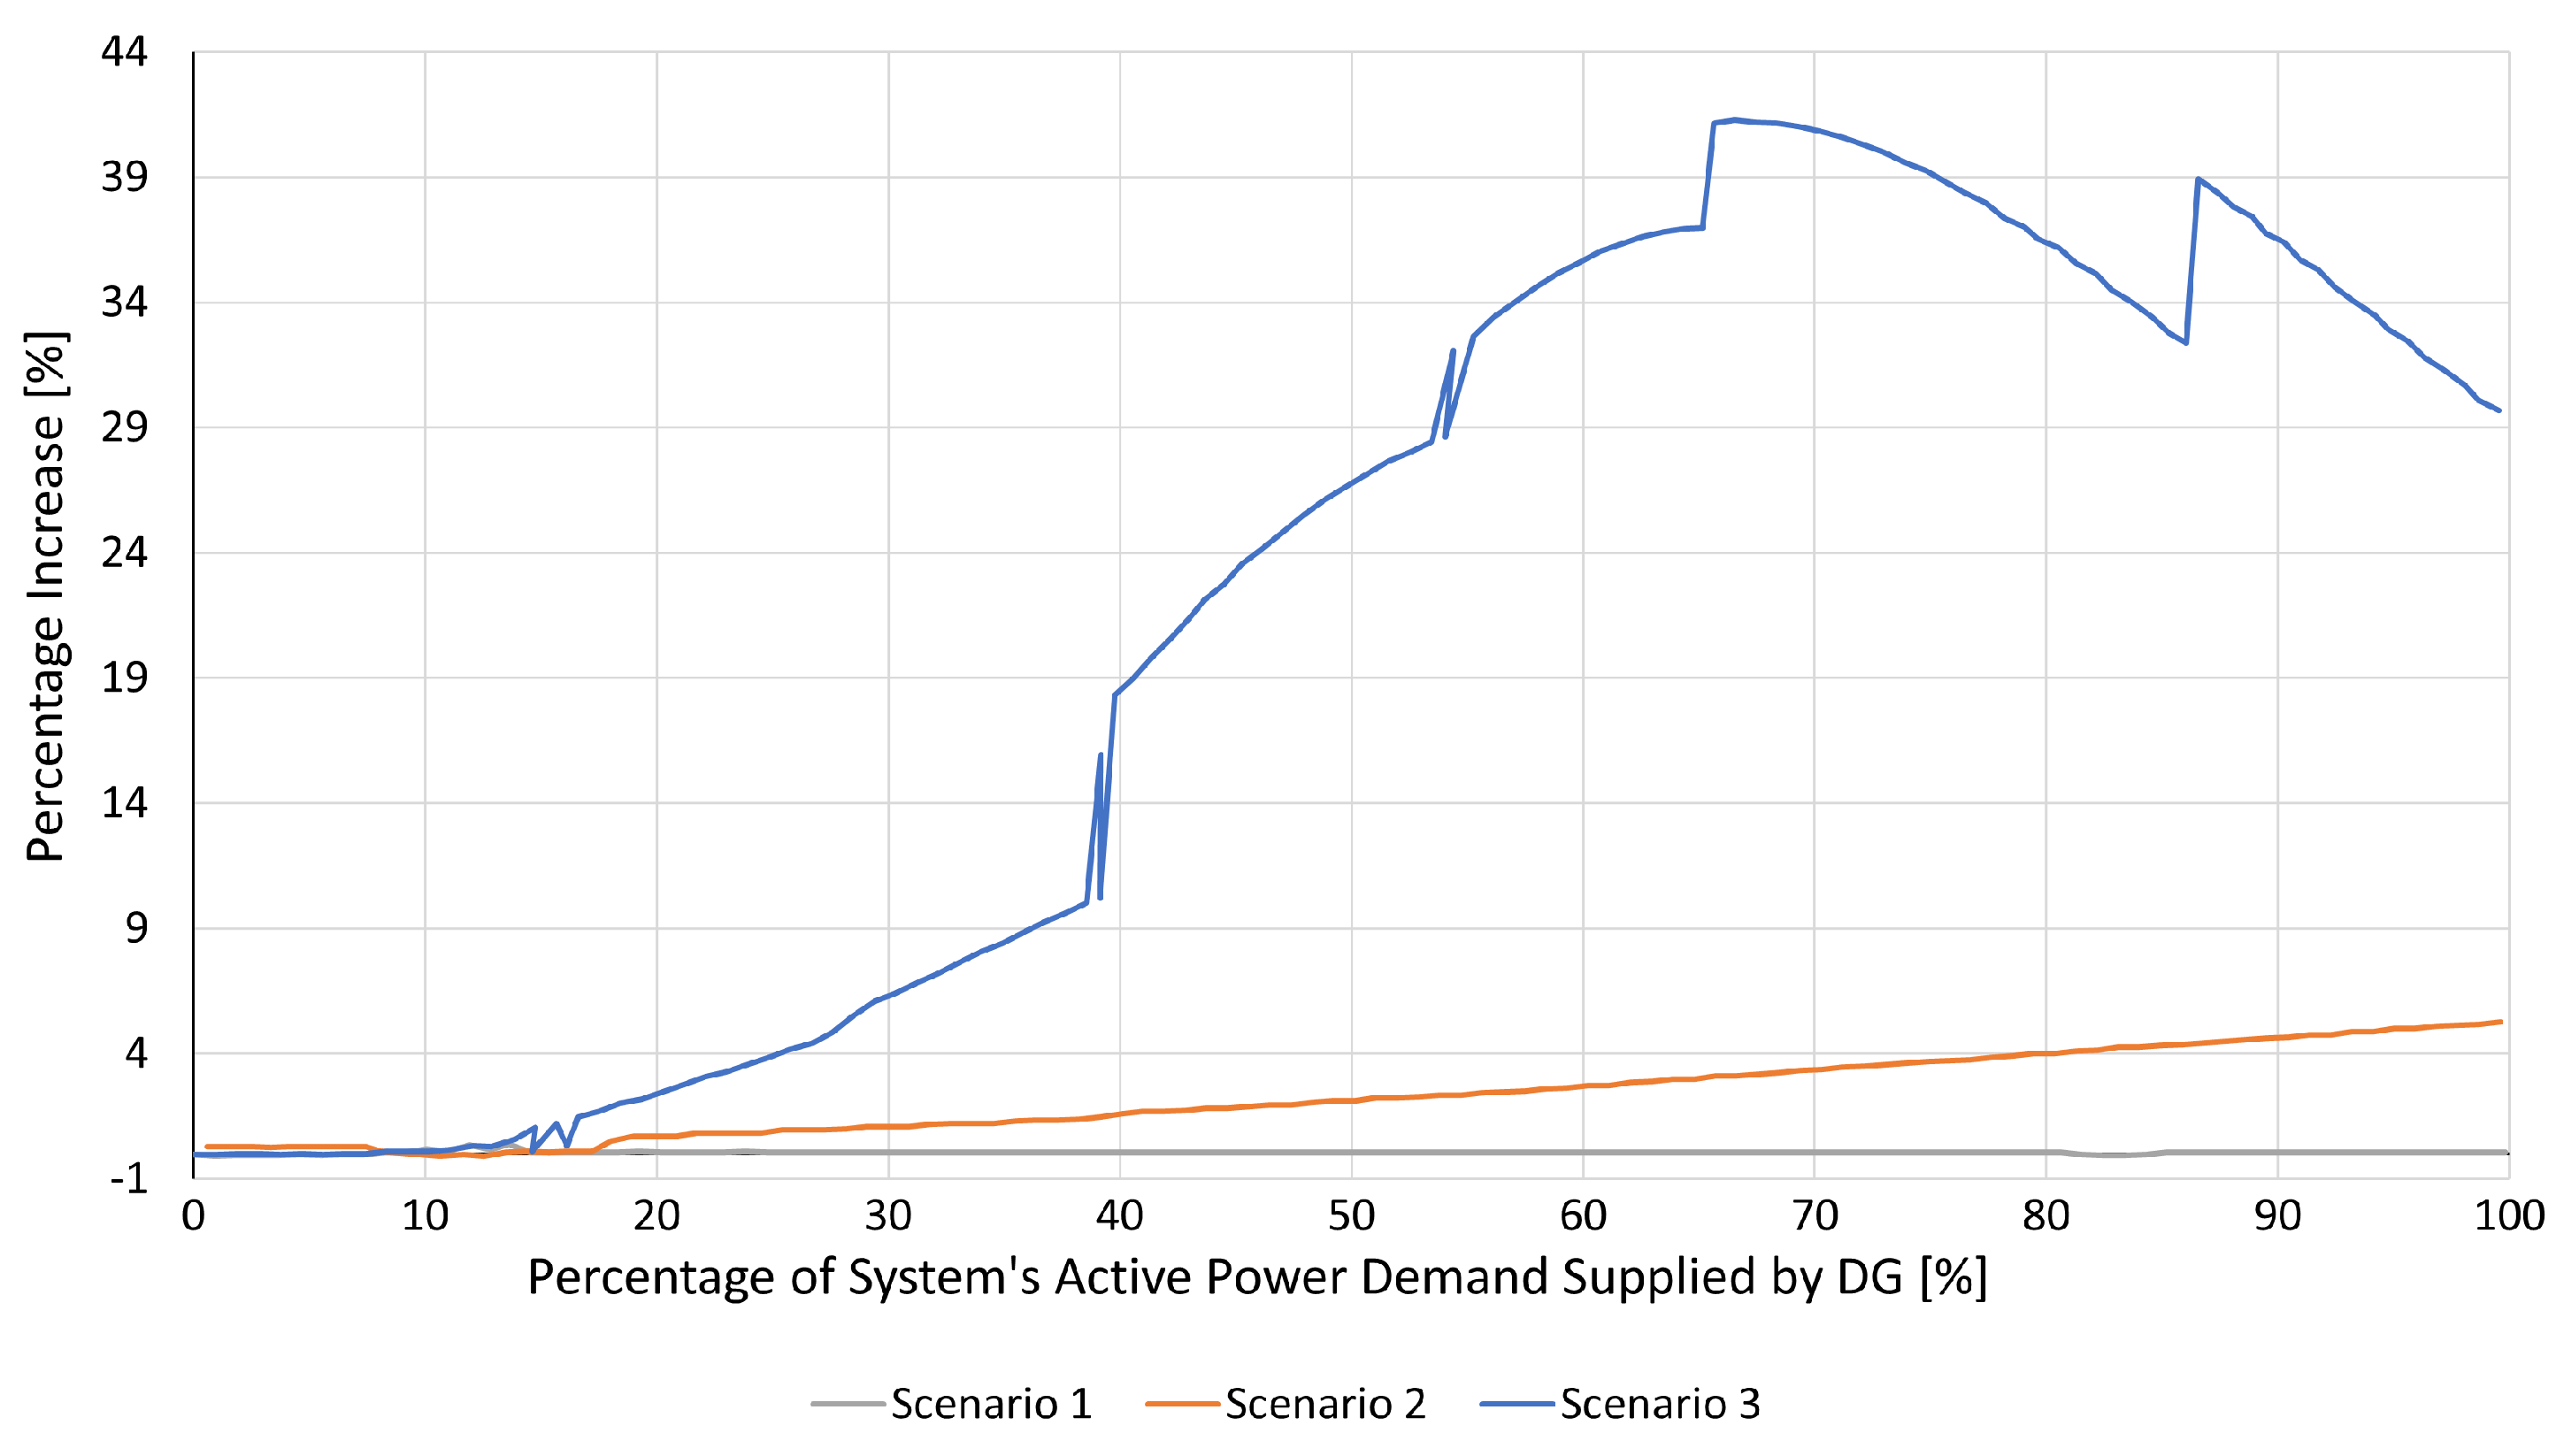
  • Scenario 1: DG units allocated at all system buses. In this case, the generation of each DG unit is limited to the active power demand at the bus where it is installed, and there is no inverse flow of active power in the buses. A progressive and continuous reduction in real power losses in the system is expected with the increase in active power supplied by the DG units, since the increase in generation implies a reduction in the magnitude of the currents flowing through the conductors. Scenario 1 corresponds to an ideal situation, in which all users have some sort of generation and are able to provide their own energetic needs but do not inject power into the network;
  • Scenario 2: DG units in buses near the substation. In this scenario, the power flow will remain mostly descendant. Significant reductions in real power losses are expected in the branches close to the substation, in which a more significant reduction in the magnitude of currents will be observed. This scenario explores a situation in which the most heavily loaded feeders (those close to the substation) are most benefited by the location of DG units;
  • Scenario 3: DG units on buses far from the substation. In this case, until a certain level of generation, there will be a progressive reduction in the magnitude of the currents that travel to the lower bus layers of the system. However, for higher levels of DG generation, an increase in the current that flows from the buses on which the DG units are installed is expected. Scenario 3 represents one of the most common approaches to DG allocation, far away from the substations where it can improve voltage profiles and reduce active power losses.
The three scenarios proposed in this article seek to cover a wide range of situations that occur in distribution systems, with respect to the location and sizing of DG, which is increasingly common in these systems.

4. Test Systems

Four test systems were used to evaluate the impact of DG on the DSR problem. These systems are well-known in the specialized literature and their data are available to the scientific community so that results are reproducible. In all test systems, continuous lines indicate normally closed switches; while dashed lines are normally open switches used for reconfiguration purposes.

4.1. 14-Bus Test System

The 14-bus test system was originally presented in Civanlar et al. [46]. It has three tie switches, one substation, a rated voltage of 23 kV (1 p.u.), total active power demand of 28.70 MW, a total reactive power demand of 5.90 MVAr, and voltage limits of 0.93 to 1.05 p.u. Figure 3 illustrates the 14-bus test system.
Table 2 presents the buses selected for the allocation of DG units in scenarios two and three.
Figure 4 illustrates the DG location in scenarios 2 and 3, in which the buses where the DG units would be allocated are illustrated in red and blue, respectively.

4.2. 33-Bus Test System

The 33-bus test system, shown in Figure 5, was originally presented in Baran and Wu [68]. It features five tie switches, one substation, a rated voltage of 12.66 kV (1 p.u.), a total active power demand of 3.71 MW, a total reactive power demand of 2.31 MVAr, and voltage limits of 0.93 to 1.05 p.u. The dotted lines are the initially open (tie) switches. Table 3 presents the buses selected for the allocation of DG units in scenarios two and three.
Figure 6 depicts the DG units of this test system in scenarios 2 and 3, in which the buses where the DG units would be allocated are illustrated in red and blue, respectively.

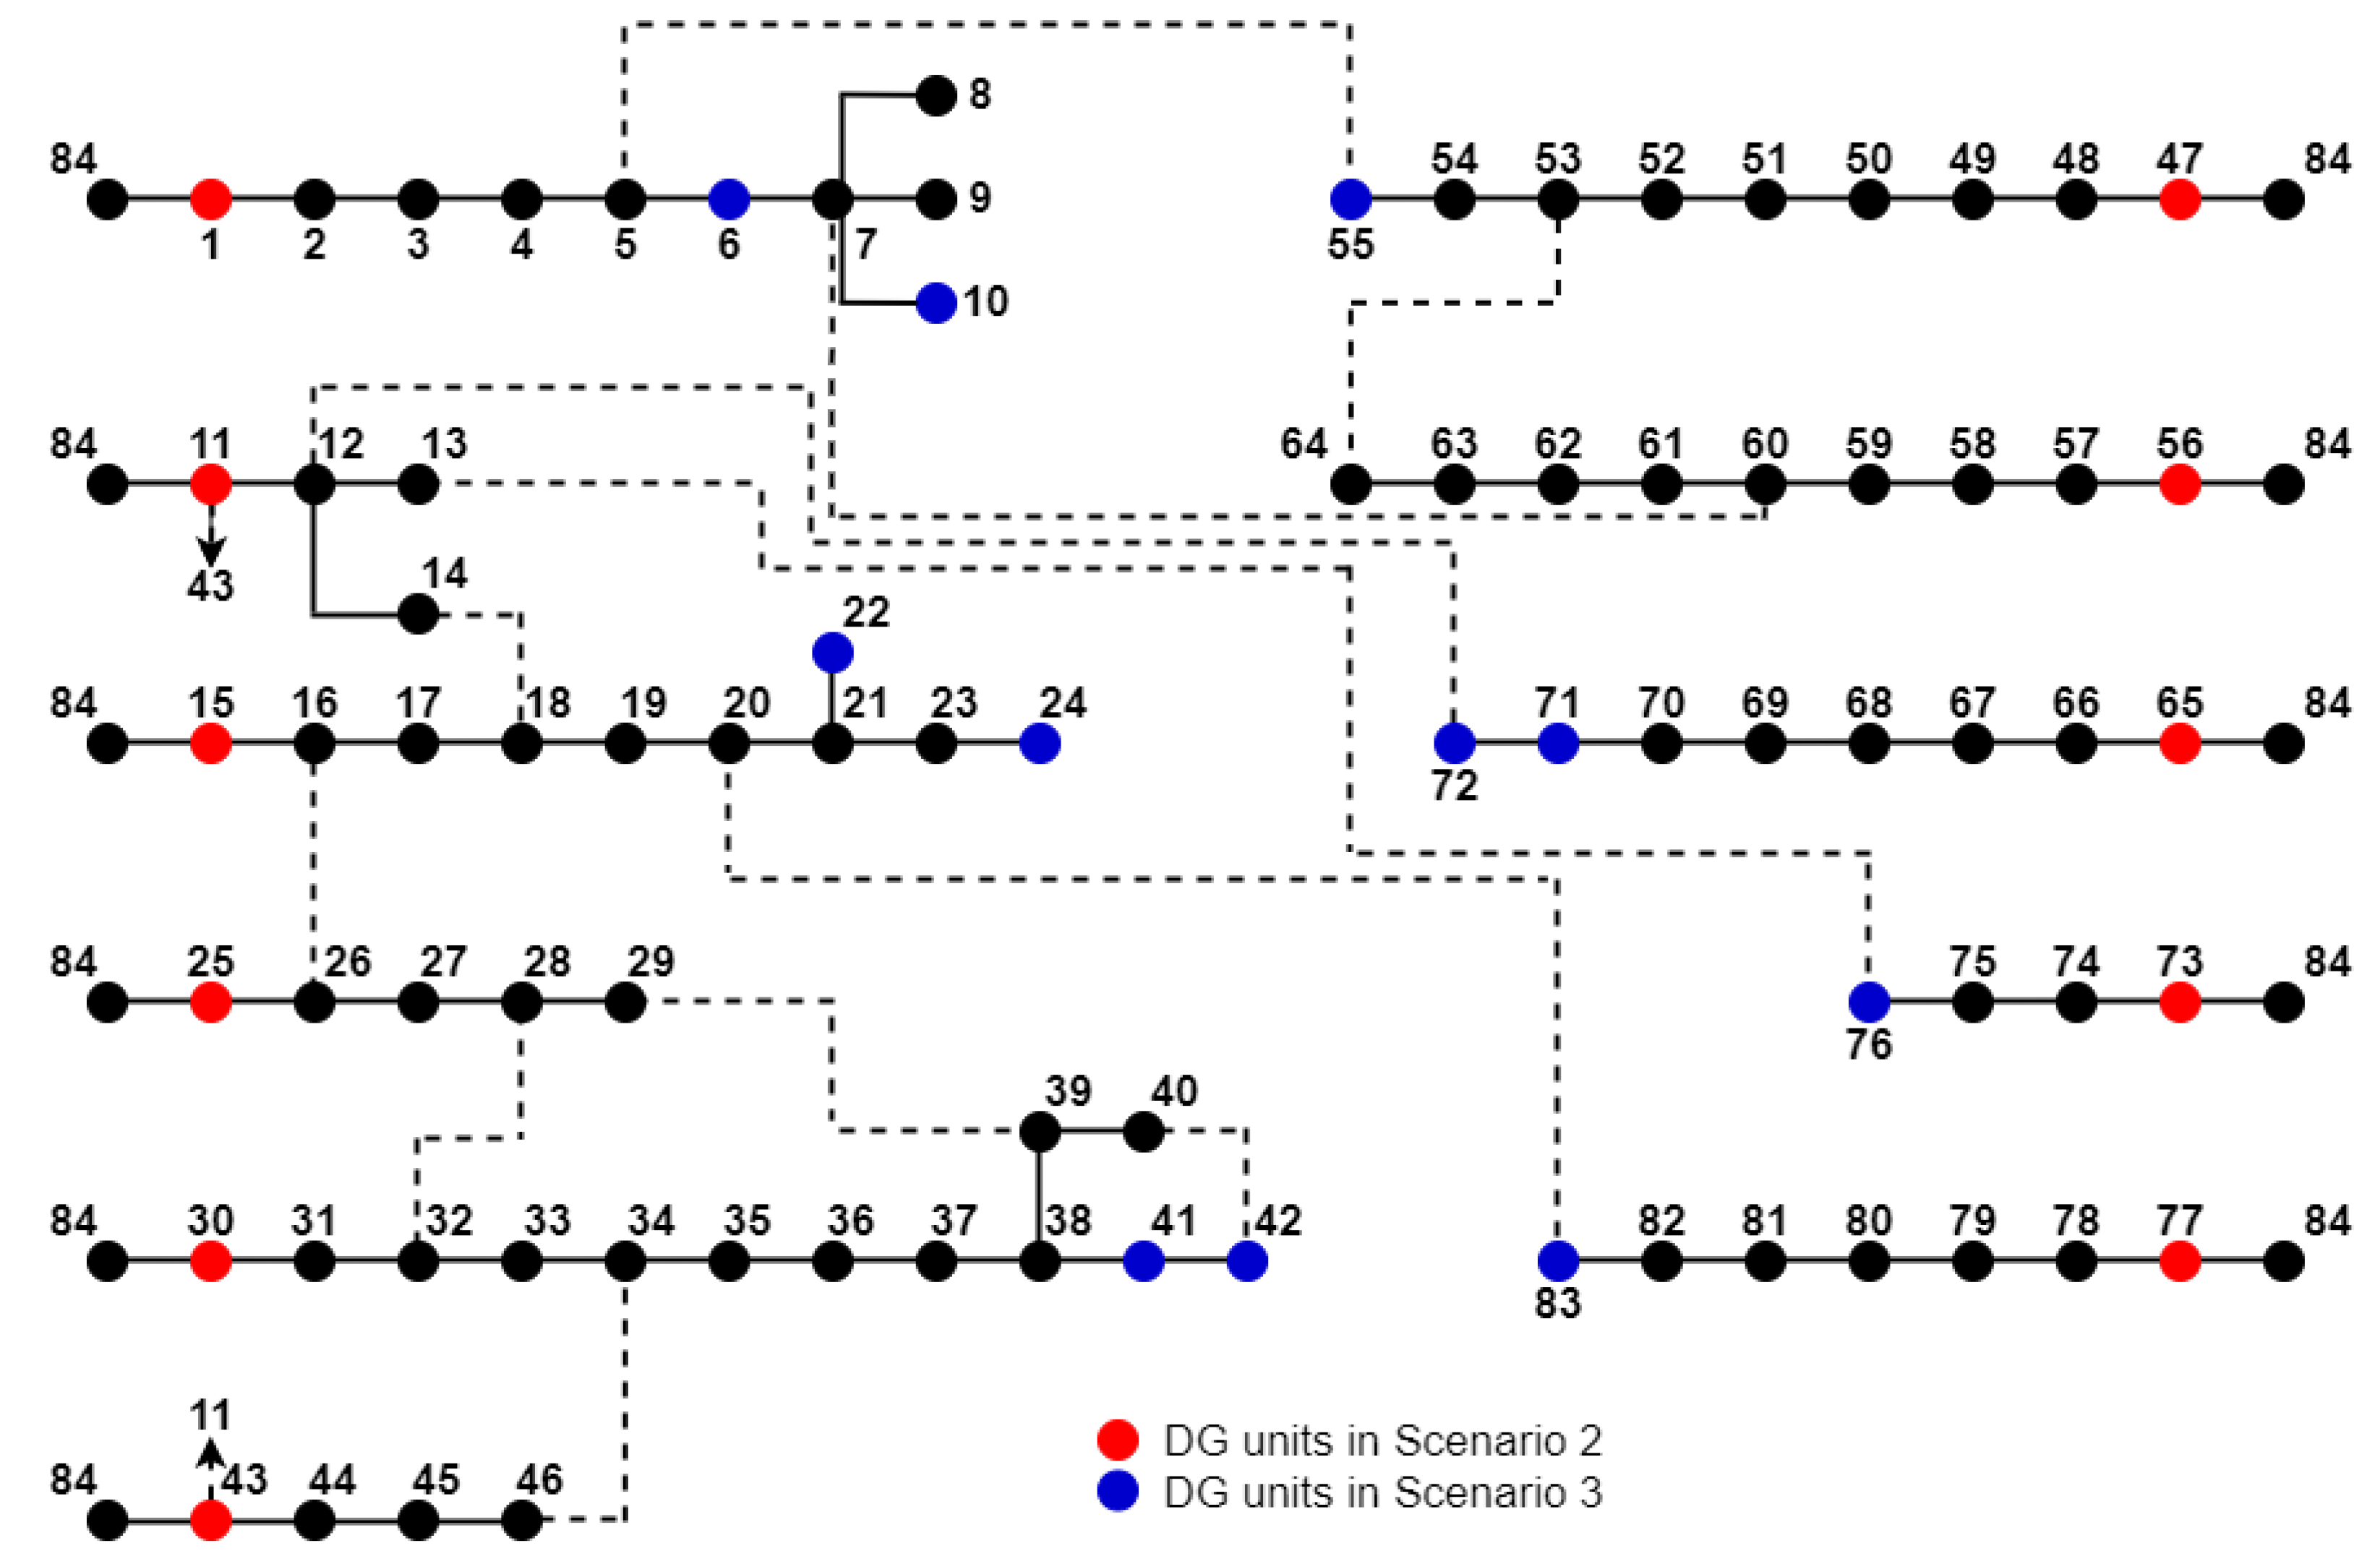
4.3. 84-Bus Test System

The 84-bus test system was originally presented in Chiou, Chang and Su [65]. It has 13 tie switches, one substation, a rated voltage of 11.40 kV (1 p.u.), a total active power demand of 28.35 MW, a total reactive power demand of 20.37 MVAr, and voltage limits of 0.93 to 1.05 p.u. Figure 7 depicts the 84-bus test system. Table 4 presents the buses selected for the allocation of DG units in scenarios two and three.
Figure 8 depicts the DG units of this test system in scenarios 2 and 3, in which the buses where the DG units would be allocated are illustrated in red and blue, respectively.

4.4. 415-Bus Test System

The 415-bus test system was originally presented in Bernal-Agustín [69]. It has 59 tie switches, one substation, a rated voltage of 10 kV (1 p.u.), a total active power demand of 27.37 MW, a total reactive power demand of 13.24 MVAr, and voltage limits of 0.93 to 1.05 p.u. Table 5 presents the buses selected for the allocation of DG units in scenarios two and three.

5. Results and Discussion

5.1. Presence of DG in the System

Before introducing DG into the distribution system, the initial solution (Prim) and local search (branch exchange) stages are applied. In this way, the approach starts from a topology that minimizes power losses, without the presence of DG. These results have already been presented in Table 1. From this initial solution, the DG units are allocated as indicated in Table 2, Table 3, Table 4 and Table 5 and their active power output is progressively increased. From this point forward, a new reconfiguration is carried out every time DG reaches a certain level, and this new topology is used as a starting point until the DG provides all the active power of the system.
Different values of active power supplied by DG were simulated, ranging from 0 to 100% of the total active power demand of the system. The goal was to analyze the behavior of the real power losses for different scenarios, to understand the impact of different sub-optimal allocations of DG units. In each scenario, an increment was mage in the generation level of the DG units at each iteration. The increment was chosen through trial and error, aiming to satisfactorily capture the behavior of the system without demanding an excessive number of iterations. This value was varied according to the characteristics of the size, demand, and arborescence of each test system.
For scenario 1, in each iteration, an increase of 10 kW in the generation of each DG unit was mage in the 14- and 84-bus test systems, with an increase of 1 kW in the generation of each DG unit of the 33- and 415-bus test systems. For scenarios 2 and 3, in each iteration, an increase of 30 kW in the generation of each unit of the 14-bus system was made, with an increase of 3 kW in the units of the 33-bus system and an increase of 10 kW in the units of the 84- and 415-bus systems.
In all scenarios and for all test systems, PQ-type DG units with a power factor of 0.9 were considered. If the reactive power demand was supplied before the end of the algorithm, the power factor was corrected, from this point to the unity. Figure 9 illustrates the reduction in real power losses as a function of the active power demand supplied via DG for the 84-bus test system. The reference values are the real power losses before the DG insertion stage, as shown in Table 1. Scenario 3 is where these discontinuities became more evident. The graphs of the other test systems presented a similar behavior, following the same trends as the 84-bus test system for scenarios 1, 2, and 3.
As expected, in scenario 1, the real power losses progressively decreased with the increase in active power supplied by the DG units. For all test systems, an initial trend with an approximately linear behavior was observed, followed by another with approximately asymptotic behavior (see blue dots in Figure 9). For values of active power supplied by DG up to approximately 20% of the total active demand, the reduction in real power losses was almost linearly proportional to the increase in the generation of DG units. From then on, the rate of reduction (derivative) of the real power losses started to decrease, requiring greater increments in the generation of DG units for an equal amount of loss reduction.
In scenario 2, the real power losses also decreased with the increase in the active power supplied by DG. This scenario presented an asymptotic behavior of loss reduction, with a slow variation rate compared to the other two scenarios. The advantage of this scenario is that it does not require as many DG units as scenario 1 and shows a continuous reduction tendency, since the power flows in the system remained mostly downwards. For the same percentage of active demand supplied by DG, scenario 2 showed a lower reduction in real power losses than scenario 1, for the entire search space, and lower than scenario 3, for a large part of it.It is noteworthy that the maximum loss reduction achieved in scenario 2 decreased as the test system became larger. For the 14-bus test system, it achieved reductions of just over 60% in real power losses, while for the 415-bus test system, the maximum reduction was just under 20%.
In scenario 3, there was a roughly parabolic behavior of real power loss reduction with the increase in active power demand supplied by DG. For the test systems with 14-, 33-, and 84 buses, in part of the search space, scenario 3 was the one that presented the most reduction in real power losses, for a given value of DG unit generation. For a large part of the search space of all test systems, scenario 3 presented reductions in real power losses greater than those of scenario 2. The point with the greatest reduction in the real power losses—vertex of the parabola—for the 33-, 84-, and 415-bus systems was found between 50 and 60% of the total active power demand supplied by DG. For the 14-bus test system, the generation level of the DG units that caused the greatest reductions in real power losses corresponded to approximately 80% of the system’s active power demand.
This behavior followed from the location of the DG units, since in this scenario the units were installed at buses far from the substation. From a certain point, the increase in the power generated by these units caused an increase in the inverse power flow and current that was injected into the system, which increased the real power losses in the conductors.
Scenario 3 presented promising results: it did not require an excessive number of DG units, as in scenario 1, and showed greater reductions for a large part of the search space than scenario 2. In general, the real power loss reduction in scenario 2 only became greater than that for scenario 3 for high values of active power supplied by DG, greater than 85% of the total active power demand. However, the efficiency of the DG in scenario 3 depends on the generation level of the units being close to the vertex of the parabola. Table 6 presents the maximum real power loss reduction achieved in each scenario for the 14-, 33-, and 415-bus test systems.
Table 7 presents, for all test systems, the percentage of active power demand supplied by GD in which the first reconfiguration occurred. It was observed that, for the 14-bus test system, the algorithm did not perform any reconfiguration in scenario 2. This was due to the small size of the distribution system and the fact that there were sufficient DG units near the substation that already minimized power loses. Therefore, reconfiguration was not required to further reduce power losses.
The percentage of active power demand supplied by DG in which the first reconfiguration occurred decreased with the size of the test system. Scenario 1 was the one that presented, in all cases, the latest first reconfiguration among the analyzed scenarios. In scenario 2 of the 14-bus test system, the algorithm did not perform any reconfiguration during its execution.
It is noteworthy that no restrictions were applied to the number of reconfigurations, switching operations, and different possible topologies. Although this leads to a greater number of reconfigurations, it allows analyzing the maximum impact of DSR on real power losses.

5.2. DSR Effectiveness

To evaluate the impact of DG on the effectiveness of DSR, several simulations with a constant topology were performed. Therefore, the radial topology found after the first reconfiguration was maintained for all levels of active power demand supplied by the DG units. Figure 10, Figure 11, Figure 12 and Figure 13 show the percentage increase in real power losses with and without reconfiguration. The discontinuities or sudden jumps observed were due to points where system reconfiguration took place. The percentage increase was calculated according to Equation (7). The abscissa axis is the total active power demand supplied by DG. In this case, P l o s s , N R represents the active power losses without reconfiguration, while P l o s s , R represents the active power losses with reconfiguration. The negative values observed in Figure 11 indicate greater power losses after reconfiguration (see Equation (7)). This means that when the penetration of DG in the system reached certain values, the power losses did not decrease, but increased, even with reconfiguration.
Y % = P l o s s , N R P l o s s , R / P l o s s , R
The results showed that, for scenarios 1 and 2, the difference between the real power losses with and without reconfiguration (local search) was lower than 13.5% for all test systems. For the 84- and 415-bus test systems, in scenario 2, this difference was no more than 5.5%. For the 14-, 84-, and 415-bus test systems, in scenario 1, this difference was lower than 6%. For scenario 3, despite presenting the highest number of reconfigurations for all test systems, the difference in real power loss between the two implementations was more than 40% in some cases.
In scenario 1, an increase of 5% or more in the real power losses was only observed in the simulations without DSR when more than 35% of the total active power demand was supplied by DG. The reconfiguration must be considered, for some scenarios/test systems a noticeable improvement was observed. For others, small improvements, and even worsening, in real power losses were observed.
In scenario 3 of the 33-bus test system, when DG supplied more than 77% of the total active power demand of the system, the real power losses in the implementation without reconfiguration were lower than in the one with reconfiguration. This may have been due to the sub-optimal regions found during the reconfiguration process for lower levels of active power supplied by DG. Although these new topologies locally improved the real power losses (up to 77% of the total active power demand supplied by DG) later, for higher DG generation levels, the reconfiguration process led to higher power losses than those in the simulations without DSR. In this scenario, the reconfiguration achieved noticeable power loss reductions for the 14-, 84-, and 415-bus test systems. However, in scenario 3, the reconfiguration of the 33-bus test system was counterproductive in a significant part of the simulations.
In scenario 3, when the generation of the DG units was up to 23% of the total active power demand, the real power losses in the simulations without reconfiguration were less than 5% higher. In scenario 2, when 65% or less of the total active power demand was supplied by DG, none of the test systems presented an increase of more than 5% in real power loss in the implementation without reconfiguration.

6. Conclusions

This paper evaluated the impact of DG in DSR, considering several scenarios. In all cases, the insertion of DG units led to significant reductions in the real power losses, with the effectiveness depending on the scenario and generation level of the units.
Scenario 1, where DG units were allocated in all buses, was the one that presented the most continuity and stability in the trend of reducing real power losses. However, this scenario required many DG units. In part of the search space, scenario 3 presented greater reductions in real power loss for the same generation level, showing that, for some operating points, there may be even more efficient installation scenarios than the allocation of DG units to all buses.
Scenario 2, where the DG units were installed in buses close to the substation, showed a global trend of reducing real power losses. The loss reduction curve of scenario 2 was similar to that of scenario 1. This was because, in scenario 2, the power flow remained mostly downward. Saturation of the loss reduction curve was observed, with a more strongly asymptotic behavior for higher generation levels.
Scenario 3 allowed a greater reduction in real power losses than scenario 2, for most of the simulations, and greater than scenario 1, for a part of the simulations in the 14-, 33-, and 84-bus test systems. In this scenario, the DG units were installed in buses far from the substation, with noticeable reductions in the currents flowing from the substation. To a certain extent, the increase in active power supplied by DG units led to a decrease in real power losses. However, when the generation of DG units exceeded a specific limit, an increase in the real power losses was observed, giving a parabolic characteristic to the reduction curve. This scenario achieved significant reductions, without the need for an excessive number of GD units.
The impact of DG on the system reconfiguration effectiveness was measured through the comparison of real power losses in the implementations with and without DSR. For scenario 1, except for the 33-bus test system, the reconfiguration achieved modest reductions of real power losses. In scenario 2, the reconfiguration achieved reductions of power losses greater than 10% for the 33-bus test system. In the other test systems, the reconfiguration was inefficient in this scenario. In scenario 3, the reconfiguration was more efficient.
The results show that installing DG units in locations far from the substation improves, to a certain extent, the redistribution of power flows and currents that circulate in the system, inherently leading to the reduction in real power losses. It is unlikely that utilities will be able to operate the system with the optimal topology, allocation, and generation of DG units, so it is essential to know and understand how a system behaves with sub-optimal allocations of units.

Author Contributions

Conceptualization, M.D.G.-L. and E.M.C.-F.; Data curation, M.D.G.-L. and E.M.C.-F.; Formal analysis, M.D.G.-L., E.M.C.-F. and J.M.L.-L.; Funding acquisition, M.D.G.-L., E.M.C.-F. and J.M.L.-L.; Investigation, M.D.G.-L., E.M.C.-F. and J.M.L.-L.; Methodology, M.D.G.-L., E.M.C.-F. and J.M.L.-L.; Project administration, M.D.G.-L., E.M.C.-F. and J.M.L.-L.; Resources, M.D.G.-L., E.M.C.-F. and J.M.L.-L.; Software, M.D.G.-L., E.M.C.-F. and J.M.L.-L.; Supervision, M.D.G.-L., E.M.C.-F. and J.M.L.-L.; Validation, M.D.G.-L., E.M.C.-F. and J.M.L.-L.; Visualization, M.D.G.-L., E.M.C.-F. and J.M.L.-L.; Writing—original draft, M.D.G.-L. and E.M.C.-F.; Writing—review and editing, M.D.G.-L., E.M.C.-F. and J.M.L.-L. All authors have read and agreed to the published version of the manuscript.

Funding

This study was financed in part by the Coordenação de Aperfeiçoamento de Pessoal de Nível Superior–Brasil (CAPES)—Finance Code 001, and the Colombia Scientific Program within the framework of the call Ecosistema Cientifíco (Contract no. FP44842-218-2018).

Data Availability Statement

The data of this paper are available through e-mail via the authors.

Acknowledgments

The authors would like to thank CAPES (Coordenação de Aperfeiçoamento de Pessoal de Nível Superior) Brazil, and the Colombia Scientific Program within the framework of the call Ecosistema Científico (Contract No. FP44842-218-2018).

Conflicts of Interest

The authors declare no conflict of interest.

Abbreviations

The following abbreviations are used in this manuscript:
BEBranch Exchange
BFSBackward Forward Sweep
DEDifferential Evolution
DGDistributed generation
DSRDistribution system reconfiguration
EPDSElectric power distribution system
GAGenetic Algorithm
HSHarmony Search
MSAMoth Swarm Algorithm
PSOParticle Swarm Optimization

References

  1. Saldarriaga-Zuluaga, S.D.; López-Lezama, J.M.; Muñoz-Galeano, N. An Approach for Optimal Coordination of Over-Current Relays in Microgrids with Distributed Generation. Electronics 2020, 9, 1740. [Google Scholar] [CrossRef]
  2. Zhou, L.; Sheng, W.; Liu, W.; Ma, Z. An optimal expansion planning of electric distribution network incorporating health index and non-network solutions. CSEE J. Power Energy Syst. 2020, 6, 681–692. [Google Scholar] [CrossRef]
  3. Kabirifar, M.; Fotuhi-Firuzabad, M.; Moeini-Aghtaie, M.; Pourghaderi, N.; Shahidehpour, M. Reliability-Based Expansion Planning Studies of Active Distribution Networks With Multiagents. IEEE Trans. Smart Grid 2022, 13, 4610–4623. [Google Scholar] [CrossRef]
  4. Villada Duque, F.; López Lezama, J.M.; Muñoz Galeano, N. Effects of Incentives for Renewable Energy in Colombia. Ingeniería y Universidad 2017, 21, 257–272. [Google Scholar] [CrossRef]
  5. Singh, P.; Bishnoi, S.K.; Meena, N.K. Moth Search Optimization for Optimal DERs Integration in Conjunction to OLTC Tap Operations in Distribution Systems. IEEE Syst. J. 2020, 14, 880–888. [Google Scholar] [CrossRef]
  6. Xu, H.; Domínguez-García, A.D.; Sauer, P.W. Optimal Tap Setting of Voltage Regulation Transformers Using Batch Reinforcement Learning. IEEE Trans. Power Syst. 2020, 35, 1990–2001. [Google Scholar] [CrossRef]
  7. Jones, E.S.; Jewell, N.; Liao, Y.; Ionel, D.M. Optimal Capacitor Placement and Rating for Large-Scale Utility Power Distribution Systems Employing Load-Tap-Changing Transformer Control. IEEE Access 2023, 11, 19324–19338. [Google Scholar] [CrossRef]
  8. Gallego, L.A.; López-Lezama, J.M.; Carmona, O.G. A Mixed-Integer Linear Programming Model for Simultaneous Optimal Reconfiguration and Optimal Placement of Capacitor Banks in Distribution Networks. IEEE Access 2022, 10, 52655–52673. [Google Scholar] [CrossRef]
  9. Martins, A.S.C.; Costa, F.R.M.d.S.; de Araujo, L.R.; Penido, D.R.R. Capacitor Allocation in Unbalanced Systems Using a Three-Level Optimization Framework. IEEE Lat. Am. Trans. 2021, 19, 1599–1607. [Google Scholar] [CrossRef]
  10. Jafari, A.; Ganjeh Ganjehlou, H.; Khalili, T.; Mohammadi-Ivatloo, B.; Bidram, A.; Siano, P. A Two-Loop Hybrid Method for Optimal Placement and Scheduling of Switched Capacitors in Distribution Networks. IEEE Access 2020, 8, 38892–38906. [Google Scholar] [CrossRef]
  11. Franco, J.F.; Rider, M.J.; Lavorato, M.; Romero, R. Optimal Conductor Size Selection and Reconductoring in Radial Distribution Systems Using a Mixed-Integer LP Approach. IEEE Trans. Power Syst. 2013, 28, 10–20. [Google Scholar] [CrossRef]
  12. Franco, J.F.; Rider, M.J.; Romero, R. A mixed-integer quadratically-constrained programming model for the distribution system expansion planning. Int. J. Electr. Power Energy Syst. 2014, 62, 265–272. [Google Scholar] [CrossRef]
  13. Abul’Wafa, A.R. Multi-conductor feeder design for radial distribution networks. Electr. Power Syst. Res. 2016, 140, 184–192. [Google Scholar] [CrossRef]
  14. Chamana, M.; Chowdhury, B.H. Optimal Voltage Regulation of Distribution Networks with Cascaded Voltage Regulators in the Presence of High PV Penetration. IEEE Trans. Sustain. Energy 2018, 9, 1427–1436. [Google Scholar] [CrossRef]
  15. Liu, Y.; Guo, L.; Lu, C.; Chai, Y.; Gao, S.; Xu, B. A Fully Distributed Voltage Optimization Method for Distribution Networks Considering Integer Constraints of Step Voltage Regulators. IEEE Access 2019, 7, 60055–60066. [Google Scholar] [CrossRef]
  16. Shaheen, A.M.; El-Sehiemy, R.A. Optimal Coordinated Allocation of Distributed Generation Units/Capacitor Banks/Voltage Regulators by EGWA. IEEE Syst. J. 2021, 15, 257–264. [Google Scholar] [CrossRef]
  17. Pérez Posada, A.F.; Villegas, J.G.; López-Lezama, J.M. A Scatter Search Heuristic for the Optimal Location, Sizing and Contract Pricing of Distributed Generation in Electric Distribution Systems. Energies 2017, 10, 1449. [Google Scholar] [CrossRef]
  18. Zhang, C.; Li, J.; Zhang, Y.J.; Xu, Z. Optimal Location Planning of Renewable Distributed Generation Units in Distribution Networks: An Analytical Approach. IEEE Trans. Power Syst. 2018, 33, 2742–2753. [Google Scholar] [CrossRef]
  19. Gallego Pareja, L.A.; López-Lezama, J.M.; Gómez Carmona, O. A Mixed-Integer Linear Programming Model for the Simultaneous Optimal Distribution Network Reconfiguration and Optimal Placement of Distributed Generation. Energies 2022, 15, 3063. [Google Scholar] [CrossRef]
  20. Rupolo, D.; Rodrigues Pereira Junior, B.; Contreras, J.; Mantovani, J. Multiobjective Approach for Medium-and Low-Voltage Planning of Power Distribution Systems Considering Renewable Energy and Robustness. Energies 2020, 13, 2517. [Google Scholar] [CrossRef]
  21. Hung, D.Q.; Mithulananthan, N.; Bansal, R.C. Analytical Expressions for DG Allocation in Primary Distribution Networks. IEEE Trans. Energy Convers. 2010, 25, 814–820. [Google Scholar] [CrossRef]
  22. Karuppiah, N.; Shanmugapriyan, J.; Muthubalaji, S.; Tamilselvi, S. Optimum placement of multi type DG units for loss reduction in a radial distribution system considering the distributed generation. Bull. Pol. Acad. Sci. Tech. Sci. 2018, 66, 345–354. [Google Scholar]
  23. da Rosa, W.; Gerez, C.; Belati, E. Optimal Distributed Generation Allocating Using Particle Swarm Optimization and Linearized AC Load Flow. IEEE Lat. Am. Trans. 2018, 16, 2665–2670. [Google Scholar] [CrossRef]
  24. Ameli, A.; Bahrami, S.; Khazaeli, F.; Haghifam, M.R. A Multiobjective Particle Swarm Optimization for Sizing and Placement of DGs from DG Owner’s and Distribution Company’s Viewpoints. IEEE Trans. Power Deliv. 2014, 29, 1831–1840. [Google Scholar] [CrossRef]
  25. Agudelo, L.; López-Lezama, J.M.; Muñoz-Galeano, N. Vulnerability assessment of power systems to intentional attacks using a specialized genetic algorithm. Dyna 2015, 82, 78–84. [Google Scholar] [CrossRef]
  26. Purlu, M.; Turkay, B.E. Optimal Allocation of Renewable Distributed Generations Using Heuristic Methods to Minimize Annual Energy Losses and Voltage Deviation Index. IEEE Access 2022, 10, 21455–21474. [Google Scholar] [CrossRef]
  27. Ganguly, S.; Samajpati, D. Distributed Generation Allocation on Radial Distribution Networks Under Uncertainties of Load and Generation Using Genetic Algorithm. IEEE Trans. Sustain. Energy 2015, 6, 688–697. [Google Scholar] [CrossRef]
  28. Celli, G.; Ghiani, E.; Mocci, S.; Pilo, F. A multiobjective evolutionary algorithm for the sizing and siting of distributed generation. IEEE Trans. Power Syst. 2005, 20, 750–757. [Google Scholar] [CrossRef]
  29. Askarzadeh, A. A Memory-Based Genetic Algorithm for Optimization of Power Generation in a Microgrid. IEEE Trans. Sustain. Energy 2018, 9, 1081–1089. [Google Scholar] [CrossRef]
  30. Calvachi, D.; Tipán, L.; Jaramillo, M. Localization and Sizing of Distributed Generation through a Genetic Algorithm to Improve Voltage Profile Using Ecuadorian Standards. Energies 2023, 16, 4139. [Google Scholar] [CrossRef]
  31. Sheng, W.; Liu, K.Y.; Liu, Y.; Meng, X.; Li, Y. Optimal Placement and Sizing of Distributed Generation via an Improved Nondominated Sorting Genetic Algorithm II. IEEE Trans. Power Deliv. 2015, 30, 569–578. [Google Scholar] [CrossRef]
  32. Nekooei, K.; Farsangi, M.M.; Nezamabadi-Pour, H.; Lee, K.Y. An Improved Multi-Objective Harmony Search for Optimal Placement of DGs in Distribution Systems. IEEE Trans. Smart Grid 2013, 4, 557–567. [Google Scholar] [CrossRef]
  33. Radosavljević, J.; Arsić, N.; Milovanović, M.; Ktena, A. Optimal Placement and Sizing of Renewable Distributed Generation Using Hybrid Metaheuristic Algorithm. J. Mod. Power Syst. Clean Energy 2020, 8, 499–510. [Google Scholar] [CrossRef]
  34. Ali, A.; Keerio, M.U.; Laghari, J.A. Optimal Site and Size of Distributed Generation Allocation in Radial Distribution Network Using Multi-objective Optimization. J. Mod. Power Syst. Clean Energy 2021, 9, 404–415. [Google Scholar] [CrossRef]
  35. Lee, S.H.; Park, J.W. Selection of Optimal Location and Size of Multiple Distributed Generations by Using Kalman Filter Algorithm. IEEE Trans. Power Syst. 2009, 24, 1393–1400. [Google Scholar] [CrossRef]
  36. Sanjay, R.; Jayabarathi, T.; Raghunathan, T.; Ramesh, V.; Mithulananthan, N. Optimal Allocation of Distributed Generation Using Hybrid Grey Wolf Optimizer. IEEE Access 2017, 5, 14807–14818. [Google Scholar] [CrossRef]
  37. Abu-Mouti, F.S.; El-Hawary, M.E. Optimal Distributed Generation Allocation and Sizing in Distribution Systems via Artificial Bee Colony Algorithm. IEEE Trans. Power Deliv. 2011, 26, 2090–2101. [Google Scholar] [CrossRef]
  38. Ali, E.S.; Abd Elazim, S.M.; Hakmi, S.H.; Mosaad, M.I. Optimal Allocation and Size of Renewable Energy Sources as Distributed Generations Using Shark Optimization Algorithm in Radial Distribution Systems. Energies 2023, 16, 3983. [Google Scholar] [CrossRef]
  39. Elattar, E.E.; Elsayed, S.K. Optimal Location and Sizing of Distributed Generators Based on Renewable Energy Sources Using Modified Moth Flame Optimization Technique. IEEE Access 2020, 8, 109625–109638. [Google Scholar] [CrossRef]
  40. Keane, A.; Ochoa, L.F.; Borges, C.L.T.; Ault, G.W.; Alarcon-Rodriguez, A.D.; Currie, R.A.F.; Pilo, F.; Dent, C.; Harrison, G.P. State-of-the-Art Techniques and Challenges Ahead for Distributed Generation Planning and Optimization. IEEE Trans. Power Syst. 2013, 28, 1493–1502. [Google Scholar] [CrossRef]
  41. Adetunji, K.E.; Hofsajer, I.W.; Abu-Mahfouz, A.M.; Cheng, L. A Review of Metaheuristic Techniques for Optimal Integration of Electrical Units in Distribution Networks. IEEE Access 2021, 9, 5046–5068. [Google Scholar] [CrossRef]
  42. Saad, O.; Abdeljebbar, C. Historical Literature Review of Optimal Placement of Electrical Devices in Power Systems: Critical Analysis of Renewable Distributed Generation Efforts. IEEE Syst. J. 2021, 15, 3820–3831. [Google Scholar] [CrossRef]
  43. Grisales-Noreña, L.F.; Restrepo-Cuestas, B.J.; Cortés-Caicedo, B.; Montano, J.; Rosales-Muñoz, A.A.; Rivera, M. Optimal Location and Sizing of Distributed Generators and Energy Storage Systems in Microgrids: A Review. Energies 2023, 16, 106. [Google Scholar] [CrossRef]
  44. Saldarriaga-Zuluaga, S.D.; Lopez-Lezama, J.M.; Muñoz-Galeano, N. Protection Coordination in Microgrids: Current Weaknesses, Available Solutions and Future Challenges. IEEE Lat. Am. Trans. 2020, 18, 1715–1723. [Google Scholar] [CrossRef]
  45. Prim, R.C. Shortest connection networks and some generalizations. Bell Syst. Tech. J. 1957, 36, 1389–1401. [Google Scholar] [CrossRef]
  46. Civanlar, S.; Grainger, J.; Yin, H.; Lee, S. Distribution feeder reconfiguration for loss reduction. IEEE Trans. Power Deliv. 1988, 3, 1217–1223. [Google Scholar] [CrossRef]
  47. Lotfipour, A.; Afrakhte, H. A discrete Teaching–Learning-Based Optimization algorithm to solve distribution system reconfiguration in presence of distributed generation. Int. J. Electr. Power Energy Syst. 2016, 82, 264–273. [Google Scholar] [CrossRef]
  48. Shirmohammadi, D.; Hong, H. Reconfiguration of electric distribution networks for resistive line losses reduction. IEEE Trans. Power Deliv. 1989, 4, 1492–1498. [Google Scholar] [CrossRef]
  49. Gomes, F.; Carneiro, S.; Pereira, J.; Vinagre, M.; Garcia, P.; Araujo, L. A new heuristic reconfiguration algorithm for large distribution systems. IEEE Trans. Power Syst. 2005, 20, 1373–1378. [Google Scholar] [CrossRef]
  50. Sivanagaraju, S.; Rao, J.V.; Raju, P.S. Discrete Particle Swarm Optimization to Network Reconfiguration for Loss Reduction and Load Balancing. Electr. Power Components Syst. 2008, 36, 513–524. [Google Scholar] [CrossRef]
  51. Yang, M.; Li, J.; Li, J.; Yuan, X.; Xu, J. Reconfiguration Strategy for DC Distribution Network Fault Recovery Based on Hybrid Particle Swarm Optimization. Energies 2021, 14, 7145. [Google Scholar] [CrossRef]
  52. Alonso, G.; Alonso, R.F.; De Souza, A.C.Z.Z.; Freitas, W. Enhanced Artificial Immune Systems and Fuzzy Logic for Active Distribution Systems Reconfiguration. Energies 2022, 15, 9419. [Google Scholar] [CrossRef]
  53. Zhu, J. Optimal reconfiguration of electrical distribution network using the refined genetic algorithm. Electr. Power Syst. Res. 2002, 62, 37–42. [Google Scholar] [CrossRef]
  54. Wang, C.; Gao, Y. Determination of Power Distribution Network Configuration Using Non-Revisiting Genetic Algorithm. IEEE Trans. Power Syst. 2013, 28, 3638–3648. [Google Scholar] [CrossRef]
  55. Eldurssi, A.M.; O’Connell, R.M. A Fast Nondominated Sorting Guided Genetic Algorithm for Multi-Objective Power Distribution System Reconfiguration Problem. IEEE Trans. Power Syst. 2015, 30, 593–601. [Google Scholar] [CrossRef]
  56. Guamán, A.; Valenzuela, A. Distribution Network Reconfiguration Applied to Multiple Faulty Branches Based on Spanning Tree and Genetic Algorithms. Energies 2021, 14, 6699. [Google Scholar] [CrossRef]
  57. Rao, R.S.; Ravindra, K.; Satish, K.; Narasimham, S.V.L. Power Loss Minimization in Distribution System Using Network Reconfiguration in the Presence of Distributed Generation. IEEE Trans. Power Syst. 2013, 28, 317–325. [Google Scholar] [CrossRef]
  58. Nguyen, T.T.; Duong, T.L.; Ngo, T.Q. Network Reconfiguration and Distributed Generation Placement for Multi-Goal Function Based on Improved Moth Swarm Algorithm. Math. Probl. Eng. 2022, 2022, 5015771. [Google Scholar] [CrossRef]
  59. Barnwal, A.K.; Yadav, L.K.; Verma, M.K. A Multi-Objective Approach for Voltage Stability Enhancement and Loss Reduction Under PQV and P Buses Through Reconfiguration and Distributed Generation Allocation. IEEE Access 2022, 10, 16609–16623. [Google Scholar] [CrossRef]
  60. Amin, A.; Muhammad, M.; Mokhlis, H.; Franco, J.; Naidu, K.; Coo, L. Enhancement of Simultaneous Network Reconfiguration and DG Sizing via Hamming dataset approach and Firefly Algorithm. IET Gener. Transm. Distrib. 2019, 13, 5071–5082. [Google Scholar]
  61. Yan, X.; Zhang, Q. Research on Combination of Distributed Generation Placement and Dynamic Distribution Network Reconfiguration Based on MIBWOA. Sustainability 2023, 15, 9580. [Google Scholar] [CrossRef]
  62. Mahdavi, E.; Asadpour, S.; Macedo, L.H.; Romero, R. Reconfiguration of Distribution Networks with Simultaneous Allocation of Distributed Generation Using the Whale Optimization Algorithm. Energies 2023, 16, 4560. [Google Scholar] [CrossRef]
  63. Ntombela, M.; Musasa, K.; Leoaneka, M.C. Power Loss Minimization and Voltage Profile Improvement by System Reconfiguration, DG Sizing, and Placement. Computation 2022, 10, 180. [Google Scholar] [CrossRef]
  64. Kawambwa, S.; Mwifunyi, R.; Mnyanghwalo, D.; Hamisi, N.; Kalinga, E.; Mvungi, N. An improved backward/forward sweep power flow method based on network tree depth for radial distribution systems. J. Electr. Syst. Inf. Technol. 2021, 8, 7. [Google Scholar] [CrossRef]
  65. Chiou, J.P.; Chang, C.F.; Su, C.T. Variable scaling hybrid differential evolution for solving network reconfiguration of distribution systems. IEEE Trans. Power Syst. 2005, 20, 668–674. [Google Scholar] [CrossRef]
  66. Lavorato, M.; Franco, J.; Rider, M.J.; Romero, R. Imposing Radiality Constraints in Distribution System Optimization Problems. IEEE Trans. Power Syst. 2012, 27, 172–180. [Google Scholar] [CrossRef]
  67. Mahdavi, M.; Haes Alhelou, H. Test Distribution Systems: Network Parameters and Diagrams of Electrical Structural. IEEE Open Access J. Power Energy 2021, 8, 409–420. [Google Scholar] [CrossRef]
  68. Baran, M.; Wu, F. Network reconfiguration in distribution systems for loss reduction and load balancing. IEEE Trans. Power Deliv. 1989, 4, 1401–1407. [Google Scholar] [CrossRef]
  69. Ramirez-Rosado, I.; Bernal-Agustin, J. Genetic algorithms applied to the design of large power distribution systems. IEEE Trans. Power Syst. 1998, 13, 696–703. [Google Scholar] [CrossRef]
Figure 1. Flowchart of the Prim algorithm.
Energies 16 06154 g001
Figure 2. Flowchart of the proposed algorithm.
Energies 16 06154 g002
Figure 3. The 14-bus radial distribution test system.
Energies 16 06154 g003
Figure 4. DG allocations for the 14-bus test system (scenarios 2 and 3).
Energies 16 06154 g004
Figure 5. The 33-bus radial distribution test system.
Energies 16 06154 g005
Figure 6. DG allocations for the 33-bus test system (scenarios 2 and 3).
Energies 16 06154 g006
Figure 7. The 84-bus radial distribution test system.
Energies 16 06154 g007
Figure 8. DG allocations for the 84-bus test system (scenarios 2 and 3).
Energies 16 06154 g008
Figure 9. Real power loss reduction vs. active power generation of DG units for the 84-bus test system.
Energies 16 06154 g009
Figure 10. Real power loss increment without reconfiguration vs. demand supplied by DG (14-bus test system).
Energies 16 06154 g010
Figure 11. Real power loss increment without reconfiguration vs. demand supplied by DG (33-bus test system).
Energies 16 06154 g011
Figure 12. Real power loss increment without reconfiguration vs. demand supplied by DG (84-bus test system).
Energies 16 06154 g012
Figure 13. Real power loss increment without reconfiguration vs. demand supplied by DG (415-bus test system).
Energies 16 06154 g013
Table 1. Results of DSR.
Test SystemReal Power Loss (kW)
14-BusInitial Config.511.43
After Prim466.11
After Local Search466.11
Chiou, Chang and Su [65]466.11
33-BusInitial Config.202.67
After Prim140.71
After Local Search139.55
Lavorato, Franco, Rider and Romero [66]139.55
84-BusInitial Config.531.99
After Prim471.73
After Local Search470.19
Chiou, Chang and Su [65]469.88
415-BusInitial Config.708.94
After Prim662.51
After Local Search584.38
Mahdavi, Alhelou and Cuffe [67]583.00
Table 2. Proposed location of DG units for the 14-bus test system.
ScenarioBus Number
24, 9, 13
35, 6, 7, 10
Table 3. Proposed location of DG units for the 33-bus test system.
ScenarioBus Number
22, 3, 19, 23
310, 14, 15, 29, 32, 33
Table 4. Proposed location of DG units for the 84-bus test system.
ScenarioBus Number
21, 11, 15, 25, 30, 43,
47, 56, 65, 73, 77
36, 10, 22, 24, 41, 42,
55, 71, 72, 76, 83
Table 5. Bus locations of the DG units.
ScenarioBus Number
292, 123, 190, 202,
211, 215, 273, 274,
350, 351, 362, 364,
373, 375
37, 38, 41, 93, 105,
126, 196, 212, 234,
287, 386, 391, 392,
399, 400
Table 6. Maximum power loss reduction achieved in each scenario.
Test System/ScenarioMax. Real Power
Loss Reduction (kW)
14-Bus197.08
260.95
364.83
33-Bus199.89
237.21
372.06
415-Bus199.92
218.60
438.64
Table 7. Percentage of active demand supplied by DG in which the first reconfiguration occurred.
Test System/ScenarioActive Power
Demand Supplied by GD (%)
14-Bus159.05
2-
358.53
33-Bus114.64
26.78
36.29
415-Bus118.20
217.63
45.43
Disclaimer/Publisher’s Note: The statements, opinions and data contained in all publications are solely those of the individual author(s) and contributor(s) and not of MDPI and/or the editor(s). MDPI and/or the editor(s) disclaim responsibility for any injury to people or property resulting from any ideas, methods, instructions or products referred to in the content.

