
Performance Evaluation of Burkina Faso’s 33 MW Largest Grid-Connected PV Power Plant

 , ,
, ,
Abstract
:1. Introduction
2. The Zagtouli Grid-Connected PV System (ZGCPVS)
2.1. Geographical Location
2.2. Characteristics
2.3. Solar PV Modules Cleaning System
3. Materials and Method
3.1. Data Collection Processes
3.2. Quantitative Parameters
3.2.1. PV Array Energy Production
3.2.2. Energy Supplied into the Grid
3.2.3. Reference Yield ()
3.2.4. Array Yield ()
3.2.5. Final Yield ()
3.2.6. Performance Ratio ()
3.2.7. Array Capture Losses ()
3.2.8. System Losses ()
3.2.9. PV System Efficiency (η)
3.2.10. Capacity Factor ()
3.3. Qualitative Parameters
3.3.1. Solar Radiation Exergy ()
3.3.2. Exergy Efficiency (Γ)
4. Results and Discussions
5. The Zagtouli Grid-Connected Solar PV System Socioeconomic Impacts
6. Conclusions
- 1.
- Comparative analysis of sub-systems: A detailed comparison of the various sub-systems within the ZGCPVS will help identify specific weaknesses or inefficiencies. This analysis can assist in pinpointing areas that require improvement or optimization.
- 2.
- Analysis of plant disconnection from the SONABEL network: It is crucial to examine the plant’s disconnection from the SONABEL network to optimize energy losses. Understanding the causes and effects of disconnection and developing strategies to minimize such occurrences will contribute to improving the plant’s overall performance and reliability.
- 3.
- Economic assessment of a sophisticated cleaning mechanism: Evaluating the economic feasibility and benefits of implementing an advanced cleaning mechanism for the ZGCPVS is essential. This assessment should consider factors such as initial investment costs, operational expenses, energy production gains, and the overall profitability of the plant. A cost-benefit analysis will provide valuable insights into the potential advantages and drawbacks of adopting a more sophisticated cleaning approach.
Author Contributions
Funding
Data Availability Statement
Acknowledgments
Conflicts of Interest
References
- Osman, A.I.; Chen, L.; Yang, M.; Msigwa, G.; Farghali, M.; Fawzy, S.; Rooney, D.W.; Yap, P.-S. Cost, environmental impact, and resilience of renewable energy under a changing climate: A review. Environ. Chem. Lett. 2022, 21, 741–764. [Google Scholar] [CrossRef]
- Rahbari, H.R.; Mandø, M. Energy Analysis of Molten-Salt Storage Integrated with Air-Based Brayton Cycle: Case Study of a Wind Farm in Denmark. In Proceedings of the 2023 8th International Conference on Technology and Energy Management (ICTEM), Babol, Iran, 8–9 February 2023. [Google Scholar] [CrossRef]
- Task 1 Strategic PV Analysis and Outreach PVPS. Available online: https://www.iea-pvps.org/trends_reports/trends-2022/ (accessed on 2 November 2022).
- Renewable Energy Agency. Renewable Energy Statistics 2021. Statistiques d’Énergie Renouvelable 2021. Estadísticas de Energía Renovable 2021. About IRENA. 2021. Available online: https://www.irena.org/publications/2021/Aug/Renewable-energy-statistics-2021 (accessed on 5 December 2022).
- Moner-Girona, M.; Bódis, K.; Korgo, B.; Huld, T. Mapping the Least-Cost Option for Rural Electrification in Burkina Faso: Scaling-Up Renewable Energies Performance—A Science Base on Photovoltaics Performance for Increased Market Transparency and Customer Confidence View Project; Publications Office: Luxemburg, 2017. [Google Scholar] [CrossRef]
- Attari, K.; Elyaakoubi, A.; Asselman, A. Performance analysis and investigation of a grid-connected photovoltaic installation in Morocco. Energy Rep. 2016, 2, 261–266. [Google Scholar] [CrossRef]
- de Lima, L.C.; de Araújo Ferreira, L.; de Lima Morais, F.H.B. Performance analysis of a grid connected photovoltaic system in northeastern Brazil. Energy Sustain. Dev. 2017, 37, 79–85. [Google Scholar] [CrossRef]
- Boddapati, V.; Nandikatti, A.S.R.; Daniel, S.A. Techno-economic performance assessment and the effect of power evacuation curtailment of a 50 MWp grid-interactive solar power park. Energy Sustain. Dev. 2021, 62, 16–28. [Google Scholar] [CrossRef]
- Ouedraogo, A.; Diallo, A.; Goro, S.; Ilboudo, W.D.A.; Madougou, S.; Bathiebo, D.J.; Kam, S. Analysis of the solar power plant efficiency installed in the premises of a hospital—Case of the Pediatric Charles De Gaulle of Ouagadougou. Sol. Energy 2022, 241, 120–129. [Google Scholar] [CrossRef]
- Schardt, J.; Heesen, H.T. Performance of roof-top PV systems in selected European countries from 2012 to 2019. Sol. Energy 2021, 217, 235–244. [Google Scholar] [CrossRef]
- Mihov, V.; Gabrovska-Evstatieva, K.; Trifonov, D.; Mihailov, N. Performance Analysis of a Grid-Connected PV Park in Ruse, Bulgaria. In Proceedings of the 2022 8th International Conference on Energy Efficiency and Agricultural Engineering (EE&AE), Ruse, Bulgaria, 30 June–2 July 2022; pp. 1–5. [Google Scholar]
- Bouacha, S.; Malek, A.; Benkraouda, O.; Arab, A.H.; Razagui, A.; Boulahchiche, S.; Semaoui, S. Performance analysis of the first photovoltaic grid-connected system in Algeria. Energy Sustain. Dev. 2020, 57, 1–11. [Google Scholar] [CrossRef]
- Lindig, S.; Ascencio-Vasquez, J.; Leloux, J.; Moser, D.; Reinders, A. Performance Analysis and Degradation of a Large Fleet of PV Systems. IEEE J. Photovolt. 2021, 11, 1312–1318. [Google Scholar] [CrossRef]
- Fuster-Palop, E.; Vargas-Salgado, C.; Ferri-Revert, J.C.; Payá, J. Performance analysis and modelling of a 50 MW grid-connected photovoltaic plant in Spain after 12 years of operation. Renew. Sustain. Energy Rev. 2022, 170, 112968. [Google Scholar] [CrossRef]
- Malvoni, M.; Kumar, N.M.; Chopra, S.S.; Hatziargyriou, N. Performance and degradation assessment of large-scale grid-connected solar photovoltaic power plant in tropical semi-arid environment of India. Sol. Energy 2020, 203, 101–113. [Google Scholar] [CrossRef]
- Kumar, B.S.; Sudhakar, K. Performance evaluation of 10 MW grid connected solar photovoltaic power plant in India. Energy Rep. 2015, 1, 184–192. [Google Scholar] [CrossRef]
- Wittmer, B.; Mermoud, A.; Schott, T. Analysis of PV Grid Installations Performance, Comparing Measured Data to Simulation Results to Identify Problems in Operation and Monitoring. In Proceedings of the 30th European Photovoltaic Solar Energy Conference and Exhibition, Hamburg, Germany, 14–18 September 2015; pp. 2265–2270. [Google Scholar] [CrossRef]
- Umar, N.H.; Bora, B.; Banerjee, C.; Umar, N.; Panwar, B.S. Comparison of different PV power simulation softwares: Case study on performance analysis of 1 MW grid-connected PV solar power plant. Int. J. Eng. Sci. Invent. 2018, 7, 11–24. [Google Scholar]
- KhareSaxena, A.; Saxena, S.; Sudhakar, K. Energy performance and loss analysis of 100 kWp grid-connected rooftop solar photovoltaic system. Build. Serv. Eng. Res. Technol. 2021, 42, 485–500. [Google Scholar] [CrossRef]
- Goel, S.; Sharma, R. Analysis of measured and simulated performance of a grid-connected PV system in eastern India. Environ. Dev. Sustain. 2021, 23, 451–476. [Google Scholar] [CrossRef]
- Cubukcu, M.; Gumus, H. Performance analysis of a grid-connected photovoltaic plant in eastern Turkey. Sustain. Energy Technol. Assess. 2020, 39, 100724. [Google Scholar] [CrossRef]
- Boulmrharj, S.; Bakhouya, M.; Khaidar, M. Performance evaluation of grid-connected silicon-based PV systems integrated into institutional buildings: An experimental and simulation comparative study. Sustain. Energy Technol. Assess. 2022, 53, 102632. [Google Scholar] [CrossRef]
- Saleheen, M.Z.; Salema, A.A.; Islam, S.M.M.; Sarimuthu, C.R.; Hasan, Z. A target-oriented performance assessment and model development of a grid-connected solar PV (GCPV) system for a commercial building in Malaysia. Renew. Energy 2021, 171, 371–382. [Google Scholar] [CrossRef]
- Suri, M.; Huld, T.; Cebecauer, T.; Dunlop, E.D. Geographic Aspects of Photovoltaics in Europe: Contribution of the PVGIS Website. IEEE J. Sel. Top. Appl. Earth Obs. Remote Sens. 2008, 1, 34–41. [Google Scholar] [CrossRef]
- Ilse, K.; Micheli, L.; Figgis, B.W.; Lange, K.; Daßler, D.; Hanifi, H.; Wolfertstetter, F.; Naumann, V.; Hagendorf, C.; Gottschalg, R.; et al. Techno-Economic Assessment of Soiling Losses and Mitigation Strategies for Solar Power Generation. Joule 2019, 3, 2303–2321. [Google Scholar] [CrossRef]
- Myyas, R.N.; Al-Dabbasa, M.; Tostado-Véliz, M.; Jurado, F. A novel solar panel cleaning mechanism to improve performance and harvesting rainwater. Sol. Energy 2022, 237, 19–28. [Google Scholar] [CrossRef]
- The International Electrotechnical Commission (IEC). Photovoltaic System Performance Monitoring—Guidelines for Measurement, Data Exchange and Analysis. IEC 61724. 1998. Available online: https://cir.nii.ac.jp/crid/1571698600443732992.bib?lang=en (accessed on 26 February 2023).
- Sundaram, S.; Babu, J.S.C. Performance evaluation and validation of 5MWp grid connected solar photovoltaic plant in South India. Energy Convers. Manag. 2015, 100, 429–439. [Google Scholar] [CrossRef]
- Abdul-Ganiyu, S.; Quansah, D.A.; Ramde, E.W.; Seidu, R.; Adaramola, M.S. Investigation of Solar Photovoltaic-Thermal (PVT) and Solar Photovoltaic (PV) Performance: A Case Study in Ghana. Energies 2020, 13, 2701. [Google Scholar] [CrossRef]
- Boddapati, V.; Daniel, S.A. Performance analysis and investigations of grid-connected Solar Power Park in Kurnool, South India. Energy Sustain. Dev. 2020, 55, 161–169. [Google Scholar] [CrossRef]
- Banda, M.H.; Nyeinga, K.; Okello, D. Performance evaluation of 830 kWp grid-connected photovoltaic power plant at Kamuzu International Airport-Malawi. Energy Sustain. Dev. 2019, 51, 50–55. [Google Scholar] [CrossRef]
- Ayompe, L.M.; Duffy, A.; McCormack, S.J.; Conlon, M. Measured performance of a 1.72kW rooftop grid connected photovoltaic system in Ireland. Energy Convers. Manag. 2011, 52, 816–825. [Google Scholar] [CrossRef]
- Al-Rasheedi, M.; Gueymard, C.A.; Al-Khayat, M.; Ismail, A.; Lee, J.A.; Al-Duaj, H. Performance evaluation of a utility-scale dual-technology photovoltaic power plant at the Shagaya Renewable Energy Park in Kuwait. Renew. Sustain. Energy Rev. 2020, 133, 110139. [Google Scholar] [CrossRef]
- Yadav, S.K.; Bajpai, U. Performance evaluation of a rooftop solar photovoltaic power plant in Northern India. Energy Sustain. Dev. 2018, 43, 130–138. [Google Scholar] [CrossRef]
- Kumar, M.; Chandel, S.S.; Kumar, A. Performance analysis of a 10 MWp utility scale grid-connected canal-top photovoltaic power plant under Indian climatic conditions. Energy 2020, 204, 117903. [Google Scholar] [CrossRef]
- Agai, F.; Caka, N.; Komoni, V.S. Design Optimization and Simulation of the Photovoltaic Systems on Buildings in Southeast Europe. 2011. Available online: https://www.researchgate.net/publication/258047113 (accessed on 15 October 2022).
- Jamil, I.; Zhao, J.; Zhang, L.; Jamil, R.; Rafique, S.F. Evaluation of Energy Production and Energy Yield Assessment Based on Feasibility, Design, and Execution of 3 × 50 MW Grid-Connected Solar PV Pilot Project in Nooriabad. Int. J. Photoenergy 2017, 2017, 6429581. [Google Scholar] [CrossRef]
- Kazem, H.A.; Khatib, T.; Sopian, K.; Elmenreich, W. Performance and feasibility assessment of a 1.4kW roof top grid-connected photovoltaic power system under desertic weather conditions. Energy Build. 2014, 82, 123–129. [Google Scholar] [CrossRef]
- Waongo, M.; Koalaga, Z.; Zougmore, F. A guideline for sizing Photovoltaic panels across different climatic zones in Burkina Faso. IOP Conf. Ser. Mater. Sci. Eng. 2012, 29, 012014. [Google Scholar] [CrossRef]
- Kata, N.; Soro, Y.M.; Diouf, D.; Darga, A.; Maiga, A.S. Temperature impact on dusty and cleaned photovoltaic module exposed in sub-Saharan outdoor conditions. EPJ Photovolt. 2018, 9, 8. [Google Scholar] [CrossRef]
- Edalati, S.; Ameri, M.; Iranmanesh, M. Comparative performance investigation of mono- and poly-crystalline silicon photovoltaic modules for use in grid-connected photovoltaic systems in dry climates. Appl. Energy 2015, 160, 255–265. [Google Scholar] [CrossRef]
- Sidi, C.E.B.E.; Ndiaye, M.L.; El Bah, M.; Mbodji, A.; Ndiaye, A.; Ndiaye, P.A. Performance analysis of the first large-scale (15 MWp) grid-connected photovoltaic plant in Mauritania. Energy Convers. Manag. 2016, 119, 411–421. [Google Scholar] [CrossRef]
- Drif, M.; Pérez, P.; Aguilera, J.; Almonacid, G.; Gomez, P.; de la Casa, J.; Aguilar, J. Univer Project. A grid connected photovoltaic system of 200kWp at Jaén University. Overview and performance analysis. Sol. Energy Mater. Sol. Cells 2007, 91, 670–683. [Google Scholar] [CrossRef]
- Mpholo, M.; Nchaba, T.; Monese, M. Yield and performance analysis of the first grid-connected solar farm at Moshoeshoe I International Airport, Lesotho. Renew. Energy 2015, 81, 845–852. [Google Scholar] [CrossRef]
- SONABEL. Rapport D’activités 2020. 2020. Available online: https://www.sonabel.bf/a-propos/documentation/ (accessed on 1 July 2023).
- Alliance Sahel. Available online: https://www.alliance-sahel.org/actualites/centrale-solaire-de-zagtouli/ (accessed on 2 July 2023).


| PV Panel Parameters | Parameters | Values |
|---|---|---|
| nominal power | Pmax | 260 W |
| Open circuit voltage | Voc | 37.6 V |
| Maximum power voltage | Vmp | 30.8 V |
| Short circuit current | Isc | 9.06 A |
| Maximum power current | Imp | 8.54 A |
| Efficiency | ղ | 15.9% |
| Temperature coefficient of Isc | Ki | 0.051%/K |
| Temperature coefficient of Voc | Kv | −0.31%/K |
| Temperature coefficient of Pmax | Kp | −0.41%/K |
| Maximum system voltage | … | 1000 V |
| Operating temperature | … | (−40 to +85) |
| NOCT | … | 46 |
| Inverter Parameters | Values |
|---|---|
| Maximum PV input voltage | 1050 V |
| Maximum PV input current | 2000 A |
| MPPT Voltage range | (610–820) V |
| Maximum AC output power | 1165 W |
| Nominal AC operating voltage | 420 V |
| Efficiency | 98% |
| Temperature range | (−20 to +55) °C |
| Campaign 1 | Campaign 2 | Campaign 3 | Campaign 4 | Campaign 5 | Total Annual | |
|---|---|---|---|---|---|---|
| Period | From 01/04/2022 to 01/17/2022 | From 01/30/2022 to 02/09/2022 | From 02/10/2022 to 03/17/2022 | From 11/02/2022 to 11/28/2022 | From 11/29/2022 to 12/31/2022 | |
| Water volume used (m3) | 94 | 126 | 79 | 144 | 177 | 620 |
| Diesel quantity for the tractor (m3) | 0.320 | 0.280 | 0.440 | 0.620 | 0.820 | 2.480 |
| fuel volume for the motor pump (m3) | 0.0045 | 0.0045 | 0.0055 | 0.023 | 0.025 | 0.0625 |
| tractor running time (hour) | 55 | 76 | 78 | 117 | 136 | 462 |
| hydraulic oil for the tractor (m3) | … | … | 0.004 | 0 | 0.001 | 0.005 |
| number of working days | 17 | 13 | 19 | 19 | 10 | 78 |
| Parameter | Sensor | Measurement Range | Accuracy |
|---|---|---|---|
| Wind Speed | Lufft WS600-UMB Smart Weather Sensor | 0–246.06 ft/s (0–75 m/s) | Wind Speed: ±0.3 m/s or ±3% (0–35 m/s) ± 5% (>35 m/s) RMS |
| Wind Direction | Lufft WS600-UMB Smart Weather Sensor | 0–359.9° | <3° RMSE > 1.0 m/s |
| Ambient temperature | Lufft WS600-UMB Smart Weather Sensor | −50…60 °C | ±0.2 °C (−20…50 °C), otherwise ±0.5 °C (>−30 °C) |
| Relative humidity | Lufft WS600-UMB Smart Weather Sensor | 0…100% RH | ±2% RH |
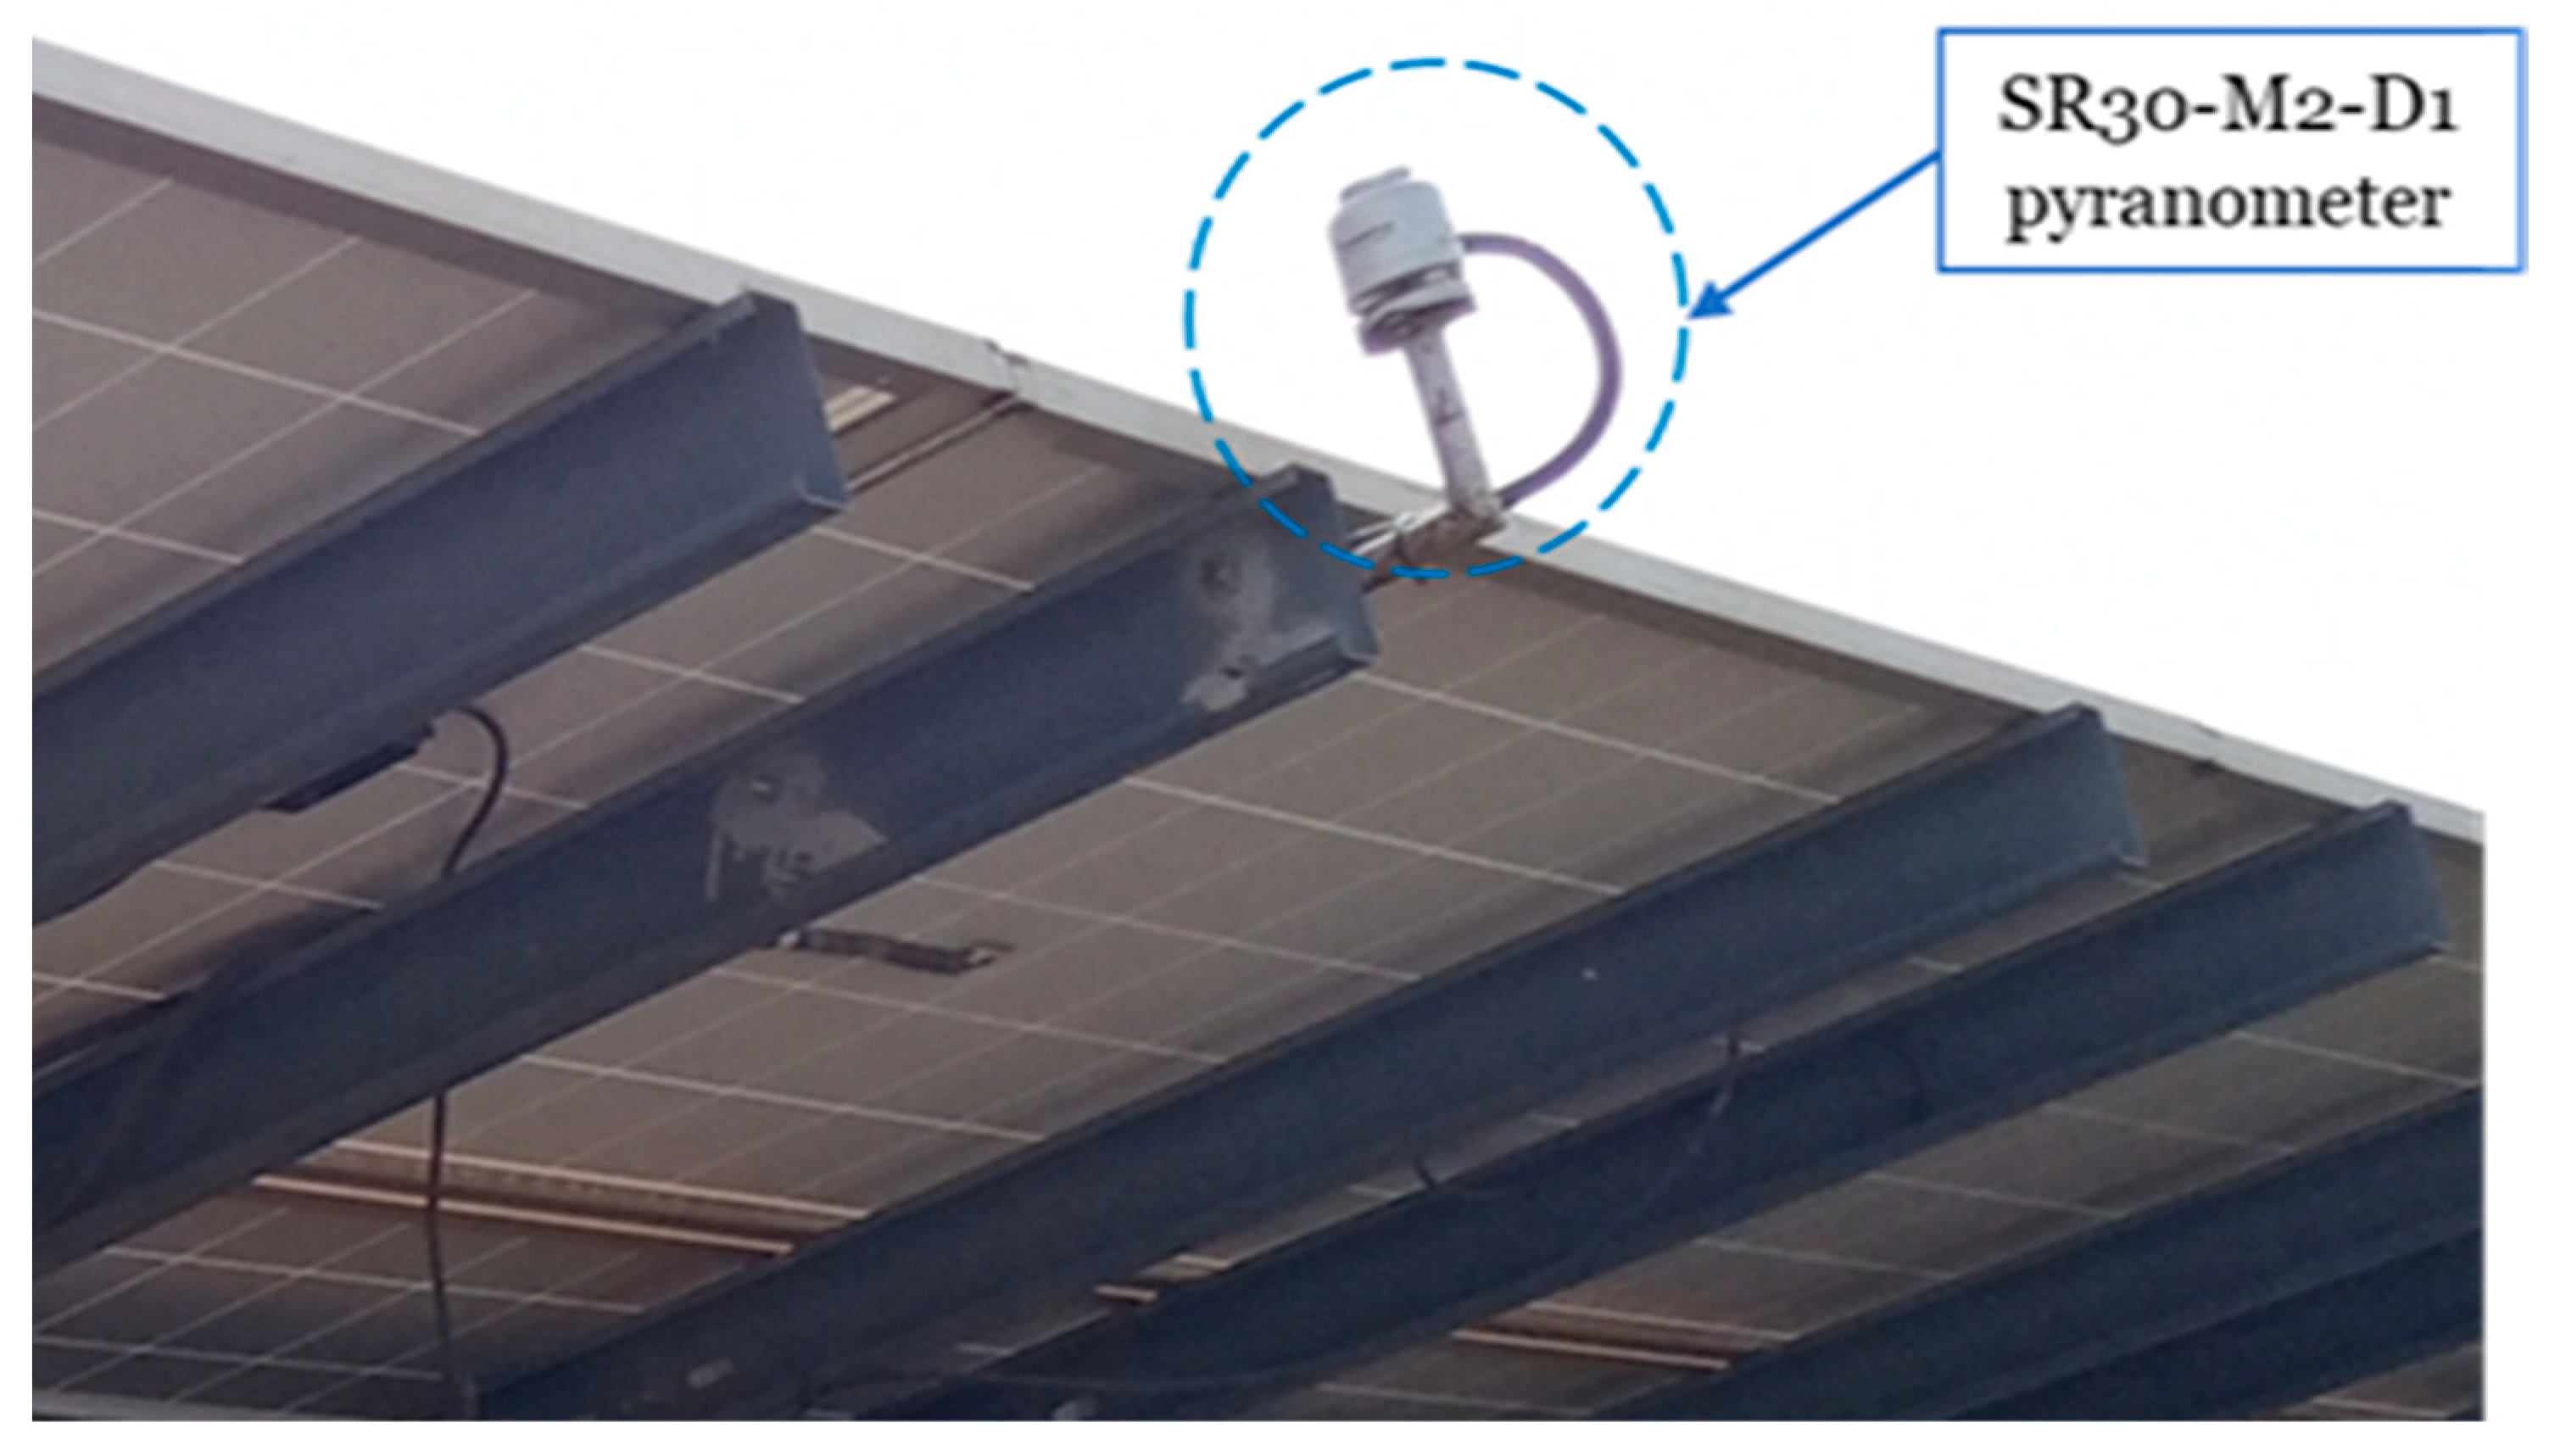
| GHI & DHI | SR30-M2-D1 pyranometer | 285 to 3000 nm | <±3% ((0.35 to 1.5) × nm) |
| tilt sensor | SR30-M2-D1 pyranometer | 0 to 90° | ±1° (0 to 90°) |
| Year | Yields (h/day) | Losses (h/day) | Capacity Factor (%) | |||
|---|---|---|---|---|---|---|
| YR | YA | YF | LC | LS | ||
| 2019 | 6.08 | 4.96 | 4.84 | 1.05 | 0.12 | 19.91 |
| 2020 | 5.98 | 4.81 | 4.69 | 1.17 | 0.12 | 19.24 |
| 2021 | 6.06 | 4.92 | 4.79 | 1.14 | 0.13 | 19.33 |
| PV System Location | Capacity (kWp) | Final Yield (h/d) | Performance Ratio (%) | Reference |
|---|---|---|---|---|
| India | 10,000 | 4.20 | 78 | [35] |
| Iran | 5.52 | 5.38 | 82.92 | [41] |
| India | 5 | 3.99 | 76.97 | [34] |
| Brazil | 2.20 | 4.60 | 82.90 | [7] |
| Mauritania | 1500 | 4.28 | 73.56 | [42] |
| Ireland | 1.72 | 2.41 | 81.50 | [32] |
| Spain | 20 | 2.40 | 65 | [43] |
| Lesotho | 281 | 4.11 | 70 | [44] |
| Burkina Faso (Actual) | 33,000 | 4.89 (2019) 4.61 (2020) 4.92 (2021) | 80.73 (2019) 78.70 (2020) 79.36 (2021) |
Disclaimer/Publisher’s Note: The statements, opinions and data contained in all publications are solely those of the individual author(s) and contributor(s) and not of MDPI and/or the editor(s). MDPI and/or the editor(s) disclaim responsibility for any injury to people or property resulting from any ideas, methods, instructions or products referred to in the content. |
© 2023 by the authors. Licensee MDPI, Basel, Switzerland. This article is an open access article distributed under the terms and conditions of the Creative Commons Attribution (CC BY) license (https://creativecommons.org/licenses/by/4.0/).
Share and Cite
Palm, S.F.; Youssef, L.; Waita, S.; Nyangonda, T.N.; Radouane, K.; Chebak, A. Performance Evaluation of Burkina Faso’s 33 MW Largest Grid-Connected PV Power Plant. Energies 2023, 16, 6177. https://doi.org/10.3390/en16176177
Palm SF, Youssef L, Waita S, Nyangonda TN, Radouane K, Chebak A. Performance Evaluation of Burkina Faso’s 33 MW Largest Grid-Connected PV Power Plant. Energies. 2023; 16(17):6177. https://doi.org/10.3390/en16176177
Chicago/Turabian StylePalm, Sami Florent, Lamkharbach Youssef, Sebastian Waita, Thomas Nyachoti Nyangonda, Khalid Radouane, and Ahmed Chebak. 2023. "Performance Evaluation of Burkina Faso’s 33 MW Largest Grid-Connected PV Power Plant" Energies 16, no. 17: 6177. https://doi.org/10.3390/en16176177
APA StylePalm, S. F., Youssef, L., Waita, S., Nyangonda, T. N., Radouane, K., & Chebak, A. (2023). Performance Evaluation of Burkina Faso’s 33 MW Largest Grid-Connected PV Power Plant. Energies, 16(17), 6177. https://doi.org/10.3390/en16176177