Article

Modal Decomposition Study of the Non-Reactive Flow Field in a Dual-Swirl Combustor

School of Power and Energy, Northwestern Polytechnical University, Xi’an 710169, China
*
Author to whom correspondence should be addressed.
Energies 2023, 16(17), 6182; https://doi.org/10.3390/en16176182
Submission received: 27 July 2023 / Revised: 14 August 2023 / Accepted: 17 August 2023 / Published: 25 August 2023
(This article belongs to the Section I2: Energy and Combustion Science)

Abstract

:
The modal decomposition study of the non-reactive flow field in a dual-swirl combustor is investigated through the large eddy simulation. The formation mechanism and function of various recirculation zones are elaborated by analyzing the time-averaged and instantaneous velocity contours of the center section. The precessing vortex core (PVC) is first visualized by the pressure iso-surface, and the evolution process is presented. Different dimensionality reduction methods are adopted to identify the coherent structures from the flow field. The most energetic spatial structure corresponding to the PVC and its second-order harmonic structure is extracted by the classical proper orthogonal decomposition (POD). The coherent structures with high frequency have relatively low energy content. In addition, a spectral proper orthogonal decomposition (SPOD) method, which can implement spatial-temporal decomposition simultaneously, is introduced to obtain the energy-based spatial structures at all characteristic frequencies. A triple-helix with azimuth wave number m = 3 and a quadruple-helix with azimuth wave number m = 4 are discovered as the third-order and the fourth-order harmonics of single-helix, respectively.
Keywords:
LES; PVC; POD; SPOD

1. Introduction

To satisfy the escalating requirements of the International Civil Aviation Organization (ICAO), a dual-swirl direct-mixing combustor is proposed to reduce emissions [1,2,3,4]. As a necessary factor in combustion organization, the flow plays an essential role in fuel-air mixing, flame stability, and other combustion performance. A deeper analysis of the flow characteristics can help researchers investigate flow/spray/flame interaction in the future.
In swirl combustors, it is the central recirculation zone that transports the energetic burned substance back upstream to achieve continuous burning and flame stabilization [5,6,7,8]. From the macro perspective, the radial velocity gradient is formed at the pilot swirler exit under centrifugal force. Due to the viscosity, the axial projection of the radial velocity gradient gradually decays with the development of swirl jets, which causes an adverse pressure gradient in addition to the central recirculation zone. From the micro perspective, the K-H instability in the shear layer develops into spiral mode under the effect of swirl jets. With the increasing swirl number, the instability intensity also increases. When the critical point is reached (Sn > 0.6), the spiral vortex breakdown bubble (VBB), also known as the recirculation zone, forms downstream [9]. The unstable structure that revolves around the VBB is called precessing vortex core (PVC) [10,11,12].
As a significant large-scale spiral vortex structure, PVC affects the flow and flame dynamics in the combustor. Therefore, many numerical and experimental studies have been carried out on PVCs. It was always found between the pilot-stage jet’s shear layer and the central recirculation zone [13]. There was a strong correlation between the presence of PVC and the peak of the pressure or axial velocity spectral (in some cases, two different peaks are found) in the combustor [14]. The azimuth wave number m was always adopted to represent the classical structures of PVCs. In some cases, helical vortex structures with m = 1 and m = 2 could be observed simultaneously. Furthermore, semi-helical structures appeared in some investigations [15]. The interaction mechanism of PVC and the central recirculation zone was also investigated. The PVC had maximum intensity at the root of the central recirculation zone (CRZ) [15], influencing the shape of VBB and promoting its extension to the inlet of the combustor [16]. Considering the close connection between PVC and VBB, the factors that could influence the recirculation zone or VBB also affect the structure and frequency of PVC. With the increased swirl number, VBB gradually became unstable, and PVC appeared. An apparent PVC phenomenon could be observed when Sn > 0.45 [17]. However, as the swirl number further increased, the PVC frequency decreased due to the reduced rotation speed in CRZ [18]. In addition, aerodynamic parameters, such as pressure and mass flow rate, could affect the frequency of PVC [19]. When PVC existed, it could effectively improve fuel-air mixing, further enhancing flame stability [20]. Several investigations have been carried out to study the effect of PVC on flame stabilization. PVC was the ultimate cause of the helical flame structure [21]. When approaching the lean blow-out condition, PVC was followed closely by the flame front. The upstream stagnation point of the recirculation zone induced by PVC could be used as an anchor to stabilize the flame in both stable and unstable combustion processes [7]. Thus, the characteristic frequency of PVC is often used to establish the lean blow-out empirical correlation [22]. Despite this, as a typical coherent structure in the combustor, PVC was one of the representative phenomena of unstable swirl flow, which could interact with the flame, further causing combustion instability [23]. The thermoacoustic phenomenon appeared when coupled with an acoustic wave [24]. The existence of PVC continuously enhanced the unsteady heat release and maintained the thermoacoustic cycle. Compared with the non-reaction state, the frequency is at least two times higher. Under self-excited pressure oscillation, the PVC structure was stretched or compressed along the axial direction [7].
Proper orthogonal decomposition (POD), also known as principal components analysis (PCA), is a linear dimensionality reduction method. It can map the original data set to multiple sets of new coordinate axes to achieve the purpose of dimensionality reduction. Each set of axes is orthogonal in space and becomes the spatial mode of the original data. Lumley [25] first applied the POD method to flow field analysis. Then, the method was widely used to extract the coherent structure in the swirl combustor [26,27,28,29]. However, the classical POD method, which could only carry out the spatial eigen orthogonal decomposition, thus loses the temporal information in the spatial averaging process [30]. In addition, when spectral analysis of time term was carried out, the partial coherent structure was missing due to the filtering [31].
The SPOD was also initially proposed by Lumley [25]. Then, two different methods were studied, which easily caused misunderstanding. In the method proposed by Sieber [31], the spatial tensor was first filtered by an appropriate filter before decomposition. The strength of this method was that the filtered dynamic characteristics did not disappear but transferred to other spatial modes. In addition, this method could separate the hidden modes from the noise signal or other modes and had little effect on the computational burden. Vanierschot [32] used this method to study the coherent structure of rotating jets and found two main global modes, which were single-helical and double-helical vortex. In the method proposed by Towne [30], a set of spatial modes at each characteristic frequency and the statistical variability of turbulent flow are obtained and compared with the Dynamic Mode Decomposition (DMD) [33]. The turbulent jet is denoised and reconstructed by Nekkanti through this method [34]. In addition, the comparison and analysis of various dimensionality reduction methods in the flow field could be seen in the review of Taira [35].
In summary, the flow characteristics will strongly affect the performance of the combustor. The CRZ generated by the adverse pressure gradient is used to stabilize the flame. As a unique flow structure of swirl-stabilized combustor, PVC significantly influences the fuel-air mixing process. Good mixing performance can effectively improve combustion efficiency and reduce pollutants. In addition, since the ignition is mainly carried out under non-reactive conditions, the evolution of unsteady non-reactive flow plays an essential role in ignition performance. Furthermore, future studies can compare the non-reactive flow characteristics with the reactive flow field to analyze the flow/flame interaction. Therefore, it is necessary to fully grasp the non-reactive flow characteristics of the combustor.
The previous studies on the dual-swirl direct-mixing combustor primarily aim at the variation of time-averaged flow characteristics with the structural and aerodynamic parameters. The main motivation of this study is to reveal the unsteady behavior from the non-reactive flow field through large eddy simulation and data-driven dimension reduction methods. In this paper, POD and SPOD methods are applied to study the non-reactive flow characteristics in a complex dual-swirl direct-mixing combustor for the first time. The three-dimensional coherent structures with corresponding frequencies are comparatively analyzed. The results obtained in this paper can provide a basis for subsequent research on the fuel/air mixing, ignition, and flow/flame interaction characteristics of the dual-swirl direct-mixing combustor and help with the combustor design.
The arrangements of the paper are as follows. Firstly, the structural characteristics of the dual-swirl direct-mixing combustor are demonstrated. Then, the governing equation and the turbulence model are presented. Thereafter, the POD/SPOD method used in this paper is introduced. The grid scale of mesh is verified through Pope’s criterion. The numerical method is validated by comparing it with PIV results. Subsequently, the flow characteristics are investigated through time-averaged and instantaneous axial-velocity contour. Finally, the coherent structures extracted by POD and SPOD are comparatively analyzed.

2. Numerical Setting and Methodology

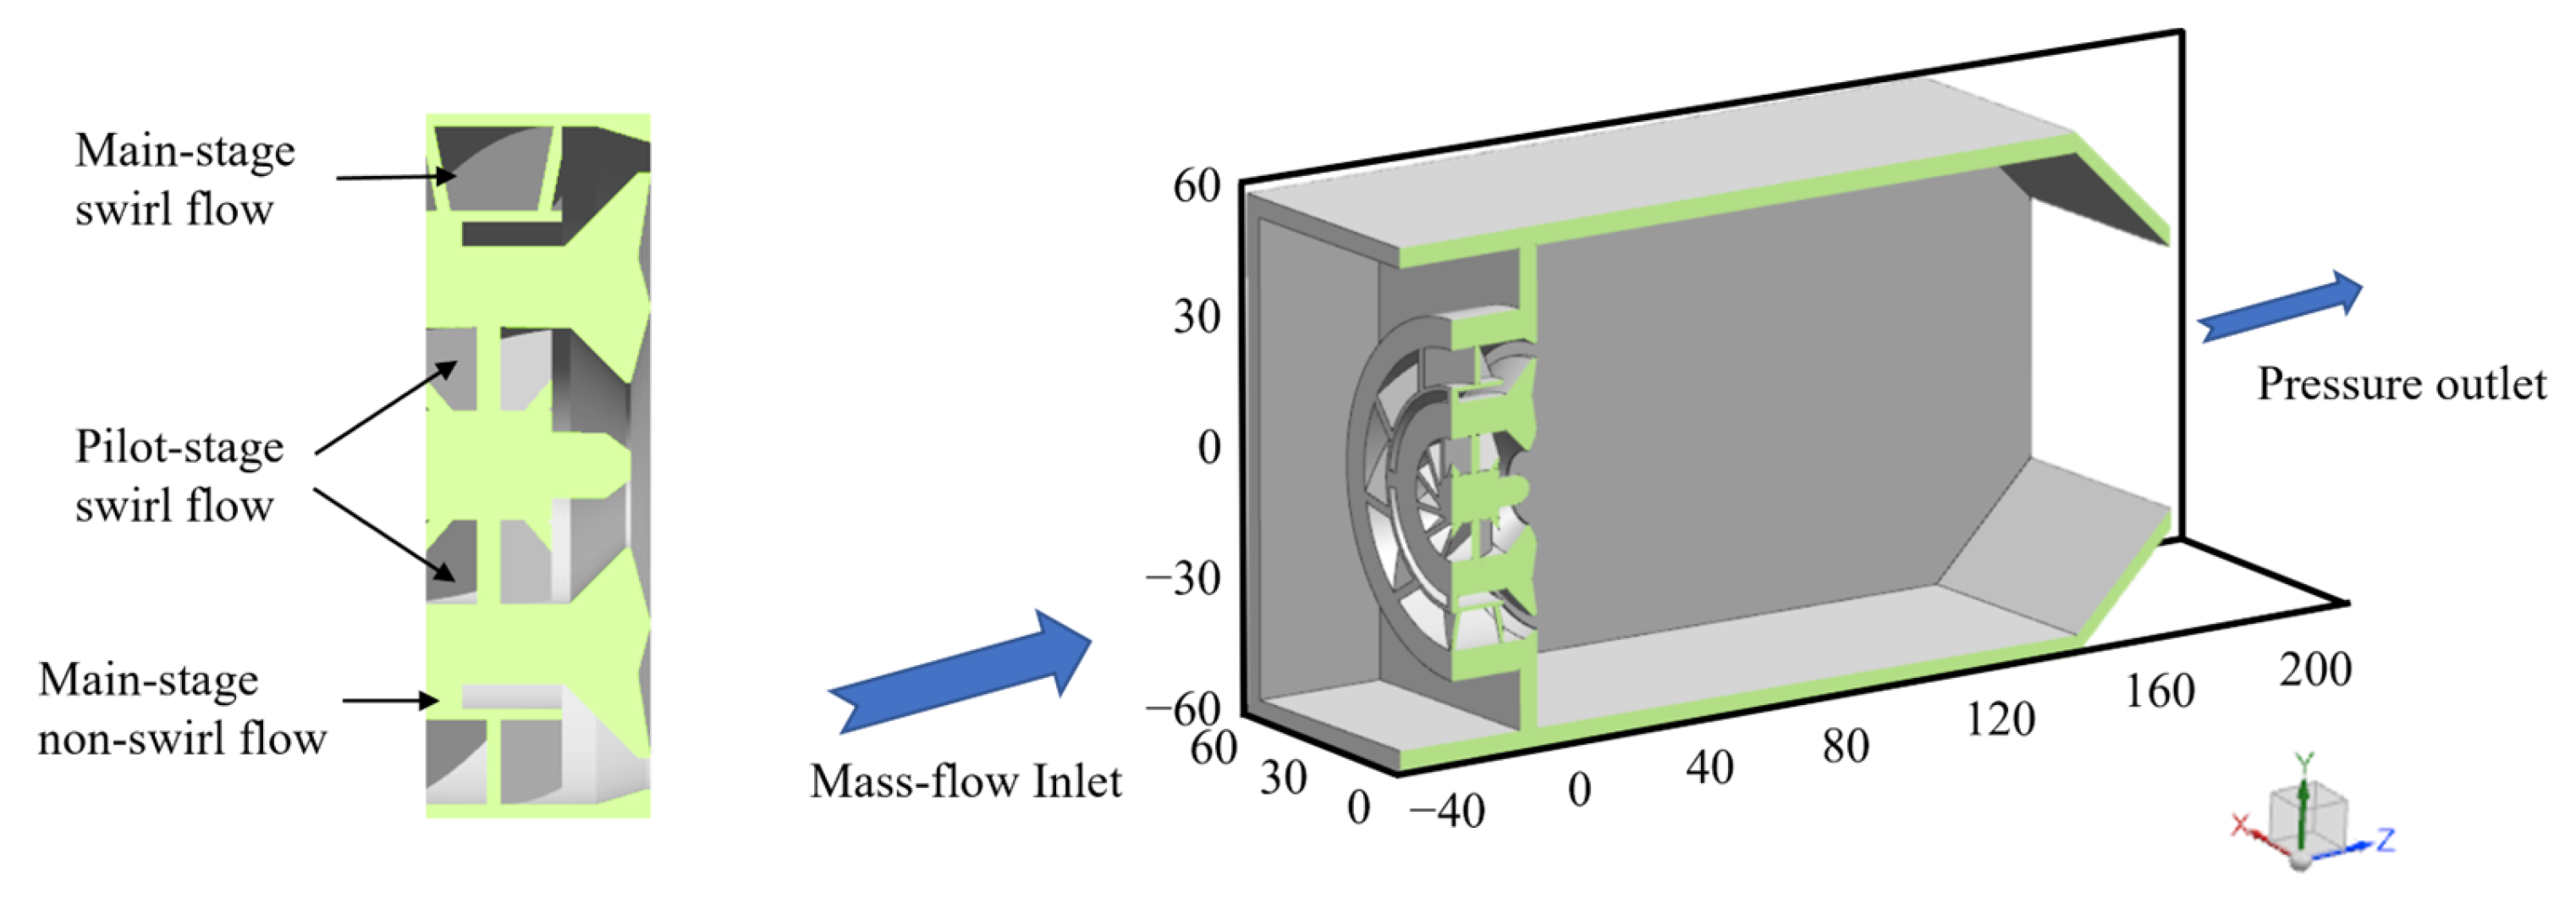
2.1. Calculation Domain and Boundary Conditions

The dual-swirl direct-mixing combustor consisting of two-stage swirlers and a combustor liner is presented in Figure 1. The pilot-stage swirler has 9 blades with a 30° blade angle, while the main-stage swirler has 12 blades with a 60° blade angle. The main-stage air flow is divided into two parts: swirling flow and non-swirl flow, with a flow rate ratio of 2:1. The length of the combustor liner is 185 mm. The XY section of the combustor liner is square. The width and height are both 60 mm. The combustor liner has a convergent exit with a 45° convergent angle. Only one mass flow inlet is set up, and the air flow distribution depends entirely on the aerodynamic design of the combustor. The inlet and outlet boundaries are mass flow inlet and pressure outlet, respectively. The air flow rate is 0.66 kg/s, and the numerical simulation is carried out under normal temperature and pressure. The RANS result is used to initialize the LES case. The time step size is 2.5 μs, which depends on grid size and local velocity. The total calculation time is 0.5 s. During the simulation, 256 parallel processes are used and the overall computational cost is 30720 CPU hours.
An LDI model combustor designed by the University of Cincinnati is also adopted to carry out the model validation, as shown in Figure 2 [36]. The inner and outer diameter of the swirler is 8.8 mm and 22.5 mm, respectively. Six swirler blades with a blade angle of 60° are arranged. The downstream channel of the swirler is a convergent-divergent Venturi structure, and the convergence-divergence angles are both 45°. The cross-section of the combustor is 2 × 2 inches square, and the total length is 12 inches. The inlet air flow rate is 0.49 kg/min, the inlet temperature is 293 K, and the pressure difference between the swirler inlet and outlet is about 4% of atmospheric pressure. The total calculation time is 0.2 s. During the simulation, 256 parallel processes are used and the overall computational cost is 9472 CPU hours.

2.2. Numerical Setup

The numerical study is carried out through Ansys Fluent. Due to the limited computational resources, the large eddy simulation method is adopted to investigate unsteady turbulent characteristics. The SIMPLE algorithm is chosen to achieve pressure-velocity coupling. The spatial and temporal discretization is accomplished by using Second-Order Upwind Scheme and Bounded Second-Order Implicit Time Integration, respectively. Vortices larger than the grid scale are solved directly, while the influence of small vortices on the resolved flow is modeled by the sub-grid scale model. The Boussinesq Hypothesis is used to deal with the stress term. The low-speed incompressible solver is used, and the governing equations are presented below [37]:
ρ u ¯ = 0
t ρ u ¯ + ρ u ¯ u ¯ = p ¯ + 2 μ S ¯ 1 3 u ¯ I + 2 μ sgs S ¯
The variables appearing in the equations are as follows: ρ is the density, u ¯ is the filtered velocity, μ is the viscosity, p ¯ is the modified filtered pressure, S ¯ is the strain rate, and I is the 3 × 3 identity matrix. The Smagorinsky–Lilly model [38] is adopted to solve sub-grid scale eddy viscosity.
μ sgs = ρ L s 2 S ¯
L S = min k d , C s Δ
k is the von Kármán constant, for which a value of 0.4 is widely accepted [39]. In this paper, k = 0.41 is adopted as a default constant in Ansys Fluent and d is the length to the closest wall. Lilly first evaluated the Smagorinsky constant (Cs) at around 0.17 for homogeneous isotropic turbulence. However, a value of 0.1 seems to satisfy a wide range of flows according to the Fluent Theory Guide [37] and Chen [22] uses this value in the large eddy simulation study of a swirl combustor; Δ   is the local grid size calculated based on the cell volume.

2.3. Coherent Structure Extraction Method

In this study, the POD and SPOD methods used to extract the three-dimensional coherent structures in the non-reactive flow field are referred to [30,40,41], respectively. The basic descriptions of the two methods are summarized in Section 2.3.1 and Section 2.3.2. The modal decomposition is realized through MATLAB, and Schmidt’s MATLAB code is used for the SPOD study [42].

2.3.1. Proper Orthogonal Decomposition

Constructing the original data matrix X[m,n] relies on monitoring and recording the flow information at different locations and times. Matrix X consists of two parts. The dimension of vector m and n is determined by the amount of spatial data and the number of snapshots, respectively. Matrix X can be expressed as the sum of the time-averaged and transient matrix, as shown in Equation (5):
X = X ¯ + X
The time-averaged value, called the 0-order mode, must be subtracted since POD assumes the process is a zero-mean stochastic process. For the centralized matrix a, a covariance matrix R is calculated, as shown in Equations (6) and (7):
a = X t
R = 1 n 1 a T a
R is a symmetric matrix. To further diagonalize it, the covariance matrix is decomposed by eigen orthogonal decomposition to obtain the maximum variance change directions known as spatial modes. Each modal energy is represented by elements on the diagonal of eigenvalues matrix D, as shown in Equations (8) and (9):
R λ = D λ
λ = ϕ 1   ϕ 2   ϕ 3     ϕ n
λ is eigenvector matrix
b = a λ
b is the temporal coefficient. The original matrix is expressed as the sum of the product of each time coefficient and space coefficient, as shown in Equation (11):
X = X ¯ + i = 1 n b i ϕ i

2.3.2. Spectral Proper Orthogonal Decomposition

The SPOD method proposed is based on Welch’s method [43], which is a modified periodic power spectrum density estimation method. For the centralized matrix a, an appropriate window width is selected to divide the original data into overlapping blocks with the same snapshots. The ith block of matrix A is constructed as shown in Equation (12), where nfft is the number of snapshots.
A i = a 1 i , a 2 i , a n f f t i
Discrete Fourier transform (DFT) is used for the matrix to obtain spectrum characteristics for a single block. The Hamming window is chosen to suppress leakage and the window function is shown in Equation (13):
w j = 0.54 0.46 cos ( 2 π j n f f t 1 )     f o r   j = 0 , 1 , 2 , n f f t 1
Subsequently, the weighted temporal discrete Fourier transform is performed, as shown in Equation (14):
a ^ j i = w j a j i
The ith block of matrix A is calculated, as shown in Equation (15):
A ^ i = a ^ 1 i , a ^ 2 i , a ^ n f f t i
Then, the jth frequency in all blocks is reconstructed, as shown in Equation (16), where nblk is the number of overlapping blocks.
A ^ j = a ^ j 1 , a ^ j 2 , a ^ j n b l k
The SPOD modes and corresponding eigenvalues are computed via the method of snapshots [44], which improve the computational efficiency, as shown in Equation (17):
A ^ j T W A ^ j Ψ ^ j = Ψ ^ j Λ ^ j
W is the weight matrix, as shown in Equation (18):
W = Ι
A ^ j T W A ^ j Ψ ^ j = Ψ ^ j Λ ^ j
After SPOD construction, the different modes at a given frequency are spatially orthogonal and the modes at different frequencies are orthogonal in the original temporal domain.

3. Results

3.1. Model Validation

The kinetic energy spectrums at the monitored probe in both dual-swirl combustor and single-swirl combustor are presented in Figure 3. The monitored probe is arranged at the outlet of the pilot swirler. The horizontal axis represents the wave number K, while the longitudinal axis represents the kinetic energy. Komogorov’s −5/3 decay law is observed in the high wavenumber region. The average grid size is located in the inertial sub-range of the turbulent kinetic energy spectrum, which indicates that the grid scale is sufficient to capture the critical turbulence structure [45].
Moreover, the Pope’s criterion calculated by Equation (20) [46] is used to check the grid scale further:
m = k s g s k r e s + k s g s
The kres represents the turbulent kinetic energy resolved by mesh and the ksgs represents the remaining energy modeled by the sgs model. After multiple rounds of refinement, the mesh cell numbers of the dual-swirl combustor and single-swirl combustor are 14 M and 10 M, respectively. From Figure 4, the m value is smaller than 0.2 in most areas of the combustor YZ section, satisfying the specific requirements of large eddy simulation.
The PIV results are used to validate the numerical model for the dual-swirl combustor. The detailed system arrangements are presented in this paper [4]. The numerical and experimental axial velocity profiles along the streamwise are compared in Figure 5. The numerical and PIV results are represented by the solid black line and black dashes, respectively. At every axial location, the black dashes distribute on the black line, which indicates the convincement of numerical results.
Further validation of the second-order statistics of the numerical method is then performed in the single-swirl combustor. Please refer to [36] for the detailed arrangement of the PIV system. The comparison of mean and r.m.s axial velocity between numerical and experimental results is presented in Figure 6. The large eddy simulation results agree well with the experimental results at five axial locations.

3.2. Steady and Transient Flow Characteristics of the Dual-Swirl Combustor

The steady axial velocity contour with a zero-velocity line and the instantaneous axial velocity contour with streamlines are presented in Figure 7. The solid black line marks the zero-velocity margin in the time-averaged axial velocity contour. Three categories of recirculation zones are defined based on the location of the combustor. The central recirculation zone (CRZ) in the center of the combustor has a large scale in both axial and radial directions. Near the external corner of the combustor, the external recirculation zone (ERZ) is spotted as having half axial length of CRZ and little radial length. The lip recirculation zone (LRZ) stands between two swirl jets, having the minimum scale in all recirculation zones. The unsteady axial velocity distribution and streamlines are demonstrated in Figure 7 (right), where the negative velocity region is marked by cyan color. The CRZ is further divided into two parts based on the formation mechanism: zone I and zone II.
As a typical flow characteristic of the dual-swirl combustor, the lip recirculation zone is caused by the mutual effect of vortex shedding both in the pilot jet outer shear layer and the main jet inner shear layer. The radial scale of LRZ is dominated by the radial distance between the exits of two swirlers. At the same time, the axial scale of LRZ is affected by multiple factors, such as flow rate, swirl jet angle, and radial distance of two swirlers. The investigations of LI L [47] and YU HAN [2] showed that the confinement ratio played a vital role in forming PVC and the central recirculation zone. On the one hand, the LRZ acts as an aerodynamic obstacle to reduce the local confinement ratio at the exit of the pilot swirler. By removing the main swirler, the PVC vanishes with LRZ. On the other hand, the lower the confinement ratio, the larger the pressure gradient caused by the centrifugal force, which helps to generate the recirculation zone. Second, LRZ separates the air flow of two swirlers, weakening the interference effect of the main swirl jet on the vortex breakdown bubble (VBB) related to the pilot swirler.
The central recirculation zone is significant in combustion organization and flame stabilization. According to the time-averaged axial velocity contour, CRZ extends from the exit of the pilot swirler downstream of the combustor with a slight retraction, which is different from the Y-shaped CRZ observed by LI L [47]. The confinement ratio and positive axial velocity area of the YZ section in this paper are more significant than in the literature [48]. The flow brought back by the CRZ or VBB [10] must transport downstream to satisfy the mass conservation. The larger the quantity of reflux, the more significant the positive axial velocity area, similar to the phenomenon observed in [48].
The dynamic evolution process of vortexes in the combustor is presented in the instantaneous axial velocity contour. The vortex shedding mainly occurs in the region with a large velocity gradient, namely, on both sides of the rotating jet shear layers. The vortex shedding from shear layers will cause local reverse flow. Based on the formation causes, the CRZ is divided into two parts, marked by the red dotted line. Near the exit of the pilot swirler, Z = 0–40, no interference effect is observed between two stage swirler jets due to the presence of the lip recirculation zone. Thus, zone 1 is completely determined by the pilot’s swirling jet. As two swirler jets interact and merge at Z = 50, zone 2 is affected by both pilot and main swirling flow. The instability of the rotating jet leads to the change in the scale of the recirculation zone, mainly characterized by the coherent structure in the flow field.
The PVC structure is first captured by the transient pressure iso-surface and marked by the axial velocity, as shown in Figure 8. Centrifugal force promotes the rapid formation of velocity gradient downstream of the pilot-stage swirler. Under the effect of spiral K-H instability, the periodic vortex shedding in the shear layer rotates around the combustor axis. The PVC’s root anchors at the swirler outlet coincide with the front stagnation point of the CRZ. The PVC distributes at the boundary of the CRZ, with positive axial velocity on the outside and negative axial velocity on the inside. As the large vortex breaks down, the width of PVC gradually decreases along the axial direction. The length of the integral PVC structure is about 20 mm, which is consistent with the axial length of LRZ. The change in the local confinement ratio caused by LRZ dramatically influences the structure of PVC. The oscillation of axial velocity over the temporal domain is recorded by the monitor probe arranged at the outlet of the swirler. Then, the frequency of PVC is obtained through the FFT method, which is 1718 Hz. Its motion in one cycle is shown on the right side of Figure 7; ε represents the period of PVC rotation. PVC rotates counterclockwise in space, which is consistent with the direction of the swirler blade, but rotates clockwise in time, which is determined by the right-hand rule. With the rotation of the PVC, the fragment is detached from the end of the PVC and moves downstream.

3.3. Proper Orthogonal Decomposition Analysis

The three-dimensional energetic coherent structures are identified through the classical proper orthogonal decomposition (POD), as introduced in Section 2. The spatial modes are sorted by energy contribution magnitude to reveal the dominant structure. A total flow time of 100 ms is chosen to achieve sufficient frequency resolution.
Implementing the discrete Fourier transform (DFT) on time terms leads to the power spectrum density curves of the first 12 spatial modes in the frequency domain, as shown in Figure 9. A well-captured coherent structure is characterized by two adjacent modes having the same frequency and similar power spectrum density (PSD). The mode pair I comprising mode 1 and mode 2 represents the most energetic traveling structure with a characteristic frequency of 1718 Hz. In addition, the second-order structure, which has a characteristic frequency that is twice that of mode pair I, is captured by mode pair II. The structures represented by these two mode pairs have periodic characteristics. However, the structures represented by modes 5–12 are approximately non-periodic, since there is no prominent amplitude peak of PSD. The turbulent energy is relatively uniform and spreads in the entire frequency domain.
The Q-criterion sampling frequency is 20 kHz to meet the capture requirement of second-order coherent structure, which is nearly six times the characteristic frequency. Figure 10 presents the turbulent kinetic energy proportion of spatial mode pairs. The contained energy can be compared to the size of the filled circle, while the precise value can be obtained by the coordinate axis. In the inner shear layer of the pilot swirl jet, the existence of a velocity gradient leads to the distribution difference of the pressure field, causing helical K-H instabilities. With the vortex shedding from the mean flow, energy is transferred from the mean flow to the large-scale vortex structure, as the energy peak shown in Figure 4 and Figure 9. The mode pairs containing enormous kinetic energy are mainly distributed below 4000 Hz in the frequency domain, as shown in Figure 10, also named ‘energy containing region’ in the energy spectrum. The mode pair I and mode pair II, identified in Figure 8, have 5.32% and 2.84% of turbulent kinetic energy, respectively. 824 spatial modes can represent 80% of energy. A total of 2000 snapshots are acquired during the POD investigation, which satisfies the convergence demand of spatial modes.
For further investigation, the three-dimensional structure of mode pair I and mode pair II characterized through Q iso-contour is shown in Figure 11a and Figure 11c, respectively. Meanwhile, the Lissajous curves of these mode pairs are presented in Figure 11b and Figure 11d, respectively. Mode pair I represents a single-helix structure with azimuthal wavenumber m = 1 that anchors at the pilot swirler and rotates around the combustor axis. The helical structure is located between the central recirculation zone and the pilot swirl jet inner shear layer, similar to the PVC. The circular shape of the Lissajous curve represents that the phase shift between mode pair I is pi/2. A pair of double-helix structures with azimuthal wavenumber m = 2 is presented in Figure 11c. The characteristic frequency is twice that of the mode pair I, indicating that the double-helix is the second-order harmonic of the single-helix. Based on the spatial morphology, two helical structures are evenly distributed on the circumference, with a phase difference of 2 pi/n (n is the order of harmonic). According to the Lissajous curve in Figure 11d, the phase shift of mode 3 and mode 4 are equal to the mode pair I. The single-helix and double-helix structures related to the PVC described in this section are similar to the experimental results of coherent structure extracted in a single-swirl combustor [32], which proves the reliability of the numerical simulation results again.

3.4. Spectral Proper Orthogonal Decomposition Analysis

The classical POD adopted in Section 3.2 can extract mode based on the energy contribution in spatial space. Therefore, the high-order harmonic structures with low energy are difficult to detect. A Spectral Proper Orthogonal Decomposition described in Section 2 is carried out to obtain energetic coherent structures under all characteristic frequencies. The spectrum parameters must be carefully selected. The larger the data in a single block (Nfft), the higher the power spectrum resolution obtained during DFT, though the variance also becomes large.
The previous investigations [43,49] have indicated that the overlap between two blocks Novlp = Nfft/2 is the best choice. A 50% of overlap ratio is enough to reduce PSD variance and improve spectrum accuracy. When the overlap ratio is over 50%, the effect on the concerned energetic spatial modes’ variance gradually decreases. Meanwhile, the computing time significantly increases. The number of blocks Nblk is calculated by Equation (21):
N b l k = f l o o r ( N t o t a l N o v l p N f f t N o v l p )
In this section, four different values of Nfft (32, 64, 128, and 256, respectively) are selected and the value of integer power of 2 can improve the computational efficiency of DFT. The overlap ratio Novlp = Nfft/2. According to Equation (21), the number of blocks is 124, 61, 30, and 14, respectively.
The energy spectrum calculated by DFT with four sets of spectrum parameters is shown in Figure 12. The horizontal and vertical coordinates represent the frequency and normalized energy, respectively. The sampling time interval is 0.05 ms. Therefore, the maximum distinguishable frequency is 10,000 Hz, marked by the orange dotted line in the energy spectrum. The spatial modes are sorted by energy rank, as indicated by the blue arrow. The energy spectrums with different Nfft show the same development trend. As the value of Nfft increases, the spectrum width is narrowed down and the peaks of the spectrum become apparent, which illustrates the increase in frequency resolution. Low-frequency resolution induces the energy of peak frequency scattering into the surrounding frequencies, resulting in a smooth-out energy peak, which is unacceptable. The energy spectrums with a low value of Nfft have poor spectrum characteristics. When Nfft = 128, four peaks of different order harmonics can be captured clearly, marked by a green circle in Figure 12c. As Nfft further increases to 256, no other finer spectrum structure is obtained. Thus, from the spectrum perspective, Nfft = 128 and Nblk = 30 is the best choice for further investigation.
In addition, it is necessary to verify spatial modes’ convergence properties to obtain reliable results. The convergence property is described by Equations (22) and (23) [50]:
ε ( E k i ) N b l k = ( E k i ) N b l k ( E k i ) N b l k 1 ( E k i ) N b l k ( E k i ) N b l k 1
ε ( φ k i ) N b l k = ( φ k i ) N b l k 2 ( φ k i ) N b l k 1 2 ( φ k i ) N b l k 2 ( φ k i ) N b l k 1 2
E k i represents the energy of mode i at frequency k, φ k i represents the vector of mode i at frequency k, | | is the norm operator, and ‖ ‖2 is the L-2 norm operator.
The energy convergence characteristics of spatial mode 1 corresponding to three frequencies are presented in Figure 13. The solid lines are fitting curves of scattered data. As the number of blocks increases, the energy residual coefficient ε of mode 1 decreases continuously. The ε convergence curve can be divided into two phases according to the convergence rate. The block number ranging from 2 to 5 is phase 1, in which ε decreases rapidly from the initial value to about 0.1. With the block number further increasing, the decreasing rate of ε decreases in phase 2. When the block number reaches 120, the ε corresponding to 859 Hz, 1718 Hz, and 3438 Hz is 1.5%, 4‰, and 1.4‰, respectively. The convergence characteristics of ε are a discrepancy when Nblk < 60. Based on Figure 13a–c, the convergence curves related to various Nblk are different in the block range from 2 to 30. However, the convergence curve presents remarkable similarity when Nblk changes from 60 to 120. The ε curves at different frequencies have the same trend but different values. According to Figure 13d, the difference is mainly caused by the initial value and the changing rate in phase 1. The initial value of the convergence curve at 1718 Hz is smaller than the other two frequencies. Moreover, the convergence rate related to 1718 Hz is the fastest, followed by 3438 Hz, then 859 Hz in phase 1. The greater the energy in the coherent structure, the better the convergence property. Undoubtedly, an Nblk should be selected as large as possible to obtain good convergence characteristics.
The module convergence characteristics of spatial mode 1 corresponding to three frequencies are presented in Figure 14. Similar to the convergence characteristics of modal energy, the module residual coefficient ε of spatial mode 1 also decreases with the increase in block numbers. Based on Figure 14a–c, when Nblk < 60, the convergence process is different from one another. While based on Figure 14c,d, the convergence process of Nblk = 120 is similar to that of Nblk = 60. The influence of characteristic frequency on module residual coefficient ε is weak and the three fitting curves coincide. The larger the Nblk, the better the module convergence performance of mode 1, which is the same as the conclusion of energy convergence characteristics.
The structures of the first fourth-order harmonics of PVC are presented in Figure 15. The first two harmonics representing single- and double-helix structures have been analyzed in Section 3.2 through classical POD. The third-order and fourth-order harmonic structures with azimuthal wavenumber m = 3 and m = 4 are characterized by triple- and quadruple-helical vortex structures encircling the combustor axis at the swirler exit, respectively. The phase shift of the adjacent helical structure is 2 pi/m. The coherent vortexes of high-order harmonics are challenging to maintain a complete helical structure. The vortex ligaments first appear at the end of the helical vortex, then break up into more small-scale vortexes, which maintain rotation due to inertia. The higher the harmonic order, the more significant the proportion of small-scale vortexes in the flow field, verified by the turbulence cascade. Harmonic structures above the fifth order are broken up and cannot be captured. The SPOD method can effectively find the mode with lower energy.

4. Conclusions

The non-reactive flow characteristics of a dual-swirl combustor are studied by large eddy simulation in this paper. According to axial velocity contour and streamline, there are three recirculation zones in different regions of the combustor, which are the central recirculation zone (CRZ), the lip recirculation zone (LRZ), and the external recirculation zone (ERZ). The CRZ is divided into two regions, affected by the pilot swirler jet and two-stage swirler jets, respectively. On the one hand, the lip recirculation zone can weaken the interference effect of the main-stage swirl jets on the pilot-stage air flow. On the other hand, the lip recirculation zone can change the local confinement ratio at the outlet of the pilot swirler and affect the PVC structure. The PVC structure is first captured by the pressure iso-surface and the evolution process during a period is presented. A classical Proper Orthogonal Decomposition method is adopted to study the energetic coherent structure in a dual-swirl combustor. Two mode pairs with the most significant energy are extracted: the single-helix structure with azimuthal wavenumber m = 1 and the double-helix structure with azimuthal wavenumber m = 2. The phase difference between the two modes is pi/2. The discrete Fourier transform (DFT) of time term presents that the characteristic frequencies of the two structures are 1718 Hz and 3436 Hz, respectively. By demonstrating the causes of harmonics and the phase and frequency relationship between harmonics and fundamental waves, it is confirmed that the double-helix structure is the second-order harmonic of the single-helix structure. The Spectral Proper Orthogonal Decomposition method is adopted to capture the high-order harmonic structures in the flow field. The convergence characteristics at different frequencies are verified by calculating the energy and module residual coefficient. From the spectrum perspective, Nfft = 128 and Nblk = 30 is the best choice. The triple-helix and quadruple-helix structures corresponding to the third-order harmonic and the fourth-order harmonic with relatively low energy content are captured through SPOD, which is ignored by the classical POD.

5. Future Recommendation

Based on the results of this paper, relevant research can be continued from the following aspects. Firstly, the study in this paper is under non-reactive conditions. The interaction between coherent structure and flame can be studied in a reactive state. Secondly, the flow field prediction of the dual-swirl combustor can be realized by using the appropriate dimensionality reduction method combined with machine learning. Thirdly, new dimensionality reduction methods can be studied in a simpler physical model (such as flow around a cylinder).

Author Contributions

Conceptualization, X.F. and J.S.; methodology, X.F.; software, X.F.; validation, X.F. and Q.L.; formal analysis, X.F.; investigation, X.F.; resources, L.Z.; data curation, X.F.; writing—original draft preparation, X.F.; writing—review and editing, X.F. and Q.L.; visualization, J.S.; supervision, J.S.; project administration, J.S.; funding acquisition, J.S. All authors have read and agreed to the published version of the manuscript.

Funding

This research is funded by National Science and Technology Major Project (J2019-III-0012-0055) and (J2019-III-0004-0047).

Data Availability Statement

Data available on request from the authors.

Conflicts of Interest

The authors declare no conflict of interest.

References

  1. Yu, H.; Suo, J.Q.; Zhu, P.F.; Zheng, L.X. The Characteristic of Flow Field and Emissions of a Concentric Staged Lean Direct Injection (LDI) Combustor. J. Northwest. Polytech. Univ. 2018, 36, 816–823. [Google Scholar] [CrossRef]
  2. Yu, H.; Suo, J.Q.; Zheng, L.X. Investigation of Non-Reaction and Reaction Flow Characteristic of Single Element Lean Direct Injection Combustor with Convergent Outlet. J. Propuls. Technol. 2019, 40, 608–618. [Google Scholar]
  3. Li, L.; Suo, J.Q.; Zheng, L.X. Effect of Rotating Direction on Flow and Temperature Field of Concentric Staged Combustor. J. Northwest. Polytech. Univ. 2020, 38, 1198–1209. [Google Scholar] [CrossRef]
  4. Li, L.; Suo, J.Q.; Yu, H.; Zhu, P.F.; Zheng, L.X. Non-Reaction Flow Characteristic of Concentric Staged Multi-Point Direct Injection Combustor. J. Propuls. Technol. 2021, 42, 1339–1350. [Google Scholar]
  5. Syred, N. A review of oscillation mechanisms and the role of the precessing vortex core (PVC) in swirl combustion systems. Prog. Energy Combust. Sci. 2006, 32, 93–161. [Google Scholar] [CrossRef]
  6. Steinberg, A.M.; Boxx, I.; Stoehr, M.; Carter, C.D.; Meier, W. Flow flame interactions causing acoustically coupled heat release fluctuations in a thermo-acoustically unstable gas turbine model combustor. Combust. Flame 2010, 157, 2250–2266. [Google Scholar] [CrossRef]
  7. Orbay, R.C.; Nogenmyr, K.J.; Klingmann, J.; Bai, X.S. Swirling turbulent flows in a combustion chamber with and without heat release. Fuel 2013, 104, 133–146. [Google Scholar] [CrossRef]
  8. Stopper, U.; Meier, W.; Sadanandan, R.; Stoehr, M.; Aigner, M.; Bulat, G. Experimental study of industrial gas turbine flames including quantification of pressure influence on flow field, fuel/air premixing and flame shape. Combust. Flame 2013, 160, 2103–2118. [Google Scholar] [CrossRef]
  9. Salvador, F.J.; Carreres, M.; Garcia-Tiscar, J.; Belmar-Gil, M. Modal decomposition of the unsteady non-reactive flow field in a swirl-stabilized combustor operated by a Lean Premixed injection system. Aerosp. Sci. Technol. 2021, 112, 106622. [Google Scholar] [CrossRef]
  10. Lucca-Negro, O.; O’Doherty, T. Vortex breakdown: A review. Prog. Energy Combust. Sci. 2001, 27, 431–481. [Google Scholar] [CrossRef]
  11. Chanaud, R.C. Observations of oscillatory motion in certain swirling flows. J. Fluid Mech. 2006, 21, 111–127. [Google Scholar] [CrossRef]
  12. Lilley, D.G. Swirl Flows in Combustion: A Review. AIAA J. 1977, 15, 1063–1078. [Google Scholar] [CrossRef]
  13. Terhaar, S.; Paredes, P.; Oberleithner, K.; Theofilis, V.; Paschereit, C.O. Investigation of the Global Mode in Swirling Combustor Flows: Experimental Observations and Local and Global Stability Analysis. Procedia IUTAM 2015, 14, 553–562. [Google Scholar] [CrossRef]
  14. Vashahi, F.; Lee, J. On the emerging flow from a dual-axial counter-rotating swirler; LES simulation and spectral transition. Appl. Therm. Eng. 2018, 129, 646–656. [Google Scholar] [CrossRef]
  15. Valera-Medina, A.; Syred, N.; Griffiths, A. Visualisation of isothermal large coherent structures in a swirl burner. Combust. Flame 2009, 156, 1723–1734. [Google Scholar] [CrossRef]
  16. Ranga Dinesh, K.K.J.; Kirkpatrick, M.P.; Jenkins, K.W. Investigation of the influence of swirl on a confined coannular swirl jet. Comput. Fluids 2010, 39, 756–767. [Google Scholar] [CrossRef]
  17. Durox, D.; Moeck, J.P.; Bourgouin, J.F.; Morenton, P.; Viallon, M.; Schuller, T.; Candel, S. Flame dynamics of a variable swirl number system and instability control. Combust. Flame 2013, 160, 1729–1742. [Google Scholar] [CrossRef]
  18. Vanierschot, M.; Ogus, G. Experimental investigation of the precessing vortex core in annular swirling jet flows in the transitional regime. Exp. Therm. Fluid Sci. 2019, 106, 148–158. [Google Scholar] [CrossRef]
  19. Huang, D.X.; Xu, J.G.; Chen, R.Y.; Meng, H. Large eddy simulations of turbulent combustion of kerosene-air in a dual swirl gas turbine model combustor at high pressures. Fuel 2020, 282, 118820. [Google Scholar] [CrossRef]
  20. Gomez-Ramirez, D.; Ekkad, S.V.; Moon, H.K.; Kim, Y.; Srinivasan, R. Isothermal coherent structures and turbulent flow produced by a gas turbine combustor lean pre-mixed swirl fuel nozzle. Exp. Therm. Fluid Sci. 2017, 81, 187–201. [Google Scholar] [CrossRef]
  21. Ruan, C.; Chen, F.; Yu, T.; Cai, W.; Li, X.; Lu, X. Experimental characterization of flame/flow dynamics during transition between stable and thermo-acoustically unstable conditions in a gas turbine model combustor. Aerosp. Sci. Technol. 2020, 102, 105858. [Google Scholar] [CrossRef]
  22. Chen, Z.X.; Langella, I.; Swaminathan, N.; Stohr, M.; Meier, W.; Kolla, H. Large Eddy Simulation of a dual swirl gas turbine combustor: Flame/flow structures and stabilisation under thermoacoustically stable and unstable conditions. Combust. Flame 2019, 203, 279–300. [Google Scholar] [CrossRef]
  23. Zhu, R.J.; Pan, D.; Ji, C.Z.; Zhu, T.; Lu, P.P.; Gao, H. Combustion instability analysis on a partially premixed swirl combustor by thermoacoustic experiments and modeling. Energy 2020, 211, 118884. [Google Scholar] [CrossRef]
  24. Candel, S.; Durox, D.; Schuller, T.; Palies, P.; Bourgouin, J.-F.; Moeck, J.P. Progress and challenges in swirling flame dynamics. Comptes Rendus Mécanique 2012, 340, 758–768. [Google Scholar] [CrossRef]
  25. Lumley, J.L. The structure of inhomogeneous turbulent flows. In Atmospheric Turbulence and Radio Wave Propagation; Yaglom, A.M., Tatarski, V.I., Eds.; Nauka: Moscow, Russia, 1967; pp. 166–178. [Google Scholar]
  26. Duwig, C.; Fuchs, L.; Lacarelle, A.; Beutke, M.; Paschereit, C.O. Study of the Vortex Breakdown in a Conical Swirler Using LDV, LES and POD. In Proceedings of the Turbo Expo: Power for Land, Sea, and Air, Montreal, QC, Canada, 14–17 May 2007; Volume 2, pp. 1–10. [Google Scholar] [CrossRef]
  27. Terhaar, S.; Reichel, T.G.; Schrödinger, C.; Rukes, L.; Paschereit, C.O.; Oberleithner, K. Vortex Breakdown Types and Global Modes in Swirling Combustor Flows with Axial Injection. J. Propuls. Power 2015, 31, 219–229. [Google Scholar] [CrossRef]
  28. Paredes, P.; Terhaar, S.; Oberleithner, K.; Theofilis, V.; Paschereit, C.O. Global and Local Hydrodynamic Stability Analysis as a Tool for Combustor Dynamics Modeling. J. Eng. Gas Turbines Power 2016, 138, 021504. [Google Scholar] [CrossRef]
  29. Zhang, J.; Hu, B.; Fang, A.; Wang, Z.; Zhao, Q. Analysis of coherent structures in partly confined swirling flows. Aerosp. Sci. Technol. 2020, 107, 106280. [Google Scholar] [CrossRef]
  30. Towne, A.; Schmidt, O.T.; Colonius, T. Spectral proper orthogonal decomposition and its relationship to dynamic mode decomposition and resolvent analysis. J. Fluid Mech. 2018, 847, 821–867. [Google Scholar] [CrossRef]
  31. Sieber, M.; Oberleithner, K.; Paschereit, C.O. Spectral proper orthogonal decomposition. J. Fluid Mech. 2016, 792, 798–828. [Google Scholar] [CrossRef]
  32. Vanierschot, M.; Müller, J.S.; Sieber, M.; Percin, M.; van Oudheusden, B.Q.; Oberleithner, K. Single- and double-helix vortex breakdown as two dominant global modes in turbulent swirling jet flow. J. Fluid Mech. 2020, 883, A31. [Google Scholar] [CrossRef]
  33. Schmid, P. Dynamic mode decomposition of numerical and experimental data. J. Fluid Mech. 2010, 656, 5–28. [Google Scholar] [CrossRef]
  34. Nekkanti, A.; Schmidt, O.T. Frequency–time analysis, low-rank reconstruction and denoising of turbulent flows using SPOD. J. Fluid Mech. 2021, 926, A26. [Google Scholar] [CrossRef]
  35. Taira, K.; Brunton, S.L.; Dawson, S.T.M.; Rowley, C.W.; Colonius, T.; McKeon, B.J.; Schmidt, O.T.; Gordeyev, S.; Theofilis, V.; Ukeiley, L.S. Modal Analysis of Fluid Flows: An Overview. AIAA J. 2017, 55, 4013–4041. [Google Scholar] [CrossRef]
  36. Cai, J.; Jeng, S.-M.; Tacina, R. The Structure of a Swirl-Stabilized Reacting Spray Issued from an Axial Swirler. In Proceedings of the 43rd AIAA Aerospace Sciences Meeting and Exhibit, Reno, NV, USA, 10–13 January 2005; p. 1424. [Google Scholar]
  37. ANSYS, Inc. ANSYS Fluent Theory Guide, Release R1; ANSYS, Inc.: Canonsburg, PA, USA, 2020. [Google Scholar]
  38. Lilly, D.K. On the Application of the Eddy Viscosity Concept in the Inertial Sub-Range of Turbulence; National Center for Atmospheric Research: Boulder, CO, USA, 1966. [Google Scholar] [CrossRef]
  39. Foken, T. 50 Years of the Monin–Obukhov Similarity Theory. Bound.-Layer Meteorol. 2006, 119, 431–447. [Google Scholar] [CrossRef]
  40. Cazemier, W.; Verstappen, R.W.C.P.; Veldman, A.E.P. Proper orthogonal decomposition and low-dimensional models for driven cavity flows. Phys. Fluids 1998, 10, 1685–1699. [Google Scholar] [CrossRef]
  41. Manhart, M.; Wengle, H. A spatiotemporal decomposition of a fully inhomogeneous turbulent flow field. Theor. Comput. Fluid Dyn. 1993, 5, 223–242. [Google Scholar] [CrossRef]
  42. Schmidt, O. SpectralPOD/spod_matlab. 2022. Available online: https://github.com/SpectralPOD/spod_matlab (accessed on 20 October 2022).
  43. Welch, P. The use of fast Fourier transform for the estimation of power spectra: A method based on time averaging over short, modified periodograms. IEEE Trans. Audio Electroacoust. 1967, 15, 70–73. [Google Scholar] [CrossRef]
  44. Sirovich, L. Turbulence and the Dynamics of Coherent Structures. Q. Appl. Math. 1987, 45, 561–571. [Google Scholar] [CrossRef]
  45. Wang, S.; Yang, V.; Hsiao, G.; Hsieh, S.; Mongia, H. Large-eddy simulations of gas-turbine swirl injector flow dynamics. J. Fluid Mech. 2007, 583, 99–122. [Google Scholar] [CrossRef]
  46. Pope, S.B. Ten questions concerning the large-eddy simulation of turbulent flows. New J. Phys. 2004, 6, 35. [Google Scholar] [CrossRef]
  47. Li, L.; Zhu, P.; Li, Q.; Sao, J.; Zheng, L. Experimental and numerical investigation of non-reaction flow characteristics in a concentric staged dual-swirl combustor. J. Mech. Sci. Technol. 2022, 36, 2069–2082. [Google Scholar] [CrossRef]
  48. Syred, N.; Chong, W.; Rodriquez-Martinez, V.; Dawson, J.; Kelso, R. Characterisation of the occurrence of the precessing vortex core in partially premixed and non-premixed swirling flow. In Proceedings of the 12th International Symposium on the Applications of Laser Techniques to Fluid Mechanics, Lisbon, Portugal, 11–14 July 2004; pp. 21–23. [Google Scholar]
  49. Schmidt, O.T.; Colonius, T. Guide to Spectral Proper Orthogonal Decomposition. AIAA J. 2020, 58, 1023–1033. [Google Scholar] [CrossRef]
  50. Muld, T.W.; Efraimsson, G.; Henningson, D.S. Flow structures around a high-speed train extracted using Proper Orthogonal Decomposition and Dynamic Mode Decomposition. Comput. Fluids 2012, 57, 87–97. [Google Scholar] [CrossRef]
Figure 1. The structure of dual-swirl direct-mixing combustor.
Energies 16 06182 g001
Figure 2. The swirler and test section setup [36].
Energies 16 06182 g002
Figure 3. Turbulent kinetic energy spectrum of the monitored probe. (a) Dual-swirl combustor; (b) single-swirl combustor.
Energies 16 06182 g003
Figure 4. The m contour of YZ section. (a) Dual-swirl combustor; (b) single-swirl combustor.
Energies 16 06182 g004
Figure 5. Comparison between numerical and experimental time-averaged axial velocity profiles at seven streamwise locations.
Energies 16 06182 g005
Figure 6. The comparison of mean and r.m.s axial velocity between numerical and experimental results at five axial locations.
Energies 16 06182 g006
Figure 7. Contour of time-averaged axial velocity with zero-velocity line (left); contour of instantaneous axial velocity with streamlines (right).
Energies 16 06182 g007
Figure 8. The PVC that is captured by the pressure iso-surface.
Energies 16 06182 g008
Figure 9. The power spectrum density of the first 12 modes in the frequency domain.
Energies 16 06182 g009
Figure 10. Turbulent kinetic energy proportion of mode pairs in flow using POD.
Energies 16 06182 g010
Figure 11. (a) Spatial structure of mode pair I. Red: mode 1; Blue: mode 2; (b) the phase difference between mode 1 and mode 2; (c) spatial structure of mode pair II. Red: mode 3; Blue: mode 4; (d) the phase difference between mode 3 and mode 4.
Energies 16 06182 g011aEnergies 16 06182 g011b
Figure 12. The energy spectrum of SPOD with four different sets of spectrum parameters. (a) Nfft = 32, Nblk = 124; (b) Nfft = 64, Nblk = 61; (c) Nfft = 128, Nblk = 30; (d) Nfft = 256, Nblk = 14.
Energies 16 06182 g012
Figure 13. The energy convergence characteristics of spatial mode 1 correspond to three frequencies. (a) Nblk = 14; (b) Nblk = 30; (c) Nblk = 60; (d) Nblk = 120.
Energies 16 06182 g013
Figure 14. The module convergence characteristics of spatial mode 1 correspond to three frequencies. (a) Nblk = 14; (b) Nblk = 30; (c) Nblk = 60; (d) Nblk = 120.
Energies 16 06182 g014
Figure 15. The coherent structures correspond to different order harmonics. (a) First-order; (b) second-order; (c) third-order; (d) fourth-order.
Energies 16 06182 g015
Disclaimer/Publisher’s Note: The statements, opinions and data contained in all publications are solely those of the individual author(s) and contributor(s) and not of MDPI and/or the editor(s). MDPI and/or the editor(s) disclaim responsibility for any injury to people or property resulting from any ideas, methods, instructions or products referred to in the content.

