
Analysis of Voltage Distortions in the Power Grid Arising from Agricultural Biogas Plant Operation

 , , ,
, , ,  ,
,
Abstract
:1. Introduction
- Uh—rms value of the voltage for the h-th harmonic (V);
- U1—rms value of the voltage for the first harmonic (fundamental frequency) (V);
- h—harmonic order.
- Cause additional power losses in them (in lines, these will be additional power losses due to the increase in the rms value of the current and the resistance of the conductors);
- Cause a reduction in the capacity of electricity networks;
- Cause measuring instruments (i.e., analogue meters, inductive energy meters) to malfunction and thus often cause protection systems to malfunction.
2. Materials and Methods
3. Results and Discussion
3.1. Studies on the Quality of Electricity Generated at Biogas Plant No. 1
3.2. Studies on the Quality of Electricity Generated at Biogas Plant No. 2
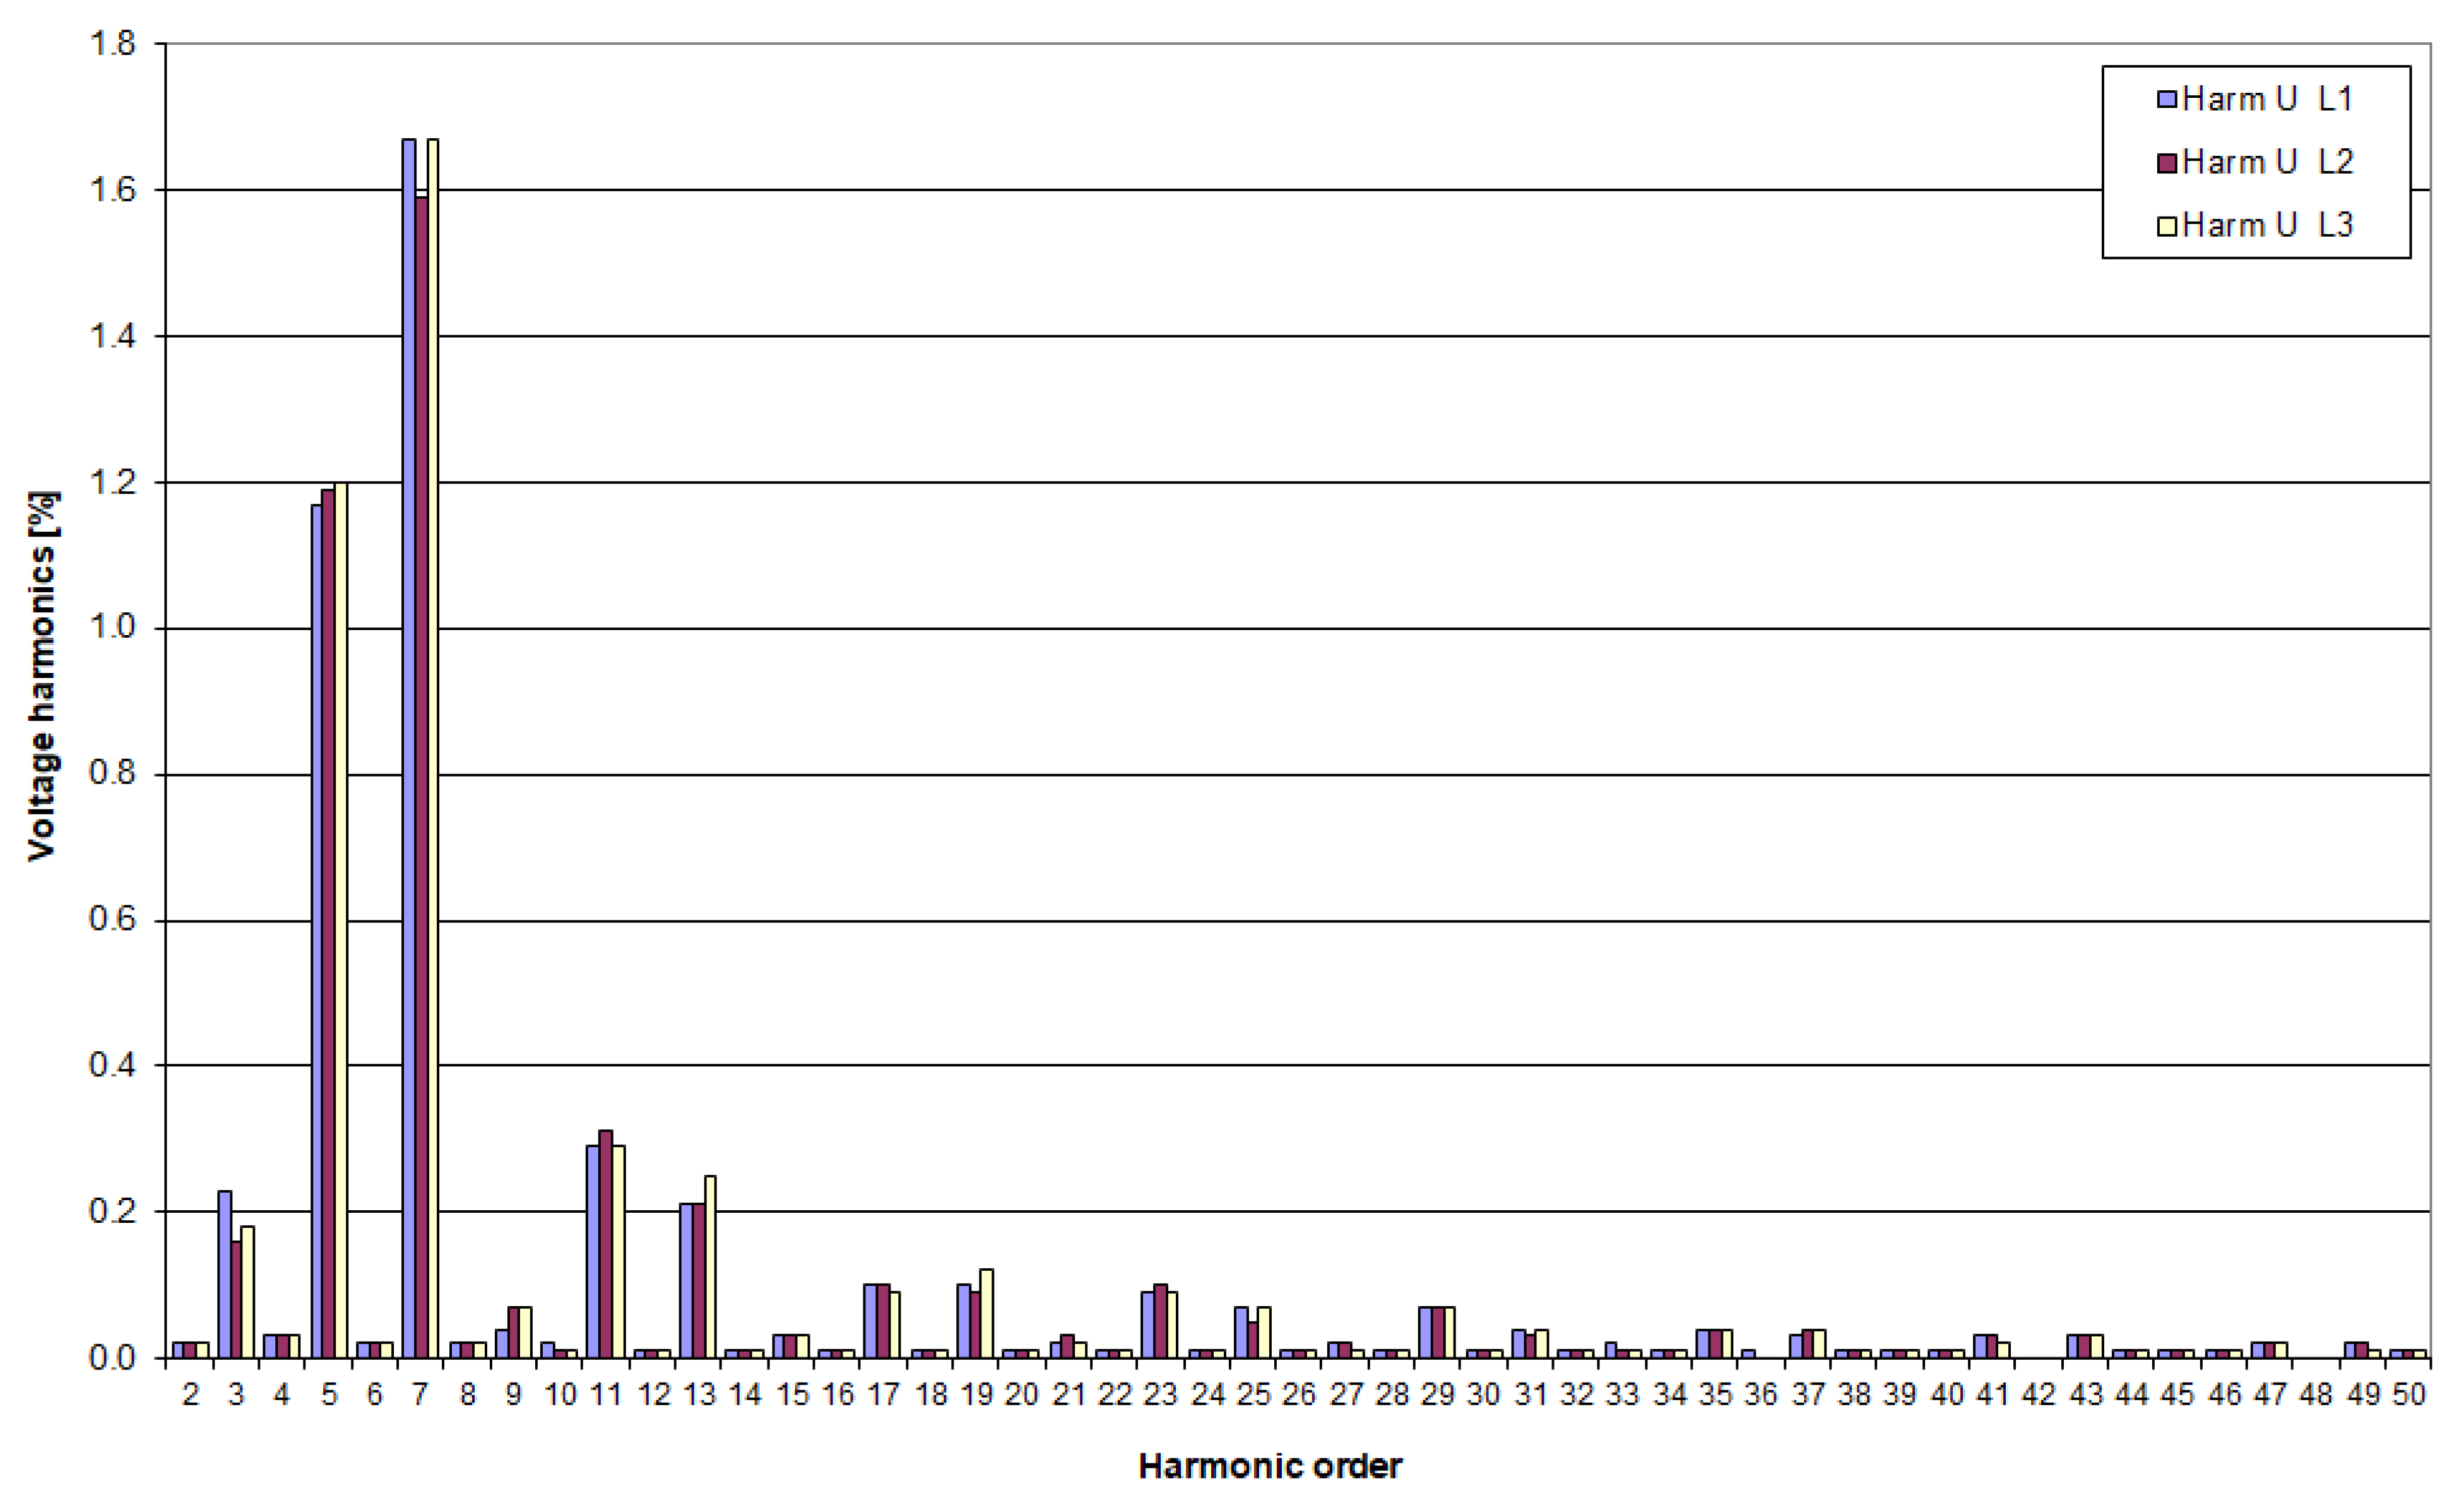
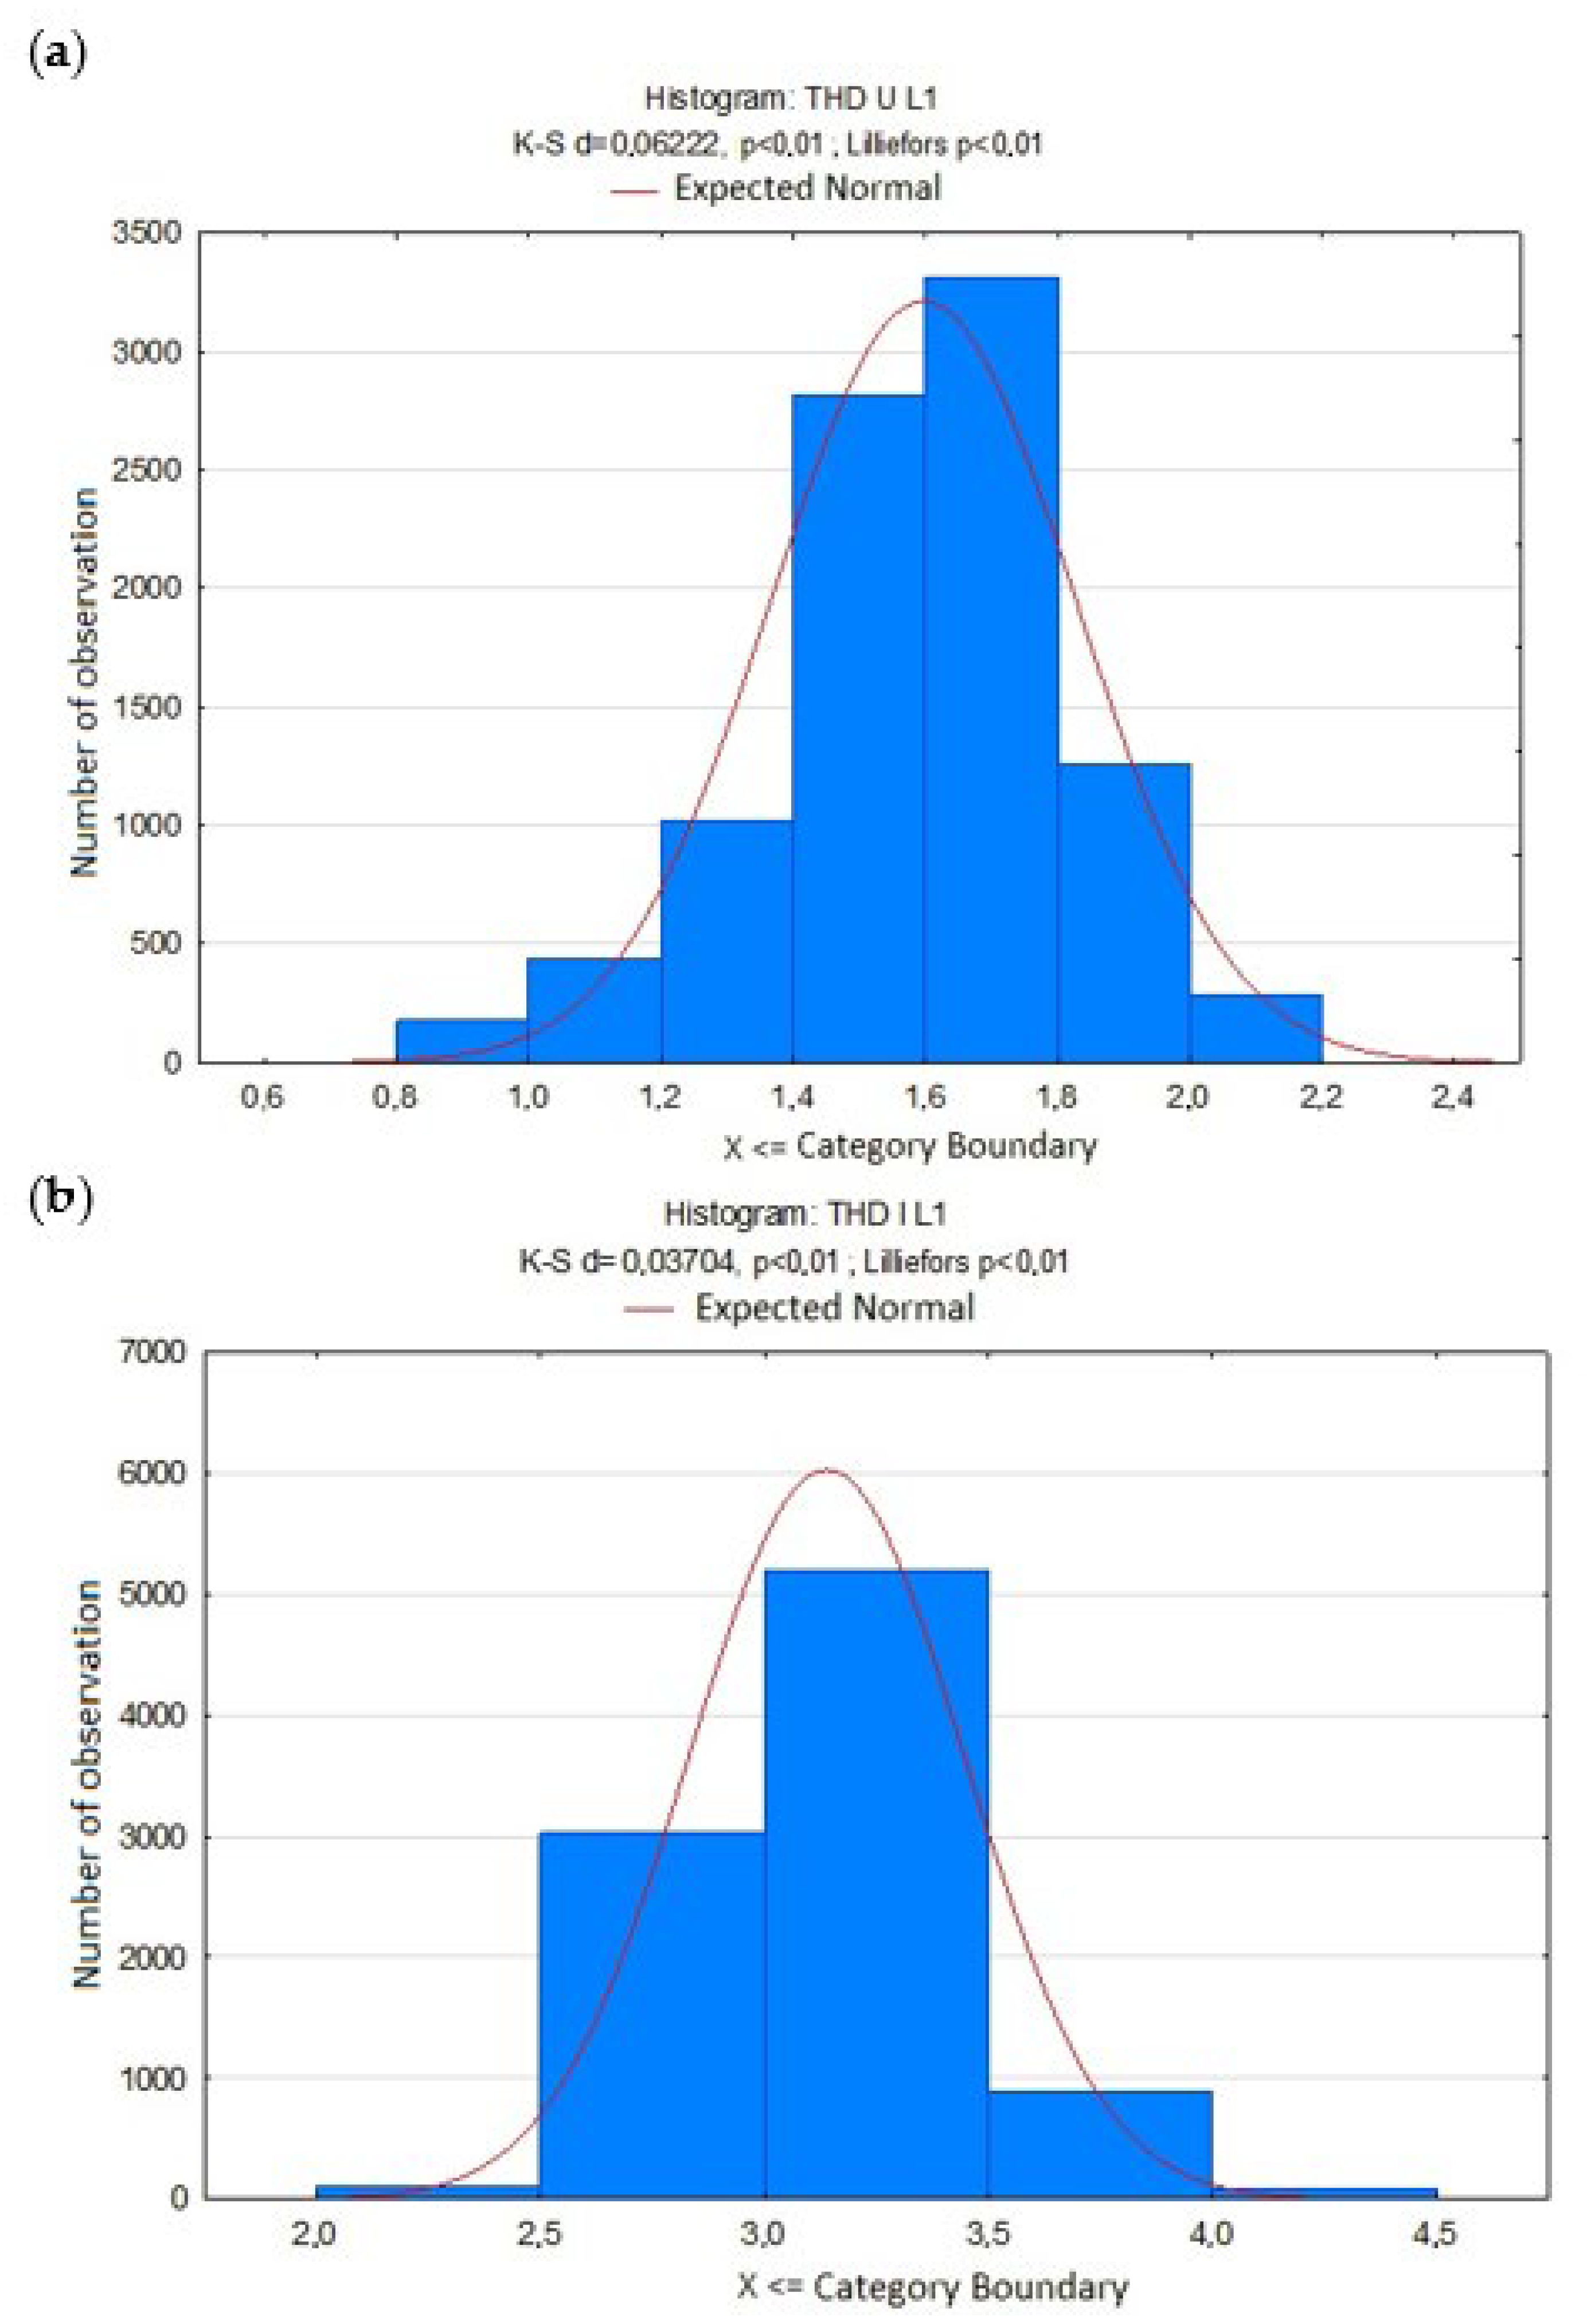
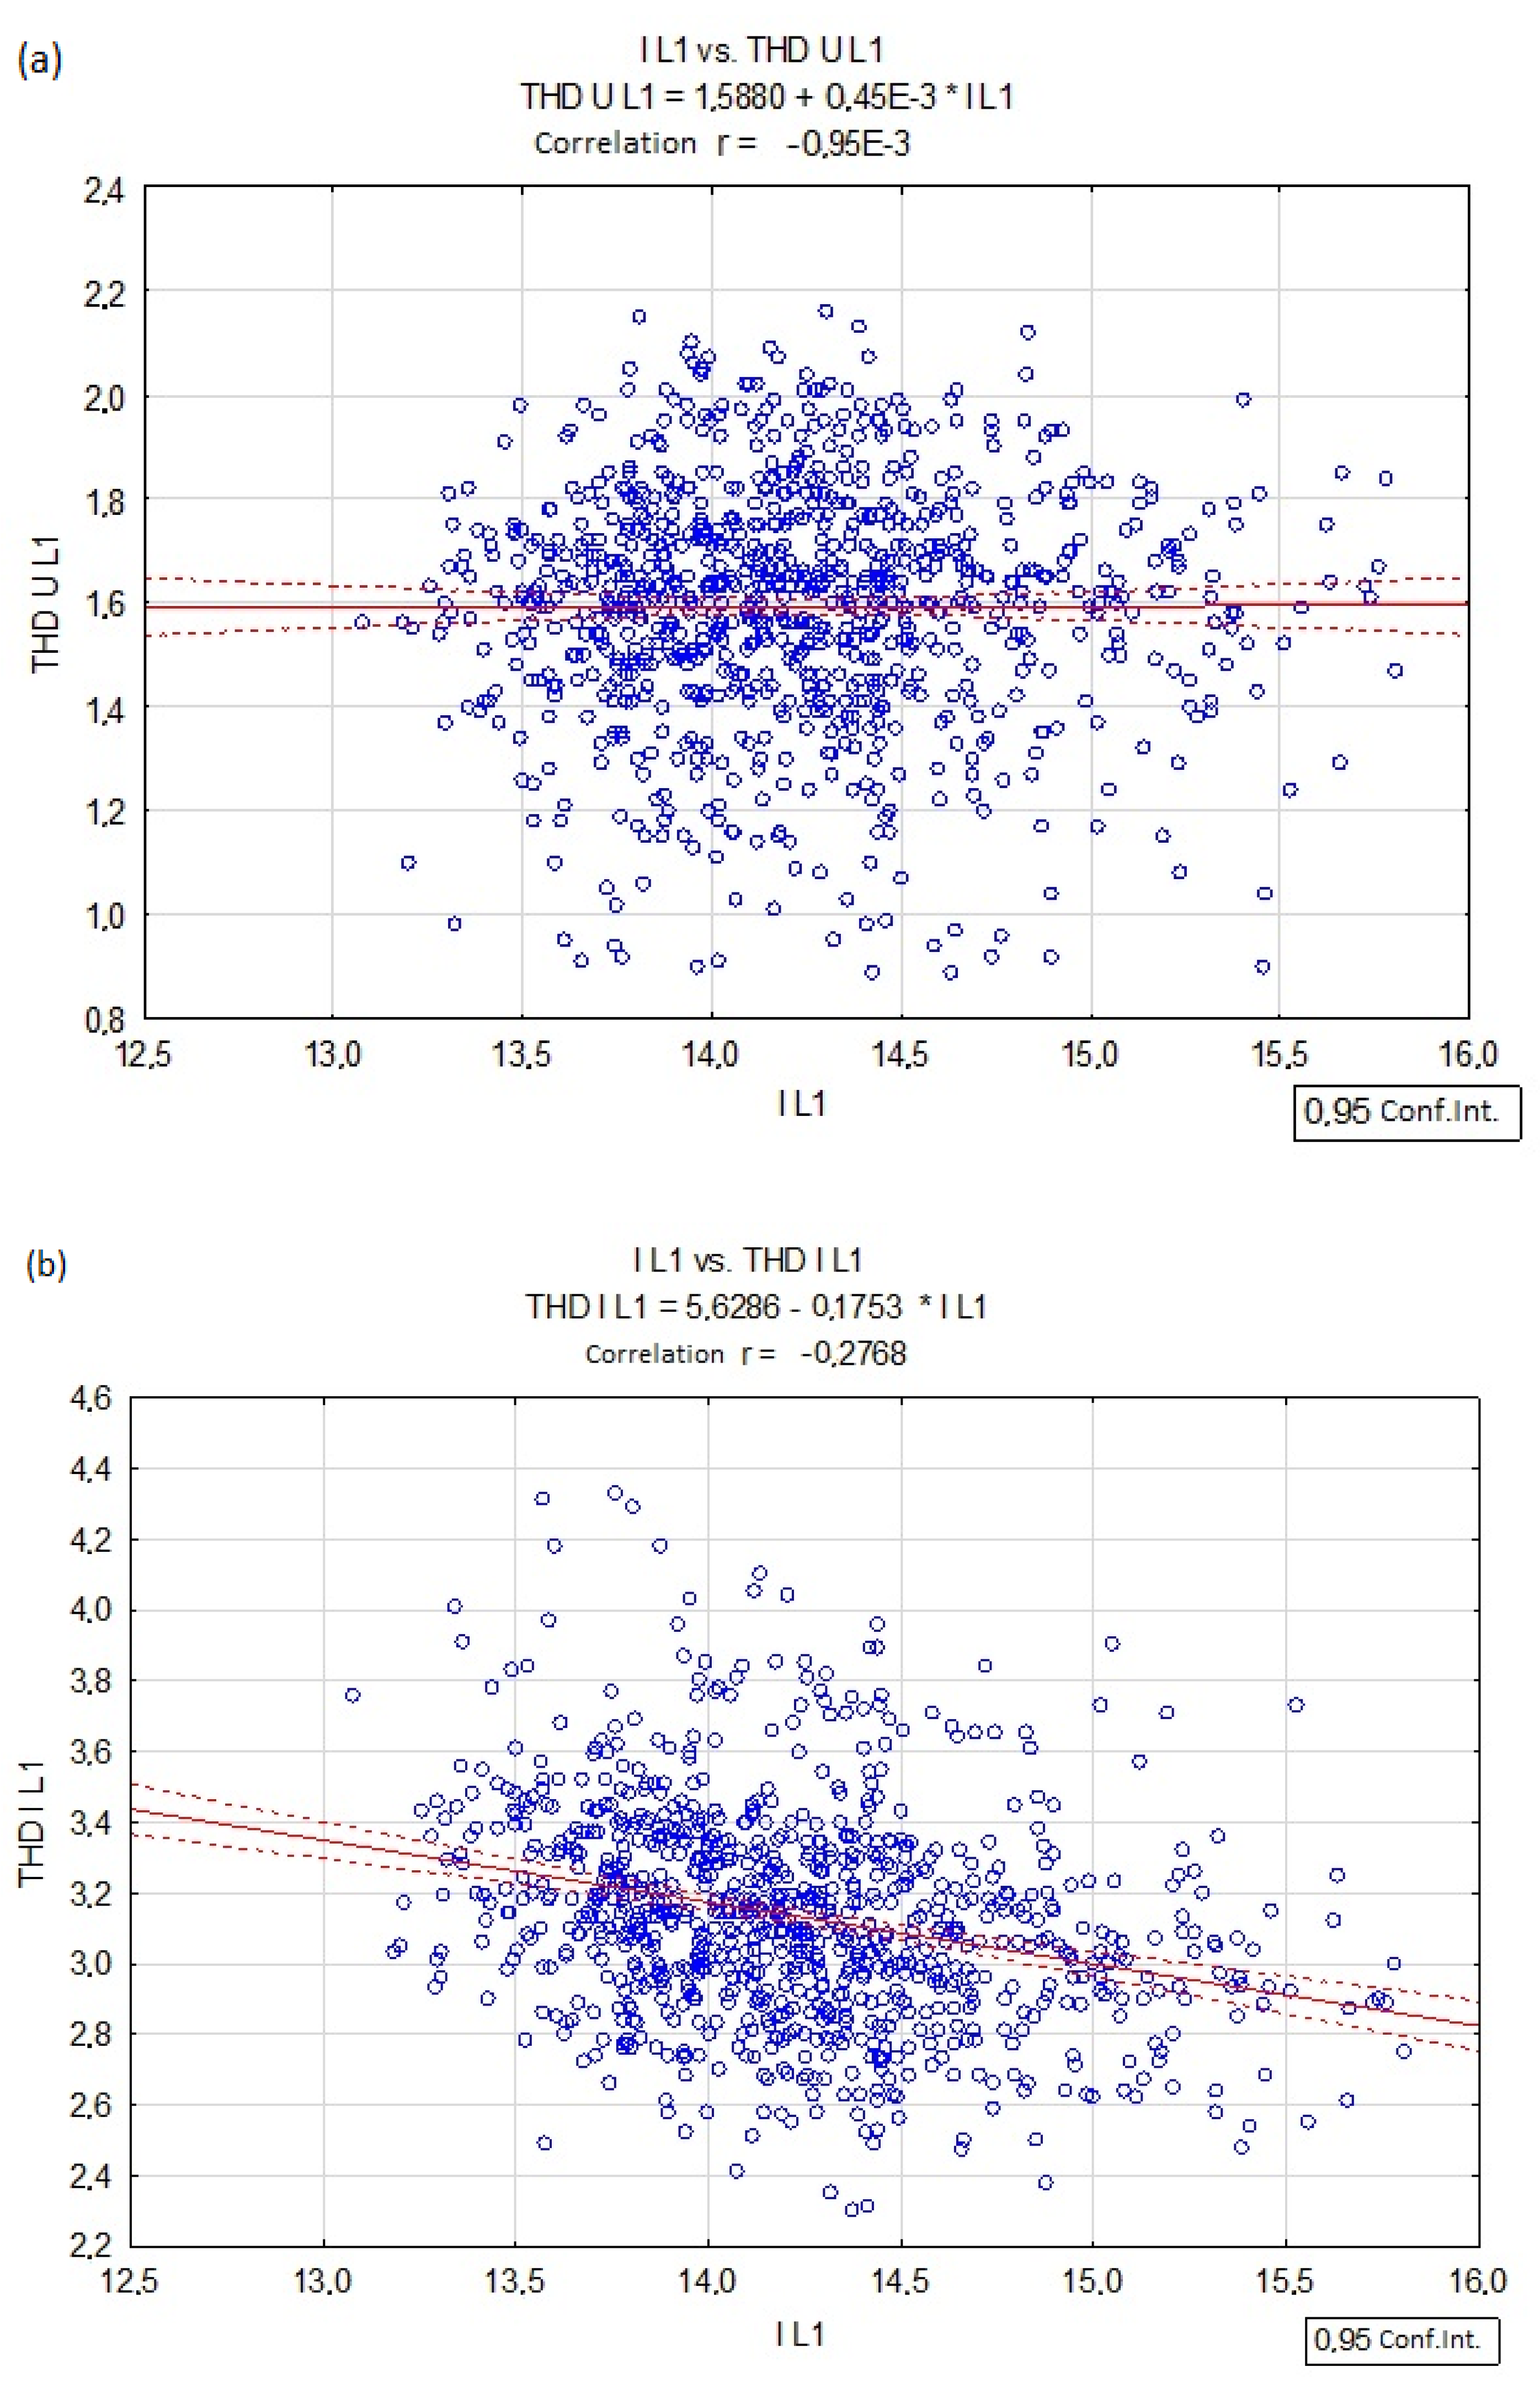
3.3. Studies on the Quality of Electricity Generated at Biogas Plant No. 3
4. Conclusions
Author Contributions
Funding
Data Availability Statement
Conflicts of Interest
References
- Burg, V.; Bowman, G.; Haubensak, M.; Baier, U.; Thees, O. Valorization of an untapped resource: Energy and greenhouse gas emissions benefits of converting manure to biogas through anaerobic digestion. Resour. Conserv. Recycl. 2018, 136, 53–62. [Google Scholar] [CrossRef]
- Esteves, E.M.M.; Herrera, A.M.N.; Esteves, V.P.P.; Vaz Morgado, C.d.R. Life cycle assessment of manure biogas production: A review. J. Clean. Prod. 2019, 219, 411–423. [Google Scholar] [CrossRef]
- Tucki, K.; Kominek, M. Technical Economic Analysis of a 0.8 MW Agricultural Biogas Plant. J. Water Land Dev. 2016, 16, 59–64. [Google Scholar]
- Borek, K.; Romaniuk, W.; Roman, K.; Roman, M.; Kuboń, M. The analysis of a prototype installation for biogas production from selected agricultural substrates. Energies 2021, 14, 2132. [Google Scholar] [CrossRef]
- Sikora, J.; Niemiec, M.; Szeląg-Sikora, A.; Gródek-Szostak, Z.; Kuboń, M.; Komorowska, M. The Effect of the Addition of a Fat Emulsifier on the Amount and Quality of the Obtained Biogas. Energies 2020, 13, 1825. [Google Scholar] [CrossRef]
- D’Imporzano, G.; Pilu, R.; Corno, L.; Adani, F. Arundo donax L. can substitute traditional energy crops for more efficient, environmentally-friendly production of biogas: A Life Cycle Assessment approach. Bioresour. Technol. 2018, 267, 249–256. [Google Scholar] [CrossRef] [PubMed]
- Bauer, A.; Leonhartsberger, C.; Bösch, P.; Amon, B.; Friedl, A.; Amon, T. Analysis of methane yields from energy crops and agricultural by-products and estimation of energy potential from sustainable crop rotation systems in EU-27. Clean Technol. Environ. 2010, 12, 153–161. [Google Scholar] [CrossRef]
- Blandino, M.; Scapino, M.; Rollè, L.; Dinuccio, E.; Reyneri, A. Biomass and Methane Production in Double Cereal Cropping Systems with Different Winter Cereal and Maize Plant Densities. Agronomy 2023, 13, 536. [Google Scholar] [CrossRef]
- Kukharets, S.; Hutsol, T.; Glowacki, S.; Sukmaniuk, O.; Rozkosz, A.; Tkach, O. Concept of Biohydrogen Production by Agricultural Enterprises. Agric. Eng. 2021, 25, 63–72. [Google Scholar] [CrossRef]
- Larina, Y.; Galchynska, J.; Kucheruk, P.; Zghurska, O.; Ortina, G.; Al-Nadzhar, F.; Marusei, T.; Kubon, M.; Dzieniszewski, G. Estimation of the Domestic Agricultural Sector Potential for the Growth of Energy Cultures for Bioenergy Fuel Production. Agric. Eng. 2021, 25, 73–82. [Google Scholar] [CrossRef]
- Shimahata, A.; Farghali, M.; Fujii, M. Factors Influencing the Willingness of Dairy Farmers to Adopt Biogas Plants: A Case Study in Hokkaido, Japan. Sustainability 2020, 12, 7809. [Google Scholar] [CrossRef]
- Kuboń, M.; Sikora, J.; Olech, E.; Szeląg-Sikora, A. Energy Islands as a Potential Source of Securing the Energy Supply of Bio-Feedstock for Biogas Plants. In Renewable Energy Sources: Engineering, Technology, Innovation; Springer Proceedings in Energy; Mudryk, K., Werle, S., Eds.; Springer: Berlin/Heidelberg, Germany, 2018. [Google Scholar]
- Derehajło, S.; Skibko, Z. Cooperation of Biogas Plants with the Power Grid-Selected Issues; ElektroInfo No 1-2; Medium Group: Warsaw, Poland, 2021; pp. 26–28. [Google Scholar]
- Kadir, A.A.; Mohamed, A.; Shareef, H. Harmonic impact of different distributed generation units on low voltage distribution system. In Proceedings of the 2011 IEEE International Electric Machines & Drives Conference (IEMDC), Institute of Electrical and Electronics Engineers (IEEE), Niagara Falls, ON, Canada, 15–18 May 2011; pp. 1201–1206. [Google Scholar]
- Antonova, G.; Nardi, M.; Scott, A.; Pesin, M. Distributed generation and its impact on power grids and microgrids protection. In Proceedings of the 2012 65th Annual Conference for Protective Relay Engineers, Institute of Electrical and Electronics Engineers (IEEE), College Station, TX, USA, 2–5 April 2012; pp. 152–161. [Google Scholar]
- Bignucolo, F.; Cerretti, A.; Coppo, M.; Savio, A.; Turri, R. Impact of Distributed Generation Grid Code Requirements on Islanding Detection in LV Networks. Energies 2017, 10, 156. [Google Scholar] [CrossRef]
- Adefarati, T.; Bansal, R.C. Reliability assessment of distribution system with the integration of renewable distributed generation. Appl. Energy 2017, 185, 158–171. [Google Scholar] [CrossRef]
- Alcala-Gonzalez, D.; García del Toro, E.M.; Más-López, M.I.; Pindado, S. Effect of Distributed Photovoltaic Generation on Short-Circuit Currents and Fault Detection in Distribution Networks: A Practical Case Study. Appl. Sci. 2021, 11, 405. [Google Scholar] [CrossRef]
- Skibko, Z.; Tymińska, M.; Romaniuk, W.; Borusiewicz, A. Impact of the Wind Turbine on the Parameters of the Electricity Supply to an Agricultural Farm. Sustainability 2021, 13, 7279. [Google Scholar] [CrossRef]
- Bak, I.; Tarczyńska-Łuniewska, M.; Barwińska-Małajowicz, A.; Hydzik, P.; Kusz, D. Is Energy Use in the EU Countries Moving toward Sustainable Development? Energies 2022, 15, 6009. [Google Scholar] [CrossRef]
- Skibko, Z.; Romaniuk, W.; Borusiewicz, A.; Porwisiak, H. Use of pellets from agricultural biogas plants in fertilisation of oxytrees in Podlasie, Poland. J. Water Land Dev. 2021, 51, 124–128. [Google Scholar] [CrossRef]
- Świsłowski, P.; Kalinichenko, A. Review of Contemporary, World Technologies (Solutions, Patents) for Biogas Production, Monograph; University of Opole: Opole, Poland, 2015. [Google Scholar]
- Wardal, W.J. Problems of Obtaining Agricultural Biogas. Falenty; ITP Publishing House: Dubai, United Arab Emirates, 2014. [Google Scholar]
- Pablo-Romero, M.D.P.; Sánchez-Braza, A.; Salvador-Ponce, J.; Sánchez-Labrador, N. An Overview of Feed-in Tariffs, Premiums and Tenders to Promote Electricity from Biogas in the EU-28. Renew. Sustain. Energy Rev. 2017, 73, 1366–1379. [Google Scholar] [CrossRef]
- Klimek, K.; Kapłan, M.; Syrotyuk, S.; Bakach, N.; Kapustin, N.; Konieczny, R.; Dobrzyński, J.; Borek, K.; Anders, D.; Dybek, B.; et al. Investment Model of Agricultural Biogas Plants for Individual Farms in Poland. Energies 2021, 14, 7375. [Google Scholar] [CrossRef]
- Kowalczyk-Juśko, A.; Szymańska, M. Poferment as a Fertilizer for Agriculture; Foundation for the Development of Polish Agriculture: Warsaw, Poland, 2015. [Google Scholar]
- Yang, Y.; Li, H.; Aichhorn, A.; Zheng, J.; Greenleaf, M. Sizing Strategy of Distributed Battery Storage System with High Penetration of Photovoltaic for Voltage Regulation and Peak Load Shaving. IEEE Trans. Smart Grid 2014, 5, 982–991. [Google Scholar] [CrossRef]
- Benato, A.; Macor, A. Biogas Engine Waste Heat Recovery Using Organic Rankine Cycle. Energies 2017, 10, 327. [Google Scholar] [CrossRef]
- Dolz, V.; Novella, R.; García, A.; Sánchez, J. HD Diesel engine equipped with a bottoming Rankine cycle as a waste heat recovery system. Part 1: Study and analysis of the waste heat energy. Appl. Therm. Eng. 2012, 36, 269–278. [Google Scholar] [CrossRef]
- Kosicki, Ł.; Typańska, D. The research of current and voltage distortions generated by luminaries with the light emmiting diodes. Electr. Eng. Pozn. Univ. Technol. Acad. J. 2017, 92, 215–226. [Google Scholar] [CrossRef]
- EN 50341-1:2012; Overhead Electrical Lines Exceeding AC 1 kV—Part 1: GENERAL Requirements—Common Specifications. EU: Maastricht, The Netherlands, 2012.
- EN 50160:2010; Supply Voltage Parameters for Public Distribution Networks. EU: Maastricht, The Netherlands, 2010.
- Wang, Q.; Cheng, M.; Jiang, Y. Harmonics Suppression for Critical Loads Using Electric Springs with Current-Source Inverters. IEEE J. Emerg. Sel. Top. Power Electron. 2016, 4, 1362–1369. [Google Scholar] [CrossRef]
- Hołdyński, G.; Skibko, Z. Analysis of currents and voltages deformations in rural medium voltage electric power networks. Prz. Elektrotech. 2011, 86, 130–136. [Google Scholar]
- Sun, Y.; Li, Y. Harmonic Contribution Evaluation Based on the Distribution-Level PMUs. IEEE Trans. Power Del. 2021, 36, 909–919. [Google Scholar] [CrossRef]
- Gao, B.; Wang, Y. An Improved Model of Voltage Source Converters for Power System Harmonic Studies. IEEE Trans. Power Del. 2022, 37, 3051–3061. [Google Scholar] [CrossRef]
- Torquato, R.; Hax, G. Impact Assessment of High-Frequency Distortions Produced by PV Inverters. IEEE Trans. Power Del. 2021, 36, 2978–2987. [Google Scholar] [CrossRef]
- Teng, J.; Liao, S. Three-Phase Harmonic Analysis Method for Unbalanced Distribution Systems. Energies 2014, 7, 365–384. [Google Scholar] [CrossRef]
- Teng, J.; Leou, R. Harmonic Current Predictors for Wind Turbines. Energies 2013, 6, 1314–1328. [Google Scholar] [CrossRef]
- Li, Y.; Sun, Y. Probabilistic Harmonic Forecasting of the Distribution System Considering Time-Varying Uncertainties of the Distributed Energy Resources and Electrical Loads. Appl. Energy 2023, 329, 120298. [Google Scholar] [CrossRef]
- Chen, J.; Hu, H. Techno-Economic Model-Based Capacity Design Approach for Railway Power Conditioner-Based Energy Storage System. IEEE Trans. Ind. Electron. 2021, 69, 4730–4741. [Google Scholar] [CrossRef]
- Stoyanov, I.; Iliev, T. Harmonic Distortion by Single-Phase Photovoltaic Inverter. In Proceedings of the 2019 11th International Symposium on Advanced Topics in Electrical Engineering (ATEE), Bucharest, Romania, 28–30 March 2019. [Google Scholar]
- Eidiani, M.; Ghavami, A. New network design for simultaneous use of electric vehicles, photovoltaic generators, wind farms, and energy storage. In Proceedings of the 2022 9th Iranian Conference on Renewable Energy & Distributed Generation (ICREDG), Mashhad, Iran, 23–24 February 2022. [Google Scholar]
- An, Z.; Ren, Y.; Li, H. Analysis and testing of wind farm power quality in Inner Mongolia. In Proceedings of the 2011 International Conference on Electrical and Control Engineering, Yichang, China, 16–18 September 2011; pp. 2002–2005. [Google Scholar] [CrossRef]
- Moloi, K.; Hamam, Y.; Jordaan, J.A. Power Quality Assessment of A Wind Power-Integrated System into the Power Grid. In Proceedings of the 2020 5th International Conference on Renewable Energies for Developing Countries (REDEC), Marrakech, Morocco, 29–30 June 2020; pp. 1–6. [Google Scholar] [CrossRef]
- Muljadi, E.; Butterfield, C.P.; Chacon, J.; Romanowitz, H. Power quality aspects in a wind power plant. In Proceedings of the 2006 IEEE Power Engineering Society General Meeting, Montreal, QC, Canada, 18–22 June 2006; p. 8. [Google Scholar] [CrossRef]
- Shalukho, A.V.; Lipuzhin, I.A.; Voroshilov, A.A. Power Quality in Microgrids with Distributed Generation. In Proceedings of the 2019 International Ural Conference on Electrical Power Engineering (UralCon), Chelyabinsk, Russia, 1–3 October 2019; pp. 54–58. [Google Scholar] [CrossRef]
- Ghijselen, J.A.; Willems, J.L. Determining customer contribution to voltage distortion in power systems. Energ. Elettr. 2004, 81, 116–122. [Google Scholar]
- Watson, N.R.; Arrillaga, J. Power System Harmonics; John Wiley & Sons: Hoboken, NJ, USA, 2003. [Google Scholar]
- IEC 61000-4-30:2015+AMD1: 2021 CSV; Consolidated Version, Electromagnetic Compatibility (EMC)—Part 4-30: Testing and Measurement Techniques—Power Quality Measurement METHODS. IEC: London, UK, 2021.


| Harmonics Odd | Harmonics Even | ||||
|---|---|---|---|---|---|
| Not Being a Multiple of 3 | Being a Multiple of 3 | ||||
| Harm. Order h | Voltage Harmonics Uh% | Harm. Order h | Voltage Harmonics Uh% | Harm. Order h | Voltage Harmonics Uh% |
| % | % | % | |||
| 5 | 6 | 3 | 5 | 2 | 2 |
| 7 | 5 | 9 | 1.5 | 4 | 1 |
| 11 | 3.5 | 15 | 0.5 | >4 | 0.5 |
| 13 | 3 | >15 | 0.5 | ||
| 17 | 2 | ||||
| 19 | 1.5 | ||||
| 23 | 1.5 | ||||
| 25 | 1.5 | ||||
| Parameter | |
|---|---|
| Turbine | |
| Type | PETRA 750C |
| Rated power | 600 kW |
| Generator | |
| Manufacturer | Marelli Generators |
| Rated efficiency | 96.71% |
| Rated active power | 600 kW |
| Nominal apparent power | 600 kVA |
| Rated voltage | 0.4 kV |
| Rated frequency | 50 Hz |
| Rated power factor | 1 |
| Power factor control interval | 0.8 inductive–0.8 capacitive |
| Rated speed | 1500 rpm |
| Connection arrangement | star |
| (%) | (%) | (%) | |
|---|---|---|---|
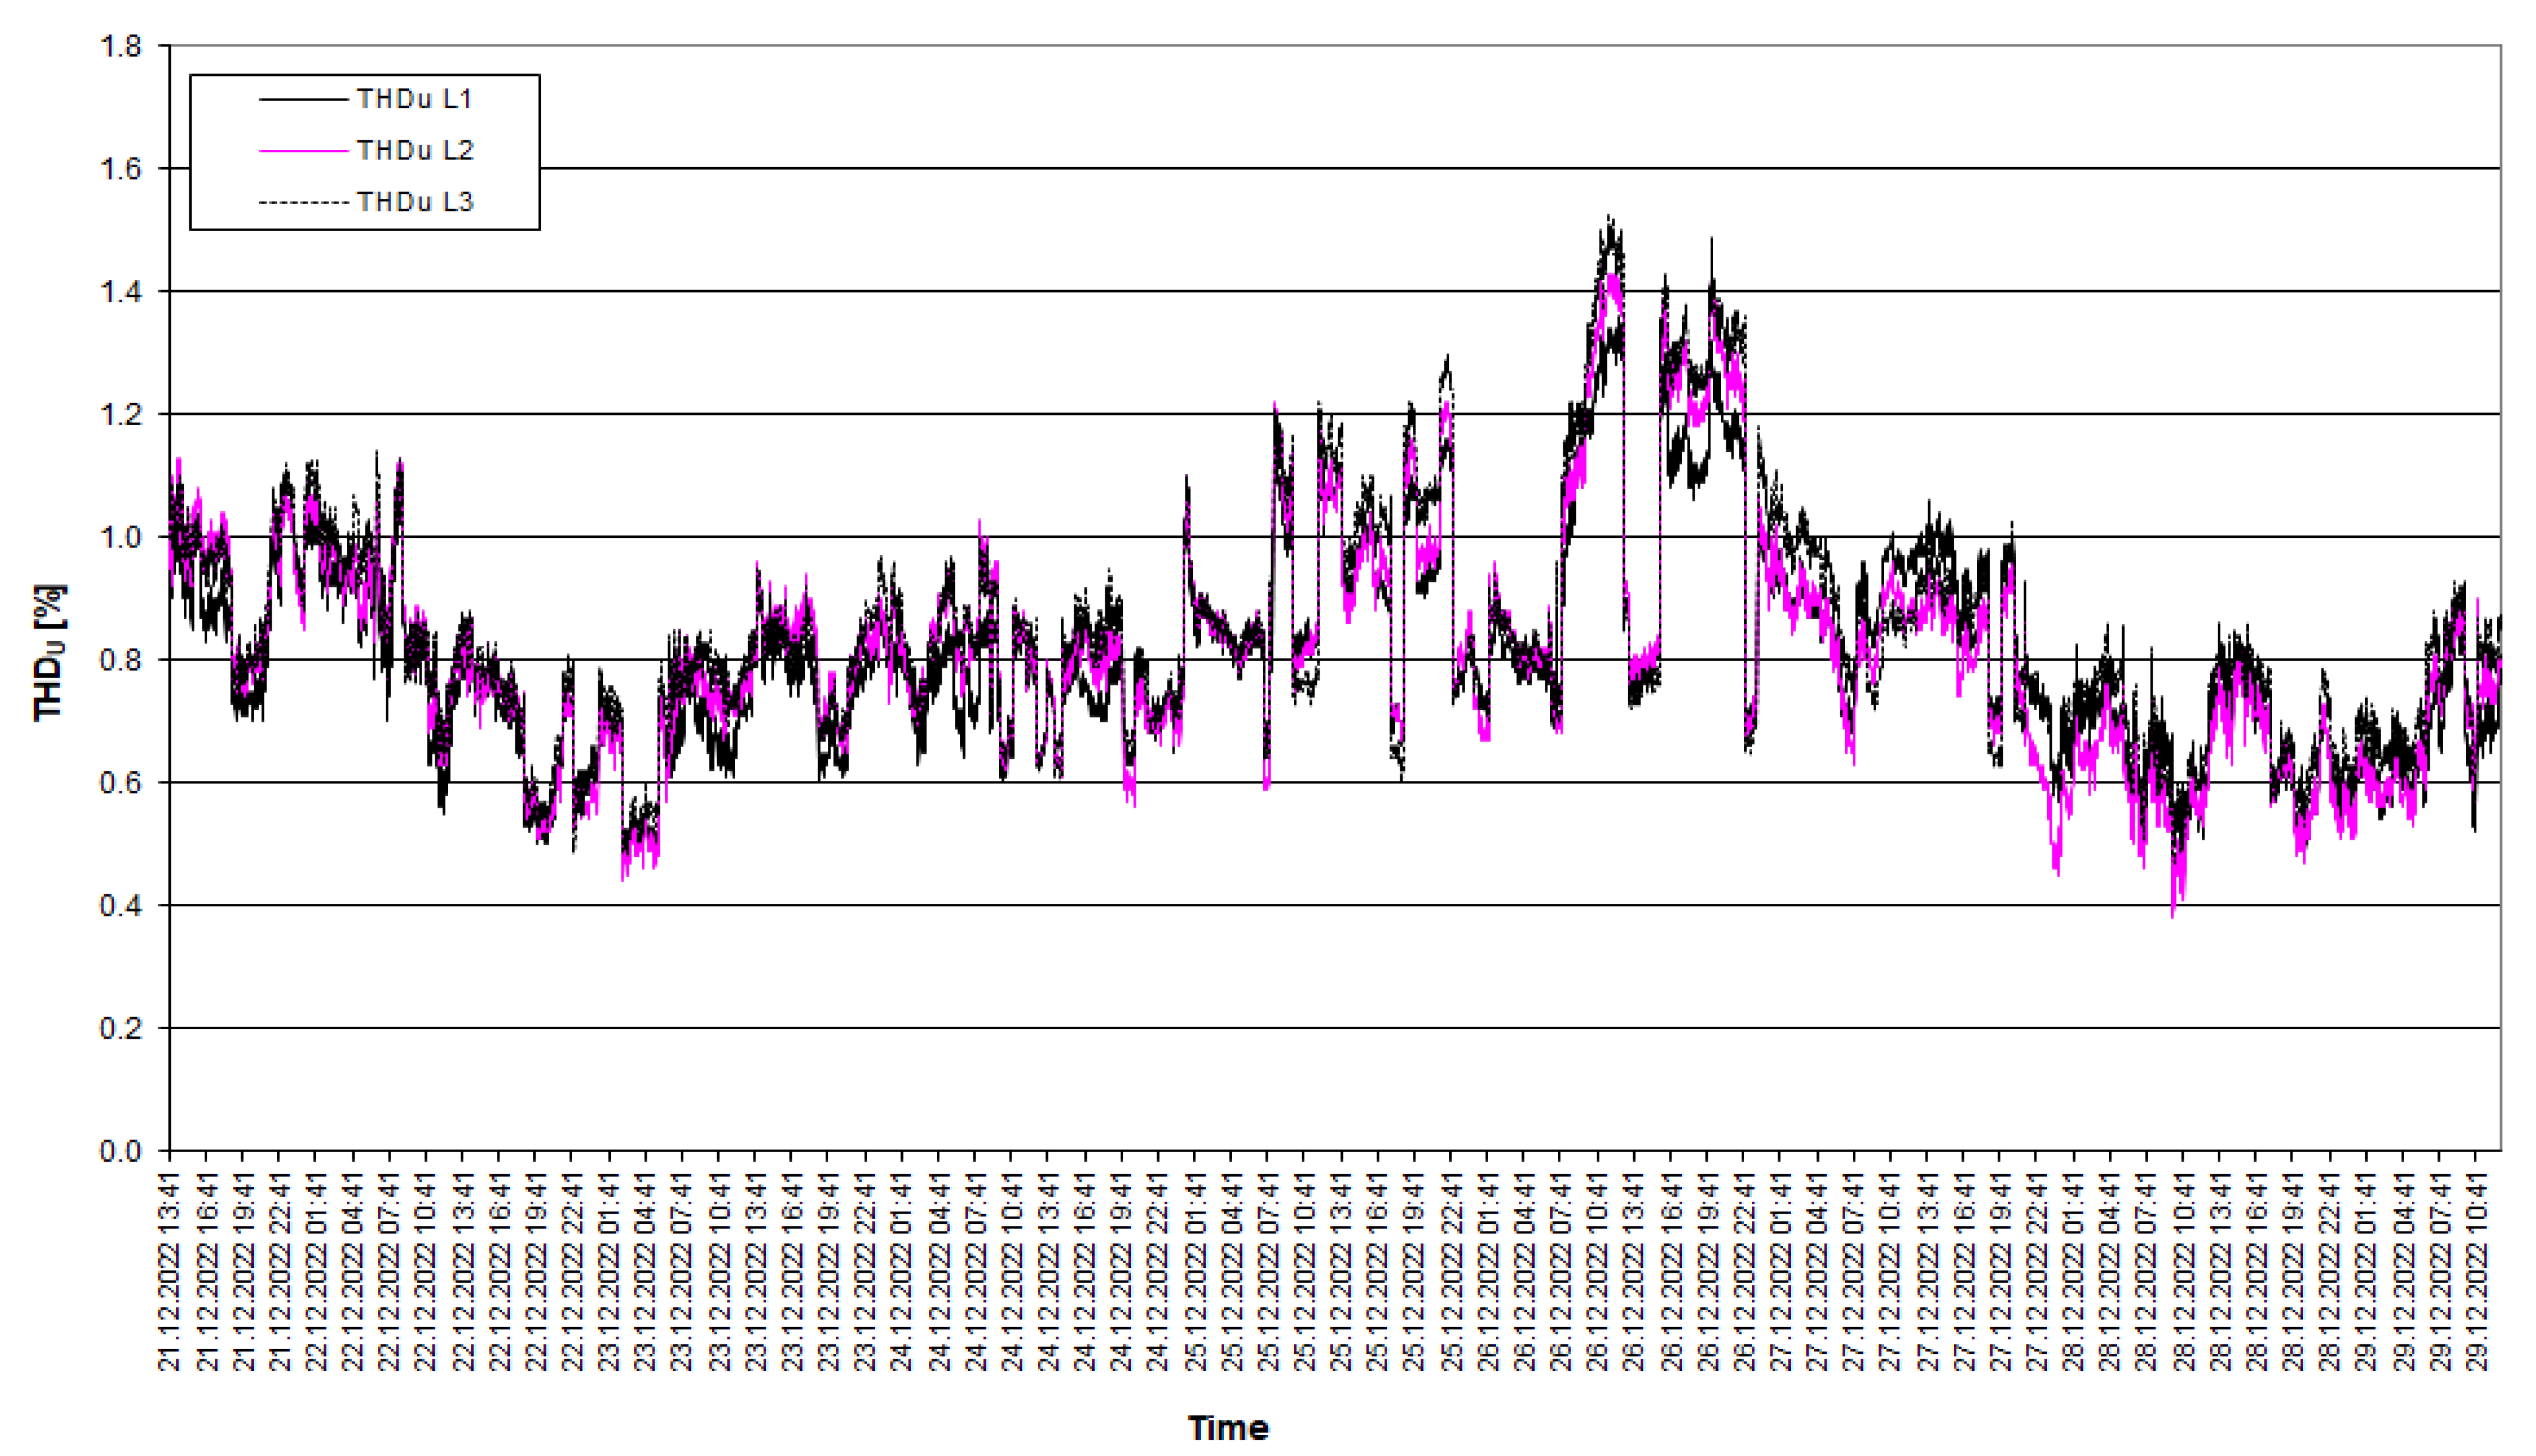
| Average value | 0.803 | 0.817 | 0.850 |
| Minimum value | 0.460 | 0.380 | 0.470 |
| Maximum value | 1.360 | 1.460 | 1.530 |
| Quantile 95 | 1.120 | 1.200 | 1.260 |
| (%) | (%) | (%) | |
|---|---|---|---|
| Average value | 1.078 | 1.035 | 1.111 |
| Minimum value | 0.580 | 0.560 | 0.640 |
| Maximum value | 3.420 | 3.290 | 3.380 |
| Quantile 95 | 1.530 | 1.460 | 1.532 |
| (%) | (%) | (%) | |
|---|---|---|---|
| Average value | 1.600 | 1.557 | 1.605 |
| Minimum value | 0.860 | 0.860 | 0.860 |
| Maximum value | 2.480 | 3.730 | 2.220 |
| Quantile 95 | 1.970 | 1.900 | 1.990 |
| Number of the Tested Biogas Plant | |||
|---|---|---|---|
| 1 | 2 | 3 | |
| THDU (%) | |||
| Average value | 0.82 | 1.07 | 1.59 |
| Minimum value | 0.38 | 0.56 | 0.86 |
| Maximum value | 1.53 | 3.42 | 3.73 |
| Quantile 95 | 1.19 | 1.51 | 1.95 |
Disclaimer/Publisher’s Note: The statements, opinions and data contained in all publications are solely those of the individual author(s) and contributor(s) and not of MDPI and/or the editor(s). MDPI and/or the editor(s) disclaim responsibility for any injury to people or property resulting from any ideas, methods, instructions or products referred to in the content. |
© 2023 by the authors. Licensee MDPI, Basel, Switzerland. This article is an open access article distributed under the terms and conditions of the Creative Commons Attribution (CC BY) license (https://creativecommons.org/licenses/by/4.0/).
Share and Cite
Kuboń, M.; Skibko, Z.; Tabor, S.; Malaga-Toboła, U.; Borusiewicz, A.; Romaniuk, W.; Zarajczyk, J.; Neuberger, P. Analysis of Voltage Distortions in the Power Grid Arising from Agricultural Biogas Plant Operation. Energies 2023, 16, 6189. https://doi.org/10.3390/en16176189
Kuboń M, Skibko Z, Tabor S, Malaga-Toboła U, Borusiewicz A, Romaniuk W, Zarajczyk J, Neuberger P. Analysis of Voltage Distortions in the Power Grid Arising from Agricultural Biogas Plant Operation. Energies. 2023; 16(17):6189. https://doi.org/10.3390/en16176189
Chicago/Turabian StyleKuboń, Maciej, Zbigniew Skibko, Sylwester Tabor, Urszula Malaga-Toboła, Andrzej Borusiewicz, Wacław Romaniuk, Janusz Zarajczyk, and Pavel Neuberger. 2023. "Analysis of Voltage Distortions in the Power Grid Arising from Agricultural Biogas Plant Operation" Energies 16, no. 17: 6189. https://doi.org/10.3390/en16176189