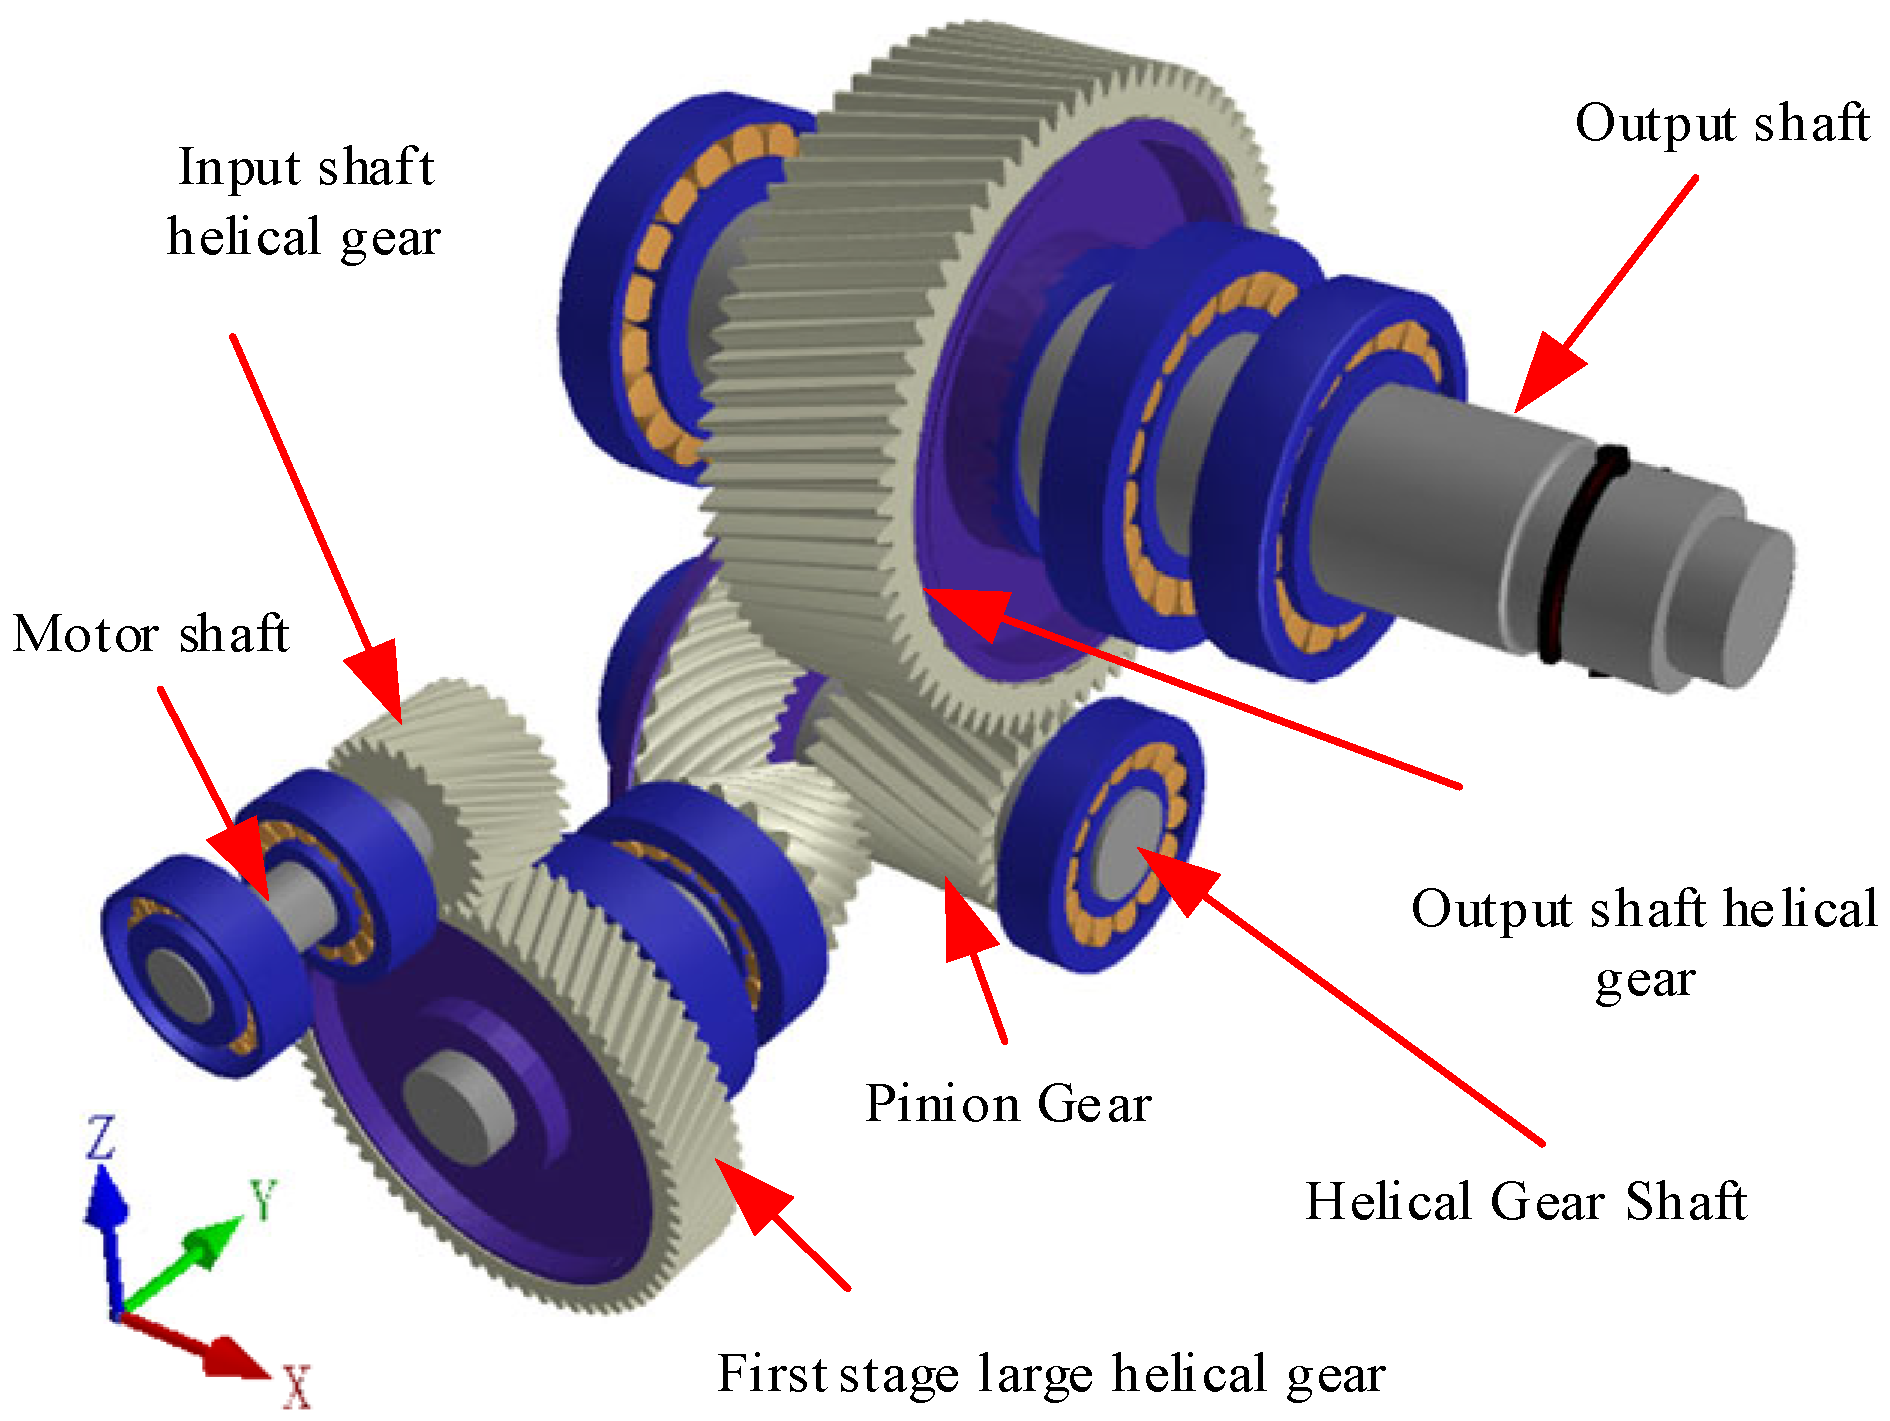
Article

NVH Analysis and Optimization of Construction Hoist Drive System

School of Mechanical Engineering, Sichuan University of Science and Engineering, Zigong 643000, China
*
Author to whom correspondence should be addressed.
Energies 2023, 16(17), 6199; https://doi.org/10.3390/en16176199
Submission received: 15 July 2023 / Revised: 21 August 2023 / Accepted: 22 August 2023 / Published: 26 August 2023

Abstract

:
The construction hoist drive system is a critical component of the construction hoist, and high speed and low vibration noise are essential development directions. In order to improve the NVH level of the construction hoist drive system, this paper carries out research and analysis of construction hoist drive system excitation, establishes the drive system rigid-flexible coupling dynamics model, and completes the establishment of the vibration and noise model of the drive system, simulation analysis, and optimization work. Ansys Motor CAD 2020 was used to establish the parametric model of the asynchronous motor and it was combined with the virtual work method to calculate Maxwell’s electromagnetic force to arrive at the radial electromagnetic force as the main cause of electromagnetic noise. For the mechanical excitation generated by the gearbox, the time-varying stiffness excitation, mesh shock excitation, and transmission error excitation are considered, and the transmission error of helical gears under different working conditions is calculated by combining it with Romax software 2020. The rigid-flexible coupling model of the construction hoist drive system is established. The load distribution analysis of the unit length of the tooth surface is completed for the first- and third-stage helical gears under different working conditions. The primary source of the drive system excitation is the tooth surface bias load. Based on the dynamic response analysis theory of the vibration superposition method, the maximum vibration speed of the drive system was analyzed by Romax. The maximum noise value of 78.8 dB was calculated from the acoustic power simulation of the drive system using Actran acoustic software 2022 in combination with acoustic theory, and the magnetic density amplitude of the stator teeth of the asynchronous motor was optimized based on the microscopic shaping design of the helical gear by Romax. The vibration and noise simulation of the optimized drive system shows that the vibration value is reduced to 0.75 mm/s, and the maximum noise is reduced to 70.2 dB, which is 10.9% lower than before the optimization. The overall NVH level has been improved. The optimization method to reduce the vibration noise of the drive system is explored, which can be used for vibration noise prediction and control during the development of the construction hoist drive system.

1. Introduction

As more high-rise and ultra-high-rise buildings are being constructed, the demand for high-speed and heavy-duty construction hoists is gradually increasing. As the main source of vibration and noise of construction hoist, the drive system is bound to have a series of NVH problems under the development trend of high speed. The international industry standard for construction hoist noise is 70 dB [1], while the domestic one is less than 85 dB [2]. Although the noise of Zoomlion’s hoist drive system can reach 77 dB, there is still a significant gap in the noise value compared with that of foreign drive systems. At present, many companies design products and then produce them directly and do experiments to verify their performance, which increases the product development cycle and cost. If the NVH performance of the drive system can be predicted by combining finite element simulation, the development cost and cycle time will be shortened. The related research shows that treating the motor and reducer as a whole and establishing the overall powertrain model for vibration and noise simulation analysis is consistent with the experimental results, which verifies the correctness of establishing the powertrain model [3]. By establishing a rigid-flexible coupling dynamics model, the dynamic response on the case housing is explored, and based on this model, the vibration-noise optimization method of the drive system is investigated to improve the performance of the NVH of the drive system.
The German scholar, Fritze, [4] in 1921, first proposed that the electromagnetic vibration and noise of the motor are mainly caused by the electromagnetic force between the stator and rotor. Subsequently, the American scholar, Alger, [5] proposed the calculation method of radial electromagnetic force, stator vibration mode, and noise radiation of motor in 1956. Do-Jin Kim and Jae-Woo Jung [6] analyzed the radial electromagnetic force of the induction motor, reduced the low-order space harmonics by considering the pole-slot fits, used finite elements to calculate the space harmonics, studied the inherent frequency of the low-order force wave using Fourier decomposition, and determined a reasonable slot fit by comparing the inherent frequency of the motor to give the design flow of the low-noise induction motor. H.S. Chen et al. [7], by analyzing the winding function for slot width and the air-gap permeability for slot opening width, found that the main radial force expressions for induction motors were derived and a method was proposed to reduce the noise of the motors without decreasing the drive efficiency and output torque. In Kong et al. [8], it is proposed to analyze the electromagnetic vibration under different loads by analyzing the amplitude of electromagnetic force waves. The finite element method is also used to calculate the electromagnetic radial force and decode the results to obtain the electromagnetic force amplitude under different loads. In Han Rui et al. [9], a time-stepped finite element model of a squirrel-cage asynchronous motor with voltage as input was used to calculate the current, radial electromagnetic force and its harmonics, and the electromagnetic noise was obtained from three simulations of the electromagnetic force, acoustic radiation, and mechanical vibration, and the validity of the electromagnetic noise simulation calculation was verified experimentally. Bozca et al. [10] developed a four-degree-of-freedom torsional vibration model and optimized the macro-geometric parameters of the gearbox gear to reduce transmission error. Chen et al. [11] explored the role of the flexible shaft in the electric vehicle transmission gear system based on the dynamical coupling model and analyzed in detail how its macroscopic parameters affect the vibration noise of the system, especially exploring the variation of pressure angle and helix angle and how they affect the law of transmission error. Garambois et al. [12] proposed a multi-objective optimization of gear macro-geometry and micro-reshaping parameters to reduce static transmission error (STE) and mesh stiffness fluctuations to reduce noise in gear systems. Houser [13] analyzed gear noise generation and transmission paths and discussed the relationship between gear tooth reshaping and noise using static analysis. Zhao et al. [14] performed a modeling analysis of a helical gear vice considering manufacturing deviations. They showed how to obtain the optimal gear geometry and minimize the transmission error by simulation. Lei et al. [15] proposed a vibration and noise reduction measure to reduce the noise excitation sources such as transmission error peaks, transmission error harmonics, and maximum tooth surface load by using a multi-objective optimization algorithm for the noise problem of an electric vehicle gearing system. An improved multi-objective optimization algorithm was used to find the optimal gear shaping parameters to determine the best tooth surface shaping strategy. Wang Feng et al. [16] investigated the effect of pitch deviation on gearbox vibration noise for helical gears and showed that pitch deviation increases the vibration acceleration during gear meshing. Related studies have shown that both the machining accuracy and assembly accuracy of gears affect the dynamic characteristics of the transmission system [17].
For the NVH problem of the drive system caused by excessive excitation of high-speed gears, the design of helical gears is trimmed through the use of Romax software, and the effects of meshing tooth orientation error, base pitch error and contact deformation on tooth surface load distribution are considered. The optimal micro-contouring parameters are solved by the full factorial method with the tooth directional bulge amount, helical line trim amount and involute tooth profile trim amount as variables and the tooth directional contact load distribution coefficient and transmission error as targets, and the tooth surface load distribution before and after optimization is compared and analyzed. Under the condition that the output shaft power and torque are unchanged, the stator slot opening width and rotor slope slot degree and stator–rotor slot fit are used as optimization variables to optimize the calculation of the magnetic density amplitude of the stator teeth of the asynchronous motor, and finally to improve the NVH level of the drive system.

2. Excitation Analysis of Construction Hoist Drive System

2.1. Asynchronous Motor Electromagnetic Excitation Analysis

According to Maxwell’s law, the value and distribution of the radial electromagnetic force P n θ , t generated by the air-gap magnetic field of the asynchronous motor and acting on the unit area of the inner surface of the motor stator, which is proportional to the square of the magnetic flux density, can be determined according to Equation (1):
P n θ , t = b 2 θ , t 2 μ 0
In the Equation (1): μ 0 is the magnetic permeability in vacuum, b θ , t is the air-gap magnetic density, and if magnetic saturation is not considered, the air-gap magnetic density:
b θ , t = f θ , t · Λ θ , t
In Equation (2), f θ , t is the air-gap magnetomotive force, Λ θ , t is the air-gap magnetic conductance, and f θ , t , Λ θ , t , and b θ , t are functions with respect to time and space variations. The Fourier series expansion of the phase winding magneto-dynamic potential of an asynchronous motor is expressed as:
f A θ , t = 2 2 NI π p v = 1 , 3 1 v k N v cos v θ cos ω t
In Equation (3), f A θ , t is the magnetic potential of one of the three phases, N v is the number of series turns per phase of the stator, I is the phase current, and the above equation can be Fourier transformed to:
f θ , t = f O θ , t + f μ θ , t + f v θ , t
In the Equation (4), f v θ , t and f μ θ , t are the v and μ magnetic potentials of the stator and rotor windings, respectively, and f O θ , t is the elementary wave magnetic potential, in the three-phase asynchronous motor, the funda mental magnetic potential generated by each of the three-phase windings differ from each other in space by 120° electrical angle, and in symmetric operation, the three-phase currents are also symmetric. A, B, and C, are each phase whose winding magnetic potential of the fundamental wave and phase magnetic potential fundamental wave amplitude F is as follows:
f A θ , t = F · cos θ cos ω t f B θ , t = F · cos θ 2 3 π cos ω t 2 3 π f C θ , t = F · cos θ 4 3 π cos ω t 4 3 π F = 2 2 NI K N π p
In the Equation (5): K N is the fundamental winding coefficient, and the fundamental magnetic momentum can be calculated from the above formula as:
f O θ , t = 3 2 F cos ω t θ
The same reason (6) yields the vth harmonic magnetic potential of the stator winding and the μth harmonic magnetic potential of the rotor winding:
f μ θ , t = F μ cos ω μ t μ θ f v θ , t = F v cos ω t v θ
The polar logarithm of the vth harmonic magnetic potential p v = vp , whose winding factor is K Nv , the amplitude of the vth harmonic magnetic potential of the phase winding is:
F v = 3 2 NI K Nv π p C F μ = 3 2 N I 1 K N π p K Nv = sin y τ π v 2 sin qv α 2 p qsin v α 2 p
In the Equation (8), C is the damping factor related to the number of teeth in the rotor, the number of slots and their slant slot degree, y is the pitch, τ is the pole pitch, q is the number of slots per pole per phase, and α is the angle per slot pitch. The number of slots per pole per phase of this three-phase asynchronous motor ( q = Z / 2 p m) is equal to 3, an integer number of slots, and the larger amplitude of tooth harmonics dominates the factor when calculating the magneto dynamic potential, and the number of stator–rotor winding harmonics when each pole per phase is an integer number of slots is:
v z = K Z 1 + p μ z = K Z 2 + p K = ± 1 , ± 2
The YZPE2 model motor stator–rotor by silicon steel laminated, stator–rotor with tooth grooves, ignoring the stator–rotor slotting interaction caused by the magnetic conductivity, the air-gap magnetic conductivity can be approximated as follows:
Λ θ , t = Λ 0 + K 1 λ K 1 + K 2 λ K 2
In Equation (9) Λ 0 = μ 0 δ K c , when the rotor is smooth and stator slotted, the harmonic permeability is:
λ K 1 = Λ k 1 cos k 1 Z 1 θ
When the stator is smooth and the rotor is slotted, the harmonic permeability is:
λ K 2 = Λ k 2 cos k 2 Z 2 θ ω p 1 S t
In Equation (11), k1, k2 = 1, 2, 3… The air-gap magnetic density can be derived from Equation (2) and the expressions for the synthetic magnetic potential and air-gap permeability are:
b θ , t = f O θ , t + μ f μ θ , t + v f v θ , t · Λ 0 + K 1 λ K 1 + K 2 λ K 2
From Equation (12), we can see that the air-gap magnetic density consists of the fundamental magnetic field, stator–rotor winding tooth harmonics, stator–rotor magnetic guide tooth harmonics five parts, stator winding tooth harmonics, and magnetic stator guide tooth harmonics, which have the same harmonic frequency and the number of poles can be superimposed, similarly the magnetic rotor guide tooth harmonics and magnetic rotor guide tooth harmonics are superimposed to obtain:
b θ , t = B 0 cos ω t p θ + v z B v cos ω t v θ + μ z B μ cos ω μ t μ θ
The radial force wave generated by the air-gap magnetic field can be found by substituting Equation (1):
P n θ , t = 1 2 μ 0 B 2 2 cos 2 ω t 2 p θ + v z μ z B v B μ cos ω μ t μ θ
From the above derivation, it can be seen that the magnetomotive force of an asynchronous motor is related to the input current, the number of slots, the slot shape and the ordering of windings, and the tooth pitch of stator–rotor and the width of slot opening, and the different centrality are the factors affecting the magnetic conductivity, and these parameters are related to the radial electromagnetic force wave. In the vibration noise analysis, the influence between the related parameters can be considered to reduce the low-order radial electromagnetic force of the motor, thus reducing the vibration noise.

2.2. Analysis of the Mechanical Excitation of the Reducer

The gearbox is a complex elastomeric mechanical system that generates dynamic response under dynamic excitation, which is the source of vibration noise of the whole drive system. The internal excitation of gears mainly includes time-varying stiffness excitation, error excitation, and meshing shock excitation. In order to calculate the stiffness excitation of the gear and subsequent analysis, a parametric model of the gear of the reducer is established by Romax Design software, as shown in Figure 1, where the maximum input power of the motor shaft is 19 kW, the maximum speed is 2500 r/min, the material of the helical gear is 40CrMnMo with surface hardening treatment, the accuracy grade of the gear is 8, and the lubricant is ISO VG 680. The macroscopic parameters of the output end of the helical gear are shown in Table 1.

2.2.1. Time-Varying Stiffness Excitation

The time-varying meshing stiffnesses of the helical gears at the input and output shafts are shown in Figure 2 and Figure 3, respectively, by calculating the helical gear sub-stiffness excitation with Romax software. From the Figures, it can be seen that the individual gear tooth meshing stiffness has time-varying qualities, the active and driven wheels have different meshing stiffness at the meshing point, and the two gear teeth have the same amount of deformation near the midpoint of the tooth height and have the same meshing stiffness.

2.2.2. Engaging Shock Excitation

The meshing base joint error causes meshing gear shock, and the analysis of gear meshing shock excitation provides ideas for microscopic gear tooth reshaping methods to reduce the vibration noise of the drive system by reducing the excitation source.

2.2.3. Transmission Error Excitation

Due to the existence of transmission errors, the excitation source of gearbox vibration causes the unstable nature of gear transmission.
Due to the existence of the three excitations mentioned above, the gears will change the transmission error of the gears during operation, and the linear transmission error of the gears is expressed as:
T E = r b 2 θ 2 + Δ θ 2 r b 1 θ 1
where θ 1 and θ 2 are the theoretical rotation angles of the active and driven wheels, respectively; r b 1 and r b 2 are the radii of the base circles of the active and driven wheels, respectively; and θ 2 is the deviation value generated by the transmission error, which is a quantity that varies with time.
Table 2 shows the parameters of the motor rotor and the output end of the reducer under various operating conditions.
The simulation results of the transmission error under different working conditions are shown in Figure 4 and Figure 5. Figure 4 shows that the transmission error of the helical gear of the first stage increases with the increase of the working load. Figure 5 shows that the transmission error of the third-stage helical gear pair, like the first-stage helical gear, increases with the working load. The larger the range of the transmission error, the larger the vibration generated.
Fourier transform is performed on the transfer error, Figure 6 and Figure 7 show the transmission error harmonics of the first-stage and third-stage helical gears at different operating conditions, respectively. In Figure 6, it can be seen that the first-order transmission error harmonics of the first-stage gear at 100% operating condition is the largest, and the peak value of the first-order transmission error harmonics decreases as the operating condition decreases. Figure 7 shows that the harmonic amplitude of the first-order transmission error harmonic of the third-stage gear is the largest at 60% of the working condition, and the peak value of the third-order transmission error harmonic decreases as the working condition decreases. By analyzing the harmonic values of the transmission error, the effect of different harmonic excitations on the vibration response under different operating conditions can be clarified, which will lay the foundation for the vibration response analysis later.

3. Modeling the Dynamics of the Drive System

Comprehensive analysis of the above excitation transfer before the drive system vibration noise analysis, is necessary to establish a flexible model for the drive system shell and a rigid-flexible coupling dynamics model for the gears, shafts, bearings, and other components. Figure 8 shows the transmission sketch of the drive system.

3.1. Establishment of a Flexible Finite Element Model for Drive System Housing and Motor Stator

The drive system housing was modeled using 3D modeling software, as shown in Figure 9. The materials of the motor and gearbox body are defined, and the structural stiffness of the motor stator is less than that of the one-piece forming case because it is made of 50W800 silicon steel sheets laminated. The material properties of each part are shown in Table 3. The drive system shell meshes with a tetrahedral mesh, the number of finite element nodes of the shell is 355,159, and the number of FE cells is 193,870, of which the number of stator cells accounts for 25,282. Grounding constraints are applied to the shell, as shown in Figure 10, the red part is grounding constraints.
The finite element data of the shell are deflated to the nodes of the central bore of the bearing to create the stiffness matrix and mass matrix, and the differential equations of motion of the shell unit are as follows:
M X ¨ + C X ˙ + KX = 0
M , C , and K in Equation (16) are the mass matrix, damping matrix, and stiffness matrix of the shell unit, respectively, where the mass matrix and stiffness matrix are obtained by condensation and have the following form:
K = K 11 K 12 K 21 K 22 K 147 K 148 K 247 K 248 K 471 K 472 K 481 K 482 K 4747 K 4748 K 4748 K 4848
M = M 11 M 12 M 21 M 22 M 147 M 148 M 247 M 248 M 471 M 472 M 481 M 482 M 4747 M 4748 M 4748 M 4848
X = x 1 y 1 z 1 θ 1 x θ 1 y θ 1 z x 8 y 8 z 8 θ 8 x θ 8 y θ 8 z T
In Equation (19), X , y , and y represent the coordinates of the nodes, θ is the rotational freedom around the coordinates, and X is the displacement vector of the bearing center box condensation node.
Consider the effect of case flexibility on the amount of gear mesh misalignment. Figure 11 shows the gear mesh misalignment amount for different working conditions under rigid case and flexible housing. The comparison results show that the gear meshing misalignment amount is indeed affected by the case flexibility, and the meshing misalignment amount will be appropriately reduced by using the flexible case. For the NVH analysis of the drive system, considering the influence of the flexible case can improve the accuracy of the analysis results.

3.2. Establishment of Gear Meshing Finite Unit Dynamics Model

An accurate gear mesh dynamics model is established to analyze the NVH performance of the drive system and provide a theoretical basis for vibration and noise reduction. The dynamics model of the gear meshing unit is shown in Figure 12.

3.3. Modeling the Dynamics of the Elastic Shaft Unit

The key to analyzing the NVH performance of the drive system is to model the dynamics of the shaft. The discrete model of the shaft is established by the finite element method, and the mass matrix and stiffness matrix of the whole shaft can be obtained by aggregating the mass matrix and stiffness matrix of all spatial beam units. The finite unit model of the elastic shaft is shown in Figure 13.

3.4. Analysis of Tooth Surface Load Distribution of Helical Gears

The normal load per unit length of the helical gear tooth face is an important parameter for evaluating the stability of the gear transmission system, and the value is too large to reduce the service life and reliability of the gear. In order to facilitate analysis and calculation, the load per unit length along the tooth contact line is usually taken for calculation. The average load per unit length along the tooth contact line of helical gears is expressed as follows:
P = F n L
In the Equation (20), F n is the normal load acting on the tooth contact line in N, and L is the length of the contact line along the tooth surface in mm. As shown in Figure 14 for the output shaft helical gear meshing line, the tooth surface distance indicates the entire tooth width, and the range of the rolling angle indicates that the meshed gear teeth turn from the top of the tooth to the root of the tooth, the four contact lines in the figure are in the gear teeth in the rolling angle range to stay on the tooth surface.
Romax software calculates the load distribution per unit length of the helical gear tooth face. Figure 15 and Figure 16 represent the left tooth face load distribution of the output shaft helical gear at 100% and 40% operating conditions; Figure 17 and Figure 18 represent the left tooth face load distribution of the input shaft helical gear at 100% and 40% operating conditions, respectively. The tooth surface bias load of the above two pairs of gear pairs is due to the deformation of the system when the gears are transmitting power, so the gear pairs cannot reach the ideal meshing condition, resulting in the edge effect of tooth contact. This tooth surface bias load will accelerate the wear of the gear teeth and bring more excitation to the drive system, generating vibration and noise.

4. Vibration Noise Analysis under Electromechanical Coupling

4.1. Drive System Modal Analysis

The equation of the undamped free vibration characteristic matrix of the system is:
K - ω n 2 M X = 0
In Equation (21), K and M are the n × n order stiffness matrix and mass matrix, respectively. A sufficient condition for the above equation to have a non-zero solution is that the matrix determinant in parentheses is 0, i.e., there is an eigen equation for:
Δ ω n 2 = det K - ω n 2 M = 0
The eigenvalue ω n 2 is solved from Equation (22), and the eigenvalue’s square root is the system’s inherent frequency ω n . Substituting the mass matrix (18) and the stiffness matrix (17) derived from the shell shrinkage into Equation (21), we can obtain the shell modalities, and the lower order inherent frequency is more easily excited by the outside world. Then, we solve the modal vibration pattern in Romax software and the first 20 orders of the intrinsic shell frequency are as shown in Table 4.

4.2. Vibration Response Analysis under Electromechanical Coupling Excitation

To simulate the vibration response of the drive system under electromagnetic excitation and mechanical excitation, response nodes need to be added to the surface of the drive housing to act as virtual sensors, and since the model is axisymmetric, only one side of the symmetric model is added to the response nodes. The response node numbers and specific locations of the drive housing are shown in Figure 19.
The time-varying meshing stiffness and transmission error excitation harmonics solved in the previous section are introduced into the analytical model, and the vibration simulation is calculated for the drive system shell with the response node added. The vibration velocity of 100% working condition under the action of the primary gear excitation is shown in Figure 20, 80% working condition is shown in Figure 21, 60% working condition is shown in Figure 22, and 40% working condition is shown in Figure 23. The figure shows that the vibration speed of each node from 100% to 40% of the working condition shows a clear decreasing trend.
The vibration response analysis under the third-stage gear excitation. Figure 24 and Figure 25 show the vibration velocity diagrams of the third-stage gear excitation at 60% and 80% operating conditions, respectively. The graphs show that the meshing frequency of the third-stage gear shaft is much lower than that of the first stage.
Figure 26 and Figure 27 show the vibration velocity of the drive system shell response node under the action of the fourth-order electromagnetic force and the eighth-order electromagnetic force, respectively, and it can be seen from the two figures that the vibration velocity varies linearly with the motor shaft speed.

4.3. Noise Response Analysis of the Drive System

4.3.1. Acoustic Theory Analysis

The noise of the construction hoist is mainly generated by the vibration of the surface shell of the drive system and the components. When the sound wave passes through the air, it causes the density of the air to change, affecting the flow rate and flow intensity of the air, thus producing a change in pressure. This change is known as sound pressure. Its root mean square value is P e , also known as the effective value of the sound pressure, that is:
P e = 1 T 0 T P 2 t dt
The Equation (23) in P e is the effective sound pressure in Pa.

4.3.2. Noise Simulation Solving

First, complete the condensation model of the drive system in the frequency range and the static analysis of each operating condition is completed first. At the same time, the gear excitation and electromagnetic excitation calculated earlier are introduced into the model. Analysis settings: the drive system housing is selected as the noise-radiating surface, and the acoustic meshing is performed using a second-order full mesh. Operation frequency range setting: the maximum frequency of the analysis is consistent with the maximum frequency of the working condition that is 1000 Hz, and the minimum frequency is set to 10 Hz. The frequency range is divided into several frequency bands by the number of frequency bands for analysis. The number of frequency bands is set to 10, and the microphone position is shown in Figure 28.
Figure 29 shows the Campbell diagram of the drive system noise, in which the 4th, 8th, and 12th orders are the electromagnetic excitation of the motor, the 3rd order is the mechanical excitation of the third-stage gear, and the 24th, 48th, and 72nd orders are the first three orders of mechanical excitation from the first-stage helical gear.
Figure 30 shows the two-dimensional diagram of the sound power of the drive system under each excitation of 100% working condition. From the sound power values of the drive system in the figure, the noise of the drive system is mainly caused by the first three orders of harmonic excitation of the first-stage gear and the fourth-order of electromagnetic excitation, in which the mechanical excitation (gear excitation) accounts for the main component compared to the electromagnetic excitation.

5. Drive System NVH Optimization Design

5.1. Optimized Design of Helical Gear Tooth Surface Reshaping Based on Romax

The mechanical excitation of gears is reduced by macro-parameter optimization and micro-reforming of gears. Numerous studies have shown that the excitation of helical gears can be effectively reduced by micro-reshaping, thus improving the NVH performance of the drive system. Based on Romax’s method of optimizing the output shaft helical gear pair by using the full factorial method with the tooth-wise load distribution coefficient and transmission error value as the target and each trim amount as the variable factor, the optimal combination of trim amounts is found to achieve uniform load distribution on the tooth surface.

5.1.1. Tooth Direction Shaping Amount

a.
The amount of tooth-wise bulge under the combined factors:
Gear mesh error F β y is a factor that directly affects the load distribution on the tooth surface. Gear mesh error results from the combined effect of the original mistake, elastic deformation, and wear [18]. The impact of the integrated gear mesh error is compensated by drum-shaped modification of the tooth surface. Gear mesh error after run-in:
F β y = 0.85 1.33 f sh + f ma
f sh is the meshing tooth orientation error caused by the comprehensive deformation of the part, f sh = ( F m /b) f sh 0 , the meshing tooth orientation error under unit load f sh 0 = 0.012 γ , where γ is calculated by checking the table to get 1.09. f ma is the meshing tooth orientation error caused by manufacturing and installation errors: f ma = 0.5 F β 8 , F β 8 is the permissible value of the total deviation of the helix at accuracy class 8, which can be obtained from the table as 28 μm. The calculated maximum drum shaping modification amount C a , considering both the original meshing tooth orientation error and the contact deformation, is also considered.
C a = 0.5 F β y + F m Cb
F m = F t K A K V
C a is the drum-shaped size, F β y is the meshing tooth orientation error, F t is the tangential force on the indexing circle, C is the meshing stiffness, K A is the usage factor, and K V is the dynamic load factor. The meshing stiffness C is taken as the mean value here, and the meshing stiffness is obtained as 19.48 Gp by finite element calculation [19], and the maximum drum-shaped size C a is obtained from Equations (23)–(26): 20.75 μm. The principle of trimming is shown in Figure 31. b is the tooth width of the input shaft helical gear, and the midpoint of the drum shape trimming is chosen at the mid-point of the tooth width. The material with the same deformation value is removed at the tooth end I and tooth end II, respectively. The entire tooth direction is drum-shaped to eliminate the edge effect of the gear teeth in contact so that the tooth surface load distribution is uniform. If the gears meshing each error compensate each other, there is no need to trim. The lower limit of tooth direction trimming is 0 μm.
b.
Spiral shaping amount
The local helix angle error is caused by the bending and twisting deformation of the gear shaft and caused by thermal deformation due to uneven temperature in the tooth direction of the gear teeth [20]. Helix trimming is used to obtain the amount of helix error compensation. The maximum bending deformation f of the pinion shaft was calculated according to the following equation:
σ b = 2 E π ω b d 4 L / b - 7 12
where ω is the load per unit tooth width, E is the modulus of elasticity, and L is the span of the shaft. Maximum torsional deformation in the tooth width direction:
σ t = 4 G π ω b d 2
where G is the shear modulus of elasticity.
Calculated by Equations (27) and (28), taking into account the bending and twisting combined deformation as shown in Figure 32, the helix line trim amount for the comprehensive deformation curve of the mirror curve, and the comprehensive deformation curve, it can be seen that the torque input end of the maximum deformation σ is 47 μm, its theoretical maximum trim amount is the maximum deformation, and the minimum deformation is 20 μm. The principle is shown in Figure 33. According to the trim curve, the material is uniformly removed from the tooth surface between the tooth endⅠ and tooth endII. The helix is in the correct position when the gear meshes under load, where the CHB of tooth endII is the maximum trim amount.

5.1.2. Involute Tooth Contouring

To ensure the tooth root bending strength, the tops of the teeth of both helical gears are used to trim the edges simultaneously, and neither tooth root is trimmed. The tooth profile deformation δ a can be calculated from Equation (29).
δ a = ω t C
The amount of deformation due to base pitch error and tooth profile deviation is Δ m :
Δ m = f pb + 1 / 3 f f
Base pitch error f pb = 16.83 μm and tooth profile shape deviation f f = 19 μm. If the base pitch error and tooth profile deviation and deformation are superimposed on each other then the maximum trim volume:
δ max = δ a + Δ m
The maximum trim volume is 28.78 μm, calculated by Equations (29)–(31). The tooth profile trim curve is shown in Figure 34, where L is the trim length, and δ max is the maximum trim volume. The helix angle of the large helical gear is large. The trim length is long, and the trim curve is parabolic. If the base pitch error and tooth profile deviation and deformation can be completely offset, trim is unnecessary, so the lower limit of tooth profile trim is 0 μm.

5.1.3. Micro-Parameter Optimization Design Based on the Full Factorial Method

With the calculated maximum modification amount as the optimization parameter, the best modification amount is selected by Romax using the full factorial method for parameter optimization. The full factorial design optimization allows all combinations of all levels of all factors to be calculated once so that all interactions of all orders can be estimated. The optimization process is shown in Figure 35. The design factors are the drum trim amount, helix trim amount, and tooth top trim amount of the left tooth face of the input shaft helical gear as variable factors, and the trim range of these three factors can be derived from theoretical calculations as shown in Table 5.
The tooth-wise load distribution coefficient K H β is used in the ISO standard to describe the tooth-wise load distribution problem [21], and the transmission error TE of the intermeshing gears is used to evaluate the effect of the gear excitation magnitude on the drive system vibration. Here, the tooth-wise load distribution coefficient K H β and the transmission error TE under reversing conditions are used as optimization objectives, and the target range makes the tooth-wise load distribution coefficient K H β ∈1.10~1.20 and the transmission error TE∈0~1.000 μm. The optimized solutions are calculated. The 3375 schemes were calculated, and the top ten best schemes were selected according to the weight values, as shown in Table 6. By comparing these ten schemes, the best shaping parameters were obtained by making each shaping amount an integer to get the best shaping parameters, as shown in Table 7.
According to the obtained optimal trimming parameters, the trimming curve is generated, as shown in Figure 36, which is a comprehensive modification curve of tooth direction, and it can be seen from the figure that the actual tooth profile trimming curve and the theoretical helix trimming curve are approximately the same. The actual profile of the tooth profile is shown in Figure 37.

5.1.4. Load Distribution on Tooth Surface after Shaping

Calculate the transmission error of the first- and third-stage helical gears for each operating condition. After modification, the transmission error of the first stage helical gear is shown in Figure 38.
The transmission error of the third-stage helical gear is shown in Figure 39, and the maximum transmission error value is 0.328 μm at 40% of the working condition, which is 0.942 μm lower than before shaping.
Figure 40 and Figure 41 show the tooth load distribution on the right tooth face of the input shaft helical gear at 40% and 100% operating conditions, respectively.
From the above two graphs, it can be seen that the unit length load on the tooth face is evenly distributed, and the maximum unit length load is 221 N/mm when running at 100% working condition, which is 50.4% lower than the unit length load of 446 N/mm before reshaping. Figure 42 shows the load distribution on the left tooth surface of the output shaft helical gear, from which it can be seen that the maximum unit length load on the tooth surface is 236 N/mm, which is 52.6% lower than the unit length load of 498 N/mm before shaping. From the contact analysis of the two pairs of gears after modification, the tooth surface unbalanced loading phenomenon of the gears has been improved, the tooth surface contact is more uniform, and the tooth surface load per unit length is smaller, which indicates from the side that the vibration noise will be improved.

5.2. Motor Stator–Rotor Slot Fit Optimization Design

The radial electromagnetic force of this asynchronous motor is reduced by changing the motor stator–rotor slot fit and stator slot structure while keeping the basic output parameters such as output torque, output shaft power, and efficiency unchanged. The number of rotor slots in the original model is 42, set with a lower limit value of 38 for the analysis and an upper limit value of 48, considering the motor rotor’s structural strength. Considering the installation of components, the variable step is set to 2. The slant slot degree is generally taken around Z2/Z1 times the stator tooth pitch for motors with rotor slots larger than stator slots. The rotor slant slot degree of the original motor is 4.0 degrees, so the lower limit value of the analysis is set to 3.0 degrees, the upper limit value is 6.0 degrees, and the step is set to 0.5. The original stator tooth slot opening is 3.5 mm, the stator slot is the semi-closed slot, its slot width is generally 2–3 wire diameter, the diameter of this asynchronous motor copper wire is 1.25 mm, so the range of stator slot opening is set to 2.4–3.8 mm, the step length is set to 0.2 mm. After the above analysis, the final parameters are determined, as shown in Table 8.
The optimized parameters of the motor were calculated using the parameter optimization module of Motor-CAD. A total of 616 results were obtained from the calculation, and the best combination of results was selected according to the weights, as shown in Table 9. The original scheme and the optimized scheme correspond to the motor performance-related parameters, as shown in Table 10, and the calculated electromagnetic force under the optimized scheme is shown in Figure 43.

5.3. Optimized Vibration Noise

A vibration simulation of the optimized drive system is performed. The vibration velocities are calculated for the 40% and 60% operating conditions of the first-stage gear, and the response nodes of the drive system housing surface are the same as before optimization to facilitate comparison of the vibration velocities. Figure 44 and Figure 45 show the vibration velocity of the first-stage gear under the first-order harmonic excitation at 40% and 60% operating conditions, respectively. Figure 46 shows the vibration velocity of the drive system under the fourth-order electromagnetic excitation harmonic. From the vibration diagram, it can be seen that the maximum vibration velocity under the fourth-order electromagnetic force wave is 0.75 mm/s. It is 0.55 mm/s lower than the vibration velocity before optimization.
The noise simulation of the optimized drive system was performed to solve the sound power of the drive system for 40% of the operating conditions. The results of the noise simulation analysis are shown in Figure 47. It can be seen in the Figure that the maximum noise caused by the third-order harmonics of the optimized primary gear occurs at 533 RPM speed. Its sound power value is 70.2 dB, which is 8 dB lower than the previous maximum sound power value, and at the same time reaches the advanced level in the industry. The maximum sound power generated by the fourth- and eighth-order electromagnetic excitation is 60.4 dB, 6.8 dB lower than the sound power before optimization.

6. Conclusions

The electromagnetic and mechanical excitations causing the construction hoist vibration were solved and analyzed. A parametric modeling analysis of the asynchronous motor shows that the fourth-order radial electromagnetic force is the main excitation source of electromagnetic excitation. The transmission errors of the first- and third-stage helical gears were solved by parametric modeling of the gearbox gears. The transmission error of the first-stage gear has a maximum value of 2.630 mm at 100% working condition, and the transmission error of the third-stage helical gear has a maximum value of 1.270 mm at 20% working condition. And the first-order harmonics of the transmission errors were found to be the main source of mechanical excitations that generate vibration noise.
Based on Romax software, the vibration speed of the drive system for each working condition was solved, where the maximum vibration speed under the first-stage gear excitation is 2.03 mm/s, corresponding to the speed of 1680 r/min. The frequency of gear excitation is 672 Hz, which is close to the second- and third-order modes, so the motor speed can be kept from approximately 1680 r/min by the control system, which can directly reduce the vibration noise of the drive system. The maximum vibration speed value of the drive system under the fourth-order radial electromagnetic excitation of the motor is 1.30 mm/s. The maximum sound power is generated by the first-stage gear excitation with a value of 78.8 dB, and the highest sound power generated by the electromagnetic excitation of the motor is 67.2 dB, which occurs at the highest speed.
For the vibration and noise problems caused by excessive gear transmission errors, the input shaft helical gear pair was reshaped and optimized based on Romax using the full factorial method. Uniform load distribution on the tooth surfaces of the reshaped first- and third-stage gears under all operating conditions, with a reduction of approximately 50% in the load per unit length of the tooth surface; the maximum vibration value generated by the first-stage gear transfer error excitation is 0.72 mm/s, which is 1.31 mm/s lower than before optimization; the maximum sound power generated by the first-order harmonic transfer error of the first gear is 70.2 dB, which is 8.6 dB lower than the 78.8 dB before optimization. For the vibration noise problem generated by the radial electromagnetic force of the YZPE2 asynchronous motor, the amplitude of the radial electromagnetic force wave after optimization is 130 N. The vibration value generated by electromagnetic excitation after optimization is 0.75 mm/s, which is 0.55 mm/s lower than before optimization. The noise value generated by fourth-order electromagnetic excitation after optimization is 60.4 dB, 6.8 dB lower than before optimization.

Author Contributions

Conceptualization, K.L. and B.T.; methodology, K.L., J.W. and B.T.; software, Y.Z. and B.T.; validation, J.W. and Y.Z.; formal analysis, J.W.; investigation, J.W.; resources, B.H.; data curation, B.H. and Y.Z.; writing—original draft preparation, B.T.; writing—review and editing, B.T.; visualization, B.T.; supervision, K.L.; project administration, B.H. and K.L.; funding acquisition, B.H. All authors have read and agreed to the published version of the manuscript.

Funding

This research was funded by the Sichuan University, Zigong City, special funds for school-local science and technology cooperation, grant number 2022CDZG-19, and the Science and Technology Department of Sichuan Province, grant number 2021YFG0050.

Conflicts of Interest

The authors declare no conflict of interest.

References

  1. ISO 9612:2009; Acoustics—Determination of Occupational Noise Exposure—Engineering Method. International Organization for Standardization: Geneva, Switzerland, 2009.
  2. JB/T 13712-2019; Construction Machinery and Equipment Noise Measurement Methods and Limit Values. China Standard Press: Beijing, China, 2019.
  3. Feng, Q.; Dongliang, L.; Aqiang, L.; Xiangpan, Y. Research of the motor-reducer integrated system NVH under multi-source excitation. Mech. Electr. Eng. Mag. 2020, 37, 659–664. [Google Scholar] [CrossRef]
  4. Fritze, H. Über die Geräuschbildung bei elektrischen Maschinen. Arch. Für Elektrotechnik 1921, 10, 73–95. [Google Scholar] [CrossRef]
  5. Alger, P.L.; Erdelyi, E. Calculation of the magnetic noise of polyphase induction motors. J. Acoust. Soc. Am. 1956, 28, 1063–1067. [Google Scholar] [CrossRef]
  6. Kim, D.J.; Jung, J.W.; Hong, J.P.; Kim, K.J.; Park, C.J. A study on the design process of noise reduction in induction motors. IEEE Trans. Magn. 2012, 48, 4638–4641. [Google Scholar] [CrossRef]
  7. Chen, H.; Zhao, J.; Xiong, Y.; Luo, X.; Zhang, Q. An Improved Model for Five-Phase Induction Motor Based on Magnetic Noise Reduction Part I: Slot Opening Width. Processes 2022, 10, 1496. [Google Scholar] [CrossRef]
  8. Kong, D.; Shuai, Z.; Li, W.; Wang, D. Electromagnetic vibration characteristics analysis of a squirrel-cage induction motor under different loading conditions. IEEE Access 2019, 7, 173240–173248. [Google Scholar] [CrossRef]
  9. Rui, H.A.N.; Youyi, T.A.N.G.; Xiongming, X.U.; Kaikai, J.I.A.O.; Zhicheng, X.I.N.; Zhiwei, Y.A.N.; Xiaohua, B.A.O. Analysis and simulation of electromagnetic noise of induction motors for electric vehicles. J. Electr. Eng. 2019, 14, 74–80. [Google Scholar]
  10. Bozca, M. Transmission error model-based optimisation of the geometric design parameters of an automotive transmission gearbox to reduce gear-rattle noise. Appl. Acoust. 2018, 130, 247–259. [Google Scholar] [CrossRef]
  11. Chen, X.; Song, C.; Zhu, C.; Tan, J.; Ullah, N. Effects of macro-parameters on vibration and radiation noise for high speed wheel gear transmission in electric vehicles. J. Mech. Sci. Technol. 2018, 32, 4153–4164. [Google Scholar] [CrossRef]
  12. Garambois, P.; Perret-Liaudet, J.; Rigaud, E. NVH robust optimization of gear macro and microgeometries using an efficient tooth contact model. Mech. Mach. Theory 2017, 117, 78–95. [Google Scholar] [CrossRef]
  13. Houser, D.R.; Harianto, J. The Effect of Micro-Geometry and Load on Helical Gear Noise Excitations; SAE Technical Paper; SAE International: Warrendale, PA, USA, 2005. [Google Scholar]
  14. Zhao, L.; Du, M.; Yang, Y. Optimizing gear micro geometry for minimum transmission error when considering manufacturing deviation. Int. J. Mater. Mech. Manuf. 2018, 6, 74–77. [Google Scholar] [CrossRef]
  15. Lei, Y.; Hou, L.; Fu, Y.; Hu, J.; Chen, W. Research on vibration and noise reduction of electric bus gearbox based on multi-objective optimization. Appl. Acoust. 2020, 158, 107037. [Google Scholar] [CrossRef]
  16. Wang, F.; Xu, X.; Fang, Z.; Chen, L. Study of the influence mechanism of pitch deviation on cylindrical helical gear meshing stiffness and vibration noise. Adv. Mech. Eng. 2017, 9, 1687814017720586. [Google Scholar] [CrossRef]
  17. Fakhfakh, T.; Walha, L.; Louati, J.; Haddar, M. Effect of manufacturing and assembly defects on two-stage gear systems vibration. Int. J. Adv. Manuf. Technol. 2006, 29, 1008–1018. [Google Scholar] [CrossRef]
  18. Yunhua, C.; Tianhui, D.; Lei, T. Research on calculation method of motor lamination core vibration characteristics. Electr. Mach. Control. 2014, 18, 71–76. [Google Scholar] [CrossRef]
  19. Bobo, Z.; Li, C.; Jie, F.; Yuan, Z.; Tao, W.; Yangshou, X. Research of the Calculation Method of the Gear Time-varying Mesh Stiffness based on FEM. J. Mech. Transm. 2019, 11, 74–77+83. [Google Scholar] [CrossRef]
  20. Yan, K.; Zhaoyao, S. Sequential Analysis and Evaluation Method of Gear Impacts. J. Tianjin Univ. (Sci. Technol.) 2013, 46, 440–447. [Google Scholar] [CrossRef]
  21. ISO 1328-1:2013; Cylindrical Gears—ISO System of Flank Tolerance Classification—Part 1: Definitions and Allowable Values of Deviations Rel-evant to Flanks of Gear Teeth. International Organization for Standardization: Geneva, Switzerland, 2013.
Figure 1. Parametric model of reducer.
Energies 16 06199 g001
Figure 2. Time-varying meshing stiffness of primary helical gear.
Energies 16 06199 g002
Figure 3. Time-varying engagement stiffness of third-stage helical gear.
Energies 16 06199 g003
Figure 4. Transmission error of first-stage helical gear pair.
Energies 16 06199 g004
Figure 5. Transmission error of third-stage helical gear pair.
Energies 16 06199 g005
Figure 6. Error harmonics of first-stage helical gear drive.
Energies 16 06199 g006
Figure 7. Error harmonics of third-stage helical gear drive.
Energies 16 06199 g007
Figure 8. Drive system drive sketch.
Energies 16 06199 g008
Figure 9. Drive system housing model.
Energies 16 06199 g009
Figure 10. Grounding Constraints.
Energies 16 06199 g010
Figure 11. Gear meshing misalignment under different operating conditions under rigid and flexible housing.
Energies 16 06199 g011
Figure 12. Dynamic model of gear meshing unit.
Energies 16 06199 g012
Figure 13. Axis Unit Model.
Energies 16 06199 g013
Figure 14. Helical gear contact line of output shaft.
Energies 16 06199 g014
Figure 15. Load distribution on the left tooth surface of helical gear of output shaft under 100% working condition.
Energies 16 06199 g015
Figure 16. Load distribution of the left tooth surface of output shaft helical gear under 40% working condition.
Energies 16 06199 g016
Figure 17. Load distribution of left tooth surface of input shaft helical gear under 100% working condition.
Energies 16 06199 g017
Figure 18. Load distribution of left tooth surface of input shaft helical gear under 40% working condition.
Energies 16 06199 g018
Figure 19. Shell Response Node.
Energies 16 06199 g019
Figure 20. Vibration speed under primary gear excitation at 100% operating condition.
Energies 16 06199 g020
Figure 21. Vibration speed under primary gear excitation at 80% operating condition.
Energies 16 06199 g021
Figure 22. Vibration speed under primary gear excitation at 60% operating condition.
Energies 16 06199 g022
Figure 23. Vibration speed under primary gear excitation at 40% operating condition.
Energies 16 06199 g023
Figure 24. Vibration speed under excitation of three-stage gear at 60% operating condition.
Energies 16 06199 g024
Figure 25. Vibration speed under excitation of three-stage gear at 80% operating condition.
Energies 16 06199 g025
Figure 26. Vibration velocity under fourth-order electromagnetic excitation.
Energies 16 06199 g026
Figure 27. Vibration velocity under eighth-order electromagnetic excitation.
Energies 16 06199 g027
Figure 28. Microphone distribution.
Energies 16 06199 g028
Figure 29. Campbell Diagram.
Energies 16 06199 g029
Figure 30. Sound power at 100% operating conditions under each excitation.
Energies 16 06199 g030
Figure 31. Tooth Shaping Principle.
Energies 16 06199 g031
Figure 32. Combined Deformation of Input Shaft Gear Shaft.
Energies 16 06199 g032
Figure 33. Spiral Shaping Principle.
Energies 16 06199 g033
Figure 34. Principles of profile modification.
Energies 16 06199 g034
Figure 35. Gear optimization process.
Energies 16 06199 g035
Figure 36. Tooth Direction Comprehensive Modification Curve.
Energies 16 06199 g036
Figure 37. Profile modification curve.
Energies 16 06199 g037
Figure 38. Error of first-stage helical gear pair after modification.
Energies 16 06199 g038
Figure 39. Transmission error of third-stage helical gear after modification.
Energies 16 06199 g039
Figure 40. Load distribution on the right tooth surface of the input shaft helical gear at 40% working condition.
Energies 16 06199 g040
Figure 41. Load distribution on the right tooth surface of the input shaft helical gear at 100% working condition.
Energies 16 06199 g041
Figure 42. Load distribution on the left tooth surface of the output shaft helical gear at 100% working condition.
Energies 16 06199 g042
Figure 43. Optimized Radial Electromagnetic Force Wave.
Energies 16 06199 g043
Figure 44. First-order harmonic-excited vibration speed of primary gear at 40% operating condition.
Energies 16 06199 g044
Figure 45. First-order harmonic-excited vibration speed of primary gear at 60% operating condition.
Energies 16 06199 g045
Figure 46. Fourth-order electromagnetic excitation harmonic vibration velocity.
Energies 16 06199 g046
Figure 47. Sound power at 40% operating conditions under each excitation.
Energies 16 06199 g047
Table 1. Macro-parameters of helical gear pair.
Macro ParametersPinion GearOutput Shaft Helical GearFirst Stage Pinion GearFirst Stage Large Helical Gear
Number of teeth22732469
Modulus2.51.75
Normal pressure angle (°)2020
Displacement factor0.290.170.10.05
Spiral   Angle   β (°)16.5228.75
Tooth widthb (mm)64603024
Center Distance (mm)12593
Diameter of indexing circle (mm)57.3190.247.9137.5
Tooth top height factor1.01.0
Top gap coefficient0.250.25
Rotation directionRight-rotationleft-rotationRight-rotationleft-rotation
Table 2. Input Torque and Power under Different Conditions.
Working ConditionMotor RotorOutputs
Name of Working ConditionRotational Speed (rpm)Torque (Nm)Power (kW)Rotational Speed (rpm)Torque (Nm)
100% working condition2470.073.419.0114.01596.2
80% working condition2470.058.415.1114.01268.5
60% working condition2464.043.811.3113.0951.8
40% working condition2485.029.27.6114.0634.5
Table 3. Material Properties of Drive Case.
Motor PartsDensity (kg/m3)Modulus of Elasticity (Gpa)Poisson’s Ratio
Motor housing73002.05 × 10110.28
Stator iron core7500Ex − y = 2.05 × 10¹¹, Ez = 1.45 × 10110.27
Shaft78502.10 × 10110.28
Mouse cage26506.5 × 10100.32
Table 4. First 20 order shell modes.
Number of Orders.Frequency (Hz)Number of OrdersFrequency (Hz)Number of OrdersFrequency (Hz)Number of OrdersFrequency (Hz)
128761036111461161668
260471037121512171673
360681156131516181700
478791383141545191774
5810101424151660201973
Table 5. Theoretical shaping range.
Helix Modification Amount (μm)Gear Direction Drum-Shaped Size (μm)Addendum Modification (μm)
(20.47)(0.20)(0.28)
Table 6. Ten Shaping Candidates.
Candidate ProgramHelix (μm)Gear Direction Drum-Shaped Size (μm)Addendum Modification (μm) K H β K F β
137136.436.075.361.1000.728
54932.1411.433.571.1000.728
256241.7910.3611.791.1000.831
28531.078.2122.001.1000.638
29231.079.296.431.1000.672
32831.0711.433.261.1000.647
167237.50 11.433.431.1010.627
189838.5711.437.501.1010.862
235240.7111.4311.791.1010.945
256141.7910.3610.711.1010.901
Table 7. Optimal shape modification scheme.
Gear Direction Drum-Shaped Size (μm)Helix Modification Amount (μm)Addendum Modification (μm)
12373
Table 8. Optimum Range of Motor Parameters.
ParameterRotor Slot NumberSkewed Degree (deg)Slot Opening Width (mm)
range(38, 48)(3.0, 6.0)(2.4, 3.8)
Table 9. Optimized scenarios.
ParameterRotor Slot NumberSkewed Degree (deg)Slot Opening Width (mm)
value4063.4
Table 10. Motor Performance Comparison.
ParameterMagnetic Density Amplitude of Stator Teeth (Tesla)Shaft Torque (N.m)Output Mechanical Power (kW)Efficiency (%)
Original1.679.720.686
Optimized1.1880.520.886.5
Disclaimer/Publisher’s Note: The statements, opinions and data contained in all publications are solely those of the individual author(s) and contributor(s) and not of MDPI and/or the editor(s). MDPI and/or the editor(s) disclaim responsibility for any injury to people or property resulting from any ideas, methods, instructions or products referred to in the content.

