Article

Increasing the Efficiency of Marine Engine Parametric Diagnostics Based on Analyses of Indicator Diagrams and Heat-Release Characteristics

Faculty of Marine Engineering, Gdynia Maritime University, 81-225 Gdynia, Poland
*
Author to whom correspondence should be addressed.
Energies 2023, 16(17), 6240; https://doi.org/10.3390/en16176240
Submission received: 20 July 2023 / Revised: 10 August 2023 / Accepted: 22 August 2023 / Published: 28 August 2023

Abstract

:
In this article, we discuss the importance of the analysis of indicator diagrams and indicated parameters in operational diagnostics of marine engines. An innovative method was devised to improve the effectiveness of diagnostics based on this information. It consisted of the elimination of harmful measurement spaces during cylinder pressure measurements as well as an in-depth analysis of the resultant indicator diagrams based on the functions of heat release. This research demonstrated a negative impact on the quality of indicator diagrams and the values of the parameters indicated by cylinder pressure measurements with sensors mounted on indicator cocks. The elimination of the indicator cock and measuring channel in the cylinder pressure measurements affected the quality of the indicator diagrams and, based on the calculated heat-release functions, allowed the emergence of new (additional) diagnostic symptoms. This could significantly improve the effectiveness of diagnostics performed in operating conditions and, as a result, the effective, trouble-free, and ecological operation of marine engines, thus meeting the growing environmental and operational safety requirements.

1. Introduction

In the operation of marine engines, diagnostics are primarily performed indirectly. Diagnostics are based on the analysis of changes in the values of selected parameters responding to changes in the technical condition of the engine. The credibility of the diagnosis and its unambiguity regarding the location of the damage mainly depend on the proper selection of diagnostic parameters and the interpretation of changes in the values in relation to reference values. This depends on the knowledge and experience of the engineering officer. In this process, an analysis of indicator diagrams and indicated parameters is often used. An analysis of the heat-release characteristics and additional diagnostic symptoms selected on this basis may be useful supplements. Therefore, it is important to properly measure cylinder pressures. This ensures that disturbances generated by measuring channels and indicator taps are omitted; this was taken into account in this research.
The diagnosis and monitoring of marine diesel engines in operating conditions are difficult processes, but they are important for navigational and ecological safety. Difficulties related to ongoing operational diagnostics result from the design complexity of these engines as well as variable operating conditions and access to a limited number of diagnostic parameters. The safe operation of an engine is affected by many functional systems, including systems directly responsible for the fuel combustion process such as the injection system, charge exchange system, and piston–piston rings–cylinder (PRC) system. The defective operation of any of these systems has a direct impact on the natural environment—above all, on atmospheric pollution—from the toxic components of exhaust gases and greenhouse gases. A commonly used diagnostic method to assess the quality of the combustion process in a marine engine is the measurement of cylinder pressure as a function of the angle of rotation of the crankshaft (CA). The analysis of changes in the values of indicated parameters read and calculated from indicator diagrams is used for diagnostic purposes, e.g., to identify faults in injection systems. This method has many advantages: measurements are obtained from a running engine, engine shutdown is not required, indicator diagrams and indicator parameter values are obtained almost immediately, and the course of cylinder pressure provides an overview of the quality of the combustion process.
Diagnostic information on the combustion process in a diesel engine can also be obtained by measuring the engine rotational speed [1] or by measuring torsional vibrations of the crankshaft [2]. For this type of measurement, it is necessary to use special measuring devices. These require access to the crankshaft, which is very difficult.
Many scientists have been involved in the modeling of combustion processes for different engines. Models of the combustion process are ideal for designing and optimizing the engine and its components, e.g., the injection time [3], fuel injection dose optimization [4], and fuel-type selection. They are also ideal for optimizing fuel consumption [5] and exhaust emissions [6] via the selection of materials and the construction of engine components. Most of the proposed models have been compared with actual operating parameters during experimental tests on an existing real object. Attempts to use mathematical and thermodynamic models to detect damage to a diesel engine in operation seem irrational because a large amount of input data are required and these would change the operational values.
Other approaches to measurement techniques for marine engine diagnostics include vibroacoustic vibration and acoustic resonance measurements. Vibration is determined by measuring the change in velocity, acceleration, displacement, or phase change of the vibrating object. Most diagnostic information can be obtained by measuring the vibration spectrum, but obtaining this information is difficult [7] because the complexity of vibrations generated by engines and the many sources of vibrations in an engine room render it difficult to establish diagnostic information.
The problems of the diagnosis and monitoring of the combustion process in the cylinder of a marine engine based on cylinder pressure measurements have been solved by many leading companies producing marine engines, such as MAN Diesel & Turbo, Wärtsilä, as well as others powered by gas fuel. Wärtsilä offers the latest diagnostic and monitoring system, UNIC, which uses the combustion pressure value. They claim that “the cylinder pressure characterizes the heartbeat of the engine and that it is an enabler for meeting future demands of internal combustion engine performance” [8]. MAN Diesel & Turbo uses the PMI System, also based on the cylinder pressure measurement, to control and diagnose its engines [9]. In addition to marine engine manufacturers, other companies also use this diagnostic method—formerly mechanical, now electronic—offering a variety of indicators. These include Kistler [10], ABB [11], and ICON RESEARCH [12] as well as Optrand, Autronika, Norcontrol, ASEA, AEG, ABB, and STL. In the stationary or portable indicators offered, cylinder pressure sensors are placed on indicator cocks or in special adapters outside the combustion chamber. This introduces large harmful spaces between the pressure sensor and the combustion chamber, which causes disturbances and distortions to the cylinder pressure measurement results.
Many scientists have examined cylinder pressure interference caused by measurement channels [13,14,15,16,17,18,19]. All stated that the following phenomena may occur in measurement channels:
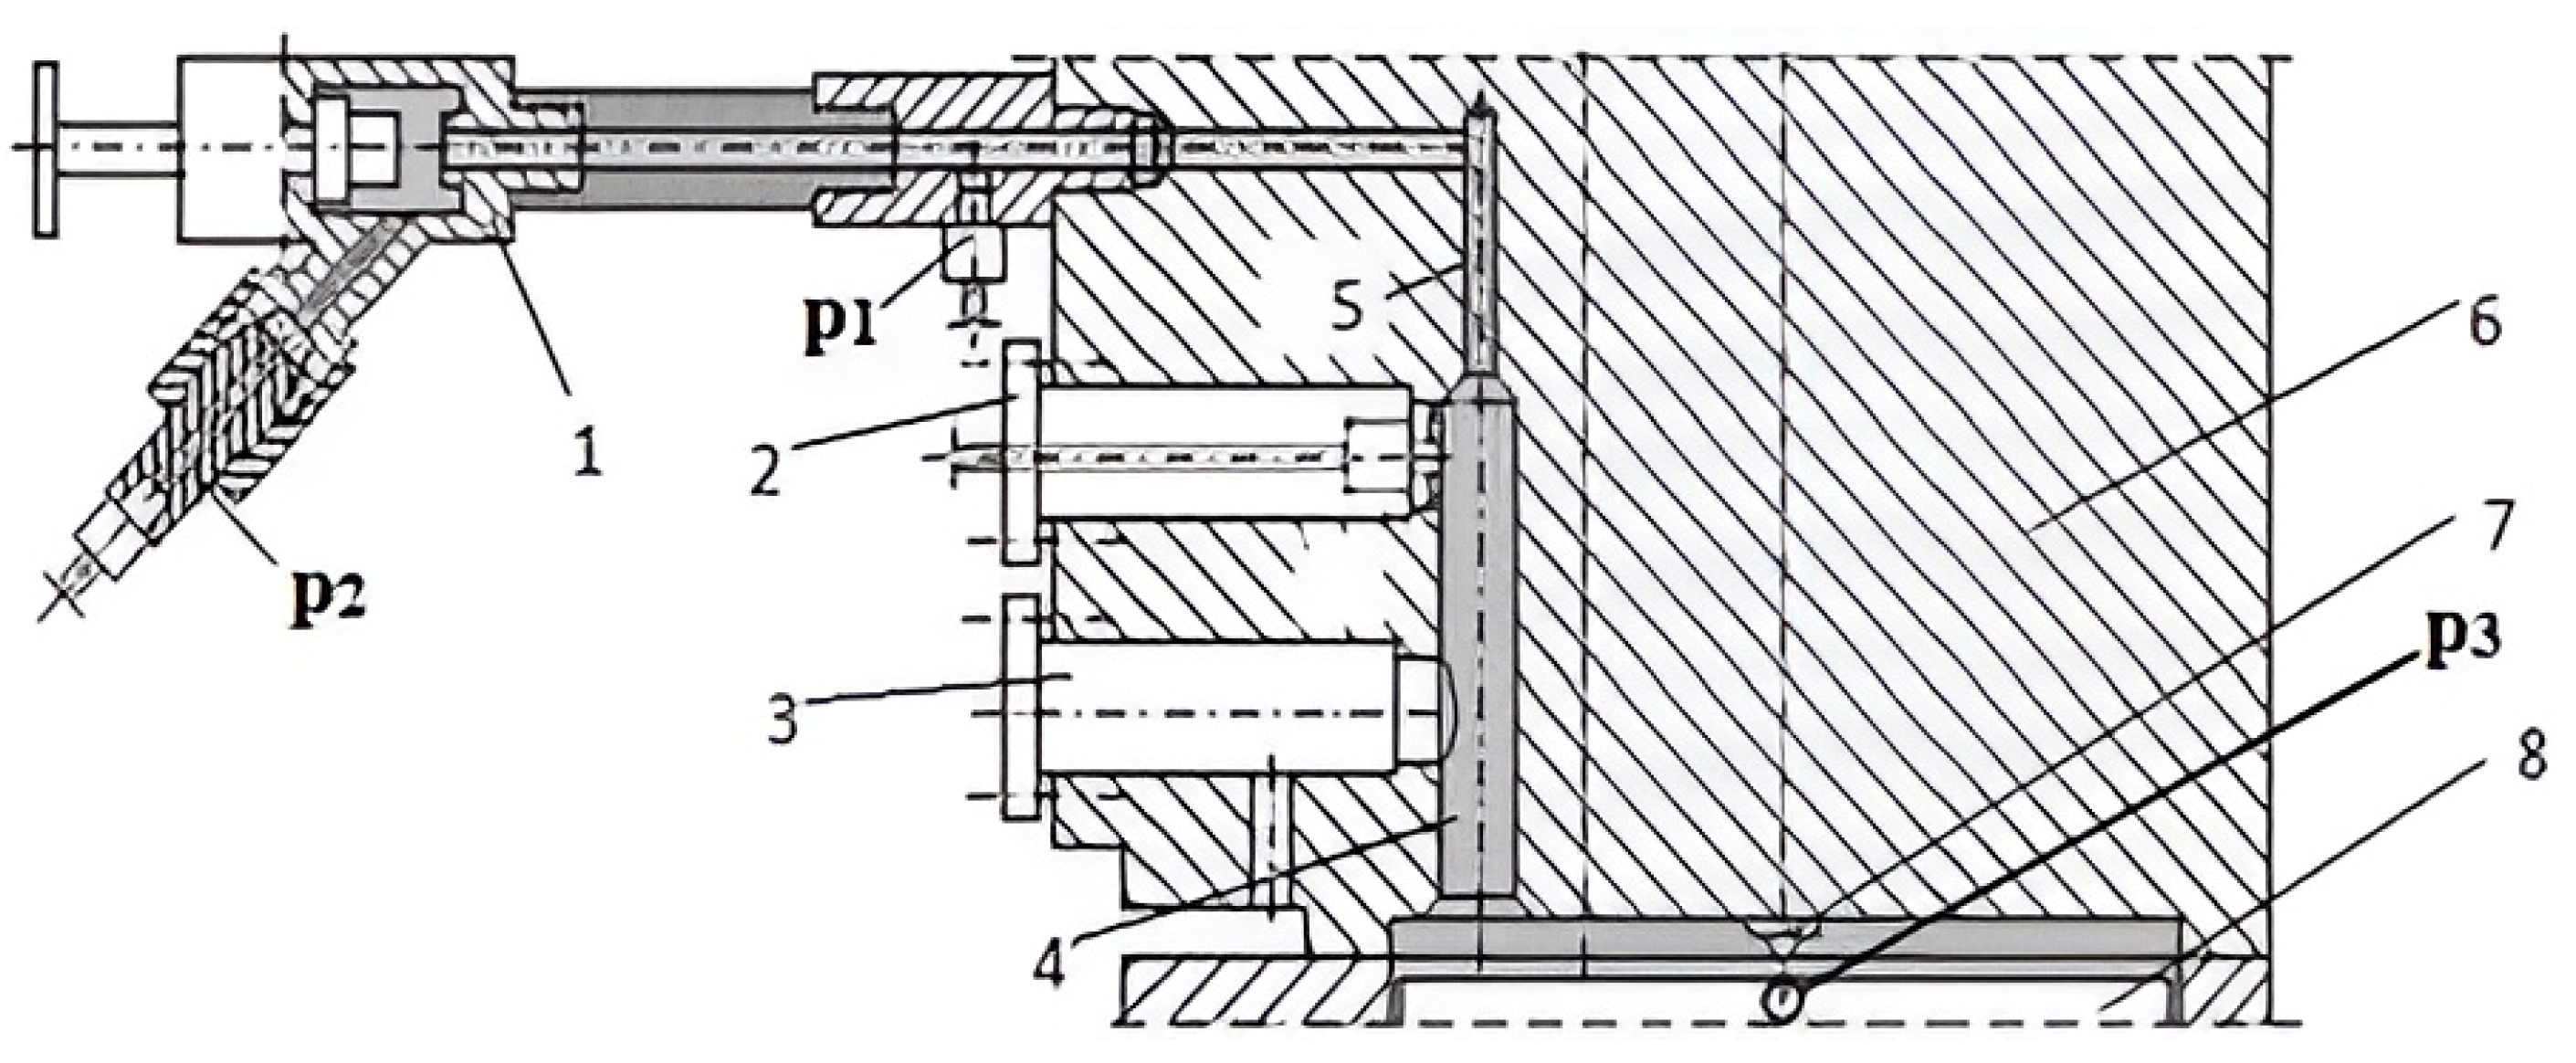
  • A delay in the pressure pulse due to the time required for the pressure wave to move through the channel;
  • Acoustic resonance of the gas column and wave phenomena in the connecting channel;
  • Changes in pressure acting on the sensor measuring node due to throttling or acceleration of the flow through the channel;
  • Gas velocity acceleration due to measuring channel cross-section changes.
Taking the above into account, three different locations for cylinder pressure sensors were used in the tests as part of this research, including omitting the influence of the measuring channels. The diagnostic database was also extended with the parameters of the heat-release function. Such an approach could improve the quality of the diagnostic process of marine piston engines, regardless of the type of fuel they are powered by.

2. Research Preparation

A medium-speed, four-stroke marine diesel engine (Sulzer 3AL 25/30 manufactured by Cegielski-Sulzer Poznań, Poland: power from the cylinder 136 kW, number of cylinders—3, bore—250 mm, stroke—300 mm, compression ratio—13, mean effective pressure—1575 MPa, rotational speed—750 rpm, specific fuel consumption—204 g/kWh) was used for the experiments. The engine was loaded with an alternating current generator, which allowed it to be loaded in the full range of its rated power. Kistler-type 6353A24 (manufactured by Kistler Instumente AG, Winterthur, Switzerland) pressure sensors with a sensitivity of 0.005 mA/MPa and a frequency range from 0.001 to 15,000 Hz were used to measure the cylinder pressure.

2.1. Preparation of the Stand for Research

To avoid the above-mentioned disturbances during cylinder pressure measurements, we installed the pressure sensor directly into the combustion chamber of a marine piston engine. The pressure sensors were arranged according to the diagram shown in Figure 1.
A new and innovative measuring place was established in the mounting hole in the cylinder liner flange, marked as p3 in Figure 1 and Figure 2. The mounting hole was prepared in accordance with the recommendations of the pressure sensor manufacturer, Kistler (the dimensions of the mounting hole are shown in Figure 3).

2.2. Selection of the Method for Smoothing Indicator Diagrams

The indicator diagrams were filtered using the method developed by [20] and consisted of a triple approximation of the obtained data with power polynomials of the third degree. The basis for the creation of the algorithm was the development of the moving mean square approximation algorithms with higher-degree power polynomials by Savitzky and Golay (Savitzky–Golay filter) [21]. To this day, this method is used in commonly known computational programs such as MATLAB and Mathematica.

2.3. Selection of the Piston Top Dead Center (TDC) Method

To determine the TDC on the indicator diagrams, the first derivative of the compression pressure course was determined. Its zero value was treated as the location of the TDC on the angular axis of the CA. As the compression, not the combustion pressure waveform, was used to determine the TDC, the total compression ratio was omitted for simplicity, i.e., the effect of the blow-by function and changes in the combustion chamber volume were omitted. Errors in the TDC positioning on the indicator diagram using the selected method did not exceed 0.5° CA, as declared in [15,22,23].

2.4. Selection of the Computational Model of Heat-Release Characteristics Based on Indicator Diagrams

The detection of damage to piston engines and their functional systems with only the use of indicator diagrams and parameters may be insufficient and difficult; diagnostic conclusions are often burdened with errors, especially in operating conditions [15]. The quality of diagnostics based on parameters and indicator diagrams can be significantly improved by not only eliminating the influence of indicator channels and indicator taps but also by an in-depth analysis of indicator diagrams using heat-release characteristics. The possibilities of using the characteristics of heat release in the diagnosis of the combustion process in a piston engine were described in 1966 [24]. In the diagnostic practice of marine piston engines, this issue has not been implemented; none of the currently offered indicators enable the analysis of heat-release characteristics. There may be several reasons limiting this possibility, including:
  • A lack of recognition of the issue of determining heat-release characteristics based on an indicator diagram;
  • A lack of effective data-processing methods;
  • Difficulties in determining the TDC on the angular scale of indicator diagrams;
  • Difficulties with “smoothing” indicator diagrams;
  • Difficulties in determining the courses of the derived indicator diagrams;
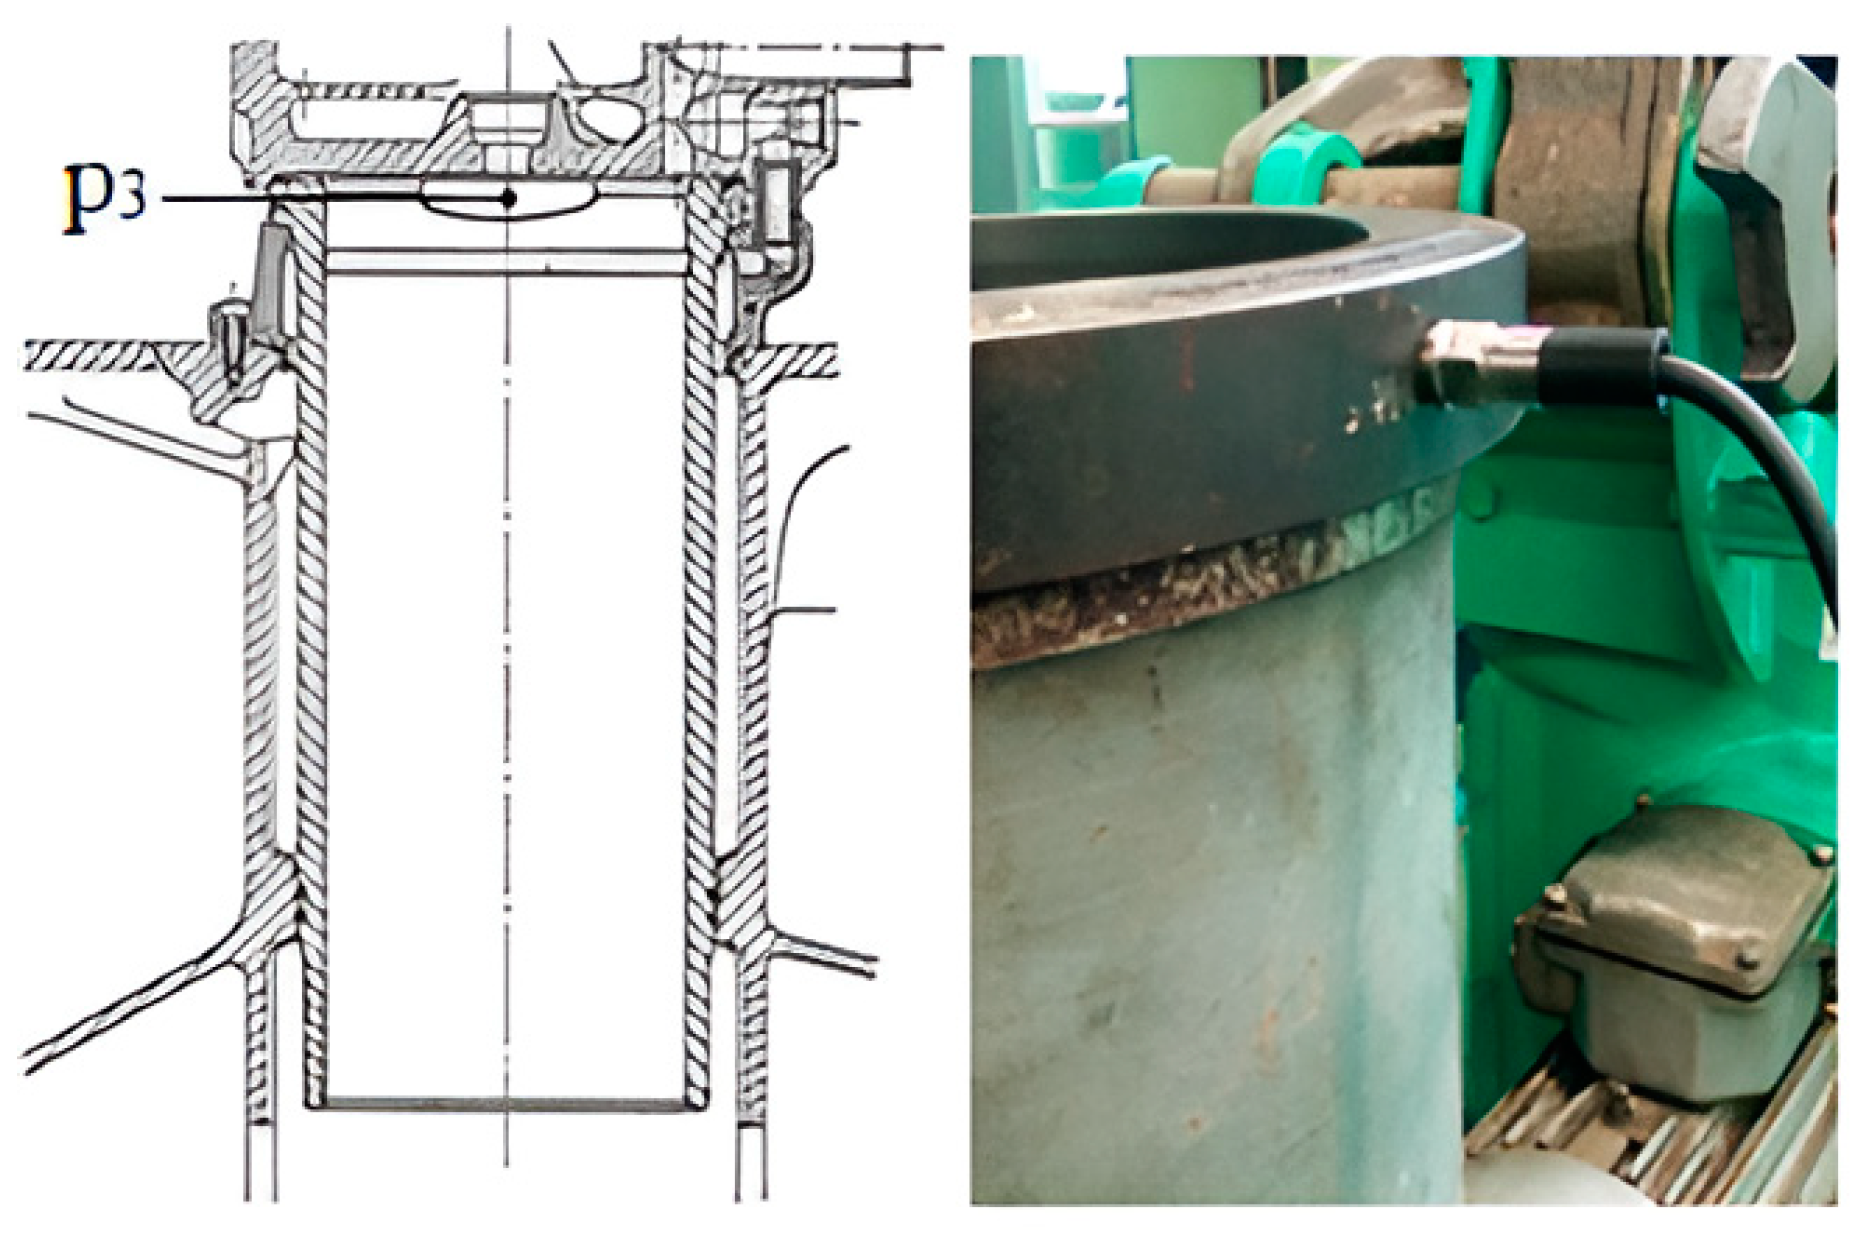
  • Distortion of the pressure signal caused by measuring channels and indicator cocks.
Thanks to the emergence of computer data processing and computer simulations in all fields of science, the second half of the 20th century saw the rapid development of theoretical and experimental methods of modeling and calculation, including combustion processes in compression-ignition engines [25,26]. The first author to describe the modern calculation methods of the combustion process in a compression-ignition engine was [27], and the first authors of the heat-release model are considered to be [28,29]. Researchers [30,31,32,33,34,35,36] have also conducted in-depth analyses of engine indicator diagrams based on heat-release characteristics in the study of phenomena occurring in the combustion process of an engine. In laboratory tests of the combustion process, complex models of heat release have been used [28,37,38,39] as well as simplified models called single-zone models [28,36,39,40,41].
For an in-depth analysis of the indicator diagrams by means of the analysis of heat-release characteristics, we used a single-zone model of heat release. The modeling of heat release begins with the equation of the first law of thermodynamics. For an open system, according to [28], it is as follows:
d U = đ Q   đ W đ m i   h i
This is because of the following:
đ Q = đ Q s p đ Q c h ,
Thus, the first law of thermodynamics for an open system can be written as:
đ Q s p = d U + đ W + đ Q c h + đ m i   h i ,
where   d U is the change in the internal energy of the charge in the cylinder, đ Q is the elementary heat supplied to the system,   đ W is the elementary work performed by the system,   đ m i is the elementary amount of the substance exchanged across the boundaries of the system (i.e., blow-by and fuel supply),   h i is the specific enthalpy of gas,   đ Q s p is the elementary heat released as a result of fuel combustion, and   đ Q c h is the elemental cooling heat.
The single-zone model of heat release developed by [15,42] is commonly used to determine the course of heat release based on indicator diagrams in compression-ignition engines. The correctness of the model [42] was confirmed by research conducted by [28]. Using Equation (9) and the functional relationships for internal energy and the gas constant by differentiation, the derivatives involved in the heat balance can be expressed as functions of the temperature, pressure, and excess air coefficient. Heat exchange through the walls of a combustion chamber can be calculated using empirical formulas. The input data are the combustion pressure and its derivatives as a function of the time, initial load mass, and excess air coefficient [38].
For diagnoses ascertained using heat-release characteristics, simply assumptions are generated. The heat released is defined as the net heat released. The net heat released is the sum of the internal energy and the work of the system. The simply assumptions result from the difficulty of calculating the cooling heat and load losses due to the gas blow-by. The simplification regarding the cooling heat is related to the assumption that the cooling heat takes the same value for all cylinders and has a minor impact on the heat-release functions. This collinearly depends on the temperature of the working medium and the surface of the cooled walls of the combustion chamber [28,38]. The assumptions simplifying the load losses should take into account, among other items, the chemical composition of the fuel, the fuel injection mass rate, and the amount of air charge. From the Equation (1) of the first law of thermodynamics, we can determine the formula for the net heat release Q n as follows:
đ Q n = đ Q s p đ Q c h đ m i   h i = d U + đ W ,
where đ Q n is the net elemental heat dissipated.
We assumed the following simplifications:
(1)
The gas was an ideal gas;
(2)
Load losses did not exist.
Based on the considerations of [28,35], Equation (4) took the following form:
đ Q n = ҡ ҡ 1   p d V + 1 ҡ 1   V d p ,
where ҡ = constants—isentrope exponent.
The net heat-release intensity can then be determined [35,38]. The instantaneous volume of gas in the cylinder was as follows:
V = V s V s x + V c + V z + V p x ,
where   V s is the swept volume,   V s x is the cylinder volume corresponding with the distance traveled by the piston from BDC,   V c is the combustion chamber volume,   V z is the change in cylinder volume due to the wear of crank–piston system components and the impact of assembly, and   V p x is the apparent change in cylinder volume as a result of gas blow-by (function of the piston path).
Assuming that V z = 0 and V p x = 0, the current gas volume in the cylinder can be provided by the following formula:
V = V s V s x + V c
If Equation (7) was divided by the swept volume V s , the volume can be obtained in a dimensionless form, as follows:
v = 1 v s x + v c ,
where
v s x = V s x V s = s x ,
s x = 1 2   1   λ 1 + λ 2 s i n 2 α c o s α ,
λ = R L ,
where s x is the dimensionless piston travel ratio of the piston travel s x traveled by the piston to the piston stroke S ( s x = 0   in   B D C   a n d   s x = 1   w   T D C ), R is the crank radius, and L is the connecting rod length.
The formula for the dimensionless volume of the combustion chamber takes the following form:
v c = V c V s = V c V s + V c V c = ( ε 1 ) 1 ,
where ε is the compression ratio.
The volume in the dimensionless form of Equation (8) takes the final following form:
v = 1 s x + v c = 1 s x + ( ε 1 ) 1 .
If the equation for the net heat released (Equation (5)) is divided by the cylinder displacement, and if Equation (12) is taken into account, the formula for the heat-release rate q can be obtained as follows:
q = đ Q d α = ( ҡ 1 ) 1 v   d p d α + ҡ p   ( d v d α ) ,   10 4 · J ° C A · m 3 .
Finally, the net heat released ( Q n ) to point α n of the angle of rotation of the crankshaft can be expressed by the following integral:
Q n = o α n q d α 10 4 ·   J m 3 ,
where the beginning of integration was obtained at BDC of the piston. The angle of rotation of the crankshaft is α = 0° CA.
The selected calculation model of the heat-release characteristics was influenced by applied simplifications and errors, including:
  • An assumption of a constant value for the isentrope exponent;
  • TDC location errors;
  • Errors in determining the compression ratio ε;
  • An error in the assessment of the compression starting pressure;
  • Measurement errors introduced by pressure sensors.
The influence of simplifications and measurement errors on the characteristics of heat release, prepared on the basis of indicator diagrams, has been presented in detail in [24,35], among others. The impact of measurement errors caused by measurement channels and indicator cocks is discussed in the first section. The author of [35] states that the errors of the determined indicated parameters do not significantly affect the heat-release characteristics, especially the steepness of the rise and fall of the q characteristics. Based on the considerations in [35], it could be concluded that net heat-release characteristics can be useful in the diagnosis of the working process of a marine piston engine. The authors chose a calculation model in the form of Equations (14) and (15) to determine the heat-release characteristics and the pressure measurement. These are necessary to determine the heat-release characteristics directly in the combustion chamber, and can exclude errors caused by measurement channels. Excluding one of the sources of measurement errors may contribute to an improvement in the conclusions during the complex diagnostic process of diesel engines.

3. Results and Discussion

3.1. Diagnostics of the Combustion Process Using the Cylinder Pressure Measurement

To compare the results, research was conducted that consisted of the simultaneous measurement of the combustion pressure in three different places in one engine cylinder. The research was performed on a technically efficient engine operating with selected damage simulations in three engine systems: the fuel injection, the working-medium exchange, and the PRC system. Figure 4 and Table 1 show the test results in the form of indicator diagrams. From these diagrams, we calculated the indicated parameters for an engine operating without damage. The engine load was 75% of the maximum continuous rating (75% MCR).
As shown in Figure 4, clear differences were apparent in the course of the cylinder pressure depending on the position of the pressure sensor. These included:
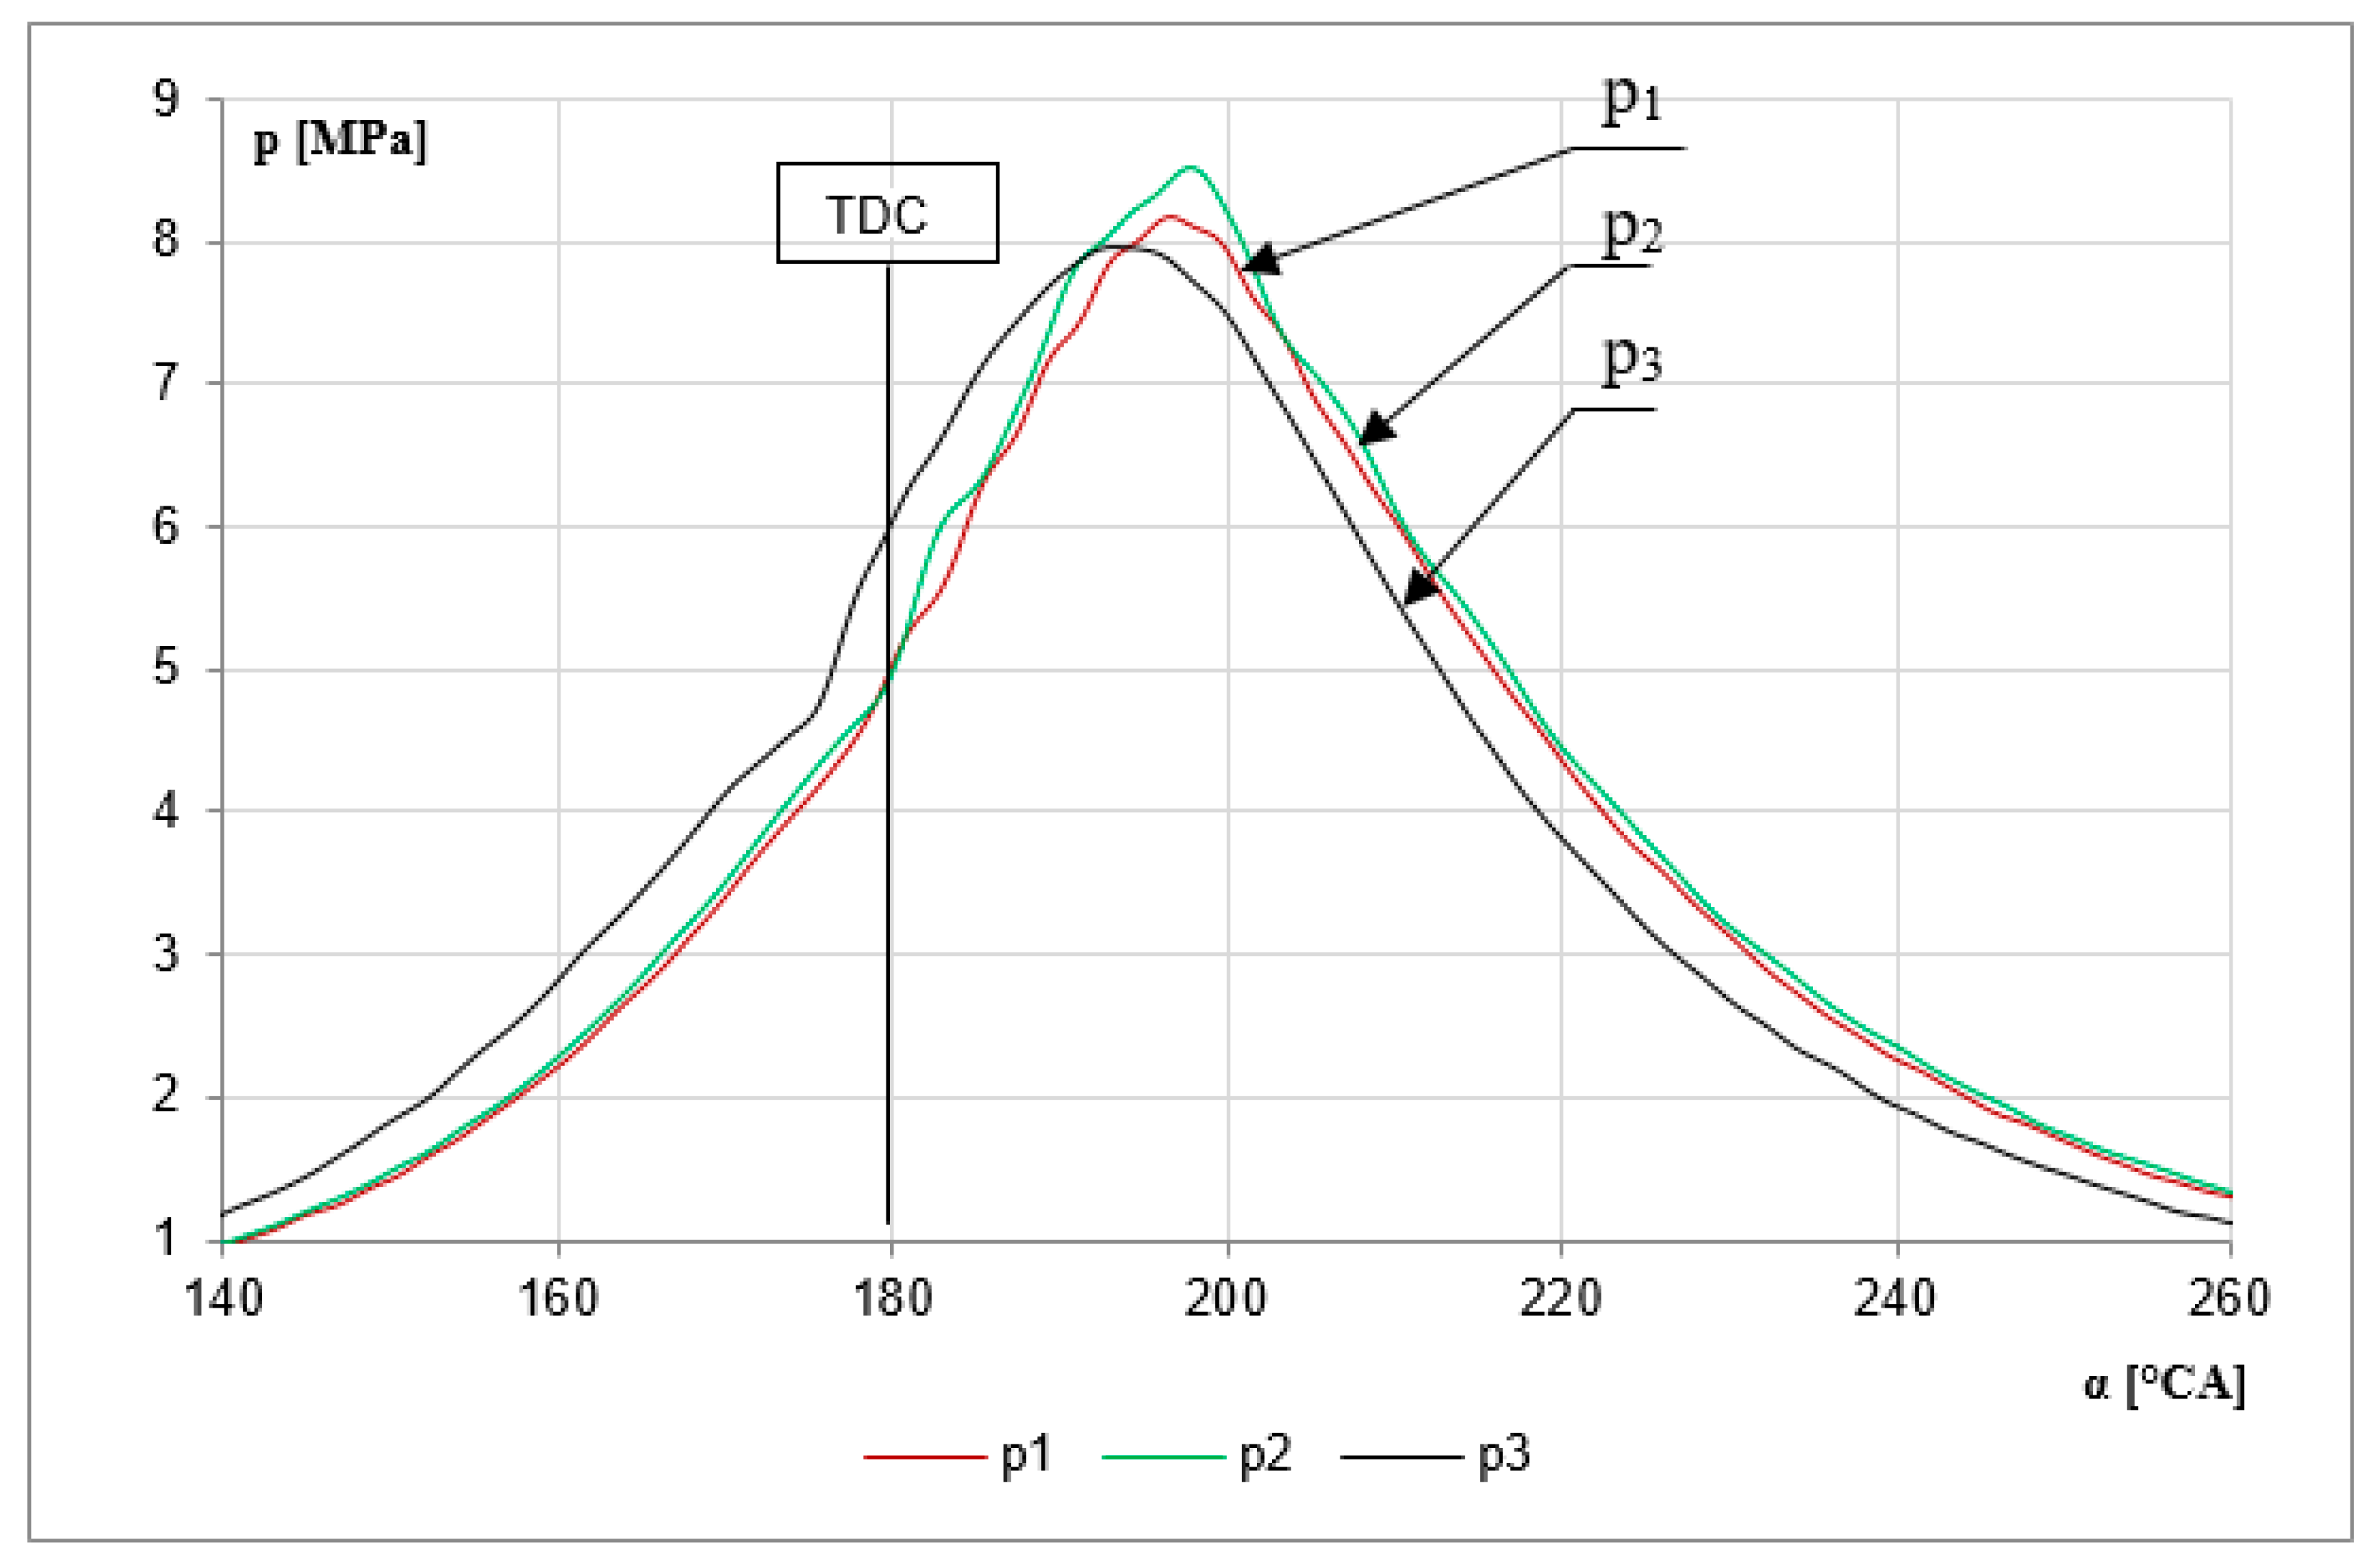
  • The maximum value of the combustion pressure (pmax) measured at p3, which was noticeably lower than the pressures measured at other measurement points;
  • The diagram corresponding with the measurement point p3 shifted to the left, relative to the TDC in relation to the other measurement points;
  • The course of the combustion pressure p3 was disturbed to a lesser extent compared with the courses of p2 and p1;
  • On the course of combustion pressure p3, the moment of a sudden increase in pressure due to the self-ignition of the fuel–air mixture was clearly seen (inflection of the curve). This inflection occurred at 175.5° CA. This was assumed, with high probability, to be the moment of self-ignition in the combustion chamber because it was invisible on the other runs;
  • The courses of the combustion pressures p1 and p2 were similar, except for the area of passage through the highest pressure values, i.e., in the range of the crankshaft rotation angle from approximately 185° to 205° CA.
When analyzing the indicated parameters in Table 1, we noticed the following:
  • The values of the mean indicated pressure (MIP) for the measurements at points p3 and p1 were similar, and the value of the pressure read on the indicator cock was the highest;
  • The value of the maximum combustion pressure (pmax) was highest at measurement point p1 and lowest at p3, and the differences between these values were significant;
  • The CA angle at the maximum combustion pressure (αpmax) was by far the lowest for p3. Large differences in the value of this parameter were noticed for other measurement points.
  • For the research conducted with the selected damage to the above-mentioned engine systems, a greater diagnostic usefulness of indicator diagrams and indicated parameters was observed when the cylinder pressure measurement was obtained without measuring channels.
For many years, measurements of the values of indicated parameters have been used in the diagnostics of marine piston engines; hence, indicators are used for this purpose. Indicating a marine engine is not easy, and the quality of this process is influenced by many factors. These include the negative impact of measuring channels connecting the engine combustion chamber with the pressure sensor or indicator cock and the pressure sensor on the quality of the obtained indicator diagrams and read and calculated indicator parameters.
Therefore, manufacturers of electronic indicators and engines should, wherever possible, take into account the above conclusions when preparing the optimal location to mount these measuring sensors.

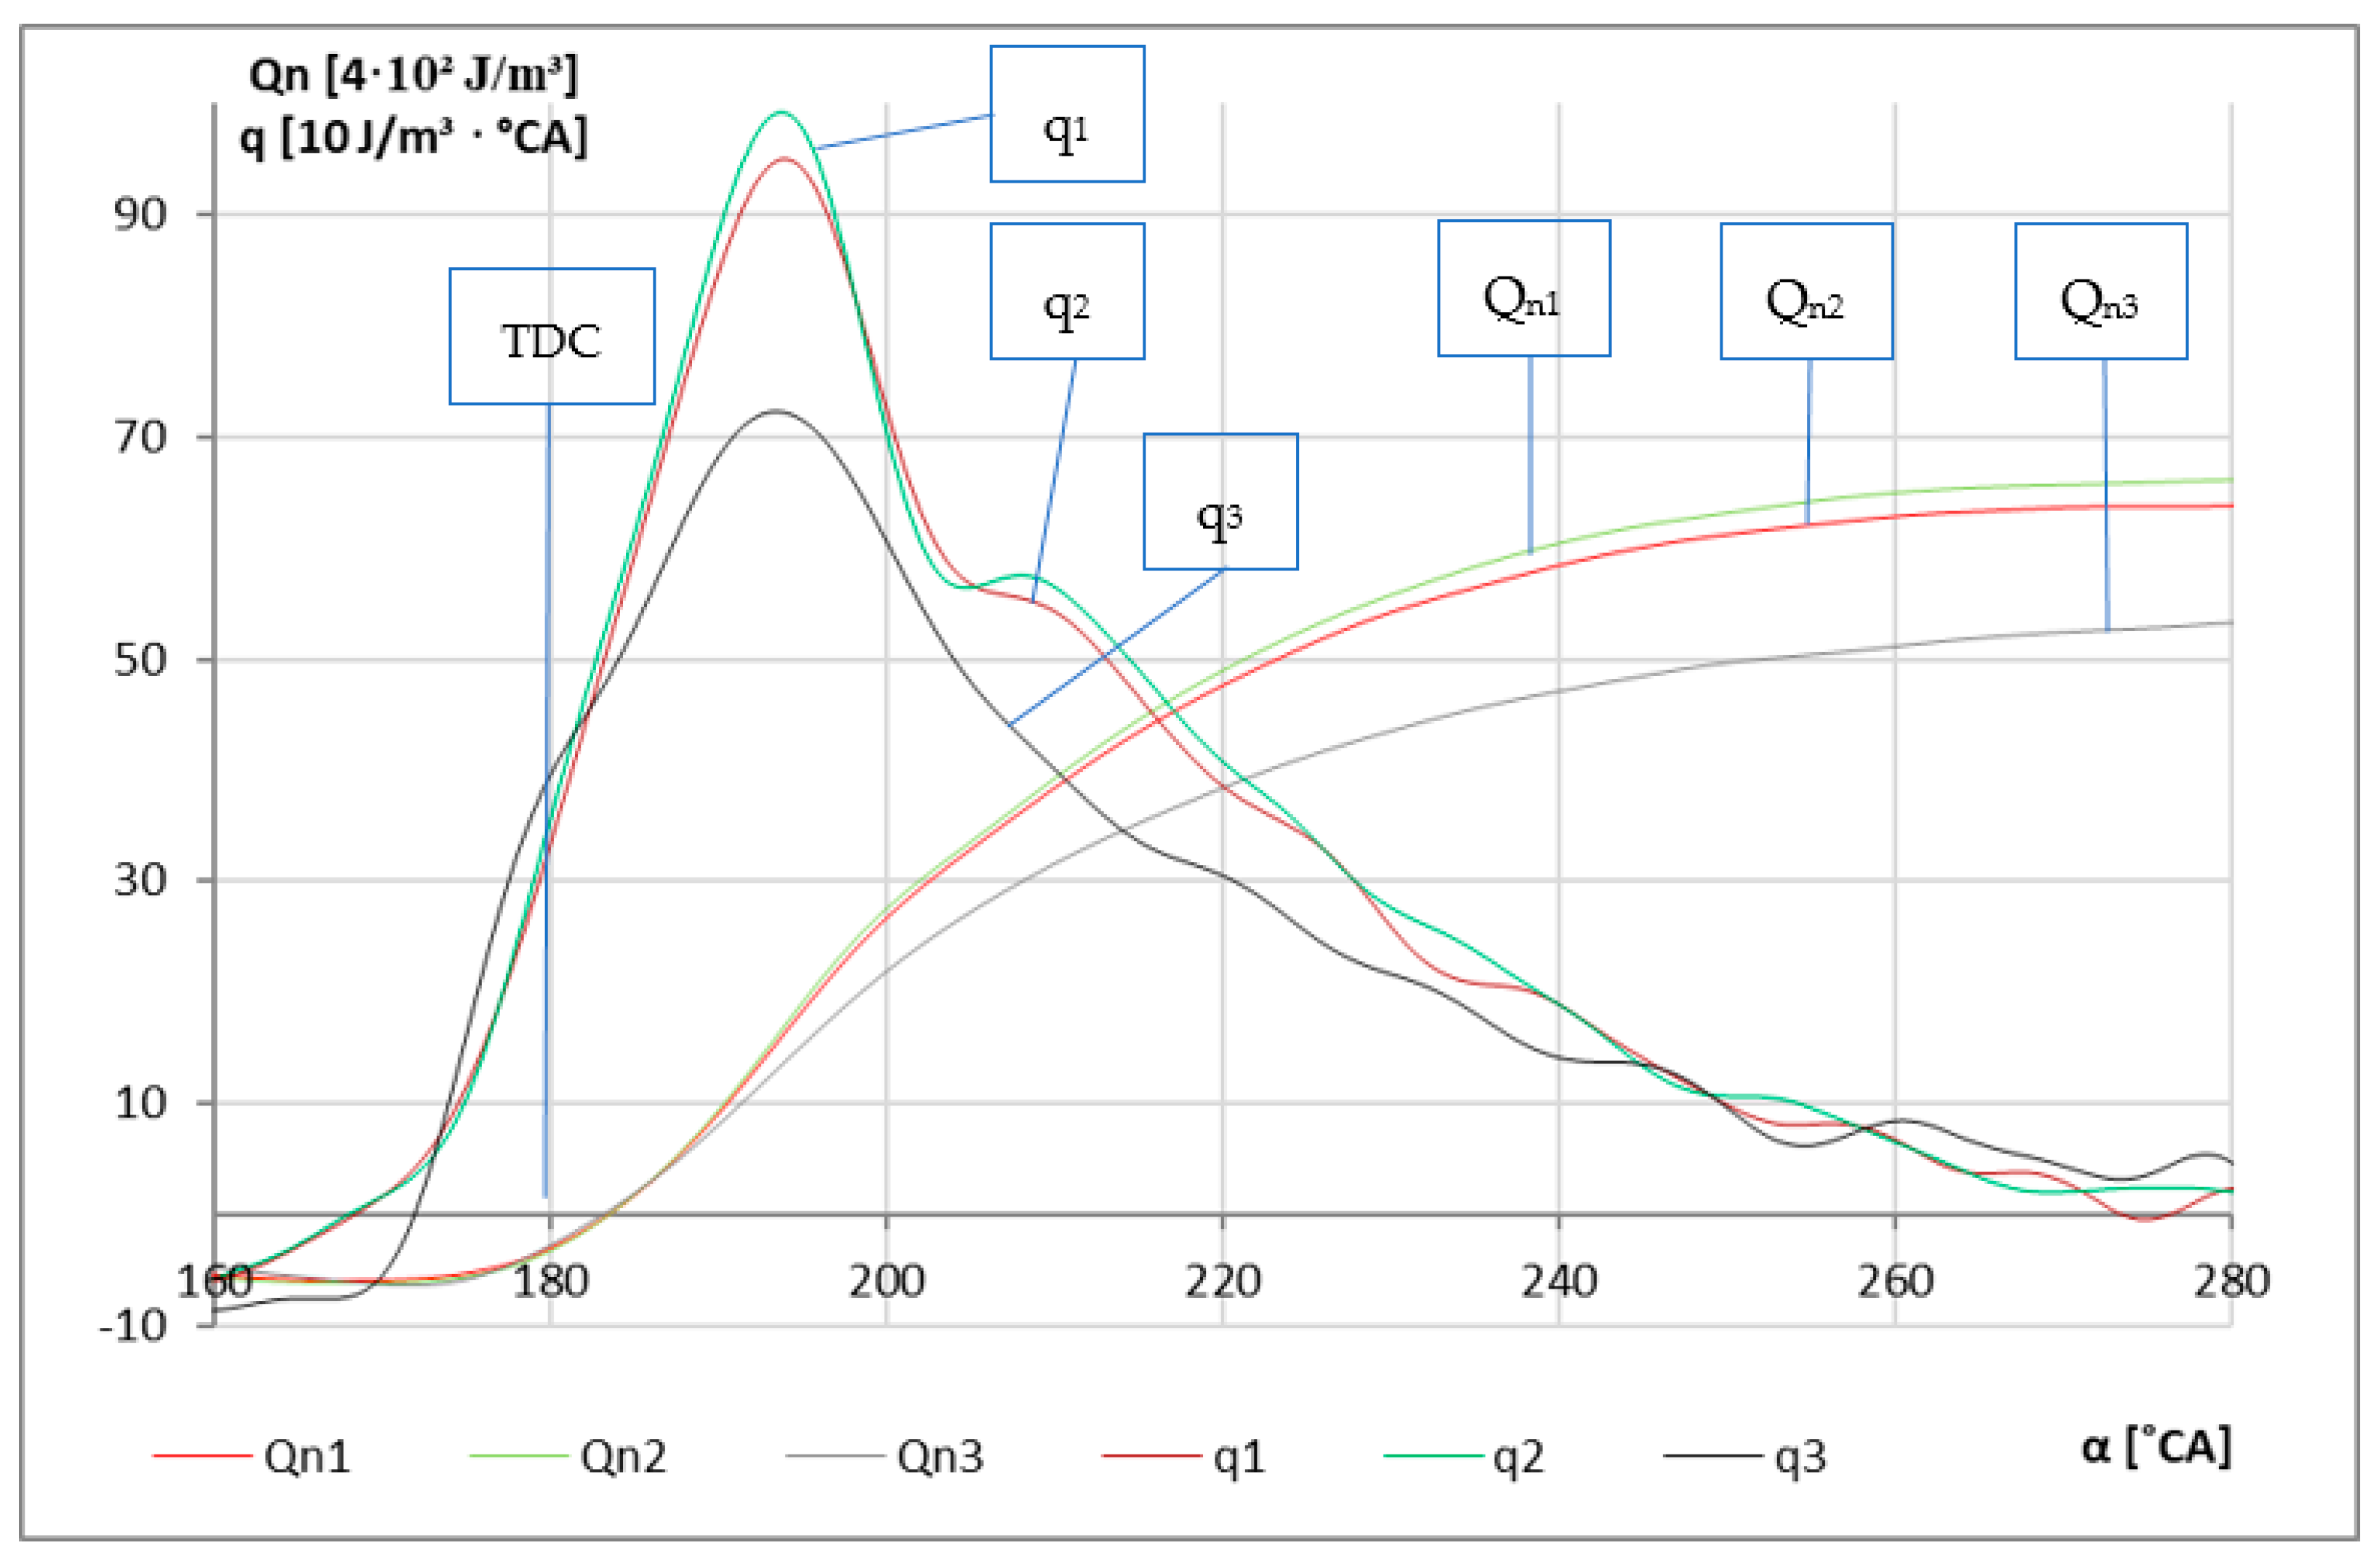
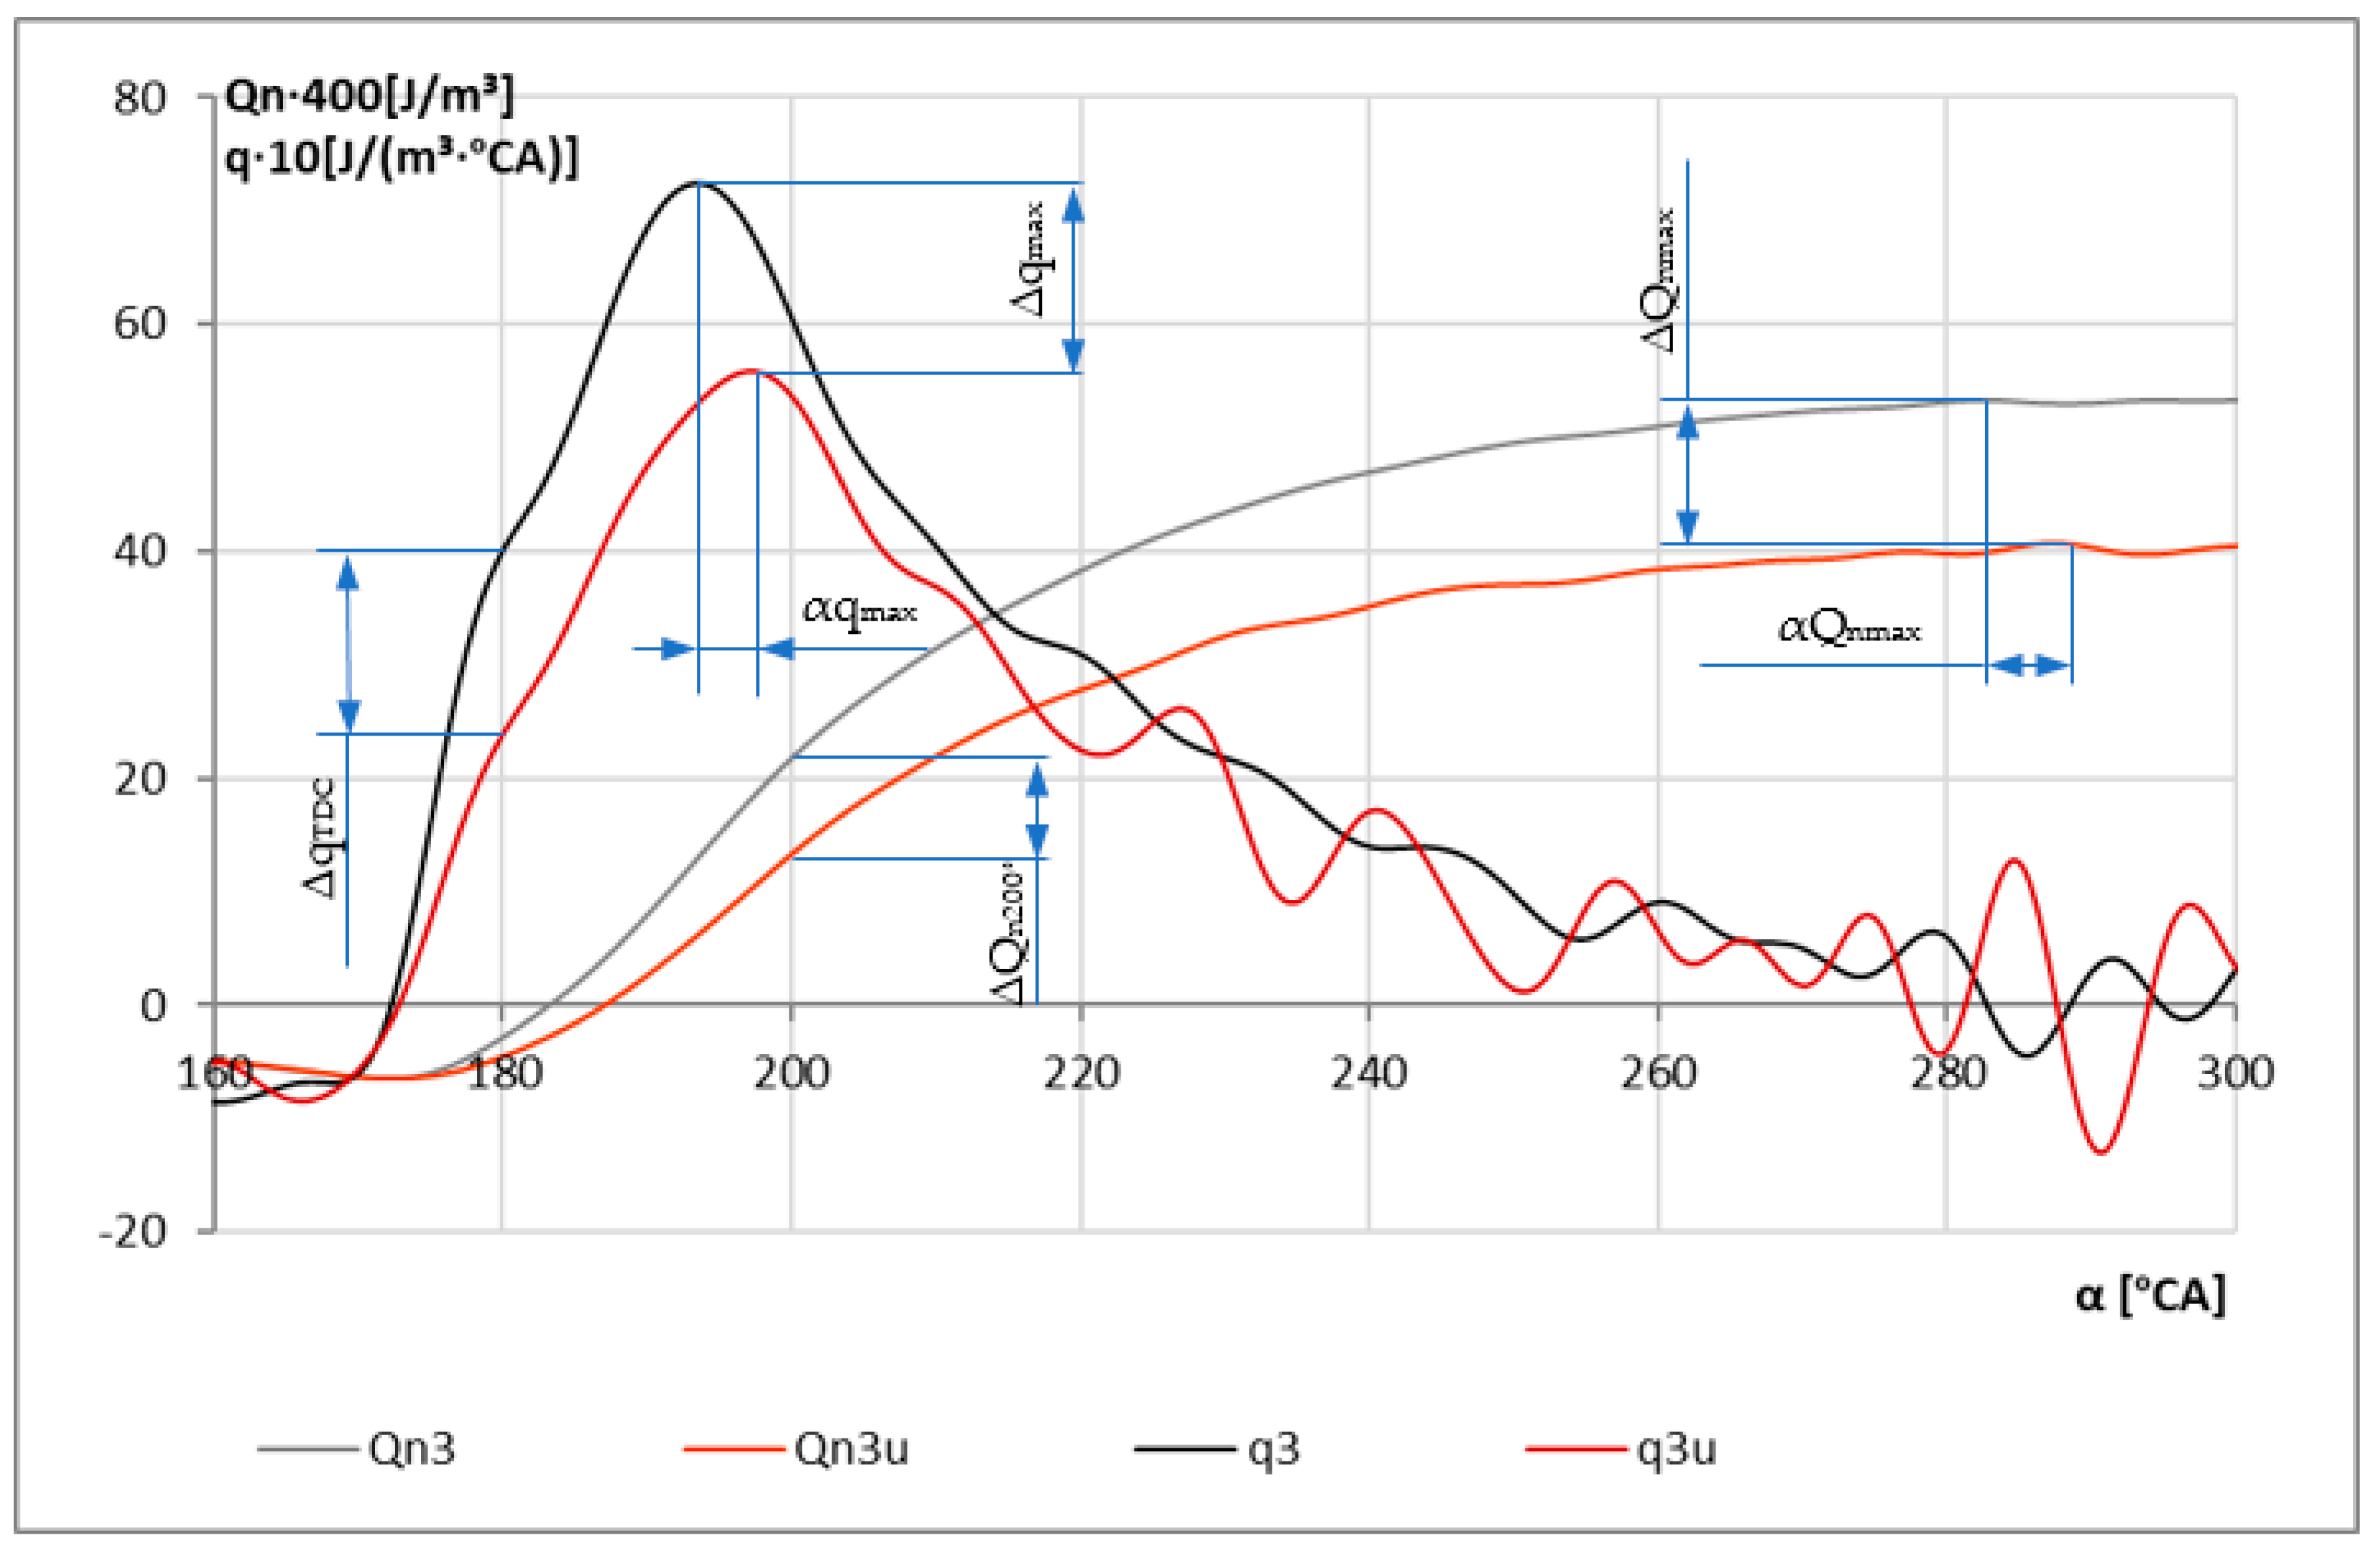
3.2. Diagnostics of the Combustion Process Using the Heat-Release Function

Figure 5 shows the heat-release characteristics, Qn and q, obtained from cylinder pressure waveforms recorded at three different measuring points. The cylinder pressure measurement location had a significant influence on the shape of the heat-release characteristics as well as the values read from them.
As a result of the analysis performed in the second section of this paper on cylinder pressure measurement errors generated by measuring channels and indicator cocks, only the measurement results read from measurement point p3, i.e., read directly from the cylinder liner flange, are analyzed in the remainder of this article. Figure 6 shows the characteristics of heat release for a technically efficient engine operating with a fault in the injection system. Selected characteristic values have also been marked. These values changed depending on the type and location of the engine damage. The values proposed by the authors for Δ q m a x , Δ q T D C , Δ α q m a x , Δ Q n m a x , Δ α Q n m a x , and Δ Q n 200 ° could be treated as new and innovative diagnostic symptoms. These may be useful in the diagnostic process of marine engines.
Table 2 presents the values of the selected parameters of the heat-release characteristics for a technically efficient engine, which were treated as reference values (column 2), and for an engine operating with damage to the fuel injection system, charge exchange, and PRC system (columns 3, 5, and 7). Columns 4, 6, and 8 in Table 2 show the difference between the values of the reference parameters and the parameters obtained for the damage.
When analyzing the values contained in Table 2, we concluded that damage to the injection system had the greatest impact on the values of the selected parameters (except for parameter α Q n m a x ). For the remaining damage, changes in the values of selected parameters were noticeable, but they were subtle.
We also conducted a number of experimental tests for various faults in the fuel injection system (leaky injection pump precision pair, clogged injector holes, decalibrated injector holes, and reduced injector opening pressure) and charge exchange system (dirty compressor filter, dirty charge air cooler, and dirty exhaust gas exhaust ducts). The damage was gradually introduced. We observed that the damage introduced to the injection system caused significant differences in the values of the selected parameters. Experimental studies were also performed for various engine loads; the conclusions were similar.
The quality of the parametric diagnosis of a marine piston engine can also be increased by extending the sets of indicated parameters with parameters read from heat-release functions calculated on the basis of indicator diagrams (e.g., Δ q m a x , Δ q T D C , α q m a x , Δ Q n m a x , α Q n m a x , and Δ Q n 200 ° ).
The research above could have widespread use in the operational practice of marine power plants using electronic-type indicators with such algorithms (their software) based on the relatively simple mathematical model proposed in this article. This would allow for the calculation of the heat-release function.

4. Conclusions

The method for increasing the quality of acquired diagnostic information proposed in this paper does not require the design and construction of new, expensive measuring devices. The elimination of the indicator cock and measuring channel in the cylinder pressure measurements affected the quality of the indicator diagrams.
For the research conducted with the selected damage to the above-mentioned engine systems, a greater diagnostic usefulness of indicator diagrams and indicated parameters was observed when the cylinder pressure measurement was obtained without measuring channels.
In the proposed solutions for electronic indicators, it is enough to select the appropriate cylinder pressure measurement points and extend the calculation algorithms of the indicators with heat-release functions.
The article indicates new, innovative diagnostic symptoms ( Δ q m a x , Δ q T D C , Δ α q m a x , Δ Q n m a x , Δ α Q n m a x , and Δ Q n 200 ° ). The various damages to the injection system had the greatest impact on the values of the selected parameters determined on the basis of the analysis of the heat-release functions.
These procedures should not have a significant impact on the cost of purchasing measuring equipment, but could bring benefits to ship owners as a result of the increased probability of the effective detection of various types of damage to engine components at an earlier stage of their occurrence.
This would significantly improve the effectiveness of diagnostics performed in operating conditions and, as a result, the effective, trouble-free, and ecological operation of marine engines, thus meeting the growing environmental and operational safety requirements. This would improve the operational safety of marine engines, making it easier to avoid failures. This would translate to lower operating costs.
During the tests, the results of which are presented in this article, the engine was powered by marine diesel oil. In further research, authors may use the described method in relation to powering an engine with alternative fuels.

Author Contributions

Conceptualization, J.W. and K.W.; methodology, J.W.; software, J.W; validation, J.W. and K.W.; formal analysis, J.W. and K.W.; resources, J.W.; data curation, J.W.; writing—original draft preparation, J.W. and K.W.; writing—review and editing, J.W. and K.W.; visualization, J.W. and K.W.; supervision, K.W. All authors have read and agreed to the published version of the manuscript.

Funding

This research received no external funding.

Data Availability Statement

Not applicable.

Conflicts of Interest

The authors declare no conflict of interest.

References

  1. Kaisan, M.U.; Anafi, F.O.; Nuszkwoski, J.; Kulla, D.M.; Umaru, S. GC–MS analyses of biodiesel produced from cotton seed oil. Niger. J. Sol. Energy 2016, 27, 56–61. [Google Scholar]
  2. Drewing, S.; Witkowski, K. Spectral Analysis of Torsional Vibrations Measured by Optical Sensors, as a Method for Diagnosing Injector Nozzle Coking in Marine Diesel Engines. Sensors 2021, 21, 775. [Google Scholar] [CrossRef] [PubMed]
  3. Tadros, M.; Ventura, M.; Soares, C. Assessment of the performance and the exhaust emissions of a marine diesel engine for different start angles of combustion. Marit. Technol. Eng. III 2016, 3, 769–775. [Google Scholar] [CrossRef]
  4. Bai, F.; Zhang, Z.; Du, Y.; Zhang, F.; Peng, Z. Effects of Injection Rate Profile on Combustion Process and Emissions in a Diesel Engine. J. Combust. 2017, 2017, 9702625. [Google Scholar] [CrossRef]
  5. Vettor, R.; Tadros, M.; Ventura, M.; Guedes Soares, C. Influence of Main Engine Control Strategies on Fuel Consumption and Emissions, Maritime Technology and Engineering. In Progress in Maritime Technology and Engineering; Guedes Soares, C., Santos, T.A., Eds.; Taylor & Francis Group: London, UK, 2018; pp. 157–163. [Google Scholar] [CrossRef]
  6. Hiroyasu, H.; Miao, H.; Hiroyasu, T.; Miki, M.; Kamiura, J.; Watanabe, S. Genetic Algorithms Optimization of Diesel Engine Emissions and Fuel Efficiency with Air Swirl, EGR, Injection Timing and Multiple Injections. SAE Trans. 2003, 112, 1353–1364. [Google Scholar] [CrossRef]
  7. Włostowski, R.; Wróbel, R.; Trzmiel, K.; Dyrcz, K.; Dębowski, L. Analysis methods of measuring the pressure in the combustion chamber of an internal combustion engine in terms of use as a control signal in diesel engines. Combust. Engines 2013, 154, 587–592. [Google Scholar]
  8. Vuollet, T. Next Generation UNIC Automation System to Enable Wärtsilä 31 Performance, Presented at the CIMAC Congress 2016. Available online: https://www.wartsila.com/insights/article/next–generation–unic–automation–system–enables–wartsila–31–performance (accessed on 24 February 2023).
  9. Available online: https://www.man–es.com/docs/default–source/document–sync/retrofit–upgrade–eng.pdf?sfvrsn=ea0f5eee_7 (accessed on 1 April 2023).
  10. Available online: https://kistler.cdn.celum.cloud/SAPCommerce_Download_original/960–712e.pdf (accessed on 1 April 2023).
  11. Available online: www.new.abb.com/products/measurement–products/combustion–pressure–measurement (accessed on 24 February 2023).
  12. Available online: www.iconresearch.co.uk/diesel–engine–analysis/doctor–portable (accessed on 24 February 2023).
  13. Cupiał, K.; Dużyński, A.; Gruca, M.; Grzelka, J. Some errors of gas engine indication. J. KONES Intern. Combust. Engines 2001, 8, 154–171. [Google Scholar]
  14. Gałecki, W.; Tomczak, L. Indykowanie Okrętowych Silników Spalinowych; Wydawnictwo Akademii Morskiej w Gdyni: Gdynia, Poland, 2002. [Google Scholar]
  15. Polanowski, S. Studium Metod Analizy Wykresów Indykatorowych w Aspekcie Diagnostyki Silników Okrętowych; Nr. 169A; Scientific Journal of Polish Naval Academy: Gdynia, Poland, 2007. [Google Scholar]
  16. Polanowski, S.; Pawletko, R.; Witkowski, K. Influence of pressure sensor location on the quality of thermodynamic parameters calculated from the marine engine indicator diagram. Combust. Engines 2013, 154, 319–323. [Google Scholar]
  17. Tomczak, L. Wykorzystanie Pośredniej Metody Określania Położenia Wału Korbowego w Indykatorze Elektronicznym. Ph.D. Thesis, The Faculty of Mechanics, The Gdansk University of Technology, Gdansk, Poland, 2001. [Google Scholar]
  18. Walter, T.; Gossweiler, C.; Willson, B. Application of an Improved Model for the Determination of Acoustic Resonances in Indicator Passages for Combustion Pressure Measurements in Large Bore Gas Engines. In Proceedings of the ASME 2006 Internal Combustion Engine Division Spring Technical Conference (ICES2006), Aachen, Germany, 7–10 May 2006; Available online: https://www.kistler.com (accessed on 20 November 2022).
  19. Wysocki, J. Modification of the System for Measuring Combustion Pressure in the Ship Piston Engine Sulzer AL25/30; Scientific Journal of Gdynia Maritime University: Gdynia, Poland, 2018; pp. 168–180. [Google Scholar] [CrossRef]
  20. Polanowski, S. Wygładzanie Wykresów Indykatorowych Ruchomymi Obiektami Aproksymującymi z Więzami Łamanymi; Nr. 1; Scientific Journal of Polish Naval Academy: Gdynia, Poland, 2006. [Google Scholar]
  21. Savitzky, A.; Golay, M.J.E. Smoothing and Differentiation of Data by Simplified Least Squares Procedures. Anal. Chem. 1964, 36, 1627–1639. [Google Scholar] [CrossRef]
  22. Pawletko, R. Increasing the accuracy of the mean indicated pressure determination by appointment of the tdc cylinder position. J. KONES Powertrain Transp. 2014, 21, 251–258. [Google Scholar] [CrossRef]
  23. Polanowski, S.; Pawletko, R. Wyznaczanie GMP silników okrętowych z zastosowaniem wielomianowego modelu wykładnika krzywej sprężania. Combust. Engines 2011. Available online: http://yadda.icm.edu.pl/yadda/element/bwmeta1.element.baztech–article–LOD9–0031–0015 (accessed on 24 February 2023).
  24. Wajand, J. Możliwość wykorzystania wykresów indykatorowych do określania przebiegu wydzielania ciepła w cylindrze silnika spalinowego. Siln. Spalinowe 1966, 2, 111. [Google Scholar]
  25. Hayes, I.K.; Savage, L.D.; Sorenson, S.C. Cylinder pressure data acquisition and heat release analysis on a personal computer. In SAE International, Technical Paper 860029; SAE International: Warrendale, PA, USA, 1986; ISSN 0148-7191. e-ISSN 2688-3627. [Google Scholar] [CrossRef]
  26. Woschni, G.; Anisits, F. Experimental Investigation and Mathematical Presentation of Rate of Heat Release in Diesel Engines Dependent upon Engine Operating Conditions. In SAE Technical Paper 740086; SAE International: Warrendale, PA, USA, 1974. [Google Scholar] [CrossRef]
  27. Lyn, W.T. Calculations of the Effect of Rate of Heat Release on the Shape of Cylinder–Pressure Diagram and Cycle Efficiency. Proc. Inst. Mech. Eng. Automob. Div. 1960, 14, 34–46. [Google Scholar] [CrossRef]
  28. Rychter, T.; Teodorczyk, A. Modelowanie Matematyczne Roboczego Cyklu Silnika; PWN: Warszawa, Poland, 1990. [Google Scholar]
  29. Schweitzer, P. The Tangent Method of Analysis of Indicator Cards of Internal Combustion Engines; Bulletin No 35; Pennsylvania State University: State College, PA, USA, 1926. [Google Scholar]
  30. Ambrozik, A.; Łagowski, P. Wybrane metody sporządzania charakterystyk wydzielania ciepła w silnikach spalinowych. J. KONES 2005, 15–25. Available online: https://kones.eu/ep/2005/vol12/no12/JOURNAL%20OF%20KONES%202005%20NO%201–2%20VOL%2012%20AMBROZIK%202.pdf (accessed on 24 February 2023).
  31. Michalecki, M. Badanie Procesu Wydzielania Ciepła w Dwusuwowym Wysokoprężnym Silniku Na Podstawie Wykresu Indykatorowego; Mechanika, V., Ed.; Zeszyty Naukowe Politechniki Gdańskiej: Gdańsk, Poland, 1973. [Google Scholar]
  32. Staś, M.J.; Wajand, J.A. Niektóre problemy analizy oraz interpretacji wykresu przebiegu wydzielania ciepła w silnikach z zapłonem samoczynnym i wtryskiem bezpośrednim. In Silniki Spalinowe; Polskie Towarzystwo Silników Spalinowych: Poznań, Poland, 1973. [Google Scholar]
  33. Staś, M.J. Preparation of diesel engine indicator diagrams for cycle calculations. In Journal of KONES Powertrain and Transport; Conference Materials; Journal of KONES: Warszawa, Poland, 1999. [Google Scholar]
  34. Teisseyre, A. Obliczanie przebiegu spalania w silniku wysokoprężnym na podstawie wykresu indykatorowego. In Silniki Spalinowe; Polskie Towarzystwo Silników Spalinowych: Poznań, Poland, 1973; Nr 1. [Google Scholar]
  35. Witkowski, K. Wykorzystanie Analizy Charakterystyk Wydzielania Ciepła do Oceny Stanu Technicznego Aparatury Wtryskowej Silnika Okrętowego; Rozprawy nr. 490; Wydawnictwo Politechniki Poznańskiej: Poznań, Poland, 2013; ISBN 978-83-7775-247-0. ISSN 0551-6528. [Google Scholar]
  36. Witkowski, K.; Wysocki, J. The possibilities to effectively of detecting failures and defects in the injection system of a marine diesel engine. SAE Int. J. Engines 2020, 1, 10. [Google Scholar] [CrossRef]
  37. Ambrozik, A. Wybrane Zagadnienia Procesów Cieplnych w Tłokowych Silnikach Spalinowych; Wydawnictwo Politechniki Świętokrzyskiej: Kielce, Poland, 2003; ISSN 0239-4979. [Google Scholar]
  38. Heywood, J.B. Internal Combustion Engine Fundamentals; McGraw–Hill Company: Haymarket, NSW, Australia, 1988. [Google Scholar]
  39. Klein, M. A Specific Heat Ratio Model and Compression Ratio Estimation; Department of Electrical Engineering, Linköping University: Linköping, Sweden, 2003; ISBN 91-7373-992-8. ISSN 0280-7971. LiU-TEK-LIC-2004:33. [Google Scholar]
  40. Klein, M. Single–Zone Cylinder Pressure Modeling and Estimation for Heat Release Analysis of SI Engines; Department of Electrical Engineering, Linköping University: Linköping, Sweden, 2007; ISBN 978-91–85831–12–8. ISSN 0345–7524. [Google Scholar]
  41. Sikora, M.; Orliński, P.; Bednarski, M.; Wojs, M. Evaluation of the heat release rate in the combustion chamber of the self–ignition engine powered by sunflower methyl esters. In Zeszyty Naukowe Instytutu Pojazdów; Instytut Pojazdów Politechniki Warszawskiej: Warszawa, Poland, 2018; Volume 1, pp. 27–34. Available online: https://repo.pw.edu.pl/info/article/WUT84cf98270c864ddba79a5deaa0d0558e/ (accessed on 20 November 2022).
  42. Kriger, R.B.; Borman, G.L. The Computation of Apparent Heat Release for Internal Combustion Engines; ASME Paper 66-WA/DGP-4; ASME: New York, NY, USA, 1966. [Google Scholar]
Figure 1. The arrangement of cylinder pressure sensors in the engine head for experimental tests. p1: sensor mounted in a special adapter between the indicator valve and the connecting channel; p2: pressure sensor mounted after the indicator valve; p3: pressure sensor mounted in the prepared mounting hole of the cylinder liner flange; 1: indicator valve; 2: start valve; 3: head safety valve; 4: cylinder connecting channel; 5: measurement channel; 6: cylinder head; 7: injection valve; 8: combustion chamber.
Energies 16 06240 g001
Figure 2. Installation site of the pressure sensor in the cylinder liner. p3: place of installation of the pressure sensor.
Energies 16 06240 g002
Figure 3. Installation locations and dimensions of the pressure sensor mounting hole.
Energies 16 06240 g003
Figure 4. Indicator diagram recorded at three different locations in an engine cylinder with the engine operating at 75% MCR. TDC: piston top dead center; p1: pressure sensor mounted in a special adapter between the indicator valve and the connecting channel; p2: pressure sensor mounted after the indicator valve; p3: pressure sensor mounted in the prepared mounting hole of the cylinder liner flange.
Energies 16 06240 g004
Figure 5. Characteristics of heat-release characteristics, Qn and q, recorded at three different places in an engine cylinder operating without damage at a load of 75% MCR. TDC: piston top dead center; q1 and Qn1: sensor mounted in a special adapter between the indicator valve and the connecting channel; q2 and Qn2: sensor mounted after the indicator valve; q3 and Qn3: sensor mounted in the prepared mounting hole of the cylinder liner flange.
Energies 16 06240 g005
Figure 6. Characteristics of heat-release characteristics, Qn and q, recorded without measuring channels from an engine operating with damage to the injection system and a load of 75% MCR.
Energies 16 06240 g006
Table 1. Values of indicated parameters recorded in three different places in one cylinder of an engine operating without damage at a load of 75% MCR, where MIP—mean indicated pressure, pmax—maximum combustion pressure, αpmax—the angle of occurence pmax after TDC.
Indicated Parametersp1p2p3
MIP (MPa)0.790.810.79
pmax (MPa)8.188.537.96
αpmax (° CA)16.518.013.5
Table 2. Values of selected parameters of the heat-release characteristics of an engine operating without and with damage to the fuel injection system, charge exchange, and PRC system with a 75% MCR.
12345678
Selected ParametersEngine Running Without DamageLeakage of the Injection PumpDifference (Column 2–Column 3)Dirty Compressor Air FilterDifference (Column 2–Column 5)Combustion Chamber LeakageDifference (Column 2–Column 7)
q m a x 72.4755.7816.6964.018.4666.595.88
α q m a x 193.50197.00−3.50194.00−0.50195.50−2.00
q T D C 4.1323.8816.2534.265.8735.085.05
Q n m a x 54.4441.5812.8652.162.2852.212.23
α Q n m a x 323.50323.500.00323.000.50322.001.50
Q n 200 ° 21.9013.408.5019.642.2620.691.21
Disclaimer/Publisher’s Note: The statements, opinions and data contained in all publications are solely those of the individual author(s) and contributor(s) and not of MDPI and/or the editor(s). MDPI and/or the editor(s) disclaim responsibility for any injury to people or property resulting from any ideas, methods, instructions or products referred to in the content.

