Article

Untapping Industrial Flexibility via Waste Heat-Driven Pumped Thermal Energy Storage Systems

by
Stefano Barberis
*,
Simone Maccarini
,
Syed Safeer Mehdi Shamsi
and
Alberto Traverso
*
Thermochemical Power Group, Department of Mechanical Engineering, University of Genova, 16145 Genoa, Italy
*
Authors to whom correspondence should be addressed.
Energies 2023, 16(17), 6249; https://doi.org/10.3390/en16176249
Submission received: 7 June 2023 / Revised: 21 August 2023 / Accepted: 24 August 2023 / Published: 28 August 2023

Abstract

:
Pumped thermal energy storage (PTES) is a promising long-duration energy storage technology. Nevertheless, PTES shows intermediate round-trip efficiency (RTE—0.5 ÷ 0.7) and significant CAPEX. sCO2 heat pumps and power cycles could reduce PTES CAPEX, particularly via reversible and flexible machines. Furthermore, the possibility to exploit freely available heat sources (such as waste heat and/or CSP inputs) could increase RTE, making the system capable of an apparent RTE > 100% as well as reducing CAPEX, avoiding the need for two TES systems. This paper analyses the potential valorization of industrial waste heat (WH) to enhance PTES thermodynamic performance as well as increase industrial energy efficiency, valorizing different levels of WH sources in the 100–400 °C temperature range. In fact, the use of additional heat, otherwise dumped into ambient surroundings, may contribute to avoiding the need for a second TES, thus enhancing plant competitiveness. Starting from an assessment of the most relevant industrial sectors to apply the proposed solution (looking at available WH and electric flexibility needed), this paper analyses the feasibility of a specific sCO2-based PTES case study, where the cycle is integrated into a cement production plant with a WH temperature of around 350 °C. It is demonstrated that the CAPEX of the proposed systems are still relevant and only a robust exploitation of the PTES in the ancillary service market could attract industrial customers’ interest in sCO2 PTES.

1. Introduction

Recently, in April and May 2023, negative or zero hourly prices were registered in most of the European electricity markets (with record high negative price in Denmark, especially during the weekend) [1].
This negative pricing phenomenon is driven by two principal factors. (i) Increased renewable (RES) plant generation such as wind, solar, or hydro produces a large quantity of electricity that exceeds demand and cannot be stored for later use. In such cases, producers may offer negative prices to incentivize wholesale consumers to take the surplus electricity off the grid and avoid overloading the system. With nowhere for excess clean energy supply to go, these resources are typically curtailed, which wastes clean energy, cuts revenues for energy providers, and increases carbon emissions. (ii) Transmission congestion: transmission lines are essentially tolled highways for electricity. When lines are congested (e.g., to increase RES plant production), the toll increases. When there is too much supply but not enough demand in a given region, the location marginal price (LMP), which refers to market pricing at a given transaction point (or “node”) on the grid become negative. This creates financial challenges to generators and transmission operators as it means that they effectively have to pay customers to take their power. This can drive LMP into negative territory for generators wishing to transmit the electricity they generate across a congested transmission line.
According to all these aspects, the development of large-scale long-duration (>8 h) energy storage (LDES) technologies will play a crucial role in clean energy future [2] to target weekly/seasonal energy storage and the shifting of RES production as well as to provide the flexibility needed on the grid. For all above mentioned purposes, power-to-heat-to-power solutions based on turbomachinery and thermal energy storages (also known as Carnot batteries [3]) can be a promising long-duration energy storage (LDES) technology offering large energy and power storage capacity, large storage cyclability, rapid response time, no dependency on geographical location (as pumped hydro storage), and durations from 6–12 h up to several weeks providing the flexibility needed for generators and transmission operators [4].
Among Carnot batteries (CB), pumped thermal energy storage (PTES) [5] works by turning electricity into heat using a large-scale heat pump (HP) which lifts up (“pump the heat”) the temperature of heat stored in a “cold TES” into a “hot TES”; the latter is constituted by solid material, molten salts, or phase change materials (PCM) depending on the temperature [6]. When needed, heat is then turned back into electricity using a power cycle based on a closed thermodynamic cycles. The need of different power cycles/TES components and the relatively low round trip efficiency (RTE = 50–70% efficiency, compared to 80–90% for lithium-ion batteries or 70–85% for pumped hydro storage) are the main drawbacks of PTES. The need of a high temperature HP cycle as well as reduction in CAPEX (e.g., via compact and reversible machines) has made sCO2 a promising operating fluid for PTES [7].
The possibility to couple sCO2 HPs and power cycles for bulky energy storage in Carnot batteries, while integrating external heat inputs (e.g., from Concentrated Solar Power–CSP), was recently investigated. This could enable the possibility to increase PTES RTE and reduce CAPEX (e.g., avoiding the need of “cold TES”), valorizing freely available heat sources [8] and also enabling the possibility to offer a “second life” to existing CSP plants which could be penalized on current electricity markets [9].
Another way to face the above-presented scenarios of low cost/negative prices could be tackled via demand–response approaches, particularly leveraging industrial process electrification which has apprehended wide interest [10], partly due to the promotion of high temperature HP in industrial applications [11].

1.1. Research Novelty

Historically, sCO2 has been used as operating fluid in power cycles for several applications, first in nuclear reactors due to its high density and then in other fields like WH recovery, CSP, etc.; sCO2 power cycles are used in several domains on different scales [12]: it is important to note that the temperature and power range of certain already established applications overlap with the aimed PTES operation ranges. Therefore, existing components R and D (e.g., HEX or sCO2 turbomachinery) can be used for the P2H2P applications as well, taking advantage of existing R and D experiences. In terms of sCO2 power cycle applications for energy storage purposes, different experiences took place so far, gathering industrial and academic interest but with few test experiences. The first group of studies were conducted by Swiss researchers and ABB back in 2012 [13,14,15]. The study proposed the idea of integrating heat pump and power cycles for large scale electricity storage. The cycle utilized CO2 in the trans-critical state while using hot water and ice as the hot and cold storage mediums, respectively. German researchers and General Electric [16,17] then looked into the development of large scale sCO2-PTES integrated with the PV field. Targeting the high efficiency of the storage, the study foresaw the use of the MS tank storing heat at 560 °C (using “state of the art technology”) achieved using heat pump up to 480 °C and EH between 480 °C to 560 °C, creating a system named AMSeS, which is particularly effective for long-duration energy storage. The Korea institute of energy research (KIER) [18] contributed significantly to the experimental research on turbine development of the trans-critical and sCO2 power cycle. They developed a test bed investigation with radial and axial sCO2 turbines for small scale power outputs in kW reaching temperature ranges of up to 500 °C.
Looking at RES and/or freely available heat integration to the storage system, Jia et al. [19] modeled a TES unit that, instead of converting RES into pumped heat or electric heat (EH), takes the heat directly from the CSP for charging the storage unit and uses sCO2 as a discharge power cycle, thus already foreseeing “a support” from a “heat free source” to make P2H2P cycles more effective. Similarly, NREL (US), along with University of Cambridge (UK) [20], proposed an optimized sCO2-PTES integrated with CSP while comparing the results with the ideal gas Brayton cycle for power generation purposes. Results showed that sCO2 has higher work ratios than the ideal gases for comparable temperatures thanks to high the volumetric density of sCO2, thus eventually leading to higher round trip efficiencies and low irreversibility. PTES integration with CSP was modeled with a ground thermal storage unit by KTH [21] while UPM [22] assessed that targeting an LCOE of 0.116 €/kWh with 80% efficiency deems sCO2-PTES a strong candidate for future energy storage solutions.
The possibility of exploiting sCO2 power cycles for WHR installations has been widely analyzed [23], including different demonstration projects in the US [24] and EU [25]; at the same time, different researchers are investigating a new role for industries as grid flexibility actors exploiting their clean energy production and the electrification of their processes [26,27] in both the US and EU.
To valorize industrial waste heat, store renewable energy, try to create a synergy between the two, and try to make industries more grid flexible, for the first time the authors of this paper investigated the possibility to develop industrial waste heat-driven PTES with a high RTE potential and presented a techno-economic feasibility assessment of a new technological concept in this paper, preliminarily presented in [28,29]. The goal of this paper is therefore to sum up the results of these two papers, present the impact of different operating parameters at the thermodynamic level (e.g., the minimum pressure and thermal energy storage temperature), and understand the economic viability as well as the benefits of the proposed first of its kind WH-driven PTES system in different industrial sectors.

1.2. Proposed Reference Case Study

To compare the performance of the proposed waste heat (WH)-driven power-to-heat-to-power (P2H2P) system with an existing supercritical carbon dioxide (sCO2) plant system for waste heat-to-power (WH2P) (CO2OLHEAT project [25]), the authors analyzed a case study on a cement plant [30]. The selected cement plant has a daily capacity of 5000 tons, with an exhaust flue gas flow rate of 300,000 Nm3/h at a temperature of 330 °C. Approximately one-third of the exhaust air, known as “quaternary air,” accounts for 116,000 Nm3/h and can be utilized as a WH source, providing a maximum exploitable power of around 10 MWth at 330 °C.
The objective of the study is to investigate a WH-driven P2H2P system where waste heat serves as the heat source for a heat pump cycle and a storage unit acts as a sink. The proposed model consists of (1) a high-temperature heat pump utilizing sCO2 to utilize the available waste heat (charging cycle); (2) a molten-salt (MS) high-temperature thermal energy storage (TES) system to store the heat produced by the heat pump (storage asset); and (3) an sCO2 power cycle that generates power when needed by utilizing the heat stored in the TES (discharging cycle).

1.3. Research Objectives

The study aims to achieve the following goals: (i) to present a new concept of WH-driven PTES and investigate its industrial relevance looking at the WHR potential of different industrial sectors (Section 2); (ii) to propose a methodological approach to evaluate proposed WH-driven PTES systems via typical energy storage performance parameters to be calculated in the most correct way (Section 3); (iii) to present a thermo-economic modeling tool able to determine the operating conditions and design parameters for sCO2 cycles considering the specific test case, while exploring different WH2P sCO2 layouts (with or without a recuperator) (Section 4); (iv) to conduct a sensitivity analysis on sCO2 cycle operating conditions (temperature and pressure) and design parameters to maximize the round trip efficiency (RTE) of the proposed PTES system also (Section 5); and (v) to preliminary evaluate the proposed WH-driven PTES system from an economic point of view (Section 6).

2. Industrial Sectors Assessment for Grid Flexibility

Waste heat recovery (WHR) is a consolidated approach targeting industrial energy efficiency and decarbonization and it is already recognized as the best practice in many different industrial sectors [10,31], particularly to valorize high-temperature waste heat (WH). Nevertheless, as shown in Table 1 related to the EU industrial sector, most of the discharged WH during industrial processes (heat recovery from different heat sources varying sector by sector—e.g., continuous exhaust gases WHR, exothermic reactor/cracker/furnace with periodic operation WHR, and condensate streams WHR…) are qualified as low-grade heat (i.e., <200 °C) which poses several technical challenges for its exploitation towards power production or internal re-use and that opens the possibility to valorize it via high temperature heat pumps [32] with CO2 (in transcritical and supercritical status) as a working fluid which is being sharply investigated for high-temperature HP applications [33].
The electrification of industrial processes is gaining more and more interest in the EU, mostly to make industries more resilient to the volatility of fuel prices as well as to incentivize the self-exploitation of locally available clean energy production (like PV rooftop, CHP, et) by the industrial process itself.
Industrial electrification can be achieved by two methods [34]: direct electrification and indirect electrification. Direct electrification occurs by fully replacing fossil-driven processes producing heat using electric boilers and HPs. Indirect electrification requires the production of electricity-based carriers and fuels, also named e-fuels (e.g., hydrogen), which then can be used in different processes, for example, for burning in boilers or similar.
It is relevant to highlight that promoting industrial clean energy self-production and increasing process electrification would make industries more flexible, being able to offer grid stability services via smart management of local electrified processes, local power production, and the use of locally available storage.
The possibility of valorizing WH via an sCO2 HP for power-to-heat-to-power (P2H2P) purposes has not been investigated so far. Three main facts should be considered: (1) there are more and more fluctuating/non-predictable RES that un-stabilize the grid; (2) the self-generation of power via CHP and RES systems is becoming a best practice in different industrial sectors; and (3) the electrification of the industrial sector is a relevant technological option to reduce fossil fuel consumption in industry. On such a basis, the importance of identifying solutions that could make industries grid flexibility actors, while enabling the valorization and re-use of local WH, is clear. sCO2 could make this possible via WH P2H2P solutions exploiting sCO2 HPs and power cycles. Based on previous thermo-economic analysis of advanced sCO2 power cycles [35] and thermal energy storage for industries [36], in this paper an innovative layout and concept is proposed, aiming at valorizing industrial WH and achieving attractive round-trip efficiency (RTE).
Looking at Table 1 (built from the results of SO WHAT [37] and SCALER [38] EU Funded projects and from [32,36,39]) and matching availability of waste heat and potential electrification processes, it is therefore possible to identify the industrial sectors that could be more suitable to host solutions encouraging both waste heat recovery and the Carnot battery system proposed in this paper. For instance, industrial processes from food industries, pulp and paper industries, chemicals production, and refineries could be relevant to be integrated with WH-driven Carnot battery systems; nevertheless, the low temperature of their WH source and the potential discontinuity of WH could pose technical challenges.
In order to evaluate the proposed storage solution in one of the most favorable sectors, a cement production plant (with a continuous and constant temperature WH process stream) has been considered as a case study in this paper.

3. Exergy Balance to Evaluate Thermally-Assisted PTES

3.1. RTE Conventional “Electrical” Definition

PTES performances are mostly evaluated in terms of electrical RTE (i.e., accounting only for the electrical energy flows E or power P, both during discharge cycle DC and charge cycle CC, and Δ t is the charging and discharging time.
R T E e l = E D C E C C = P D C · Δ t D C P C C · Δ t C C = P D C P C C
In this study, the electrical round trip efficiency (RTE) can be determined based on the total electrical power consumed and produced by the two cycles, rather than relying on total electrical energy values. This approach is possible because the two cycles are designed with the same storage capacity and, consequently, the same mass flow rate of the thermal energy storage (TES) fluid.
Nevertheless, this value cannot represent the inherent efficiency of a power-to-heat-to-power system if a freely available heat input (like solar or waste heat) is included in the cycle, boosting the RTE.
In such a case, exergy can be considered as a consolidated framework for properly accounting for additional energy inputs.

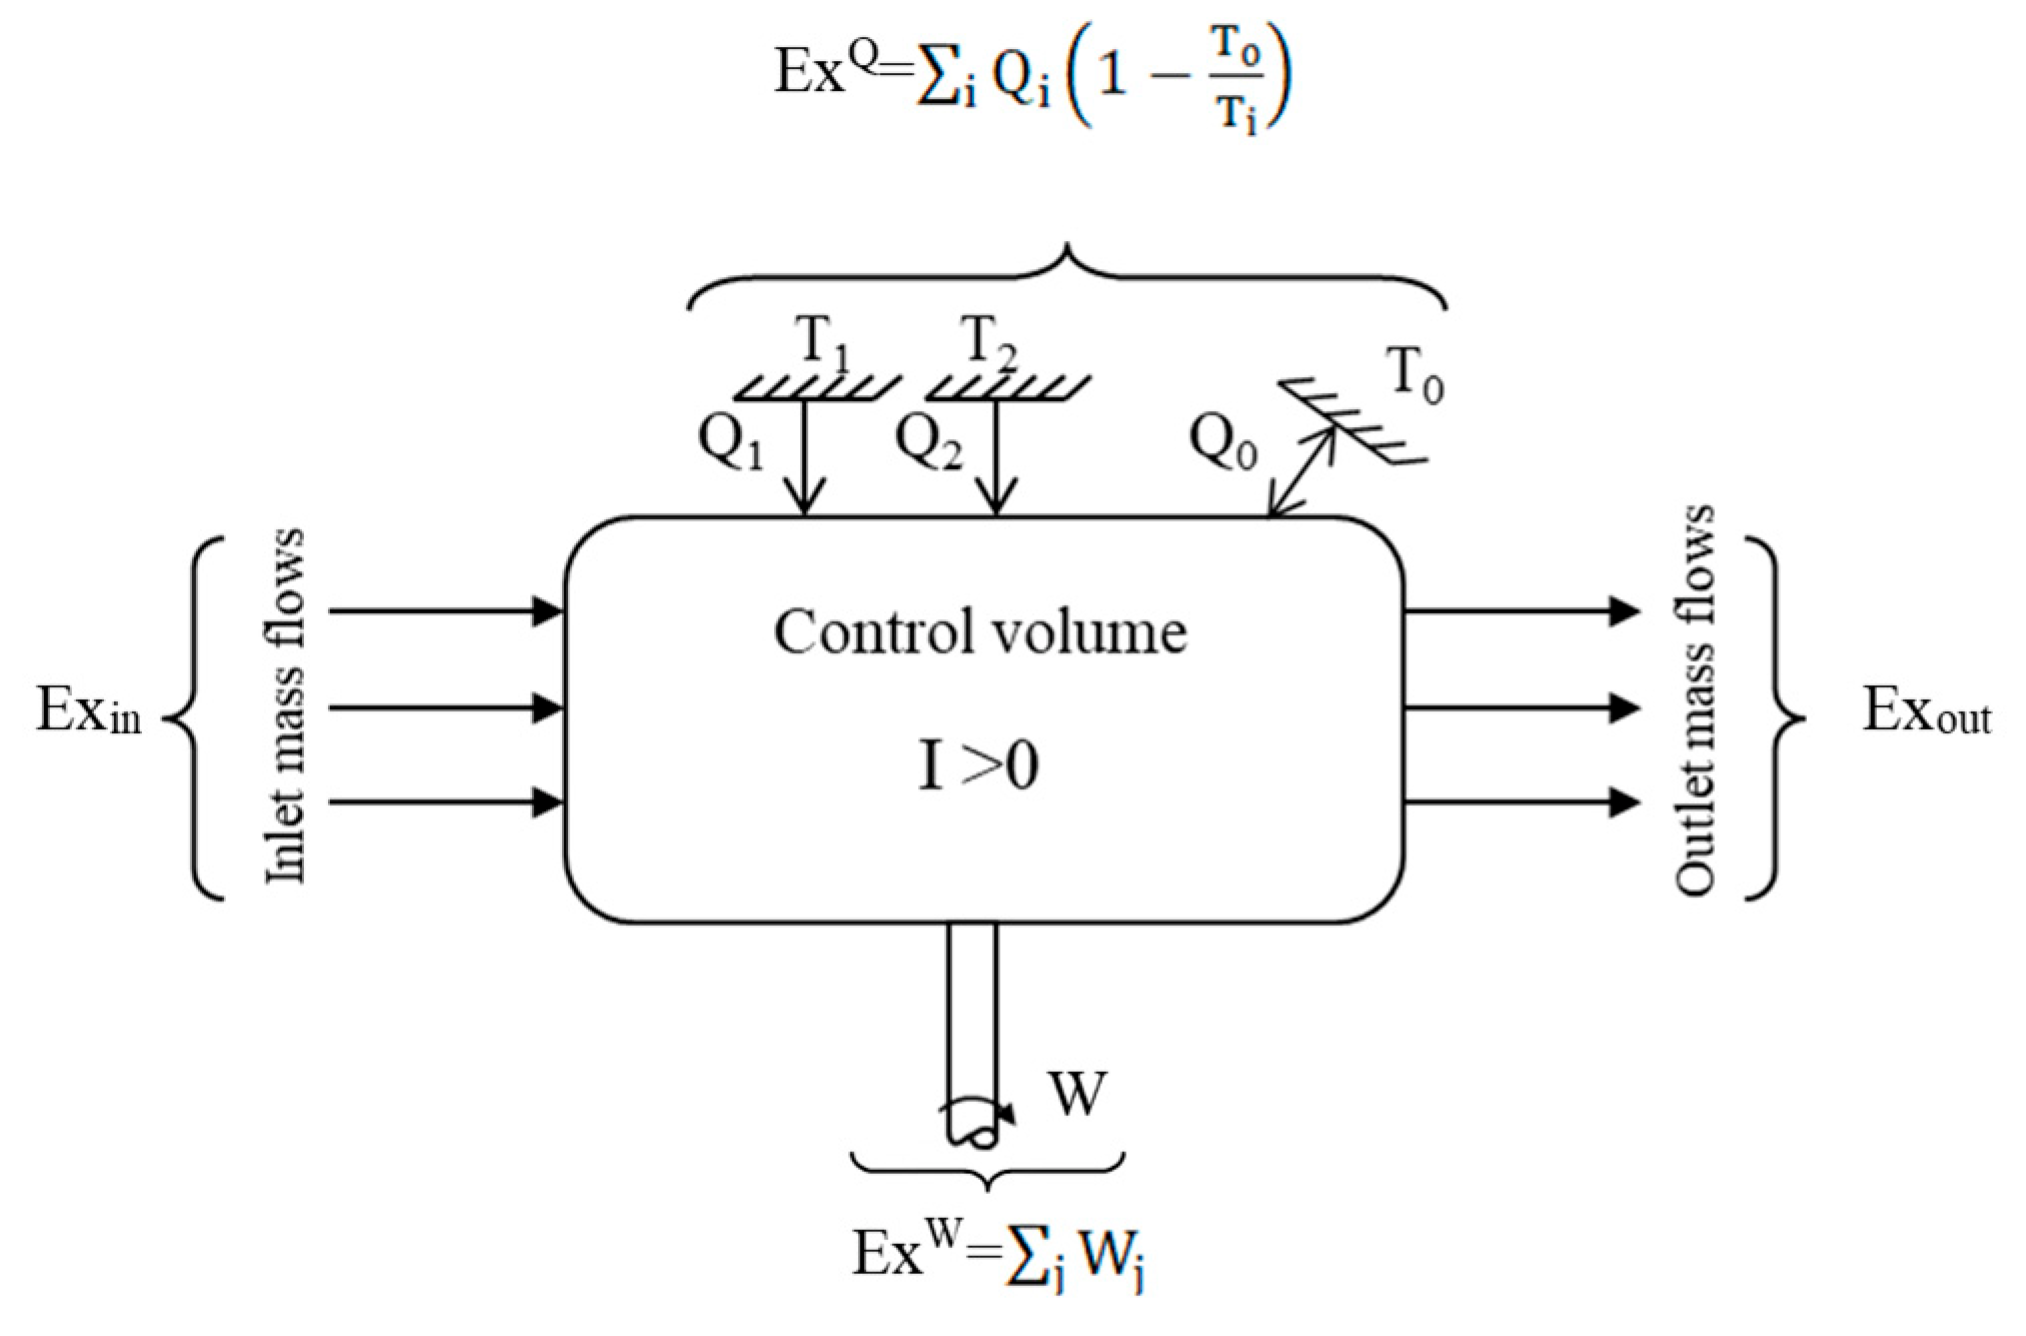
3.2. Exergy Balance of an Open System

For achieving a uniform comparison of RTE among conventional storages as well as hybrid storages, an exergy-based method is proposed.
The most general formulation of the exergy content of a fluid is expressed by [40]:
Ex = Ex kin + Ex pot + Ex ph + Ex ch = m ˙ ε = m ˙ ( ε kin + ε pot + ε ph + ε ch )
where
  • Ex—total exergy flux [W]
  • ε—total specific exergy [J/kg]
  • εkin—=   c 2 2 , kinetic exergy [J/kg]
  • εpot—=gz, gravitational potential exergy [J/kg]
  • εph—=hh0T0(ss0), physical exergy [J/kg]
  • εch—chemical exergy (tabulated) [J/kg]
It is well established that:
  • Exergy is a property of state;
  • Exergy is defined by (i) the system state and (ii) the dead state or ambient state (usually indicated as “0”);
  • Exergy, unlike energy, can be destroyed.
Considering the open system defined by the control volume represented in Figure 1, the following exergy balance may be written at the steady-state (all energy and exergy flows are positive when entering the system):
Exin + ExQ + ExW + Exout = I
where
  • ExinExout—exergy fluxes associated to input/output mass flows [W]
  • ExQ—exergy fluxes associated to thermal fluxes [W]
  • ExW—exergy fluxes associated to work fluxes [W]
  • I—exergy destruction or irreversibility [W]
So, when an external additional thermal source or fuel mass flow is provided, it should be properly accounted for in the denominator of RTE through its exergy content. Therefore, the exergy-based RTE formulation, applicable also to hybrid storage systems such as the one considered in this paper, is:
R T E e x = | E x o u t W | / ( E x i n W + E x i n Q + E x i n )
Notably, that only thermal inputs are considered in the above equation, excluding the possibility of useful thermal outputs, which should be placed in the numerator.

3.3. RTE “Exergetic” Definition

RTEex from Equation (4) can be therefore used for PTES assessment with supplementary thermal input (i.e., accounting for electrical and thermal exergy flows). Considering the actual power flows (P) and the actual waste heat flows (Q) at their entropy-average temperature Tavg (indeed, an explicit logarithm temperature expression could be derived by the analytical integration of ExQ when specific heat can be considered constant), the following expressions are used in this paper:
R T E e x = P D C P C C + Q W H · 1 T 0 T a v g
T a v g = i n o u t T d s s o u t s i n h o u t h i n s o u t s i n ;       i f   p c o n s t .
To calculate the exergetic RTE, i.e., RTEex, the actual waste heat (WH) input to the cycle must be considered. As the heat exchange does not occur at a constant temperature, the corresponding entropy-averaged temperature is computed using Equation (6).

4. Material and Methods

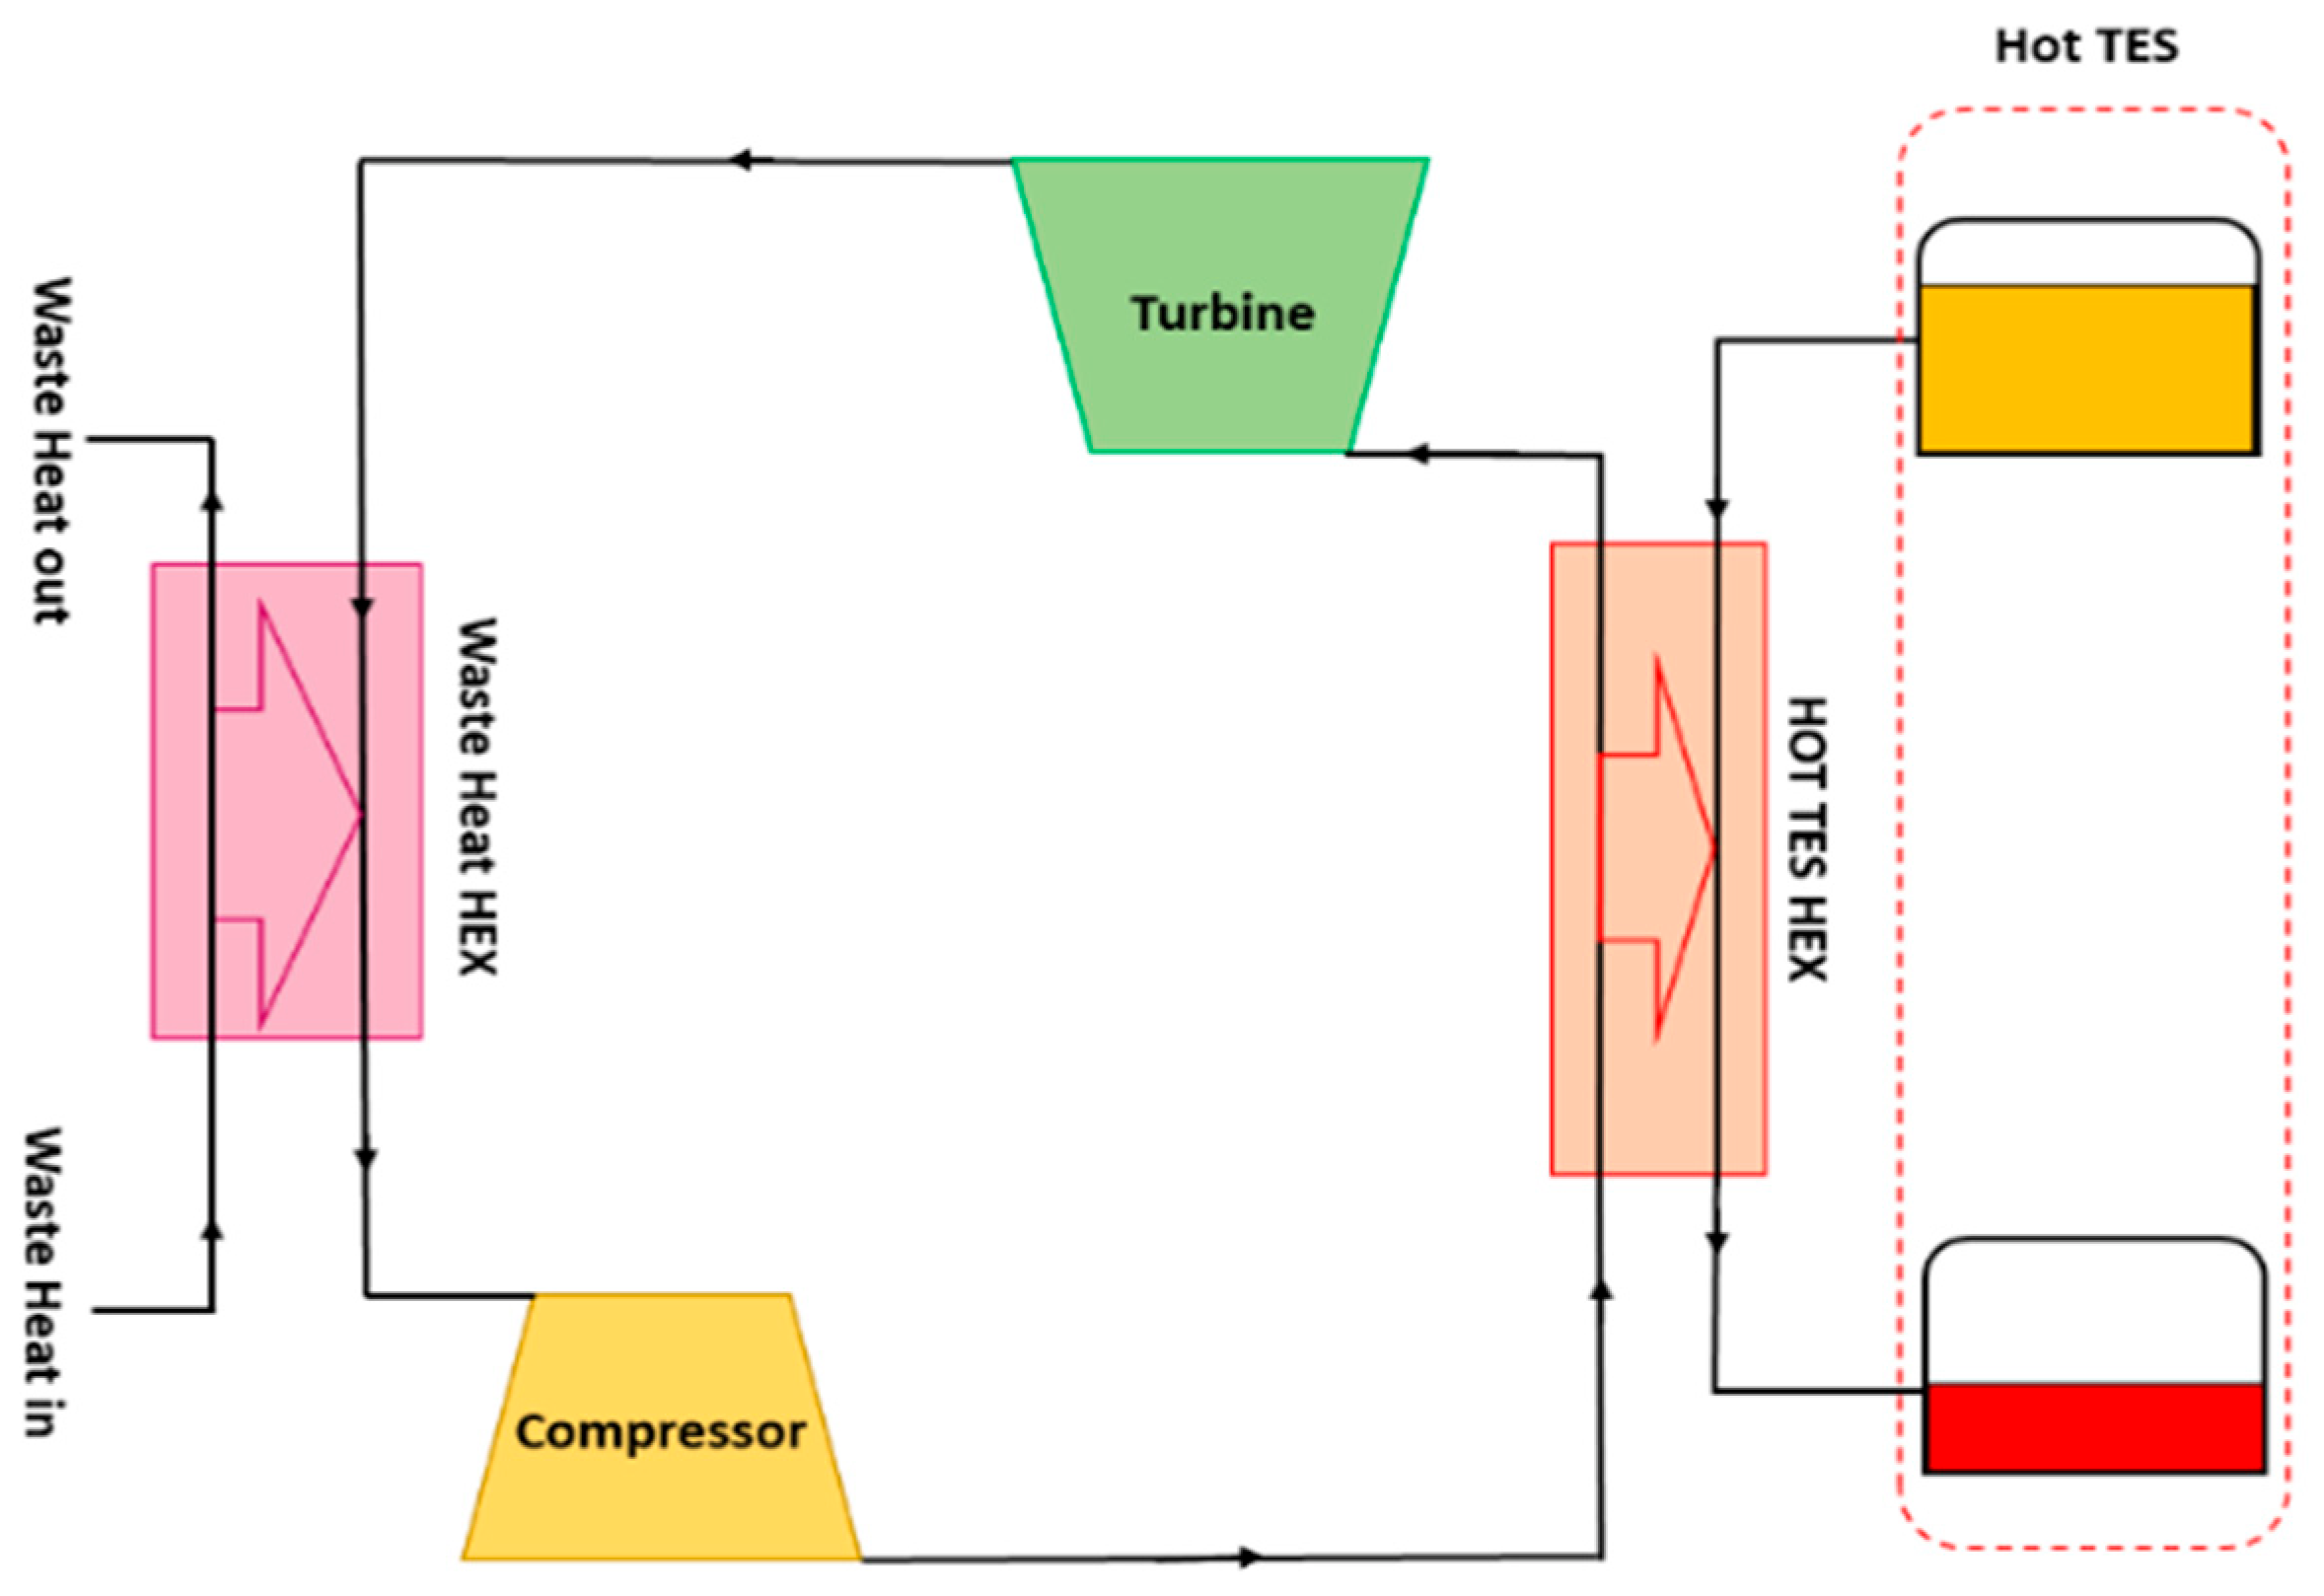
4.1. Proposed Plant Layouts

Figure 2 illustrates the charging cycle which depicts the utilization of heat from the waste heat (WH) source of the cement plant through a heat pump to raise its temperature. The heat is subsequently stored in a commercial molten salt thermal energy storage (TES) system, specifically using HITEC molten salt. The arrows on the heat exchangers indicate the direction of heat transfer. Heat is extracted from the heat exchanger (WH HEX) and transferred to the thermal energy storage heat exchanger (TES HEX) where it is stored in the TES.
During TES charging, the high-temperature effluents from the cement processes are released into the ambient surroundings at significantly lower temperatures, namely in the 150–80 °C range, depending on the operating conditions of the heat pump, thus contributing to process energy efficiency.
The charging cycle is followed by a discharging cycle. Figure 3 presents two different configurations of the discharging cycle that will be examined to identify the most suitable configurations for this case study. In Figure 3a, a simple sCO2 discharging cycle is depicted where the heat stored in the thermal energy storage (TES) is utilized. The sCO2 working fluid is compressed and heated up by the TES heat exchanger (TES HEX). It then enters the sCO2 turbine where it expands and releases the remaining heat in the cooling HEX, closing the cycle. Notably, the cooling HEX in the discharging process operates at a significantly lower temperature than the waste heat (WH) temperature. Such a feature significantly reduces the work required by the compressor, even when employing the same pressure ratios.
Targeting discharging cycle efficiency maximization, a recuperated sCO2 cycle was also considered and analyzed. Thanks to the recuperator, the heat is utilized immediately after the compressor, resulting in improved efficiency of the discharging cycle. The configurations of the discharging cycle were thoroughly examined to identify the optimal performance in terms of the electrical round trip efficiency (RTE).

4.2. Thermodynamic Modeling

The modeling procedure used to define the thermodynamic operating parameters of the cycles is presented in this section. Furthermore, the economic assumptions and approach used for cycle components cost estimation are described.

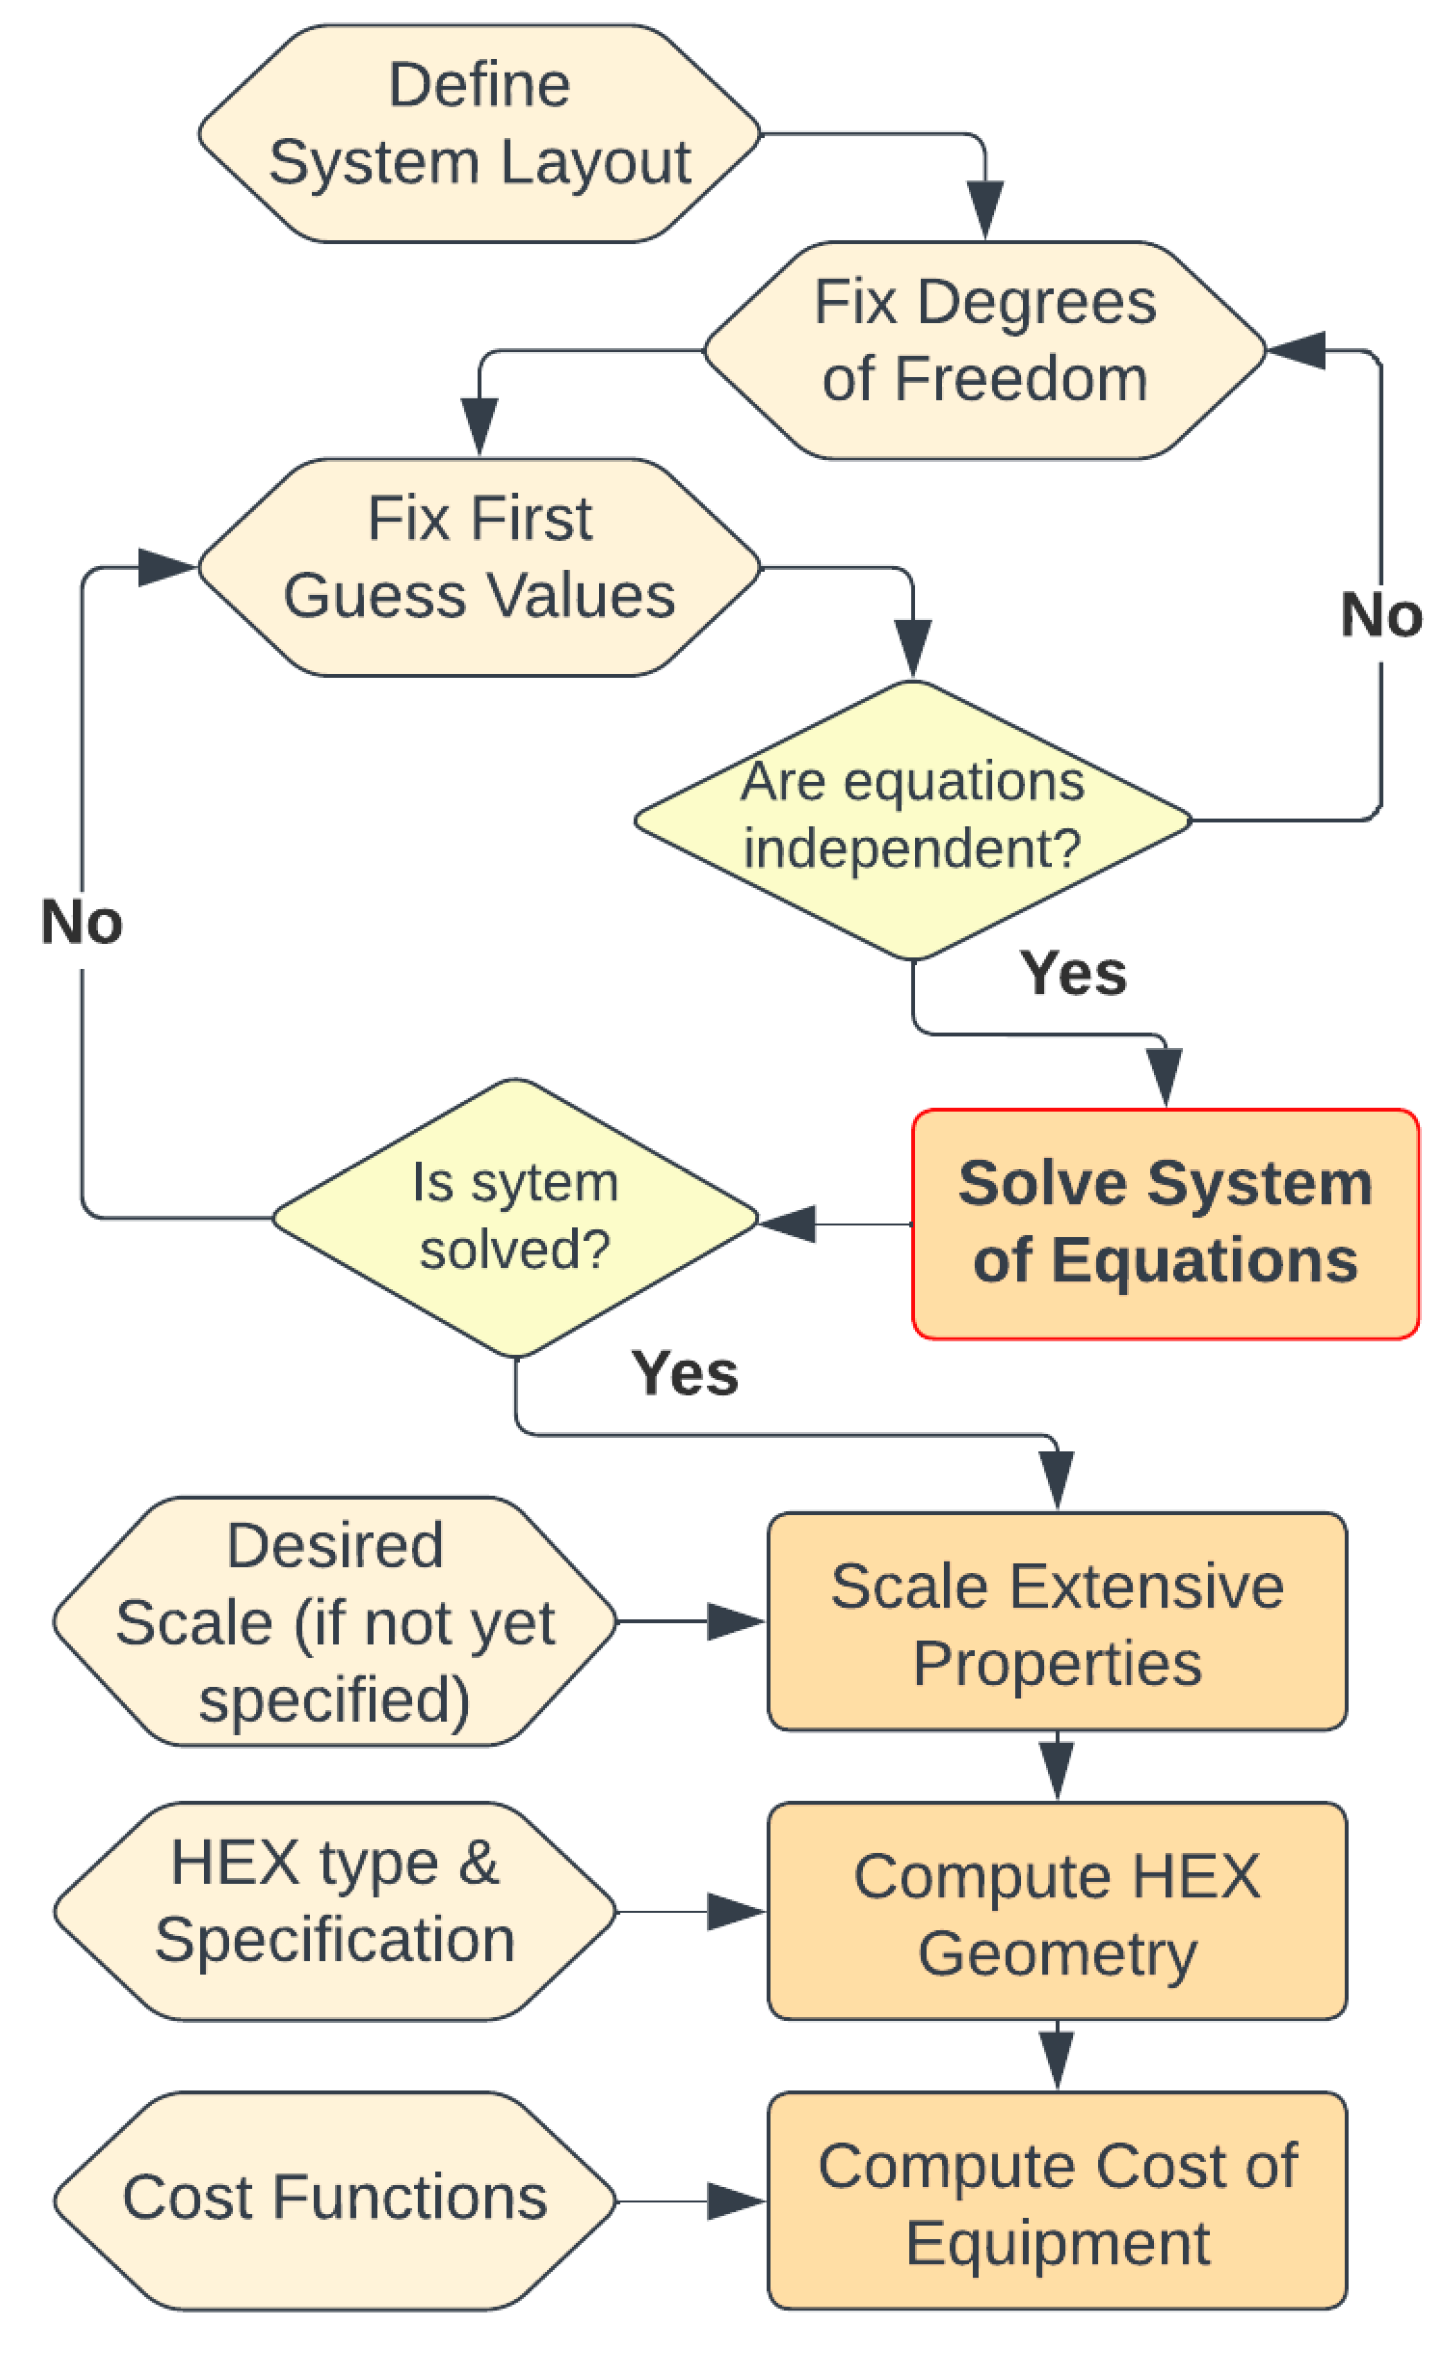
4.2.1. Cycle Modeling Technique and Information Flow

TPG of the University of Genoa developed the WTEMP-EVO software, a component-based in-house thermo-economic simulation tool, which has been properly upgraded to perform the present study. It is developed in MATLAB®, integrating Coolprop [41] libraries for fluid properties, and it can simulate energy systems (operating with different working fluids, both open and closed cycles) assembled by the user, as detailed in [42]. The tool analyses the thermodynamic behavior of each component using simple characteristic equations for mass and energy balances and pressure computation; some of them (compressor, turbine, and HEX) are reported in the following.
p O u t = p I n · β C o m p r
p O u t = p I n 1 Δ p % L o s s
h O u t = h I n + η T u r b · h O u t i s o e n t r h I n
h O u t = h I n + h O u t i s o e n t r h I n η C o m p
ε H E X = Q H E X Q H E X m a x
Q H E X = m ˙ c o l d h O u t c o l d h I n c o l d
where
  • h are enthalpies [kJ/kg]
  • p are pressures [Pa]
  • Q are thermal flows [kW]
  • β C o m p r is compressor pressure ratio [-]
  • ε H E X is heat exchanger effectiveness [-]
  • η C o m p is compressor isentropic efficiency [-]
  • Δ p % L o s s is percentage pressure drop [-]
Among the cycle components, modeling an sCO2 heat exchanger is always a challenging process due to the continuous variation of sCO2 thermo-physical properties with temperature and pressure [43,44]. In this study, the maximum heat that can be exchanged by a heat exchanger ( Q H E X m a x ) is computed as the maximum amount of heat that can be transferred, from the hot to the cold fluid, in a counterflow heat exchanger that has an infinite area, thus leading to a temperature difference between the hot and cold fluid which is equal to zero in a certain point. When the properties of fluids vary within the heat exchanger (as with sCO2), an internal pinch point may occur (Figure 4), particularly when a peak is observed in the specific heat capacity of the hot fluid. By employing the proposed simulation tool, the calculation of the maximum heat enables the identification of the temperature at which the internal pinch point could arise in an ideal counterflow heat exchanger. In such a particular case, the heat value corresponding to this temperature is then assigned as the maximum achievable heat.
After defining the operating points of the desired cycle layout, the corresponding functions for the required components (such as turbomachinery, heat exchangers, etc.) are called by the model to assemble the system. This process leads to the formation of a system of nonlinear equations. Subsequently, certain variables are assigned values based on assumptions, establishing the degrees of freedom for the layout. The system of equations is then numerically solved until convergence is attained.
Upon completing the thermodynamic analysis of the cycle, it becomes feasible to calculate the geometry and cost of the key components, as outlined in [42] and illustrated in Figure 5.

4.2.2. Thermodynamic Modeling Assumptions

Since the proposed PTES systems consist of two distinct and independent cycles, one for charging and one for discharging (not considering reversible machines), the simulation approach proposed by WTEMP-EVO distinctly separates the computation of the two cycles which are connected by imposing the equivalence of the TES temperatures and the amount of energy and mass stored in it.
In practice, the code initially computes the discharging cycle and utilizes the results to initialize the computation of the charging cycle. Specifically, since the discharge layout may involve a recuperated cycle, the minimum temperature of the TES depends on the inlet temperature of the hot heat exchanger (HEX) in the discharging cycle, which, in turn, relies on the effectiveness of the recuperator.
For this specific study, the modeling approach involved separates calculations of the charging and discharging cycles. This was performed to conduct sensitivity analyses on specific parameters identified as highly relevant for each cycle layout like minimum and maximum pressures and the TES material temperature (highest temperature of the cycle).
Considering the available waste heat (WH) temperature, as presented in [29], different commercial TES materials were studied in the range between 400 °C and 600 °C as the maximum temperature. Table 2 reports the main assumptions for the charging and discharging cycles while Table 3 presents the properties of the TES materials investigated [29].
The temperature and pressure levels for the discharging phase were carefully selected to optimize the cycle performance. Subsequently, a corresponding charging cycle was thoroughly examined and chosen. This was made possible by considering the complete decoupling of the charging and discharging cycles, in contrast to a standalone PTES system, owing to the integration with high-temperature waste heat (WH).
In the subsequent paragraphs, performance sensitivity analyses of both the charging and discharging cycles are presented. The aim is to ensure the compatibility and alignment between the two cycles, starting from the discharging phase. Chapter 6 presents specific operating parameters’ (minimum and maximum pressures and TES material temperature: the highest temperature of the cycle) impact on cycle performances.

4.3. Economic Modeling

In order to evaluate the CAPEX of the system, further than TES cost assumptions previously presented and HEX cost functions as presented in [29], typical sCO2 power cycle components (turbine–compressor–recuperator) cost functions were considered here [31], entailing properly correcting them (particularly when studying “hot compressor” and “cold turbines” in HP/CCs) according to the literature “correction factor” approach [45] in order to take into account different materials used to manufacture components in operating conditions that are different than usual ones. Cost functions presented in [46] were therefore multiplied and divided by a correction factor of 2.035 and 1.764, respectively, to evaluate compressor and turbine CAPEX considering different material/operating temperatures when operating in HP CC. Cost of the compressor and turbine depends on the power output. Heat exchanger costs are based on the UA. The UA value was calculated based on counter flows for all the heat exchangers using the log mean temperature difference (LMTD) method. The heat exchanger geometry discretized in 100 parts is solved through the LMTD equation. According to the power requirements, internally geared centrifugal compressors were used for both charging and discharging while axial turbines were used in both cases.
The CAPEX of the overall proposed PTES system is calculated as the sum of the different components present in the plant layout.

5. Analysis of the Impact of Different Operating Parameters on WH-Driven PTES Cycle Performances

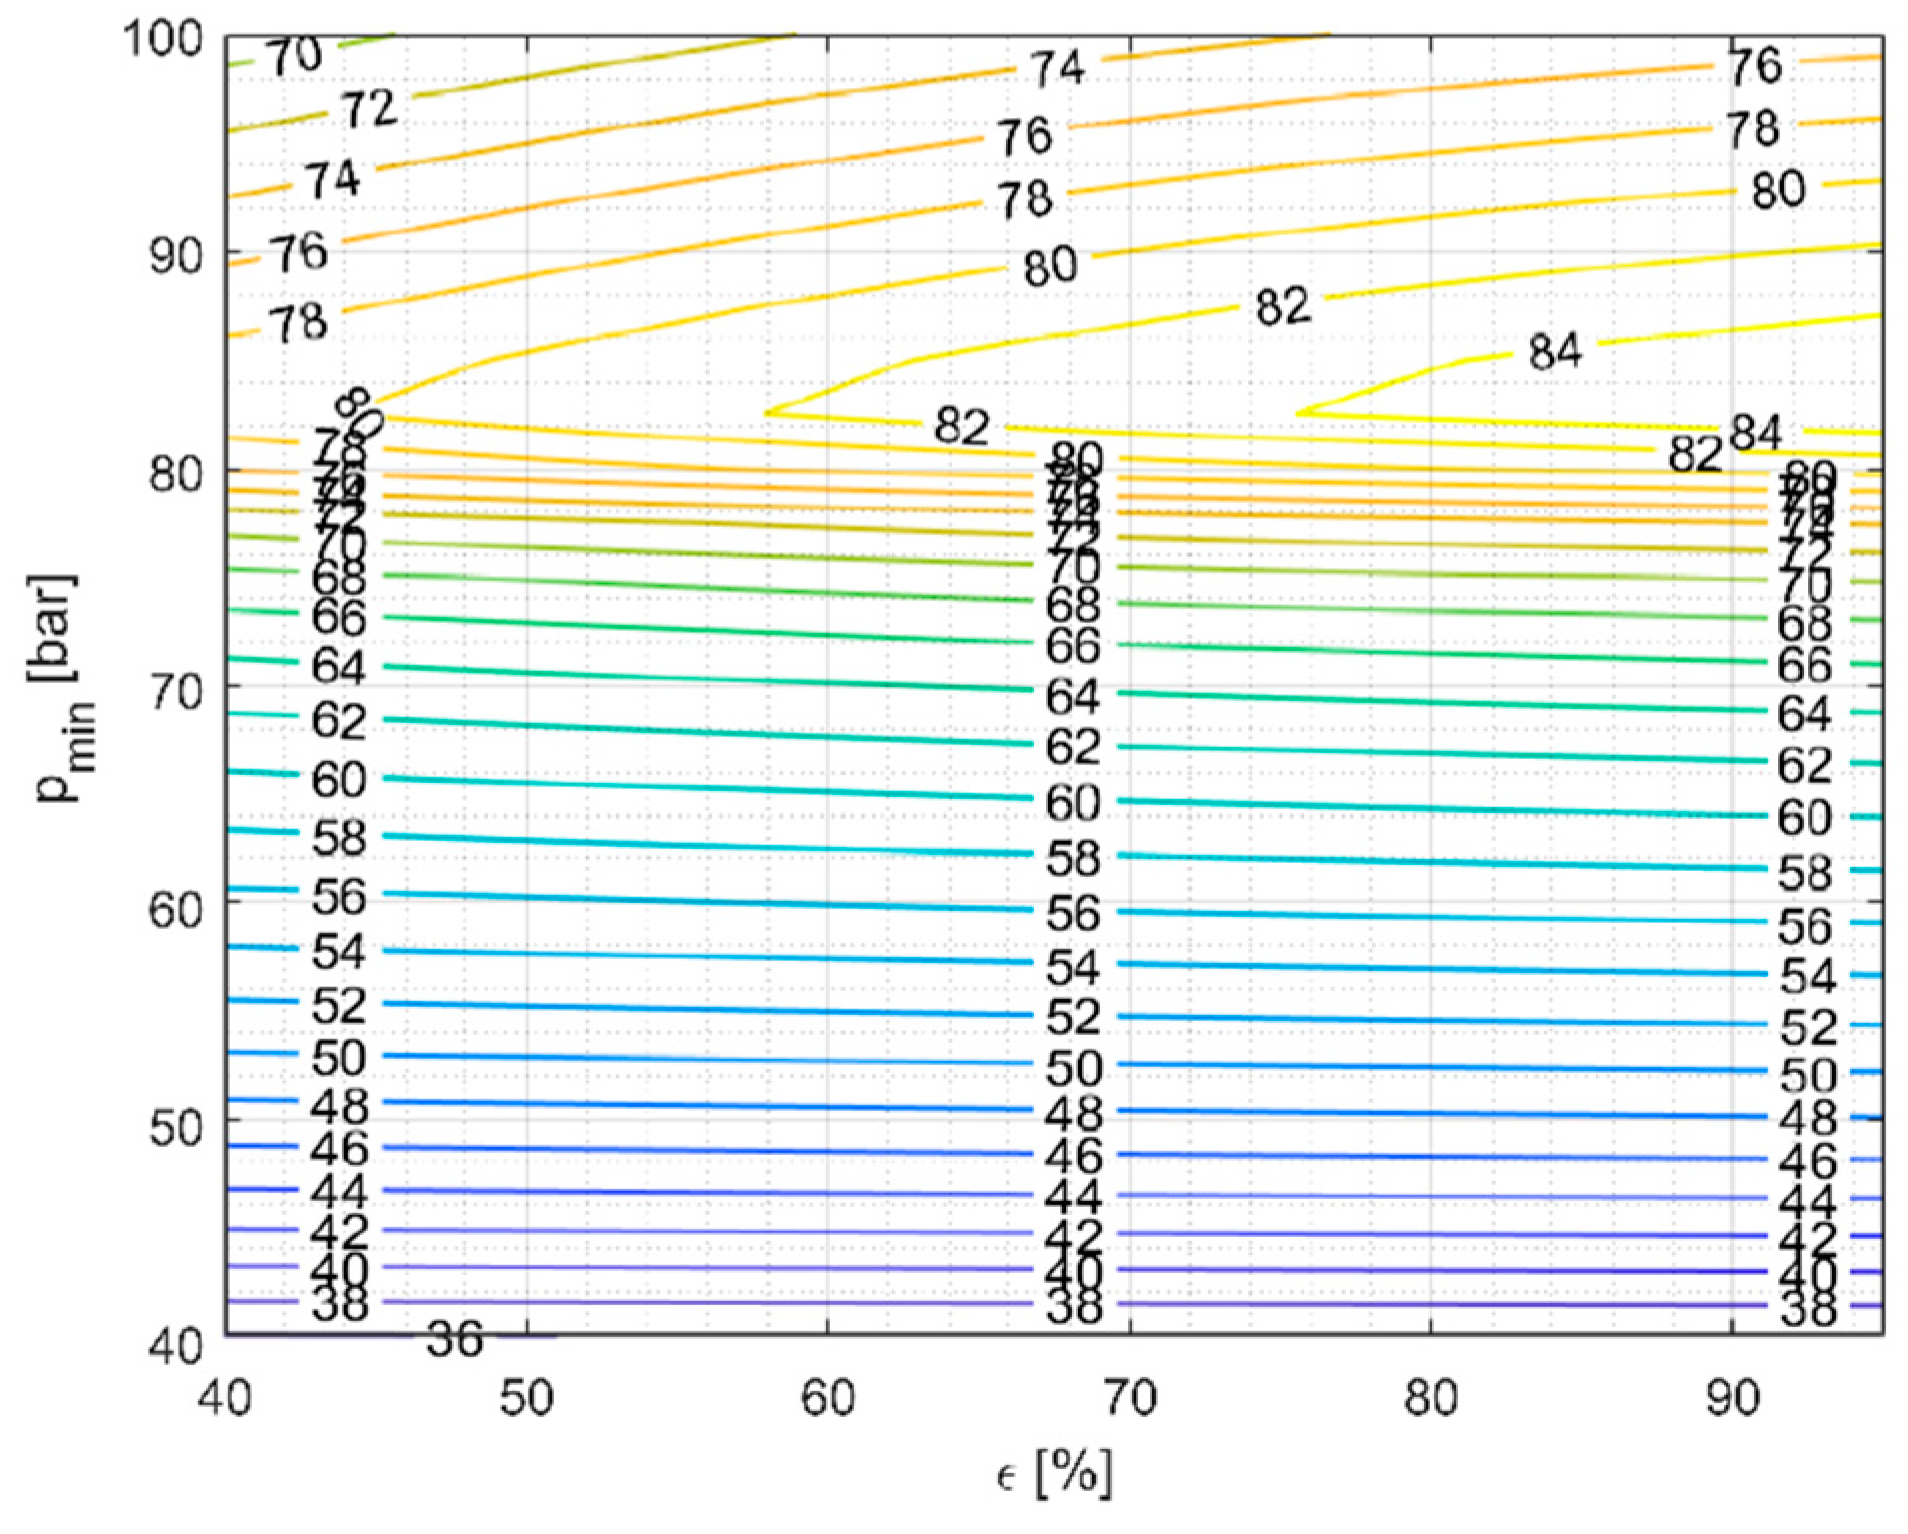
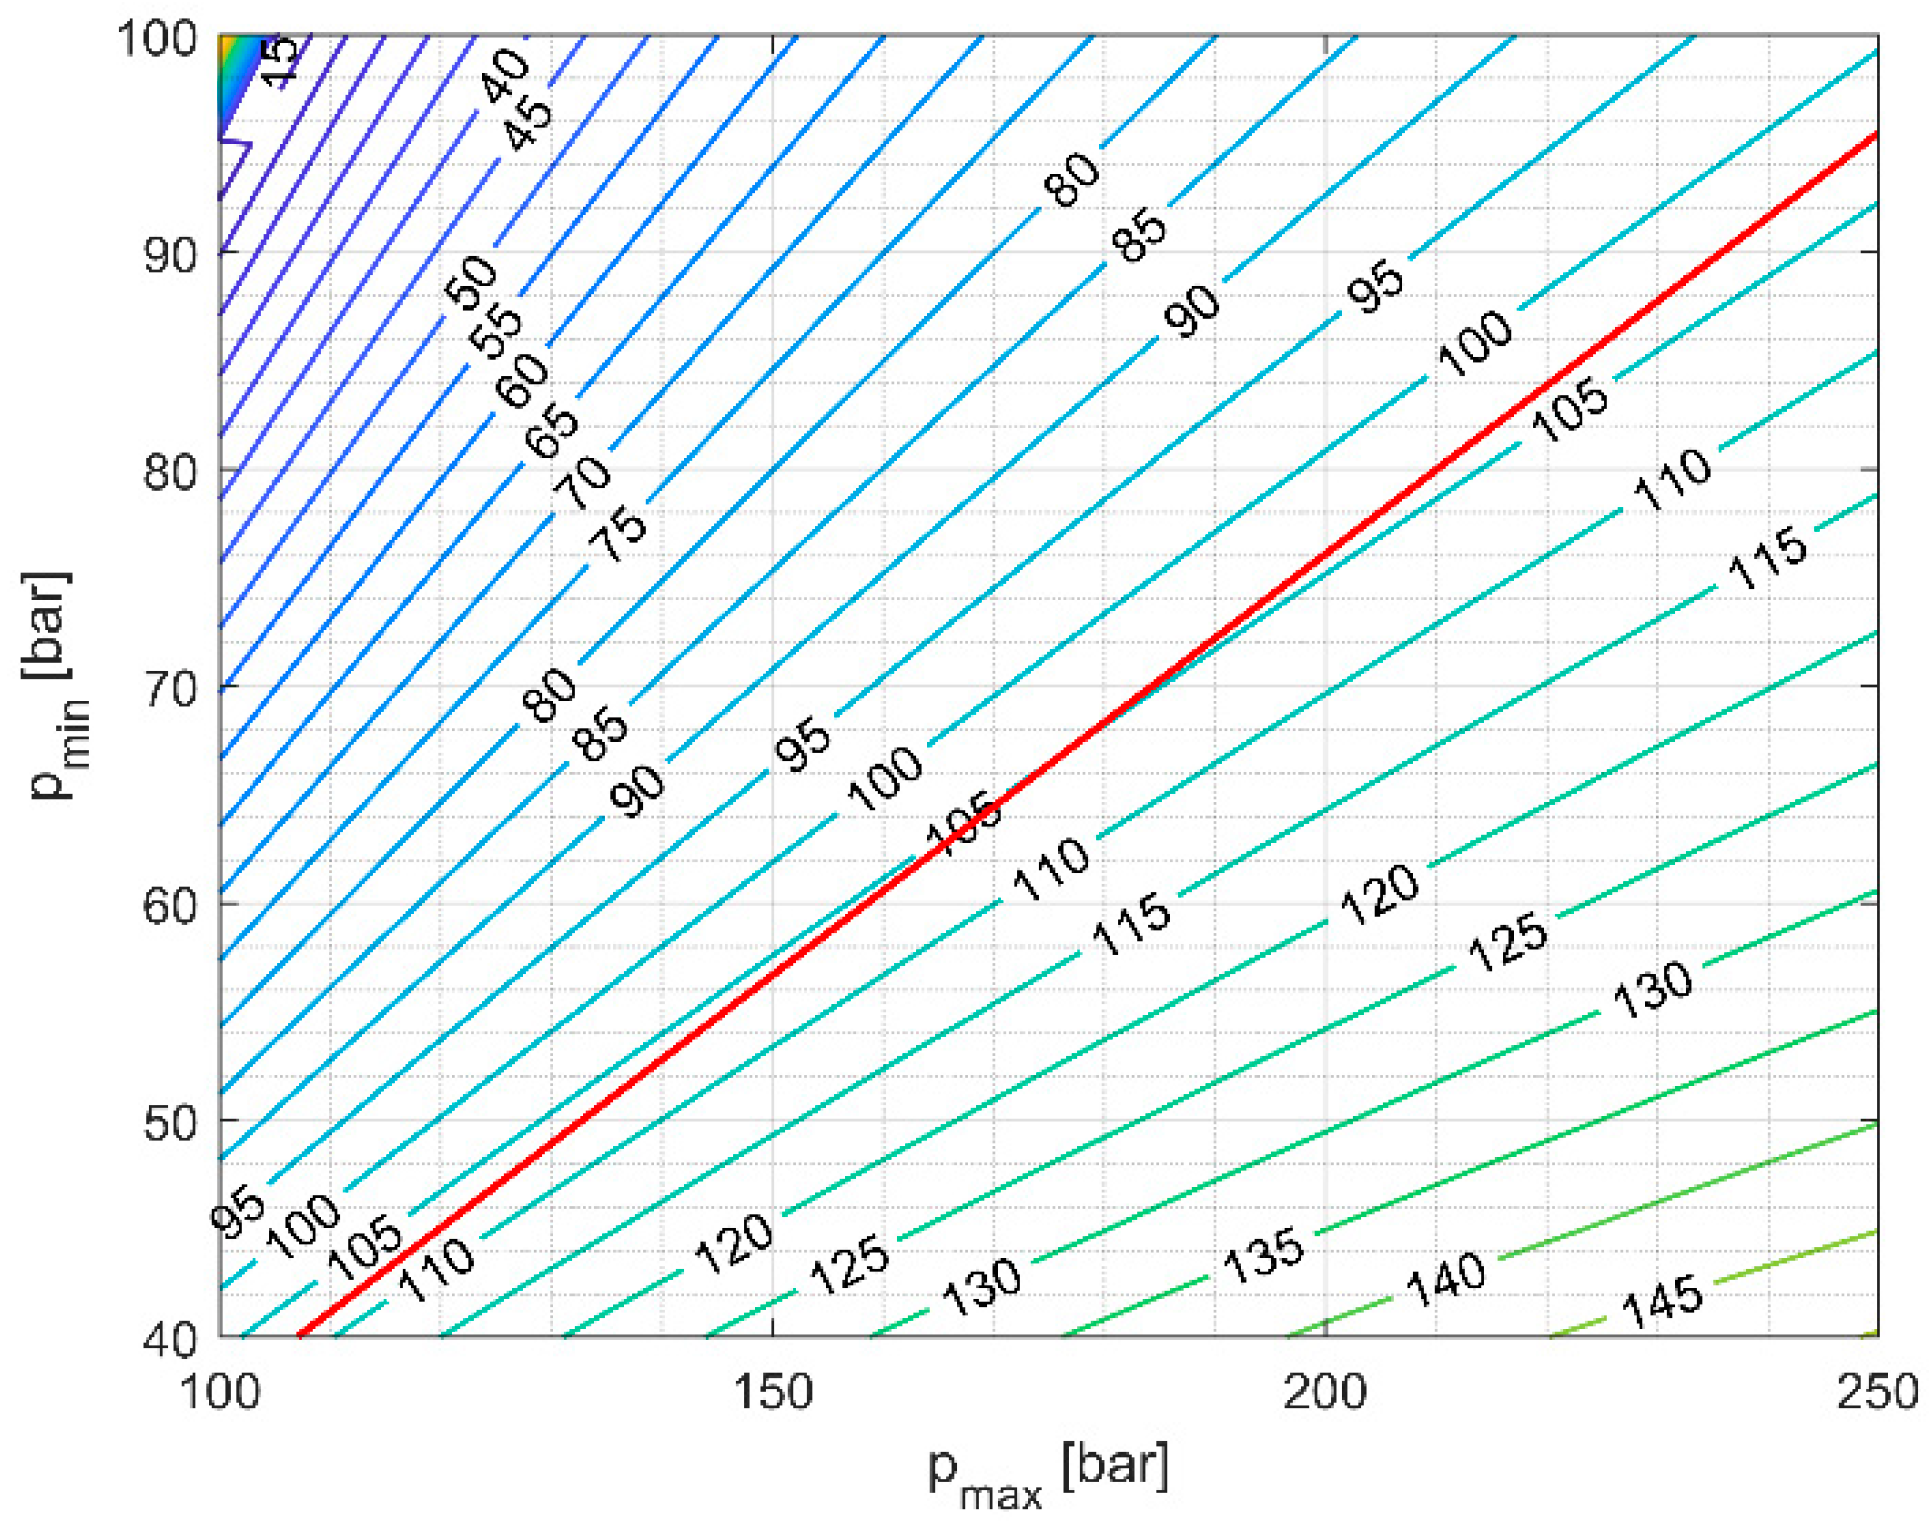
5.1. Operating Pressure of Charging and Discharging Cycles

This sub-chapter presents a recap of the results already presented in [28]. In this case, the above presented PTES cycle was studied starting from an analysis of the discharging cycle with a maximum pressure limit of 250 bar and a TES with a temperature of 450 °C (HITEC XL as the TES media). This value was determined by the authors based on their previous study [35] considering technological factors to ensure manageable compression ratios and the use of pressurized HEXs among other considerations. Additionally, in accordance with the assumptions made, a maximum CO2 temperature of 440 °C and a typical compressor inlet temperature of 35 °C were selected to ensure stable compressor operation.
The objective of the analysis was to identify the conditions that would maximize the electrical round trip efficiency (RTE) by aligning the discharging cycle with the charging cycle. The study showed that the recuperated discharging cycle maximizes efficiency with the best results observed in the range of the 80 to 85 bar minimum pressure. While the cycle efficiency increases with higher recuperator effectiveness, this parameter has a minimal impact on the total power extracted from the TES source given a constant total mass.
To capture the behavior of the recuperated layout, two values of recuperator effectiveness (60% and 80%) were analyzed. From these values, an optimal minimum pressure of 83 bar was selected (Figure 6), ensuring a maximum power output while also guaranteeing proper compressor operation based on the authors’ previous experience [35]. This pressure value falls within the aforementioned range.
During the charging phase, a common performance parameter to monitor is the compressor outlet temperature and related cycle maximum pressure (compressor outlet). While considering the values of other temperatures, only those equal to or higher than 460 °C were taken into account based on the initial assumptions related to the chosen MS TES storage media. In the following Figure 7 and Figure 8, the minimum temperature line is depicted in red, separating the unacceptable values (above) from the valid values (below). The upper region, unacceptable, represents a zone with a pressure ratio that is too close to 1 or even lower, which is unrealistic.
It is evident that the initial assumptions regarding temperature strongly impact the behavior of the charging cycle heat pump, necessitating a sensitivity analysis with different temperature values (as presented in Section 5.2). Furthermore, this behavior is closely tied to the assumptions made about machinery efficiency which affects the performance of the heat pump cycle.
Analyzing Figure 9 depicts the trend of HP net power consumption, it is notable that the power values align closely with the temperature values, similar to the behavior observed for COP. For instance, a temperature value near 460 °C (the lowest acceptable sCO2 temperature) corresponds to a pressure ratio of approximately 2.6, resulting in a COP ranging from 3.7 to 3.9.
This observation is interesting for two reasons. Firstly, from a thermodynamic standpoint, one might expect a higher pressure to be preferred, while a thermo-economic perspective favors lower pressures, particularly for the charging cycle. Secondly, operating at lower pressures can amplify the influence of variations in the thermophysical properties of sCO2, especially its specific heat near the critical point. This could potentially lead to the heat exchangers encountering an internal pinch point at a temperature difference lower than the assumed values at the extremes. Consequently, a more detailed analysis of the heat exchangers would be required, potentially involving the introduction of multiple heat exchanger and TES units that handle different mass flows. Such an approach would allow better matching of the variation in CO2 heat capacity rate and mitigate the impact of the specific heat variation.
All the previous analyses performed on the discharging and corresponding charging cycles brought the identification of the optimal operating points for the higher RTE P2H2P cycle (Figure 10). These operating points were determined based on the initial assumptions presented in [28] and the goal of maximizing the apparent electrical RTE, without taking into account the amount of waste heat (WH) that could be utilized.
Table 4 displays the optimal operating parameters identified for the cycle presented in Figure 10, including the minimum pressures and TES temperature values. It was found that the optimal maximum pressure for both the charging and discharging phases is 250 bar, which is the highest allowable pressure. Results showed in [28] confirm that integrating waste heat (WH) into a PTES allows for achieving higher electrical RTE values compared to a standalone PTES configuration, as expected. However, it should be noted that this comes at the expense of utilizing the freely available heat source, and therefore, the exergetic RTE provides a more comprehensive estimation of the overall energy utilization in the process. Among the investigated solutions in [28], the highly recuperated configuration demonstrates the highest exergetic RTE although its WH input utilization is relatively low

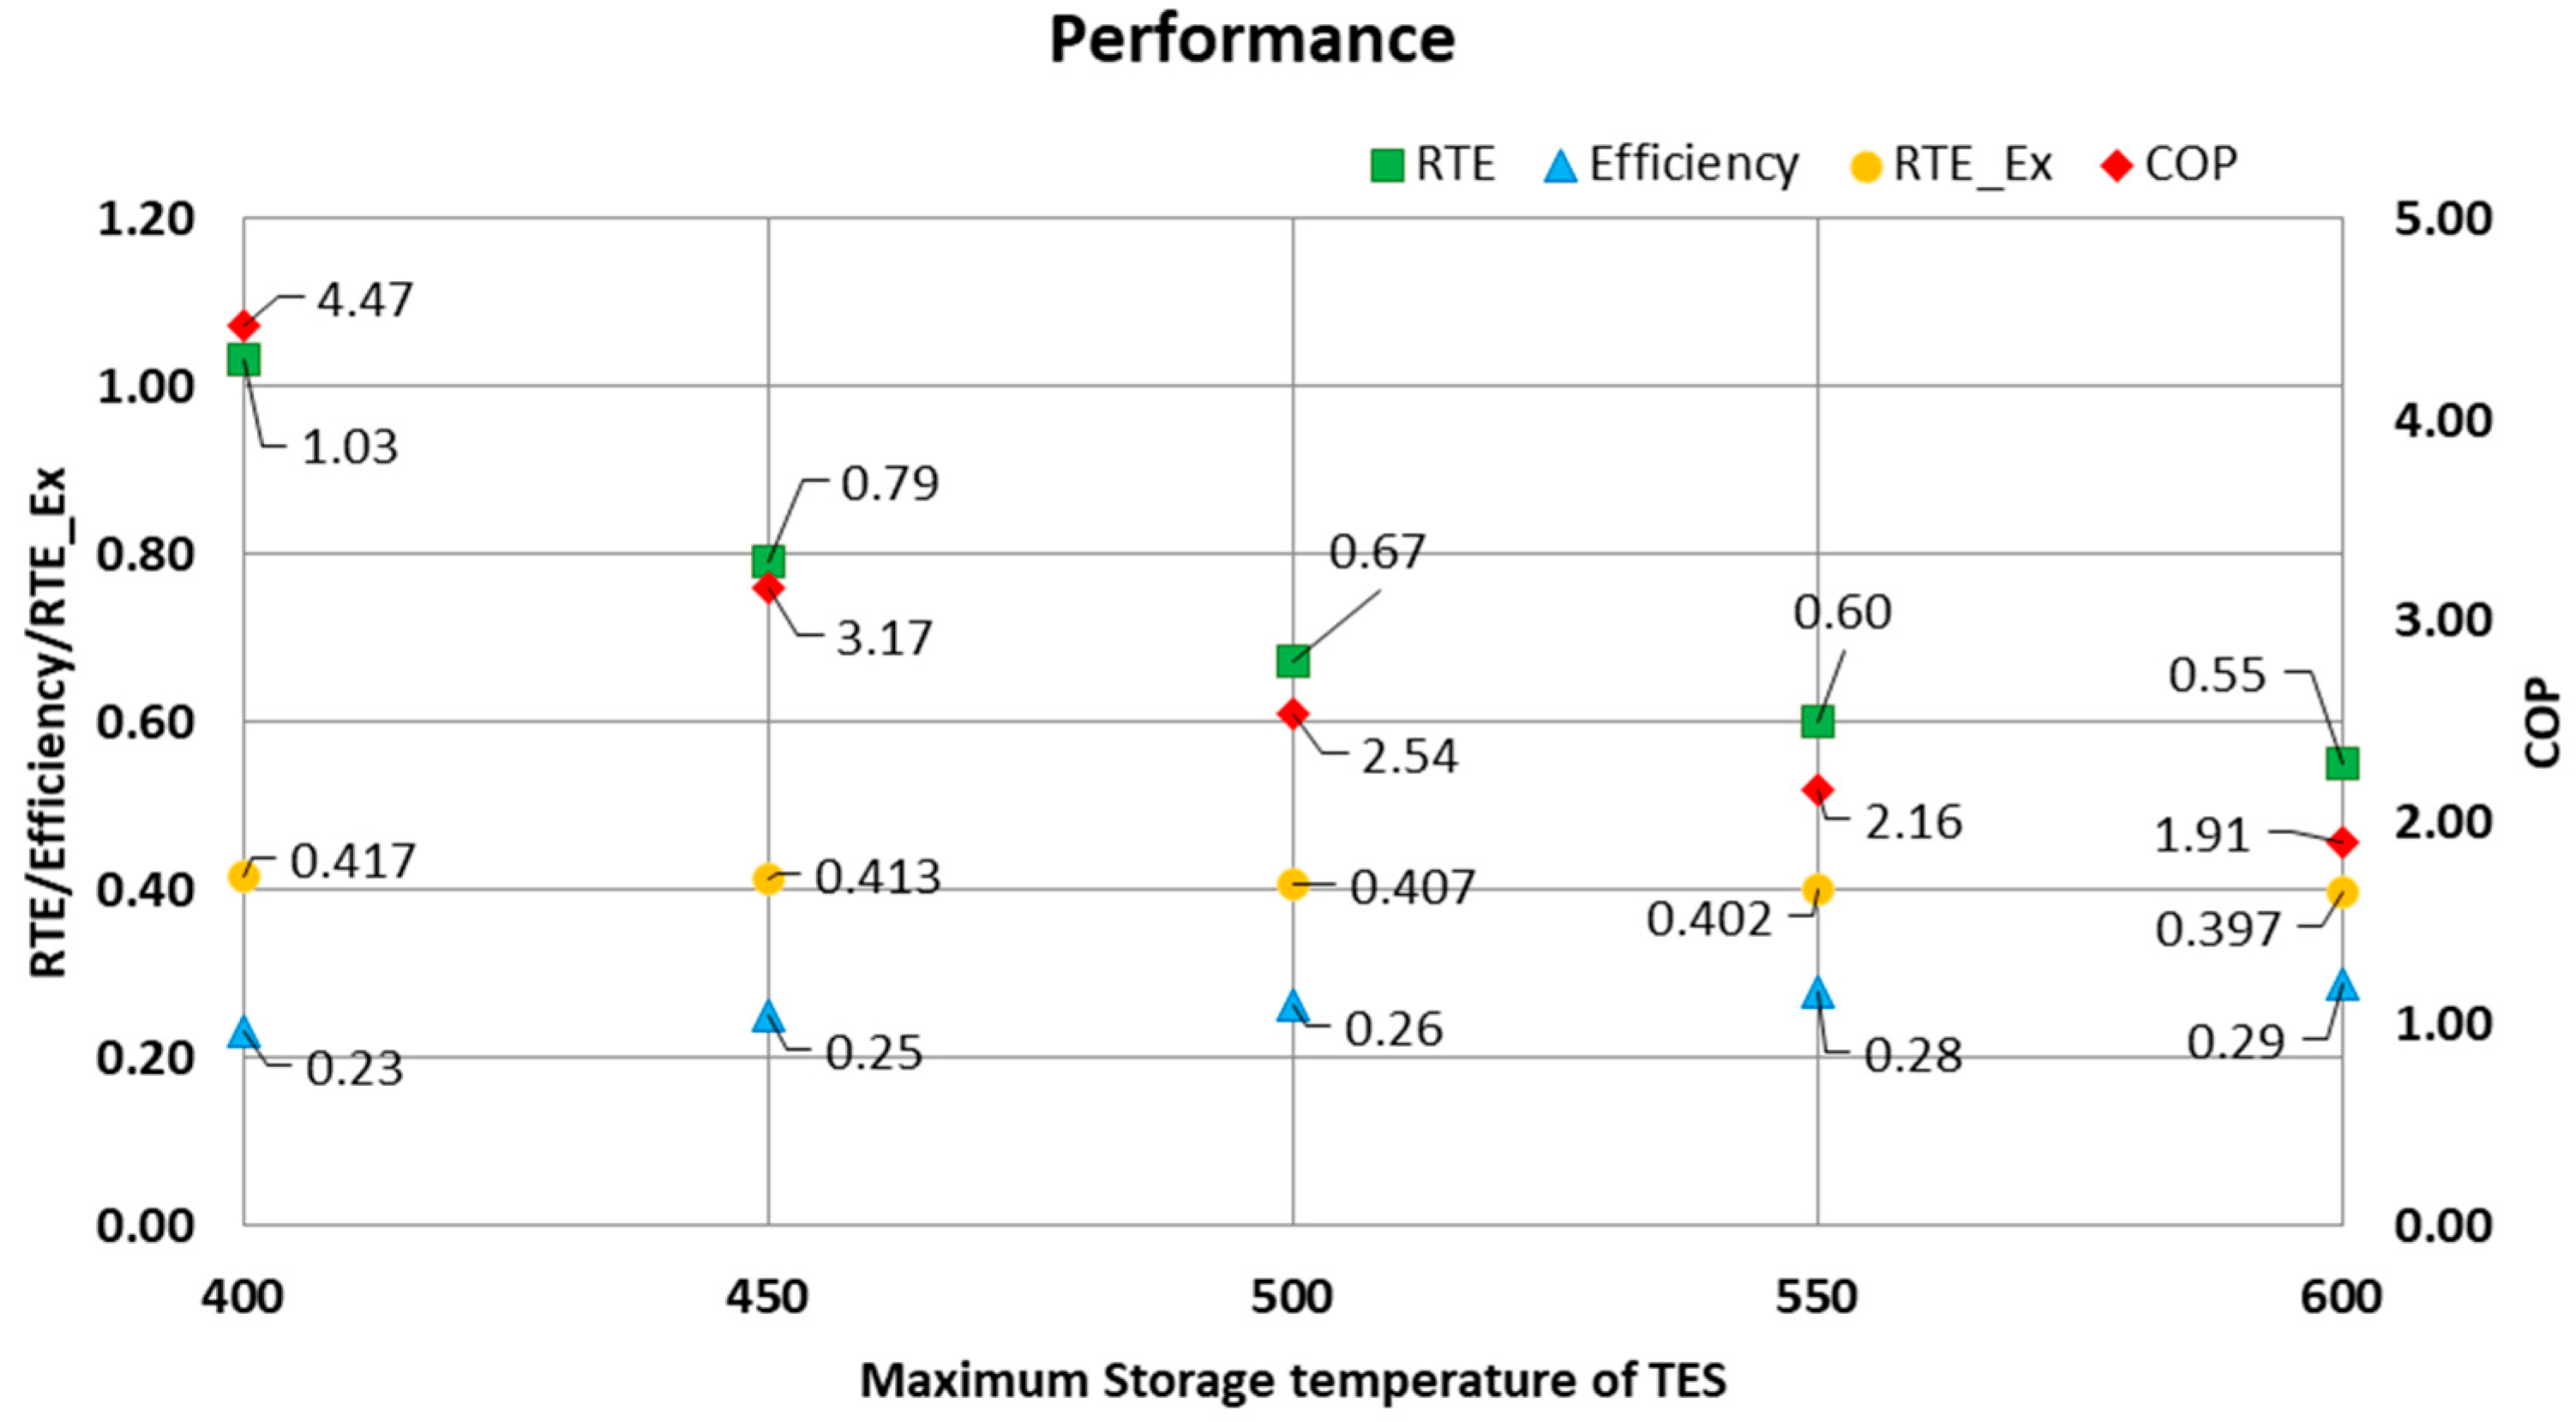
5.2. Impact of TES Temperature

Following the results gathered in [28] where the impact of TTES was identified as a relevant factor not only as the maximum temperature of the charging/discharging cycle but also as constraints for the identification of the operating pressure, in [29] the authors analyzed the impact of TES on proposed PTES cycle performances.
The high pressure side of both the CC and DC are fixed at suitable values where the commercially available heat exchangers can be exploited:; differently than studied in [28] and presented in Section 5.1, high pressure sides higher than 250 bar were considered. This was needed to account for the increasing maximum temperature of the TES: CC indeed relies only on the pressure ratio; increasing the pressure ratio will increase the temperature required to reach the maximum temperature value for a certain storage material. Therefore, fixing the upper side pressure makes much more sense than fixing the lower side pressure for the CC in order to not obtain too great a value of pressures on the high pressure side for certain thermal storage materials.
In the case of DC, the high pressure side as well as the low pressure side is fixed, which is possible in this case because the recuperator as well as the storage temperature can be set defining the recuperated amount of heat, thus acting on the recuperator effectiveness, rather than on the pressure ratio. The lower temperatures of the TES attained through modeling of the DC then sets the pressure ratios of the CC. The DC lower pressure at the inlet of the compressor has been kept at 85 bar, as was found to be appropriate according to the authors’ previous study [28] and as was reported in 5.1.
As CC and DC are independent in terms of operation, the high pressure side of the DC (300 bar) has been purposely kept only slightly above the high pressure side (280 bar) of the CC so to utilize the same heat exchanger during charging and discharging and save capital cost. The cold compressor used in the DC uses much less power than the hot compressor in the CC for similar pressure ratios. As a result of the independence of CC and DC cycles, two benefits can be highlighted: (i) the CC turbine can expand far from the critical point, having higher work values, and (ii) it is possible to increase the expansion ratio of the discharging turbine, increasing the overall performance of the system.
The pressure ratio of the DC is 3.5 for all the cases of TES. The higher pressure is fixed at 300 bar assuming the design technicalities whereas the lower pressure is fixed at 85 bar which has been known to show the higher performances as mentioned before. Figure 11 shows the pressure characteristics for different maximum temperatures reached for respective TES showing the lower pressures as well as the pressure ratios.
The lower pressure side of the CC varies from 1.86 to 6.75 for 400 to 600 °C, respectively. The pressure ratios of the CCs for solar salt (550 °C) and concrete (600 °C) are too high to be elaborated by a single compressor unit. Therefore, for practical purposes, multiple compressors should be considered to reach these pressure ratios with intercooling to obtain a better isentropic efficiency.
Although this study assumes a single compressor efficiency to evaluate all the cycles, in a multiple compressor scenario the integrated isentropic efficiency of the two compressor units would be less than the single compressor unit. Therefore, the required temperatures of 550 °C and 600 °C may be reached for lower pressure ratios than as mentioned in this study.
The pressure ratios for charging and discharging are more or less similar for HITEC XL (500 °C): nevertheless, the DC is operates with a maximum pressure of 300 bar whereas CC operates with a maximum pressure of 280 bar. Even though the pressure ratios are almost similar for this case and DC has to reach a higher pressure, the power intake by the CC compressor is 16.1 MW while the DC cycle compressor takes only 4.1 MW (for 10 MW net power in charging and discharging) which is four times less than the CC one. Even considering WH valorization in the CC, the compressor in the charging cycle has to operate away from the critical point of CO2. Operating into the supercritical gaseous region, the work of the compressor increases due to the diverging isobaric lines, whereas near the critical point, the iso-baric lines are less diverging and as the DC compressor has to operate near the critical point, it takes less power. The compressor power consumption depends, therefore, not only on the pressure ratios but also on the operating pressures and temperatures: the DC compressor operating temperature is significantly lower than CC, which decreases the power consumption significantly for the former. This fact has been exploited in this study by keeping the higher operating pressure of the DC (300 bar) greater than the CC (280 bar) to obtain a larger expansion ratio at the expense of lower power consumption. This is one advantage of using an independent charging and discharging system. If different HOT HEX are being used for CC and DC, the difference between high-pressure sides may be increased further to achieve even better performances.
Figure 12 shows the overall performance of the thermodynamic properties of the systems which include the COP of CC and the thermal efficiency of DC and RTE (both energetic and exergetic ones). Considering fixed pressure ratios for all analyzed TES configurations, the efficiency of the DC largely depends on the turbine inlet conditions. Therefore, due to fixed pressure ratios, as the turbine inlet temperature increases, the efficiency of DC increases too: the trend for the efficiency can be observed as increasing from 23% to 28.80% for 400 °C to 600 °C, respectively. As a result of the recuperator in the DC, the CC has lower net power requirement. The recuperated heat increases the temperature at which CO2 enters the HOT HEX in the DC while in CC such an unused amount of heat can be employed in a low temperature turbine, thus increasing the net power and consequently, COP. The COP also depends upon the temperature glide between WH and TES. Therefore, COP decreases by 2.26 points for TES temperature variations from 400 °C to 600 °C. Looking at DC efficiency increasing values and CC COP decreasing values with TES temperatures, it is relevant to highlight that the decline of the COP, however, is much higher than the increment in the efficiency, thus penalizing RTE while increasing the TES temperature. Therefore, for 400 °C, the value of RTE obtained is above 100% while for the other TES materials, RTEs are below 100%, decreasing further for higher temperatures following COP in a similar trend. The gap between the COP and RTE can be seen to increase in Figure 12 as we move to the higher temperature of TES, which shows that increasing TES temperatures does not compensate for the decrease in the power-to-heat COP, eventually bringing RTE down for the higher temperatures. In order to have higher RTE at high temperatures, it would be possible to increase COP using a recuperator in the HP cycle too which is a possibility to be investigated in future studies.
The exergetic RTE seems to decrease while the TES temperature is increasing. However, a such trend is rather negligible compared to the electrical RTE one, even if the reason behind the exergetic RTE decreasing is similar to the electrical RTE one. From an exergetic point of view, there is not so much difference if a lower TES temperature configuration or a higher TES temperature configuration is promoted as the difference in the values is only about two percent. From an exergetic point of view, it can make sense to utilize higher-temperature TES storage and obtain higher DC efficiencies at the expense of almost similar exergetic performances as compared to low-temperature TES.
Table 5 shows the thermal storage characteristics and sizing of all analyzed PTES configurations. All the PTES are scaled based on the equal amount of power consumption in CC and power production in DC which is 10 MW. For the fixed amount of time of charging of 10 h, the amount of storage is determined for each case.
For an equal amount of power consumption for each TES case, the mass flow of CO2 in CC and DC decreases for the increasing temperature of storages which leads to less needed energy storage capacity as we move towards the higher temperature TES. By comparison, the required capacity is minimized by 57% for the concrete storage as compared to the Syltherm which can lead to smaller capital costs. The discharging time will change depending upon the RTE. As the RTE for 400 °C is higher, the DC for this configuration can run for a longer time, such as 10 h and 20 min for 10 h of charging, whereas the time of discharging becomes less and less for the higher temperature TES, with concrete being able to discharge for 5 h and 30 min for a 10 h charge.

6. Preliminary Economic Investigations

Starting from values presented in Table 5, Table 6 shows the capital cost of the components needed for the 10 MW scale system; all the values are in Million of USD (M$). The costs are calculated using the cost functions described in Section 4.3: the CAPEX of the overall proposed PTES system is calculated as the sum of the different components present in the plant layout.
Although reversible machinery is being tested for lab scale PTES systems [47], large scale reversible sCO2 machinery are not technologically ready yet for commercial scale plants. Therefore, separate turbomachinery for charging and discharging are considered.
Along with the costs of different PTES systems, the cost of the WH2P system has also been mentioned for comparison. It is clearly visible that despite the absence of the charging turbomachinery in the WH2P, the CAPEX calculated is much higher than all the PTES configurations. The justification is that the comparison is being made for the WH2P and WH+PTES for the same operating conditions of pressure and temperatures using the temperature 330 °C of waste heat to attain a set power output of 10 MW for all the configurations; the lower temperature configurations will require a larger mass flow rates and larger machines.
As the temperature of storages becomes higher, the same amount of power can be reached with a smaller mass flow rate in the machines. The scale of the mass flow rate determines the size of the machinery. For a larger mass flow rate, the size of the machines would be larger, thus bringing higher CAPEX. WH2P operates at the lowest temperature of 330 °C among all the other configurations, thus requiring the highest mass flow rate to guarantee a net power of 10 MW, leading to the highest CAPEX, even achieving values that go beyond the PTES configurations. DC cycle turbomachinery and HEX of all the configurations follow the same trend of cost reduction with higher temperatures as all the configurations are operating on same operating pressures, but with lower mass flow rates, while for CC turbomachinery there is a reverse trend not driven by mass flow rate reasons in this case. Indeed, although the mass flow rate is also decreasing in the CCs for higher temperature configurations, the pressure ratios in CC are different for each configuration, thus leading to higher turbomachinery CAPEX despite a decrease in the mass flow rate. The magnitude of the increase, however, is minimized by the counter effect that decreasing mass flow has on the cost of turbomachinery.
The highest cost for all the components is of the TES heat exchanger. This is evident in Figure 4 which shows the internal features of the heat exchanger for 450 °C TES. The temperature difference between the hot side fluid and cold side fluid remain more or less 10 K for the whole duration of heat transfer, which tends to make the area of the heat exchanger very large. This TES heat exchanger, referred to in Table 4 as TES HEX, is similar for the charge and discharge cycle although, the pressures are not similar for charge and discharge with 280 bar for CC and 300 bar for DC. The parameters of pressure and mass flow rate are different whereas the temperature difference between the inlet and the outlet of TES HEX are the same for the CC and the DC. Except for the storage, the highest component cost for the PTES configuration is incurred by the 400 °C temperature configuration and the lowest by the 600 °C configuration which goes to show that although the RTE is lower for high-temperature configurations, the higher temperature configurations can be a better choice when CAPEX is the priority.
In [29], a dispatchment study investigated the potential behavior of the proposed WH-driven PTES system under fluctuating grid electricity prices. The charging and discharging of the system depends on the cost of electricity and were optimized in the study on a profit-based objective function. The electricity dispatch analysis was performed on the Syltherm (400 °C) case as it achieved the maximum round trip efficiency of around 103% despite having higher CAPEX mostly due to the highest TES cost.
The electricity dispatch analysis was performed in different electric markets with/without high electricity price volatility and with/without negative electricity prices guaranteeing annual net revenues of around 3.135 M USD looking at Belgian electricity market values of 2022 [48], where just around 35,000 EUR were related to the exploitation (via the charging cycle) of negative electricity prices thus showing:
-
an electricity market interest for the proposed system in different EU electricity market (particularly those ones with weekly/monthly price volatility);
-
sustainable PBP around 8 to 10 years for the proposed system.

7. Conclusions

This paper introduces an innovative concept of a high-efficiency waste heat-driven sCO2 P2H2P energy storage system. The proposed solution has the potential to be applied in various industrial sectors, enable the valorization of local waste heat, and make industries more grid-flexible while improving their overall efficiency and reducing capital expenditures by utilizing waste heat instead of investing in cold thermal energy storage.
The paper focuses on the thermodynamic performance and preliminary economic analysis of waste heat-driven sCO2 P2H2P cycle layouts under design conditions with a specific case study on the cement industry. A sensitivity analysis was conducted to explore the performance characteristics of the charging and discharging cycles that constitute a PTES system, looking at the influence of limited operating pressures and the temperature of the cycles. The performance evaluation is mainly based on the electrical RTE (accounting for electrical energy flows) and the exergetic RTE (accounting for electrical and thermal exergy flows). From the discussed results, the following main conclusions can be summarized:
(a)
The use of a recuperated cycle in the discharging phase enables electrical RTE values exceeding 70%, which is higher than what can be achieved with PTES without recuperation operating under similar conditions. Furthermore, a recuperated solution achieves improved results with only a limited increase in the minimum temperature of the thermal energy storage (TES), thus minimizing the required TES size. This solution leverages the availability of waste heat recovery, potentially eliminating the need for a low-temperature TES that is necessary for standalone PTES configurations, thus allowing for cost savings. However, it is important to note that the exergetic RTE analysis, which includes the contributions of both electrical power and external thermal sources in terms of exergy flows, shows that even the best-performing configurations analyzed in this study cannot achieve an RTEex higher than 39%;
(b)
The independence of the CC and DC in terms of the components and turbomachinery originating from the utilization of waste heat offers many benefits of different operating pressures in charging and discharging which in turn result in higher power gains. Specifically, reducing the CC power input by allowing lower pressure operations than the DC cycle and increasing CC turbine power output by being able to operate away from the critical point;
(c)
The integration of higher temperature TES material brings higher efficiency of the PTES DC: nevertheless, such an increase does not compensate for the reduction in COP of the charging HP cycle, thus lower temperature TES materials present higher RTE (while comparing different higher temperatures of the cycles at the same maximum pressure of the cycle);
(d)
MS-based TES systems (450 °C to 550 °C) show lower CAPEX if compared to diathermic oil or concrete and satisfactory RTE (0.55 ÷ 0.7) if compared to other currently investigated long-duration energy storage systems/CBs;
(e)
The charging cycle is the most critical and relevant part (in terms of impact on the RTE) of the proposed systems and, to ensure cost-effective systems, highly efficient HPs and components (mainly ”hot sCO2 compressors”) are needed. This also highlights the need for further development of sCO2 high-temperature heat pumps which today could reach up to 160–200 °C with good COP values;
(f)
The proposed systems can ensure flexibility by the thermal energy storage units, thus easily enabling a decouple energy/power rate that the system can provide to ensure significant grid support, particularly with high RTE values, by being continuously charged and discharged along the day which is particularly attractive in markets with high electricity price volatility and fluctuations as well as the presence of negative prices.
By proposing a sCO2 Carnot batteries/power cycles sizing modeling tool as well as dispatchment models, this study sets the ground for future sCO2 PTES techno-economic investigations that can have different layouts, integration potentials, and available sources from technical and energy market points of view. The proposed system and analysis could, therefore, be applied to any type of industrial waste heat (and/or freely available heat source like thermal RES).
For this purpose, one of the next aspects that is worthy of analysis is the impact of the temperature and quality (in terms of time-dependency and variability) of the WH driving the PTES system on its performances, thus better understanding which of the industrial sectors presented in Section 2 could be more relevant to be investigated.

Author Contributions

S.B.: Conceptualization, industrial opportunities assessment, identification of the reference use case, critical analysis of results, and cowriting—original draft; S.M.: methodology, code development, critical analysis of results, results visualization, and cowriting—original draft; S.S.M.S.: methodology, code codevelopment and fine-tuning, simulation results’ data collection, critical analysis of results, cowriting—original draft, and results visualization; A.T.: conceptualization and methodology scientific supervision, and review and editing. All authors have read and agreed to the published version of the manuscript.

Funding

This research received no external funding.

Data Availability Statement

Data presented in this paper are not available due to confidentiality aspects.

Conflicts of Interest

The authors declare no conflict of interest.

Nomenclature

Abbreviations
CAPEXCapital Expenditure
CBCarnot Battery
CCCharging Cycle
CHPCombined Heat and Power
COPCoefficient of Performance
CSPConcentrating Solar Power
DCDischarging Cycle
EEnergy
ExExergy
EUEuropean Union
hEnthalpy
HEXHeat Exchanger
HPHeat Pump
LDESLong-Duration Energy Storage
LMTDLog Mean Temperature Difference
LMPLocation Marginal Prices
MSMolten Salts
PCMPhase Change Material
PTESPumped Thermal Energy Storage
PVPhotovoltaic
P2H2PPower-to-heat-to-power
QHeat
RESRenewable Energy Sources
RTERound Trip Efficiency
sCO2Supercritical Carbon Dioxide
TTemperature
TESThermal Energy Storage
USUnited States
WHWaste Heat
WHRWaste Heat Recovery
Subscripts
avgAverage
cc/CCCharging Cycle
dc/DCDischarging Cycle
elElectric
HEXHeat exchanger
inInput
outOutput
TESThermal Energy Storage

References

  1. The Guardian. Weather Tracker: Power Prices Dip to Negative in Europe Amid Clean Energy Boost. Available online: https://www.theguardian.com/environment/2023/may/29/weather-tracker-power-prices-dip-to-negative-in-europe-amid-clean-energy-boost (accessed on 5 May 2023).
  2. Jafarizadeh, H.; Soltani, M.; Nathwani, J. A Novel Analysis of Energy Density Considerations and Its Impacts on the Cost of Electrical Energy Storage (EES) Plants. Energies 2023, 16, 3330. [Google Scholar] [CrossRef]
  3. Novotny, V.; Basta, V.; Smola, P.; Spale, J. Review of Carnot Battery Technology Commercial Development. Energies 2022, 15, 647. [Google Scholar] [CrossRef]
  4. Alfani, D.; Binotti, M.; Macchi, E.; Silva, P.; Astolfi, M. sCO2 power plants for waste heat recovery: Design optimization and part-load operation strategies. Appl. Therm. Eng. 2021, 195, 117013. [Google Scholar] [CrossRef]
  5. Kaushik, E.; Prakash, V.; Mahela, O.P.; Khan, B.; El-Shahat, A.; Abdelaziz, A.Y. Comprehensive Overview of Power System Flexibility during the Scenario of High Penetration of Renewable Energy in Utility Grid. Energies 2022, 15, 516. [Google Scholar] [CrossRef]
  6. Zhou, C.; Li, Y.; Wang, F.; Wang, Z.; Xia, Q.; Zhang, Y.; Liu, J.; Liu, B.; Cai, W. A Review of the Performance Improvement Methods of Phase Change Materials: Application for the Heat Pump Heating System. Energies 2023, 16, 2676. [Google Scholar] [CrossRef]
  7. Jacob, R.; Liu, M. Design and Evaluation of a High Temperature Phase Change Material Carnot Battery. Energies 2023, 16, 189. [Google Scholar] [CrossRef]
  8. Linares, J.I.; Martín-Colino, A.; Arenas, E.; Montes, M.J.; Cantizano, A.; Pérez-Domínguez, J.R. Carnot Battery Based on Brayton Supercritical CO2 Thermal Machines Using Concentrated Solar Thermal Energy as a Low-Temperature Source. Energies 2023, 16, 3871. [Google Scholar] [CrossRef]
  9. de la Quintana, J.L.; Sebastián, A.; Abbas, R. Economic assessment of installed CSP plants as Carnot Batteries: Spanish grid market case study. AIP Conf. Proc. 2022, 2445, 050002. [Google Scholar] [CrossRef]
  10. Beck, A.; Unterluggauer, J.; Helminger, F.; Solís-Gallego, I. Decarbonisation Pathways for the Finishing Line in a Steel Plant and Their Implications for Heat Recovery Measures. Energies 2023, 16, 852. [Google Scholar] [CrossRef]
  11. Agner, R.; Ong, B.H.Y.; Stampfli, J.A.; Krummenacher, P.; Wellig, B. A Graphical Method for Combined Heat Pump and Indirect Heat Recovery Integration. Energies 2022, 15, 2829. [Google Scholar] [CrossRef]
  12. White, M.T.; Bianchi, G.; Chai, L.; Tassou, S.A.; Sayma, A.I. Review of supercritical CO2 technologies and systems for power generation. Appl. Therm. Eng. 2021, 185, 116447. [Google Scholar] [CrossRef]
  13. Morandin, M.; Maréchal, F.; Mercangöz, M.; Buchter, F. Conceptual design of a thermo-electrical energy storage system based on heat integration of thermodynamic cycles—Part A: Methodology and base case. Energy 2012, 45, 375–385. [Google Scholar] [CrossRef]
  14. Morandin, M.; Maréchal, F.; Mercangöz, M.; Buchter, F. Conceptual design of a thermo-electrical energy storage system based on heat integration of thermodynamic cycles—Part B: Alternative system configurations. Energy 2012, 45, 386–396. [Google Scholar] [CrossRef]
  15. MMercangöz, M.; Hemrle, J.; Kaufmann, L.; Z’graggen, A.; Ohler, C. Electrothermal energy storage with transcritical CO2 cycles. Energy 2012, 45, 407–415. [Google Scholar] [CrossRef]
  16. Vinnemeier, P.; Wirsum, M.; Malpiece, D.; Bove, R. Supercritical CO2-Based Heat Pump Cycle for Electrical Energy Storage for Utility Scale Dispatchable Renewable Energy Power Plants. In Proceedings of the 5th International Symposium—Supercritical CO2 Power Cycles, San Antonio, TX, USA, 28–31 March 2016. [Google Scholar]
  17. Aga, V.; Conte, E.; Carroni, R.; Burcker, B.; Ramond, M. Integration of Pumped-Heat-Electricity-Storage into Water/Steam Cycles of Thermal Power Plants. In Proceedings of the 5th International Symposium—Supercritical CO2 Power Cycles, San Antonio, TX, USA, 28–31 March 2016. [Google Scholar]
  18. Cho, J.; Shin, H.; Cho, J.; Choi, B.; Roh, C.; Lee, B.; Lee, G.; Ra, H.-S.; Baik, Y.-J. Electric-thermal energy storage for large-scale renewables and a supercritical carbon dioxide power cycle. AIP Conf. Proc. 2020, 2303, 130004. [Google Scholar] [CrossRef]
  19. Liu, J.; Chen, H.; Xu, Y.; Wang, L.; Tan, C. A solar energy storage and power generation system based on supercritical carbon dioxide. Renew. Energy 2014, 64, 43–51. [Google Scholar] [CrossRef]
  20. McTigue, J.; Farres-Antunez, P.; Ellingwood, K.; Neises, T.; White, A. Pumped thermal electricity storage with supercritical CO2 cycles and solar heat input. AIP Conf. Proc. 2020, 2303, 190024. [Google Scholar] [CrossRef]
  21. Trevisan, S.; Guédez, R.; Laumert, B. Thermo-economic optimization of an air driven supercritical CO2 Brayton power cycle for concentrating solar power plant with packed bed thermal energy storage. Sol. Energy 2020, 211, 1373–1391. [Google Scholar] [CrossRef]
  22. Tafur-Escanta, P.; Valencia-Chapi, R.; López-Guillem, M.; Fierros-Peraza, O.; Muñoz-Antón, J. Electrical energy storage using a supercritical CO2 heat pump. Energy Rep. 2022, 8 (Suppl. S3), 502–507. [Google Scholar] [CrossRef]
  23. Liu, L.; Yang, Q.; Cui, G. Supercritical Carbon Dioxide(s-CO2) Power Cycle for Waste Heat Recovery: A Review from Thermodynamic Perspective. Processes 2020, 8, 1461. [Google Scholar] [CrossRef]
  24. Kacludis, A.; Lyons, S.; Nadav, D.; Zdankiewicz, E. Waste Heat to Power (WH2P) Applications Using a Supercritical CO2-Based Power Cycle. In Proceedings of the Power-Gen International 2012, Orlando, FL, USA, 11–13 December 2012. [Google Scholar]
  25. CO2OLHEAT Project Website. Available online: https://co2olheat-h2020.eu/ (accessed on 27 July 2022).
  26. Lechtenböhmer, S.; Schneider, C.; Yetano Roche, M.; Höller, S. Re-Industrialisation and Low-Carbon Economy—Can They Go Together? Results from Stakeholder-Based Scenarios for Energy-Intensive Industries in the German State of North Rhine Westphalia. Energies 2015, 8, 11404–11429. [Google Scholar] [CrossRef]
  27. Hasanbeigi, A.; Zuberi, M.J.S. Electrification of Steam and Thermal Oil Boilers in the Textile Industry: Techno-Economic Analysis for China, Japan, and Taiwan. Energies 2022, 15, 9179. [Google Scholar] [CrossRef]
  28. Maccarini, S.; Barberis, S.; Mehdi, S.S.S.; Gini, L.; Traverso, A. Performance analysis of PTES layouts evolving sCO2 for industrial WHR integration. In Proceedings of the 5th European sCO2 Conference for Energy Systems, Prague, Czech Republic, 14–16 March 2023. [Google Scholar] [CrossRef]
  29. Shamsi, S.S.M.; Maccarini, S.; Trevisan, S.; Barberis, S.; Guedez, R. sCO2 Based Pumped Heat Thermal Energy Storage Systems Valorizing Industrial Waste Heat Recovery: A Techno-Economic Analysis of the Role of High Temperature TES. In Proceedings of the ASME Turbo Expo 2023 Turbomachinery Technical Conference and Exposition, Boston, MA, USA, 26–30 June 2023. GT2023-103080. [Google Scholar]
  30. Waste Heat Recovery—FIVES PILLARD—PDF Catalogs|Technical Documentation|Brochure. Available online: https://pdf.directindustry.com/pdf/fives-pillard/waste-heat-recovery/196705-752096.html (accessed on 27 October 2022).
  31. Lipiäinen, S.; Apajalahti, E.-L.; Vakkilainen, E. Decarbonization Prospects for the European Pulp and Paper Industry: Different Development Pathways and Needed Actions. Energies 2023, 16, 746. [Google Scholar] [CrossRef]
  32. Madeddu, S.; Ueckerdt, F.; Pehl, M.; Peterseim, J.; Lord, M.; Kumar, K.A.; Krüger, C.; Luderer, G. The CO2 reduction potential for the European industry via direct electrification of heat supply (power-to-heat). Environ. Res. Lett. 2020, 15, 124004. [Google Scholar] [CrossRef]
  33. Marchionni, M.; Bianchi, G.; Tassou, S.A. Review of supercritical carbon dioxide (sCO2) technologies for high-grade waste heat to power conversion. SN Appl. Sci. 2020, 2, 611. [Google Scholar] [CrossRef]
  34. Sorknæs, P.; Johannsen, R.M.; Korberg, A.D.; Nielsen, T.B.; Petersen, U.R.; Mathiesen, B.V. Electrification of the industrial sector in 100% renewable energy scenarios. Energy 2022, 254 Pt B, 124339. [Google Scholar] [CrossRef]
  35. Guédez, R.; Barberis, S.; Maccarini, S.; López-Román, A.; Milani, A.; Pesatori, E.; Oyarzábal, U.; Sánchez, A. Design of a 2 MW Molten Salt Driven Supercritical CO2 Cycle and Turbomachinery for the SOLARSCO2OL Demonstration Project. In Proceedings of the ASME Turbo Expo 2022: Turbomachinery Technical Conference and Exposition, Rotterdam, The Netherlands, 13–17 June 2022. Volume 9: Supercritical CO2, V009T28A008. [Google Scholar] [CrossRef]
  36. Niknam, P.H.; Barberis, S.; Sciacovelli, A. High temperature industrial thermal energy storage—Assessment of potential applications and benefits toward industrial decarbonization. In Proceedings of the EUROTHERM 2023 Conference, Lleida, Spain, 24–26 May 2023. [Google Scholar]
  37. SO-WHAT Project Website. Available online: https://sowhatproject.eu/ (accessed on 6 June 2023).
  38. SCALER Project Website. Available online: https://www.scalerproject.eu/ (accessed on 6 June 2023).
  39. Manente, G.; Ding, Y.; Sciacovelli, A. Structured procedure for the selection of thermal energy storage options for utilization and conversion of industrial waste heat. J. Energy Storage 2022, 51, 104411. [Google Scholar] [CrossRef]
  40. Bejan, A.; Tsatsaronis, G.; Moran, M. Thermal Design & Optimization; John Wiley & Sons Inc.: New York, NY, USA, 1996. [Google Scholar]
  41. Welcome to CoolProp—CoolProp 6.4.3 Documentation. Available online: http://www.coolprop.org/ (accessed on 4 January 2023).
  42. Baglietto, G.; Maccarini, S.; Traverso, A.; Bruttini, P. Techno-Economic Comparison of Supercritical CO2, Steam, and Organic Rankine Cycles for Waste Heat Recovery Applications. J. Eng. Gas Turbines Power 2022, 145, 041021. [Google Scholar] [CrossRef]
  43. Wu, D.; Wei, M.; Tian, R.; Zheng, S.; He, J. A Review of Flow and Heat Transfer Characteristics of Supercritical Carbon Dioxide under Cooling Conditions in Energy and Power Systems. Energies 2022, 15, 8785. [Google Scholar] [CrossRef]
  44. Stamatellos, G.; Stamatelos, T. Effect of Actual Recuperators’ Effectiveness on the Attainable Efficiency of Supercritical CO2 Brayton Cycles for Solar Thermal Power Plants. Energies 2022, 15, 7773. [Google Scholar] [CrossRef]
  45. Turton, R.; Bailie, R.C.; Whiting, W.B.; Shaeiwitz, J.A. Analysis Synthesis and Design of Chemical Processes, 5th ed.; Pearson Education: New York, NY, USA, 2018. [Google Scholar]
  46. Weiland, N.T.; Lance, B.W.; Pidaparti, S.R. sCO2 Power Cycle Component Cost Correlations from DOE Data Spanning Multiple Scales and Applications. In Proceedings of the ASME Turbo Expo 2019: Turbomachinery Technical Conference and Exposition, Phoenix, AZ, USA, 17–21 June 2019. [Google Scholar] [CrossRef]
  47. Steger, D.; Feist, M.; Schlücker, E. Using a screw-type machine as reversible compressor–expander in a Carnot Battery: An analytical study towards efficiency. Appl. Energy 2022, 316, 118950. [Google Scholar] [CrossRef]
  48. ENTSO-E Transparency Platform. Available online: https://transparency.entsoe.eu/ (accessed on 14 August 2023).
Figure 1. Exergy balance of an open system.
Energies 16 06249 g001
Figure 2. Charging cycle configuration.
Energies 16 06249 g002
Figure 3. Discharging cycle configurations: (a) simple discharge cycle and (b) recuperated discharging cycle.
Energies 16 06249 g003
Figure 4. High temperature (TES HEX) heat exchanger thermal exchange behavior: (a) charging and (b) discharging (example for TES temperature at 450 °C as analyzed in [28] and in Section 5.1).
Energies 16 06249 g004
Figure 5. Algorithm flowchart of the modified WTEMP-EVO tool.
Energies 16 06249 g005
Figure 6. Total net power achievable by a recuperated cycle for a 1 kg/s mass flow rate of the molten salts; the x-axis is the effectiveness of the recuperator.
Energies 16 06249 g006
Figure 7. sCO2 Maximum temperature in the charging cycle. The minimum allowable value is 460 °C (acceptable area is below the red line).
Energies 16 06249 g007
Figure 8. COP of the charging cycle with a minimum temperature of the TES equal to 222 °C, as calculated for a recuperated discharging cycle with recuperator effectiveness at 80% (acceptable area is below the red line).
Energies 16 06249 g008
Figure 9. Net power absorbed in the charging cycle with a minimum temperature of the TES equal to 222 °C, as calculated for a recuperated discharging cycle with recuperator effectiveness at 80% (acceptable area is below the red line).
Energies 16 06249 g009
Figure 10. T-s diagrams for the proposed most effective P2H2P cycle assuming a recuperated discharging cycle) recuperator effectiveness 80%) and TTES = 450 °C.
Energies 16 06249 g010
Figure 11. Pressure ratio and lower pressure side trends of different PTES systems with different TES materials.
Energies 16 06249 g011
Figure 12. Performance of the waste heat valorizing PTES system with different TES materials.
Energies 16 06249 g012
Table 1. Industry thermal demand and estimated WH, by sector.
ItemUnitsChemicalRefineryPaper and
Pulp
Food and
Beverages
Non-Ferrous
Metals
Iron and
Steel
CementCeramicsNon-Metallic
Mineral (Lime)
Glass
Process heat
Lower bound
°C17018015050150100150250300200
Process heat
Higher bound
°C90060080020012001500120012509001600
Reference plant average heat demandMWh/day6672286319272472672750472847503
No. of EU
industries
-2109714526003412632451302108360
Waste heat
potential
%11.007.4010.568.649.5911.4011.4011.4011.4011.40
Waste heat average temperature °C150–400150–400150–40065–150300–700300–700250–600250–600300–500300–700
Recoverable heat by TES MWh/day73169348374769409733
Process electrification rate %3030901005025–75 20303530
Table 2. Thermodynamic modeling assumptions.
AssumptionsValueUoM
TES max temperatureBetween 400 and 600°C
Recuperator effectiveness60; 80%
Isentropic efficiency turbomachinery80%
Thermal losses of the TES1%
Electrical efficiency98%
Mechanical efficiency98%
Pressure loss in heat exchanger2%
Min ΔT heat exchangers10K
Compressor inlet temperature35°C
Ambient temperature T 0 25°C
Air temperature cooler exit45°C
Waste heat temperature330°C
Waste heat mass flow rate38.6kg/s
Table 3. TES Material properties [29].
TES Material Max TTES
[°C]
Density [kg/m3]Specific Heat [kJ/kgK]Thermal Conductivity [W/mK]Heat Transfer FluidMin Temp. [°C]Cost
Syltherm4005482.260.064Oil−404 $/kg
Yara Salt45019131.430.52Salt2201.5 $/kg
HitecXL50018771.430.52Salt2201.6 $/kg
Solar salt55017401.540.5Salt2501.3 $/kg
Concrete\air60010081.101.9Air2530 k$/MWh and 0.04 $/kg
Table 4. Main thermodynamic features for the best operating conditions of a PTES cycle with a recuperated discharging cycle with a TES material maximum temperature of 450 °C and recuperator effectiveness of 80%.
CC pmin DC pminTES TminCC
COP
DC
Efficiency
DC Net Power CC Net Power RTE
(Electrical)
RTE
(Exergetic)
95.5 bar83 bar222 °C3.2422.9%2.18 MW2.98 MW73.3%38.8%
Table 5. TES parameters/performances for different TES materials for PTES.
TES Material TTES
[°C]
TES Capacity [MWhth]Charging TimeDischarging Time
Syltherm4004471010.33
Yara Salt450317107.91
HitecXL500253106.71
Solar salt550215105.99
Concrete\air600190105.50
Table 6. Capital cost estimations for 10 MW power scaling of the proposed WH-driven PTES system with different TES materials.
ComponentSyltherm
(400 °C)
YaraSalt
(450 °C)
HitecXL
(500 °C)
Solarsalt
(550 °C)
Concrete\Air
(600 °C)
CC_Compressor7.517.567.617.667.71
CC_Turbine1.621.691.751.811.87
WH_HEX(WH-CO2)2.641.861.431.160.97
WH_HEX(WH-TES)-----
DC_Compressor5.134.834.604.404.24
DC_Turbine3.743.583.473.383.30
DC_Air_HEX0.300.250.220.200.18
DC_Recuperator1.110.880.740.630.56
HOT_HEX9.067.246.466.015.65
Thermal Storage13.546.526.254.1010.39
Total CAPEX (M$)44.6534.4332.5429.3534.88
Disclaimer/Publisher’s Note: The statements, opinions and data contained in all publications are solely those of the individual author(s) and contributor(s) and not of MDPI and/or the editor(s). MDPI and/or the editor(s) disclaim responsibility for any injury to people or property resulting from any ideas, methods, instructions or products referred to in the content.

