Article

Analysis of the Causes of the Emergency Shutdown of Natural Gas-Fired Water Peak Boilers at the Large Municipal Combined Heat and Power Plant †

1
Department of Thermal Engineering and Air Protection, Faculty of Environmental Engineering and Energy, Cracow University of Technology, 31-155 Cracow, Poland
2
Department of Energy, Cracow University of Technology, 31-155 Cracow, Poland
*
Author to whom correspondence should be addressed.
This paper is an extended version of our paper published in Proceedings of the Energy Fuels Environment International Conference (EFE2022), Cracow, Poland, 20–23 September 2022; pp. 118–119.
Energies 2023, 16(17), 6278; https://doi.org/10.3390/en16176278
Submission received: 24 July 2023 / Revised: 19 August 2023 / Accepted: 26 August 2023 / Published: 29 August 2023

Abstract

:
The paper presents a cause-and-effect analysis of the failure of a 130 MWt gas-fired water boiler. The fault was a rupture of the helically finned tubes in the first rows of the second-stage water heater (ECO2). The high frequency of failures forced the boiler user to investigate their causes. The rapid drop in water flow in the ECO2 and the tightly finned pipes suggested that the permissible operating temperature of the steel used was exceeded. The only possible way to assess the working conditions was through a CFD simulation of the operation of the ECO2. Validated with the data acquisition system, the results show that the main reason for the failure was the overheating of the first rows of finned water heater pipes, regardless of the boiler load. The high heat flux value, exceeding 500,000 W/m2, and the increased flue gas temperature in front of the ECO2, almost reaching 900 °C, affected the appearance of the boiling film, limiting the cooling of the tube wall. Heat radiation and eddies behind the tubes significantly impacted the non-uniform temperature distribution, resulting in high pipe wall stress. By analyzing the service life of the first row of pipes based on the Larson–Miller parameter, it was concluded that the pipes would fail after only a few tens of hours.

1. Introduction

1.1. Background and Significance

The main objective of the presented article was to explain the fundamental reasons behind the failures observed in the investigated natural gas-fired water peak boilers at a large municipal combined heat and power plant. This article is an extension [1] of the findings presented at the conference [2]. The economizer pipes became unsealed after only 102 h of boiler operation from start-up. The paper also addresses oversights that could have been avoided during the design process. The selected burners transfer heat to successive heating surfaces within the boiler. To enhance heat exchange, finned tubes were incorporated into the first and second-stage water heaters. The rows of tubes directly exposed to exhaust gases consistently deteriorated after operating for periods ranging from several hours to several dozen hours. Investigating the causes of such failures is challenging. This article demonstrates that the use of finned tubes can significantly impact the behavior of tubes exposed to still-hot flue gases. The radiation process is of great importance here. Enhancing heat exchange efficiency through an increased surface area of the fins contributes to a higher heat flow rate that can be transferred to the tube itself and, consequently, to the cooling medium. Such solutions are generally used in waste heat recovery boilers, where the flue gas temperature is considerably lower (approximately 500–650 °C) [3]. However, in this case, the temperature of the flue gas in the combustion chamber was much higher than 900 °C. Moreover, the heat flux exceeded 500,000 W/m2, which surpasses the design values when calculating this type of exchanger.

1.2. Literature Research

The utilization of fossil fuels in energy generation is expected to decline due to their significant impact on climate change [4]. However, an immediate elimination is not feasible. The initial phase-out will target lignite, followed by black coal. Natural gas will be the last to be phased out. Importantly, it exhibits a higher degree of environmental compatibility compared to alternative fossil fuels [5]. The development of gas networks has been ongoing for more than a century. Transportation costs and the price of the carrier are still relatively low [6]. There is still room to improve the efficiency of natural gas-burning equipment, thereby reducing greenhouse gas emissions [7]. The implementation of carbon dioxide capture technology in the process of natural gas combustion [8] and the use of carbon dioxide as a circulating medium [9] will reduce the carbon footprint of natural gas technology. Furthermore, gas boilers offer the advantage of integration with renewable energy sources to create hybrid systems [10]. Renewable energy sources inherently possess instability, whereas gas boilers possess the attribute of rapid start-up and shutdown. Implementing models that optimize the operation of gas-powered equipment in combination with renewable energy sources has an additional impact on reducing emissions and energy prices [11]. The points mentioned above have led to the increasing utilization of natural-gas-fired boilers for municipal applications [12]. The rapid increase in demand for district heating is driving the adoption of gas-fired technology. While this technology is relatively well-known, certain significant issues cannot be overlooked in the design of this type of unit. Firstly, due to its smaller size and water capacity, it is more responsive to changes in boiler load. Rapid start-up or shutdown of the boiler leads to significant temperature differences in the thick-walled pressure elements of the boiler [13]. However, the lower operating pressure affects the thinner walls of these elements and partially mitigates the effect of boiler transients on the strength of the boiler. Secondly, in this type of unit, heated surfaces are far more exposed to high temperatures. Superheated zones pose a considerable risk, which can lead to high-temperature corrosion [14]. Furthermore, difficulties may arise in transferring heat to the circulating medium in the boiler. In the case of high-temperature corrosion, the type of fuel being burned significantly affects its rate. Natural gas is decidedly less contaminated than coal or lignite, which limits its impact. However, in situations where heat uptake by heating surfaces is problematic, local disturbances in the cooling medium flow may occur. A high heat flux can lead to the vaporization of the medium near the wall and elsewhere, inhibiting the flow of the medium (e.g., water) and limiting the cooling of the tubes. Consequently, the wall temperature is rapidly exceeded, increasing the risk of tube damage. Lastly, it should be mentioned that such units typically have a forced circulation of the cooling medium. However, this does not exempt from considering the direction of flow in individual heating surfaces of the boiler. An incorrectly selected flow direction will impact increasing flow resistance, and in the case of localized vaporization of the medium, it can lead to flow inhibition. The above-mentioned factors clearly indicate that the design process of small, compact units is not straightforward. Despite the industry’s pursuit of achieving higher efficiency while simultaneously minimizing the emission of harmful compounds into the atmosphere, it should still assess the risk of failures [15]. The design of power equipment involves a process based on standards, although it is not able to take into account all aspects that arise only during the operation of these devices. In many cases of newly designed power units [16] and district heating units, the design process included simulation of equipment operation, allowing the capture of risks of unexpected failure. The paper [17] estimated the safe operating range of a heat exchanger using a safety rating to assess the risk of equipment failure. Process safety is an important part of the design process for power machinery and equipment. Nevertheless, due to the complexity of this type of equipment, it is still difficult to define a procedure to estimate the potential for breakdown. Failures in the power industry are among the most critical aspects considered when operating power machinery and equipment. The unplanned shutdown of a boiler or other equipment disrupts the continuity of power plant operations, exposing the processing plant to losses, and poses the risk of an accident at work. The paper [18] noted that as many as 40% of boiler shutdowns are due to the failure of heat exchangers, which operate at high temperatures. Sometimes boiler failures last for months. They occur frequently enough that there is a need to redesign the component that fails. This is far more complex than the design process. Various visual inspections of the failed components are typically carried out [19], including optical emission spectroscopy, metallographic analysis, tensile test, micro-hardness measurements, and SEM/EDS analysis [20]. Then, a specialist is required to determine the direction of the search for the causes of failure. Most commonly, thermal-fluid analyses are performed [19,20,21], which clearly indicate critical points where the device may fail. In ref. [19], it was pointed out that the main cause of longitudinal tube rupture was the higher-than-designed operating temperature. The paper [21] examined a concept that lowers the temperature of the pipe wall that was damaged in ref. [19]. In ref. [20], a finite element simulation confirmed the reason for the tube failure. In ref. [22], the combustion reaction of the injected fuel was simulated. Based on the thermal flow analysis, the minimum temperature of the heat exchanger operation was determined. Analysis of the chemical content made it possible to distinguish the chemical compounds that were the reason for the tube corrosion. The operating temperature below the acid dew point caused condensation of contaminated flue gases and corrosion of the tubes. In ref. [23], a stress simulation of a tube working in the petrochemical industry was carried out. Investigations showed that the tube was damaged as a result of short-term overheating, likewise, in [24]. In ref. [25], the effect of pulverized coal on the erosion of boiler heating surfaces was studied. In ref. [26], an analysis of the damage to the superheater tubes was conducted. Based on chemical analysis and creep strength analysis, it was determined that prolonged temperatures exceeding the tube’s operating limit were the cause of the failure. Paper [27] presents a simulation of tube rupture in the presence of a boiling film. Attention was drawn to the fact that this phenomenon itself has an impact on tube failure. The behavior of the tube is characteristic, resembling creep ballooning [27]. In each of the cases mentioned above, it was strongly emphasized that modeling the operation of the components was very helpful in identifying the reasons for the boiler failures. Case [27] demonstrates that comprehending the mechanism of tube failure due to the occurrence of film boiling would be practically impossible without conducting computer modeling. Similarly, this is the case in the presented analysis.

1.3. Research Content and Innovation

A visual inspection of the boiler and damaged components was carried out as part of the performed work. The operating parameters were analyzed just before the failure and at the time of the loss. Next, potential causes of the resulting failure were identified and investigated. It was assumed that the main reason for the damage caused was the excessive heat flow rate absorbed by the finned tubes located in the first rows of the economizer at the inlet side of the flue gas [1]. The geometry of the heat exchanger prevented analytical analysis. The heater comprises six adjustable rows of finned tubes. The fin spacing changes every two rows of tubes, which introduces additional complexity. Modeling the operation of heat exchangers of this design is very difficult, and there are no boiler models in the available literature that consider helically finned economizer tubes.
A method of modeling boiler operation based on CFD and strength analysis was developed to determine the causes of the failures in the studied boilers. The combustion process of the fuel supplied to the boiler was not modeled. In the developed method, it is necessary to know the temperature and composition of the flue gas in the combustion chamber. An extended thermal-flow analysis of a repetitive water heater section, including the preceding combustion chamber, was carried out. The radiative heat transfer process was considered using the P1 model. The investigation involved building a 3D model, discretizing it, simulating the steady-state operation of the heat exchanger just before failure, and comparing the simulation results with measured data. The results from the CFD analysis were imported into the strength analysis. The pipe could bend and expand in the developed model. For the strength analysis, a discrete pipe model was created and loaded with stresses from temperature and pressure. The thermal-flow study considered the case in which a thin vapor layer was modeled on the inner surface of the water heater pipe wall. Another issue was modeling an exchanger with smooth pipes in the first two rows. The results formed the basis for proposing an optimal solution. The thermal-flow analysis of a repeatable section of the boiler enabled an understanding of the causes of the characteristic cracking of tubes in the first rows of the second-stage water heater. The individual stages of the conducted research are shown in Figure 1.
None of the numerical boiler models described in the available literature considers finned heating surfaces, and the analytical calculations only provide a general overview of boiler conditions. This is a significant issue, and the developed model can be employed during the boiler design stage, mitigating the risk of a similar failure to the one investigated in the article. The primary advantage of the developed method for modeling boiler operation is the ability to determine accurate temperature distributions, both of the working medium and the tube and fin material. This is crucial as it identifies hazardous areas where the temperature limit for the steel used could be exceeded. Furthermore, the application of the developed model in the studies described in the article facilitated the identification of the failure’s cause shortly after the boiler’s startup. The downside of the method used is the extended CFD calculation time.

2. The Case Analysis

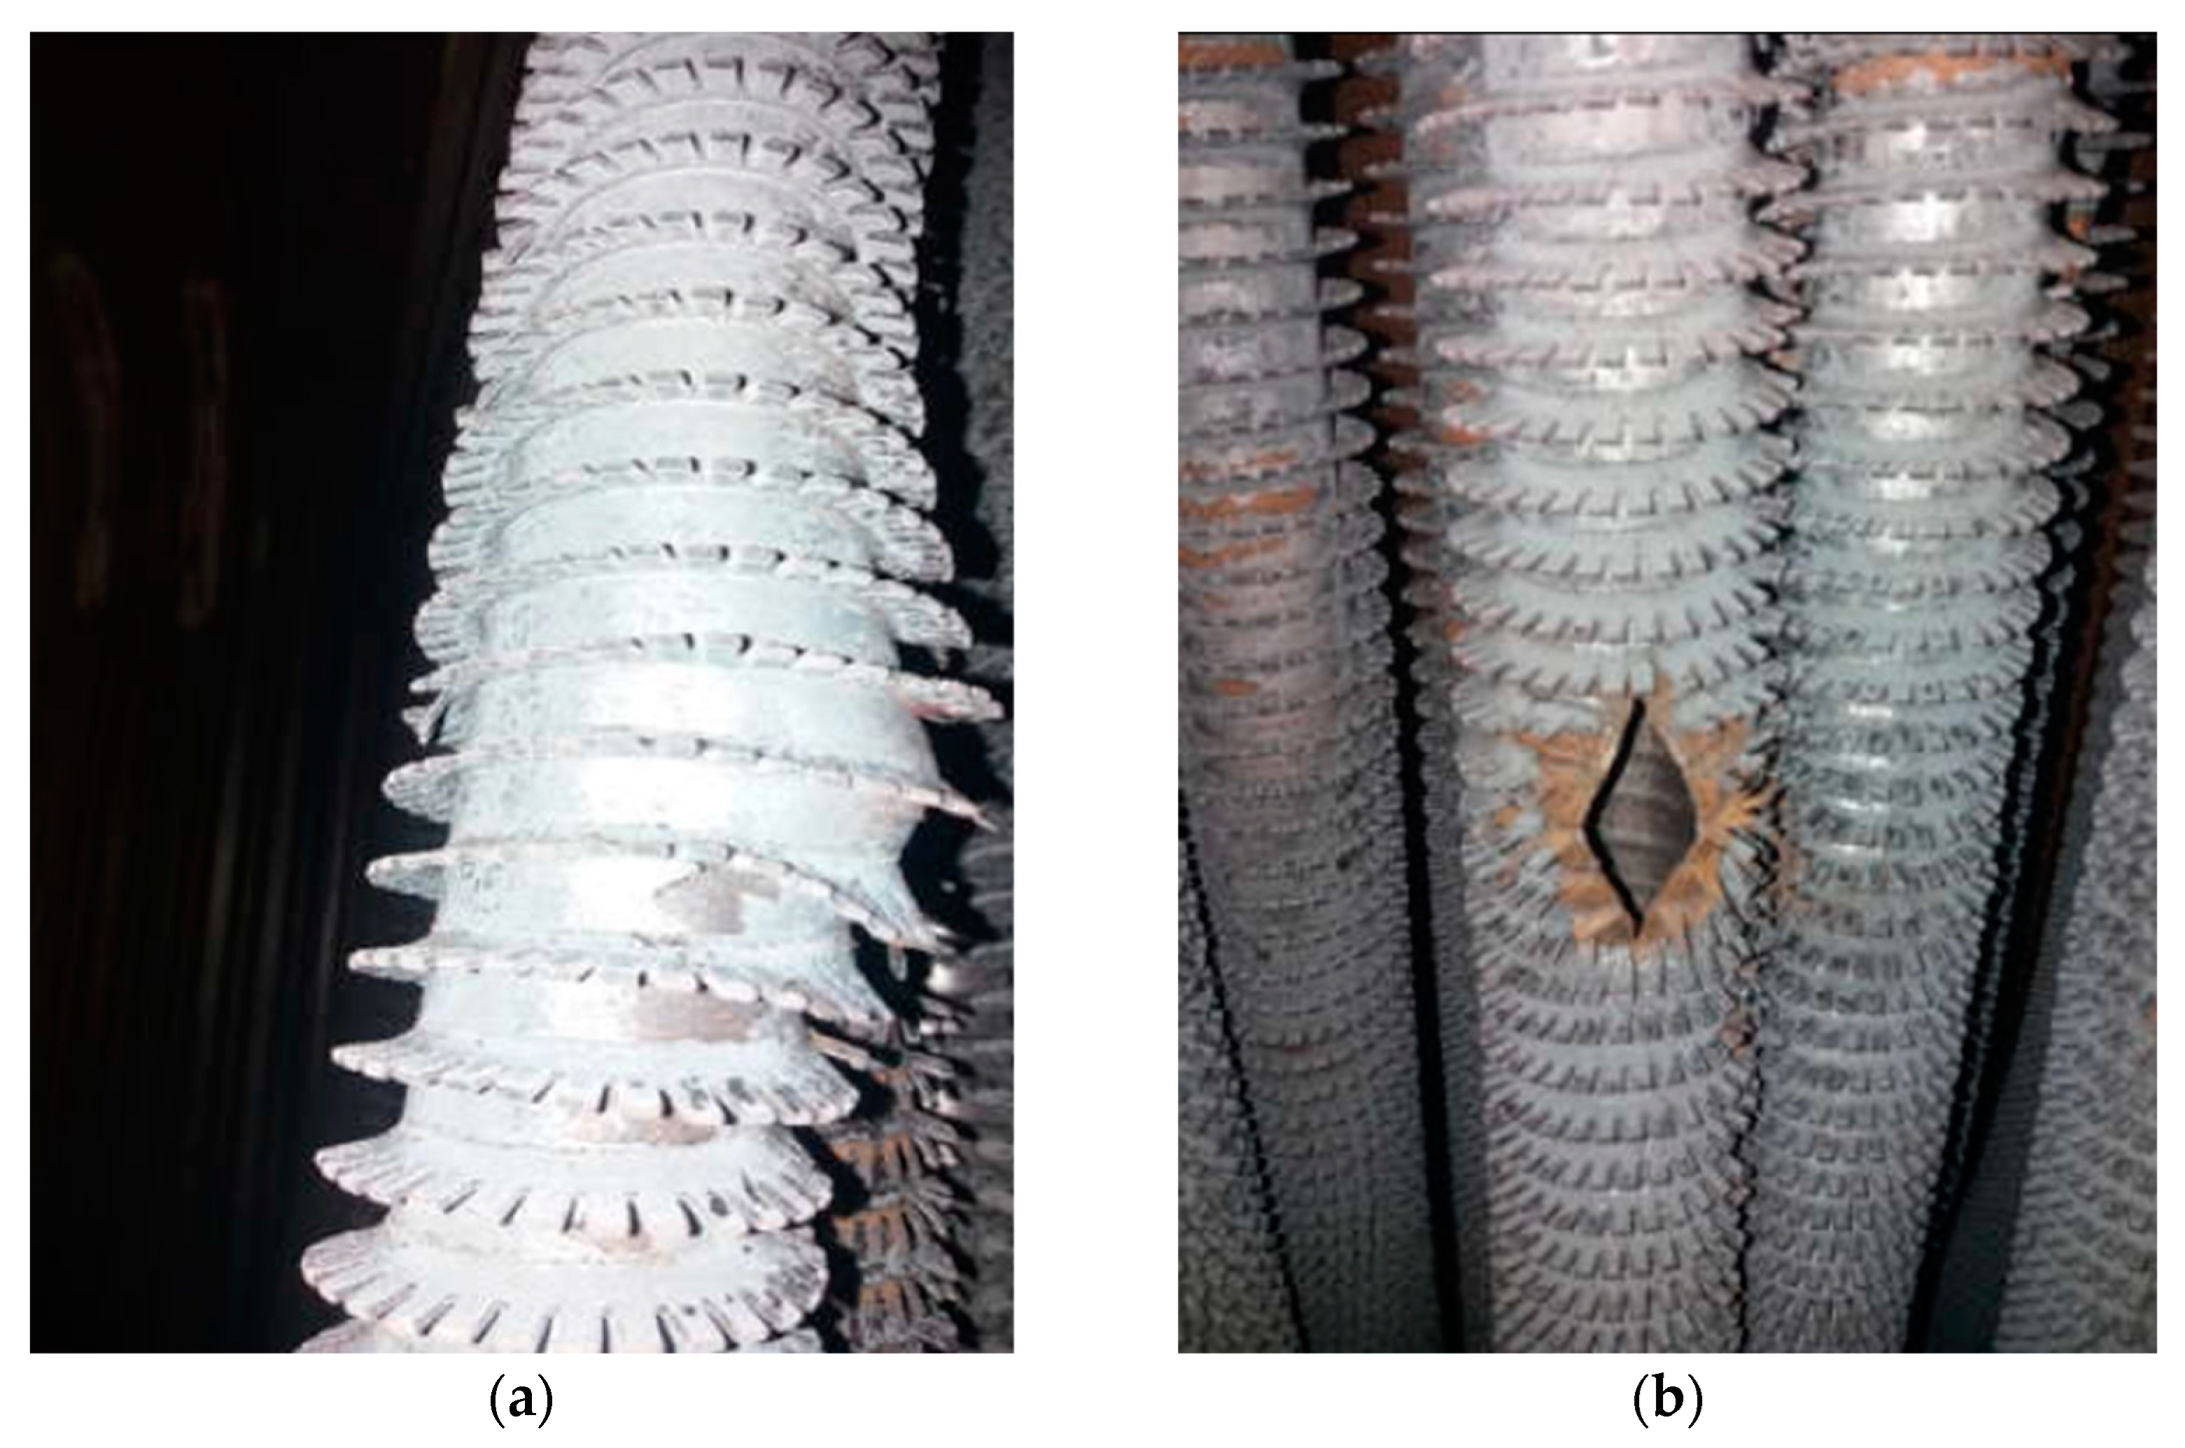
The investigation concerns a cause-and-effect analysis of the failure in a district heating boiler. The unit operated for several tens of hours, after which there was a longitudinal rupture of the water heater tubes. The investigated boiler is a gas-fired district heating water boiler with a thermal capacity of 130 MWt. The heat scheme diagram of the boiler is presented in Figure 2. The boiler consists of a furnace, sealed screens, and water heaters ECO1 and ECO2. The walls of the combustion chamber are made of pipes with an outer diameter of 57 mm, which are joined by fins. The pitch is 80 mm. Subsequently, the flue gas encounters the screen, which is also made of smooth pipes. At a distance of about 15 m from the burners along the boiler is the ECO2 water heater. It consists of three sections. Each section is made up of two rows of helically finned pipes. There are 48 pipes in each row. The subsequent sections vary in the pitch of the fins. The fin pitch decreases from 12 to 4 mm. The cooled flue gas goes to the ECO1 heater at the very end. Water, the boiler’s circulating medium, flows successively through the ECO1, ECO2, screen, and furnace water walls. The water flows from the top to the bottom in both the screen and ECO2 (for each section). In the rest of the boiler, water circulation is carried out from the bottom up. The boiler is about 8 m high. Figure 3 shows the destruction of the first rows of the ECO2.3 section. A distinctive feature of the boiler is its modular design and small water capacity of 34.4 m3. Such a design makes it possible to perform quick start-ups and shutdowns of the power plant. The boiler employs two burners with a power output of 68.5 MW each. For this arrangement, the power ramping-up process of the boiler may result in a rapid increase in flue gas temperature, which may consequently lead to an increase in the pipe wall temperature of both the festoon and economizer 2 (ECO2) above the permissible temperatures.
If the heat flow rate on the heated surface of the pipe becomes too high, nucleate boiling turns into film boiling [28,29]. This leads to the formation of a vapor layer across the entire inner surface of the tube, insulating it from the coolant. Consequently, there is a sudden elevation in the pipe wall temperature. This phenomenon can swiftly lead to pipe failure due to inadequate cooling. The phenomenon of nucleate boiling and film has been studied for many years. However, it has not been sufficiently described to date [30]. Current mathematical models do not encompass the impact of bubble formation on the flow and temperature distribution. Attempts are presently being made to simulate these phenomena through numerical methods [26,31], but an accurate model is yet to be developed. Consequently, there is a dearth of simple calculation methods (standards) that designers can use to predict the potential occurrence of such phenomena during the design of boilers and power equipment [32]. In the scope of this research, the inability to model boiling stood as a notable limitation. The model, which incorporated a thin vapor layer, merely highlighted the pipes’ incapability to cool properly, resulting in overheating and eventual failure.
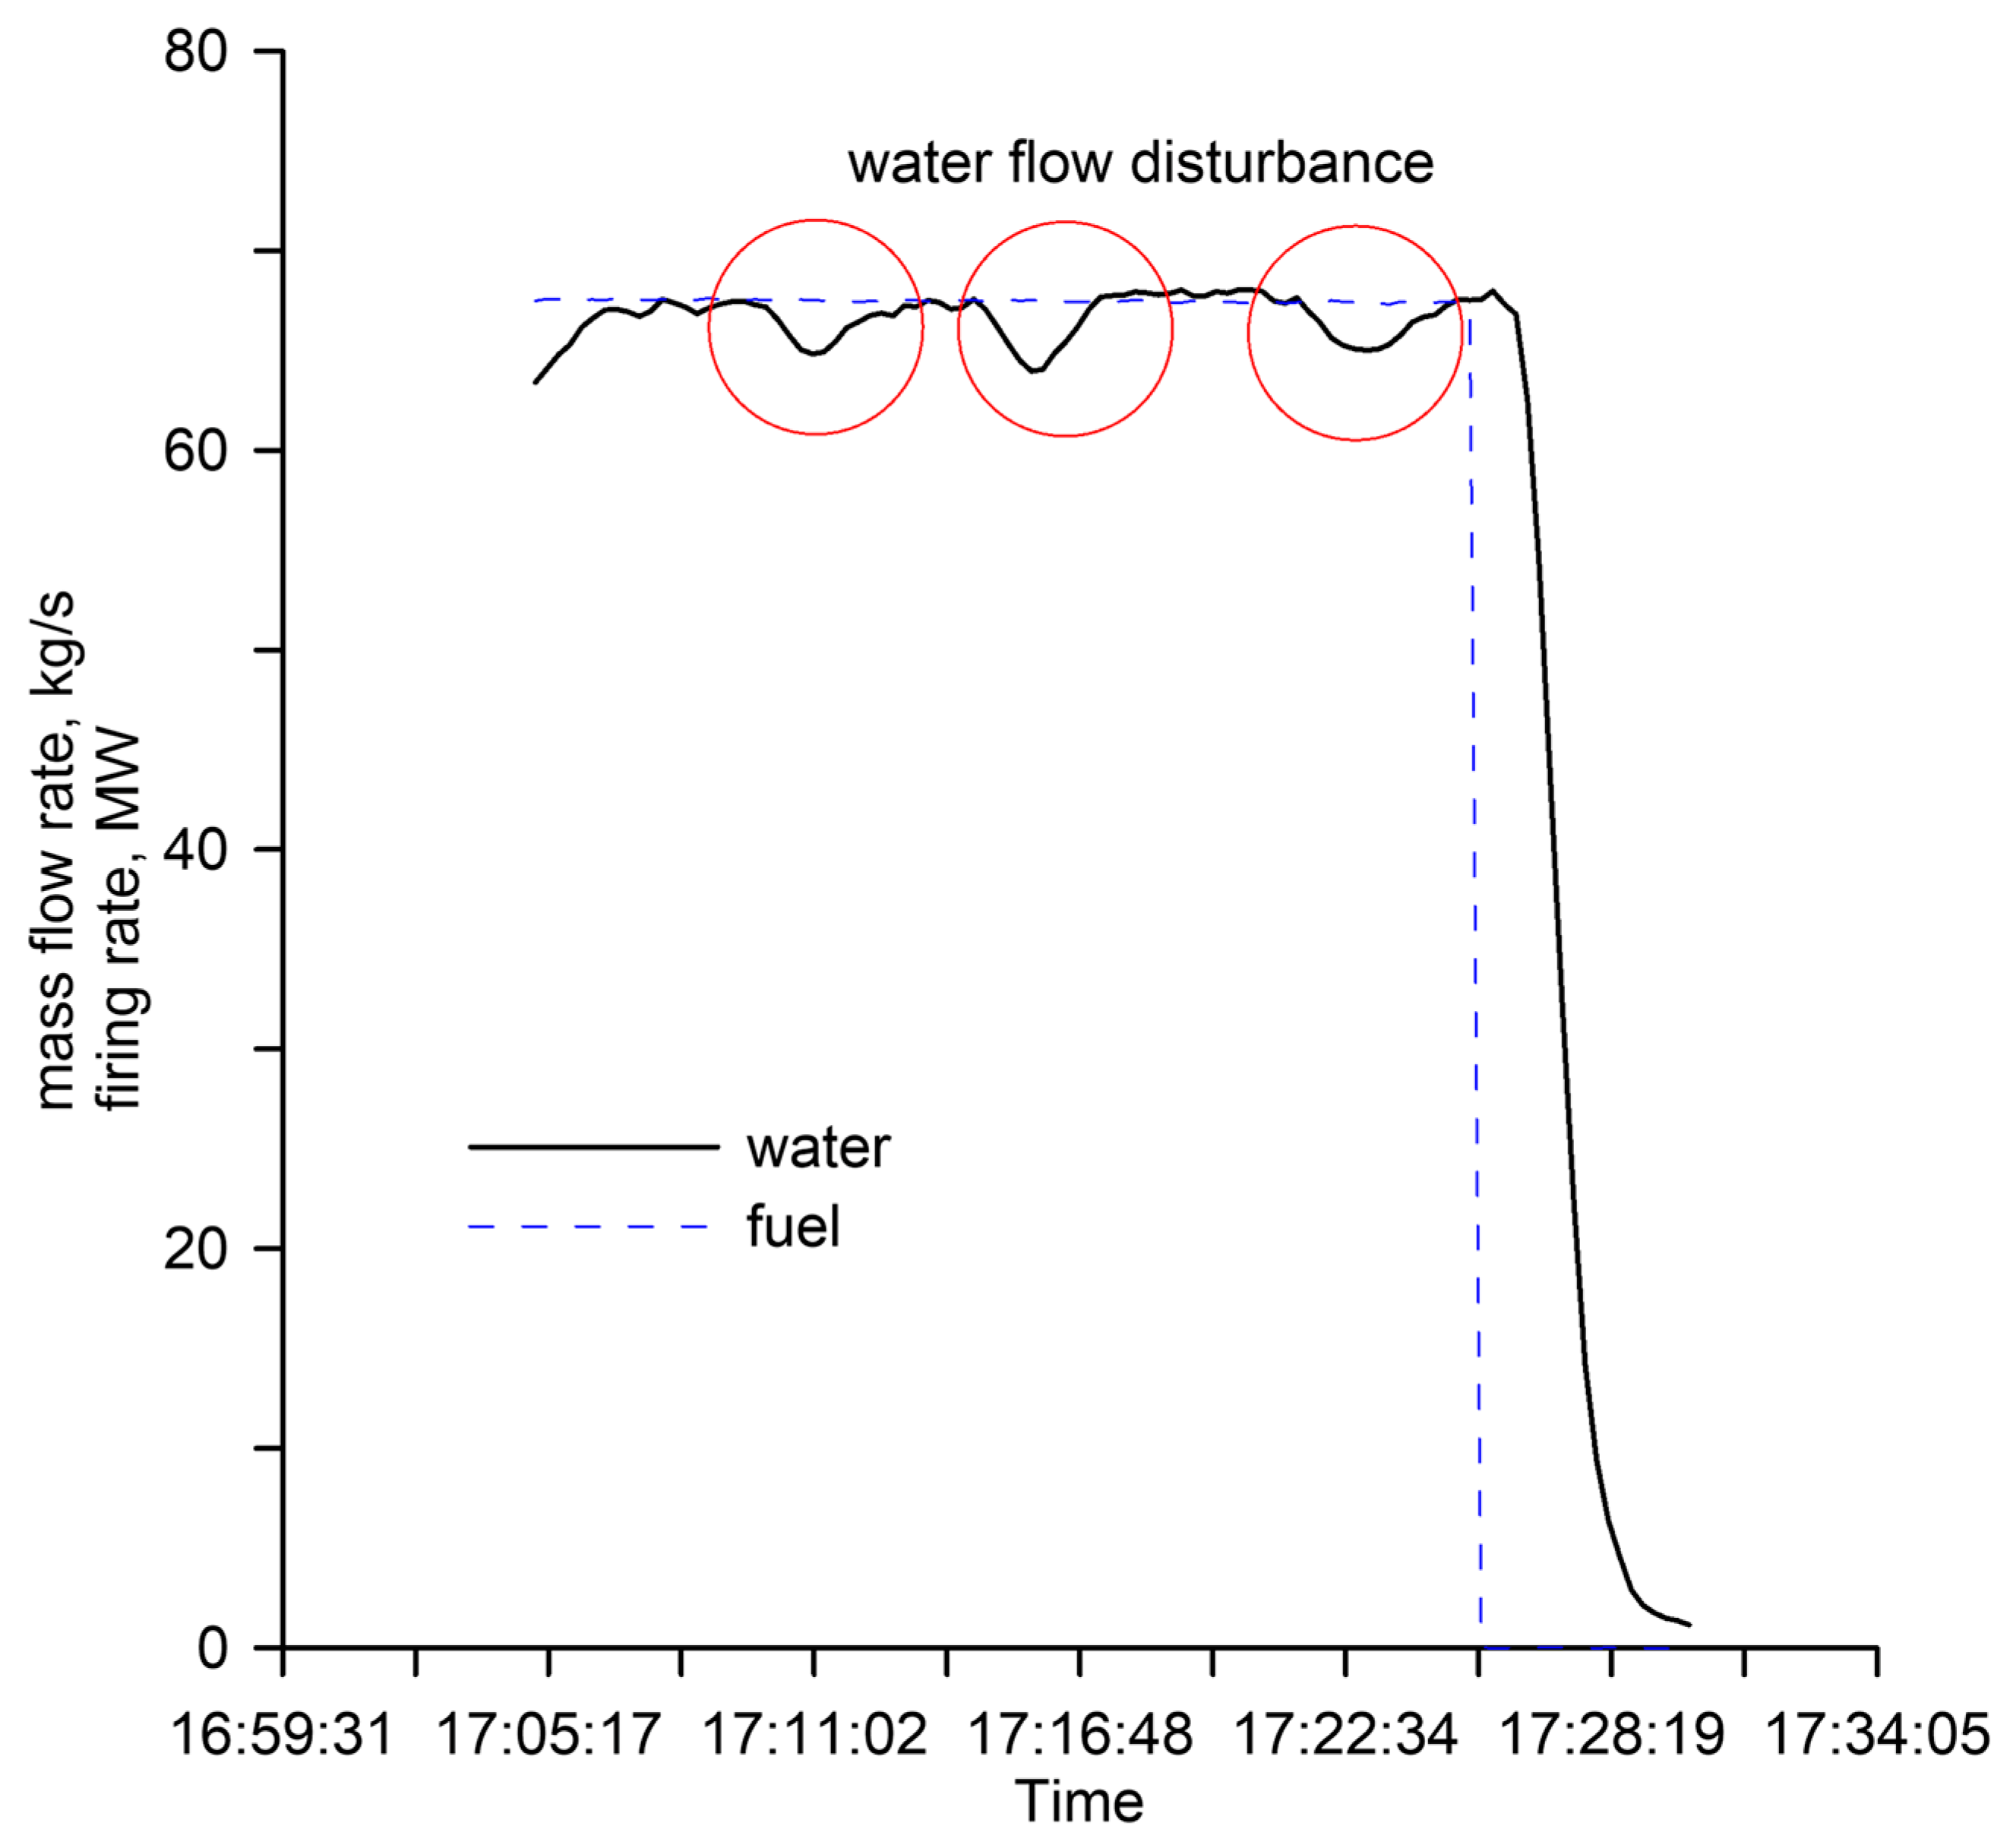
During boiler operation, selected boiler operating parameters were transmitted to the data acquisition system. Analyzing the boiler water flow rate measurements was the first step in identifying the possible causes of boiler failure. Figure 4 illustrates the disturbance in the water flow behind ECO2, which occurred just before the boiler failure. Due to a pipe burst, the safety control system shut down the boiler by cutting off the fuel supply. The failure took place at the minimum boiler load. Providing a definite explanation for this phenomenon is not straightforward. The most likely scenario involved the formation of film boiling at the tube’s wall, coupled with a rapid change in the density of the heated water flowing through the line. The emergence of evaporation would lead to an increase in flow resistance. It is important to highlight that the water flow in ECO2 is directed out from the top to the bottom of the heat exchanger. The lower water density in the lower parts of the heater hinders the flow. Furthermore, the occurrence of gases emitted from the water when increasing the temperature of the water in the heating system and the boiler (if they occur) would further strengthen the process of water flow inhibition. This might even result in a complete stoppage of water mass flow [1].

3. Methodology

The investigation relied on CFD modeling and strength analysis using FEM (Finite Element Method). For this purpose, commercial ANSYS software was used. First, the 3D model of the repetitive part of the ECO2 was developed (Figure 5). The ECO2 water heater is composed of three sections:
  • ECO2.1—the coldest section located at the back of the water heater;
  • ECO2.2—the middle section;
  • ECO2.3—the hottest section located on the hot flue gas inlet side.
Figure 5. Repeatable part of the ECO2 water heater used in CFD modeling.
Energies 16 06278 g005
Each section comprises two staggered rows of finned pipes, with 48 pipes in each row. The combustion chamber is situated behind the burners and in front of the ECO2, and it was fully incorporated into the 3D model. The subsequent phase of the research involved creating an appropriate mesh. The relevant boundary layer was established, with the dimensionless parameter ‘y+’ equating to one [33]. Discretization is imperative due to the significant impact of discretization errors on the simulation outcomes. Prior to the investigation, a grid independence study was conducted. The mesh independence test demonstrated that a higher number of elements does not notably affect the simulation results. With 7,299,392 elements, the alteration in the relative flue gas bulk temperature behind ECO2 is less than 0.5%, as depicted in Figure 6. Table 1 outlines the quality of the finite elements. All mesh criteria were satisfied, with no more than 1% of poor-quality elements. The chosen discrete model was validated for subsequent research. The flue gas temperature in the combustion chamber was 986 °C. The simulation results, including the flue gas temperature after the water heater, and the water temperature at the outlet of the water heater, aligned with the boiler’s operating parameters. These simulations were compared with data from the boiler’s data acquisition system, prior to the failure. The following boundary conditions were assumed in the modeling. At the inlet to the combustion chamber, the mass flow rate of the flue gas resulting from the fuel fed for combustion was determined. The flue gas had a specified composition, and its temperature was derived from data recorded by the acquisition system. In the case of water inlet boundary condition, a mass flow rate was set. This was derived from the amount of water flowing through the entire exchanger.
As for outlet boundary conditions for both flue gas and water, a pressure outlet was applied. The modeling took into account radiation (using the P1 model) from the flue gas side [34] to the heating surfaces of the boiler. Turbulence was also considered in the modeling. The SST model was applied for the flue gas, while the k-epsilon model was used for water. The surfaces enclosing the model on the left and right were treated as symmetrical boundaries. Thermal-fluid calculations were performed for 100% boiler capacity. Two cases were analyzed: the first considered only water flowing inside the pipe, and the second accounted for the presence of a vapor film at the pipe wall. The obtained temperature fields were employed in the thermal-strength analysis. The strength analysis included the distribution of longitudinal, circumferential, and Huber–Mises–Hencky Equivalent (HMH) stresses for the first row of ECO2 tubes. Both simulations consider the materials’ varying (as a function of temperature) properties. Strength calculations took into account the free expansion and bending of the pipe. The analysis made it possible to determine the creep strength of the material and its lifetime under the given conditions.

4. Thermal-Flow Analysis of the Water Heater ECO2

The individual pipe rows of the water heater ECO2 are made up of tubes with an external diameter dout = 42.4 mm and wall thickness g = 2.6 mm. The tubes are helically finned. The height of the fin is h = 12 mm, and its thickness is tfin = 1 mm. The fin pitch is s = 12.5 mm for the first and second tube rows on the flue gas inlet side (ECO section 2.3). The fin pitch for the third and fourth tube rows belongs to economizer section 2.2 is s = 8.3 mm. The fin pitch for the fifth and sixth pipe belongs to economizer section 2.1 is s = 4 mm. The tube steel material is P235GH, while the fins are made of DC04 steel.

4.1. Analysis Considering Only Water Flow inside ECO2 Tubes

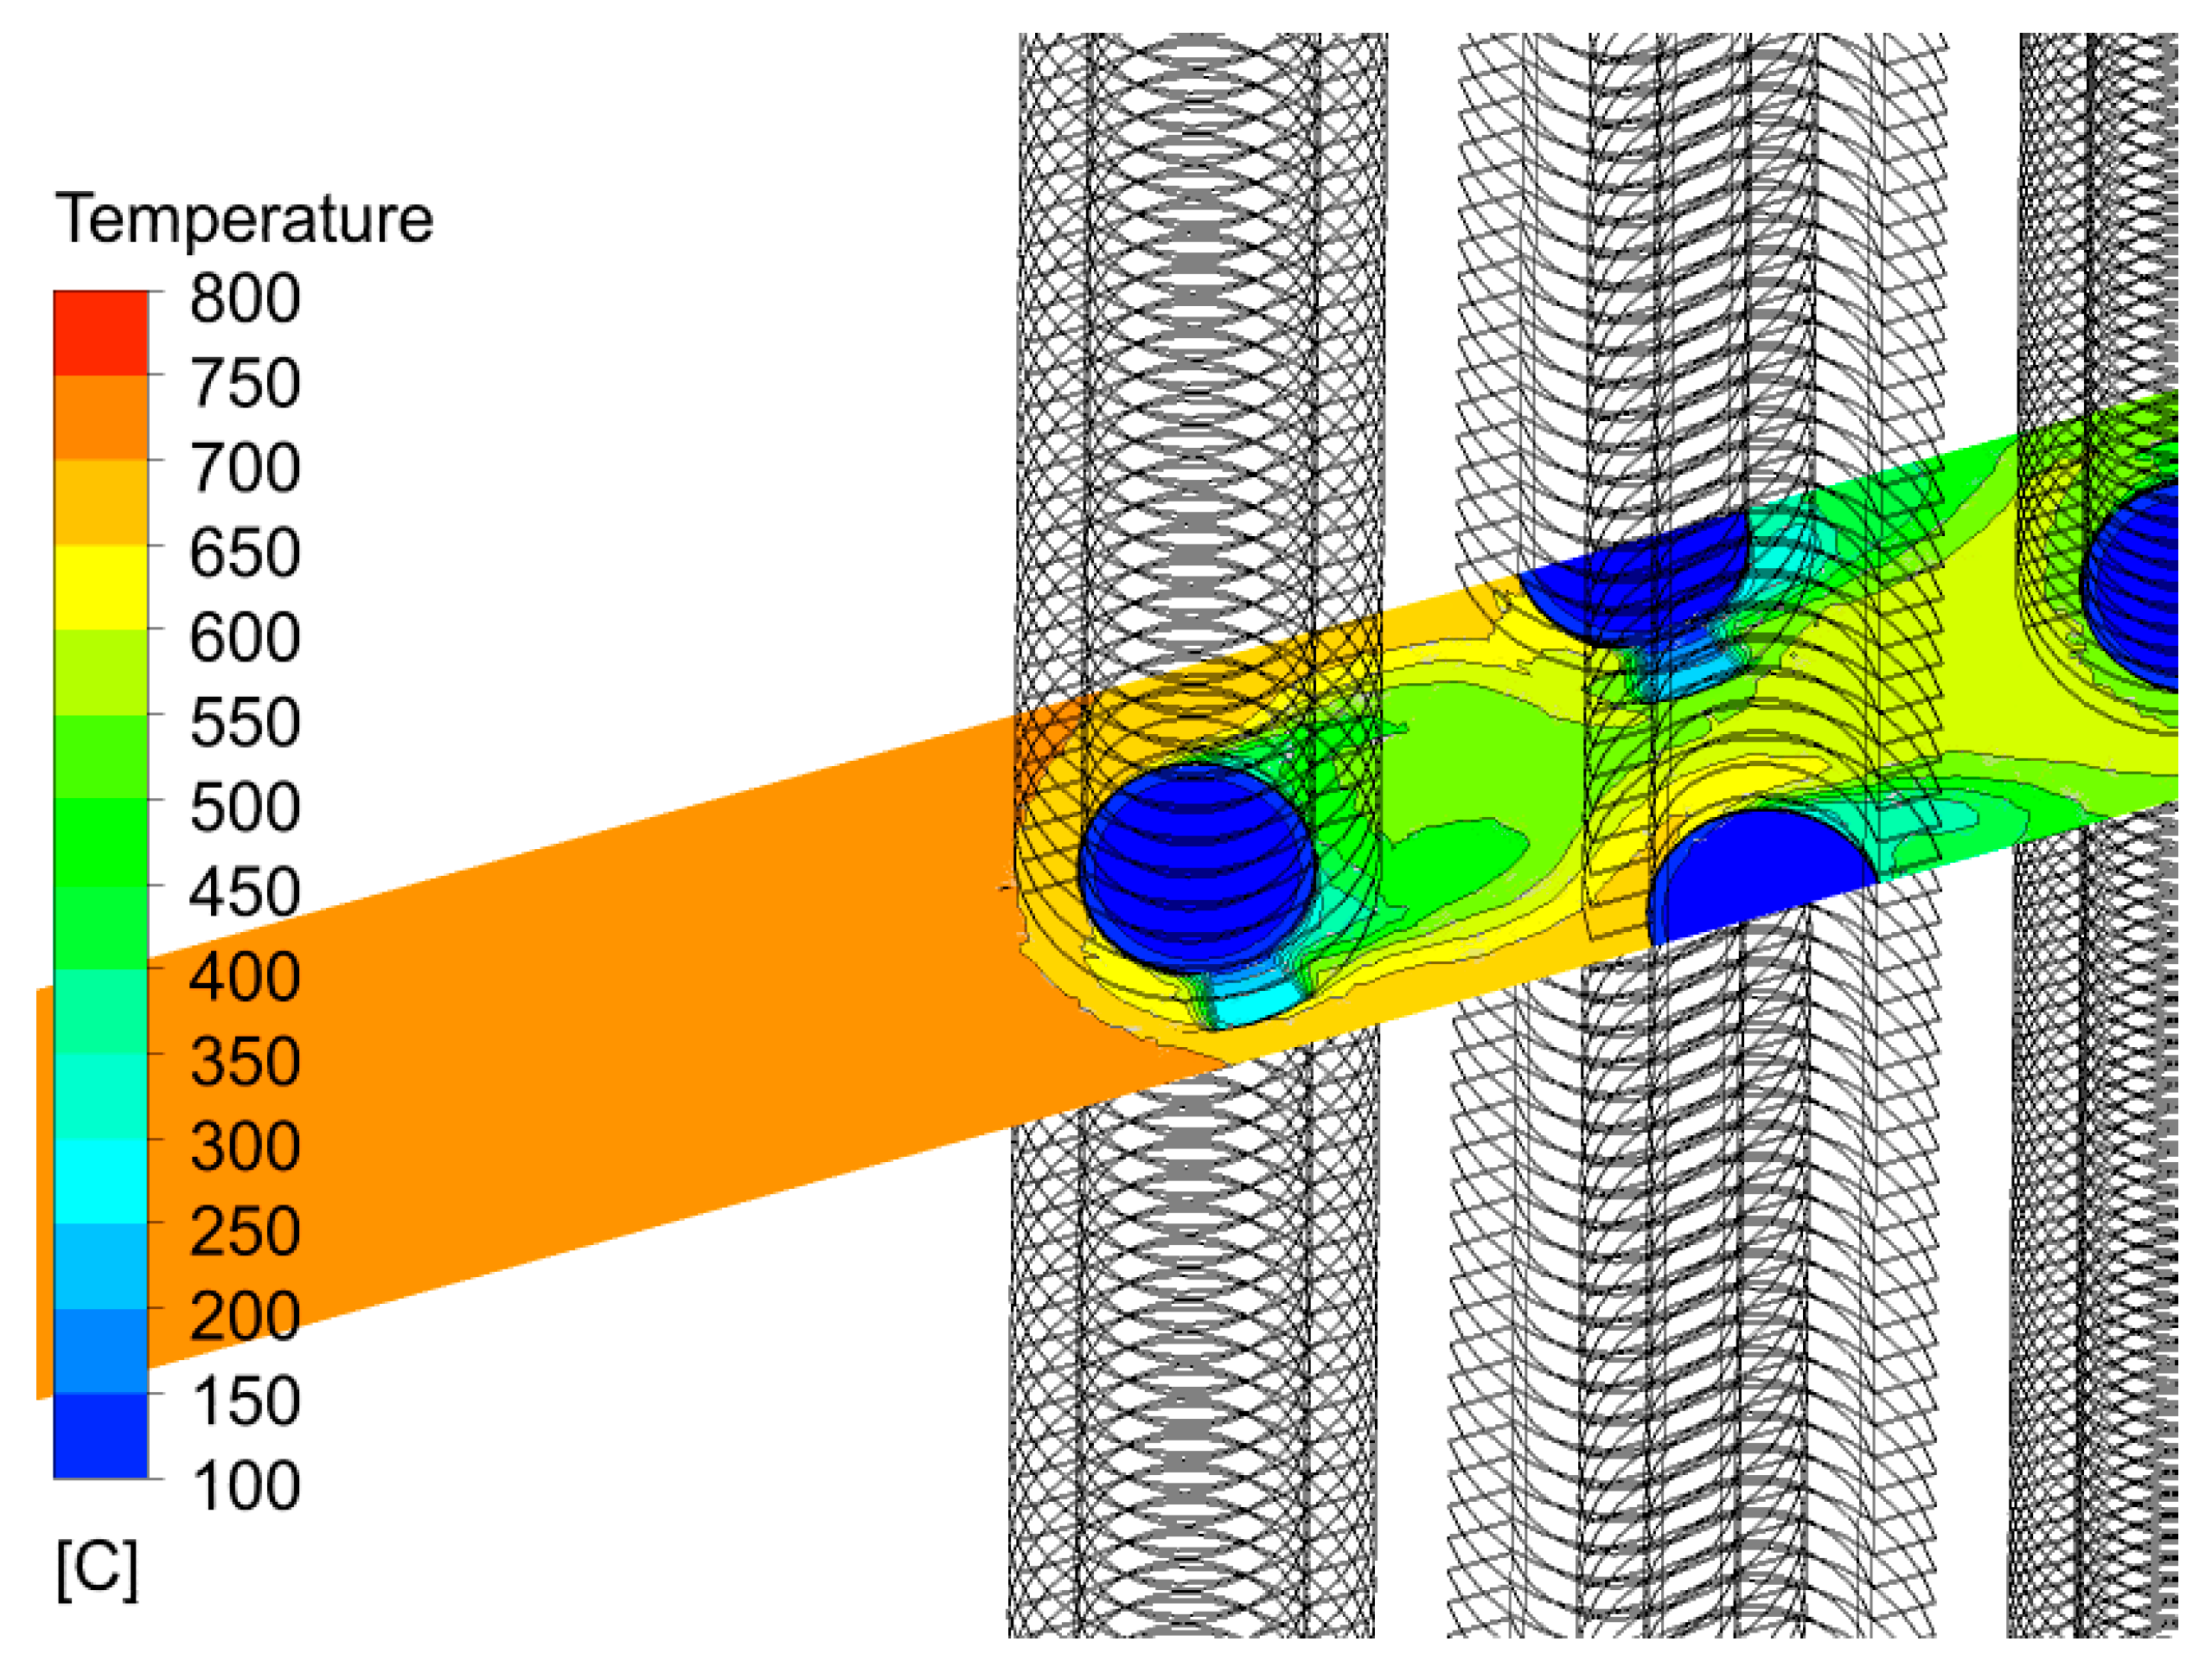
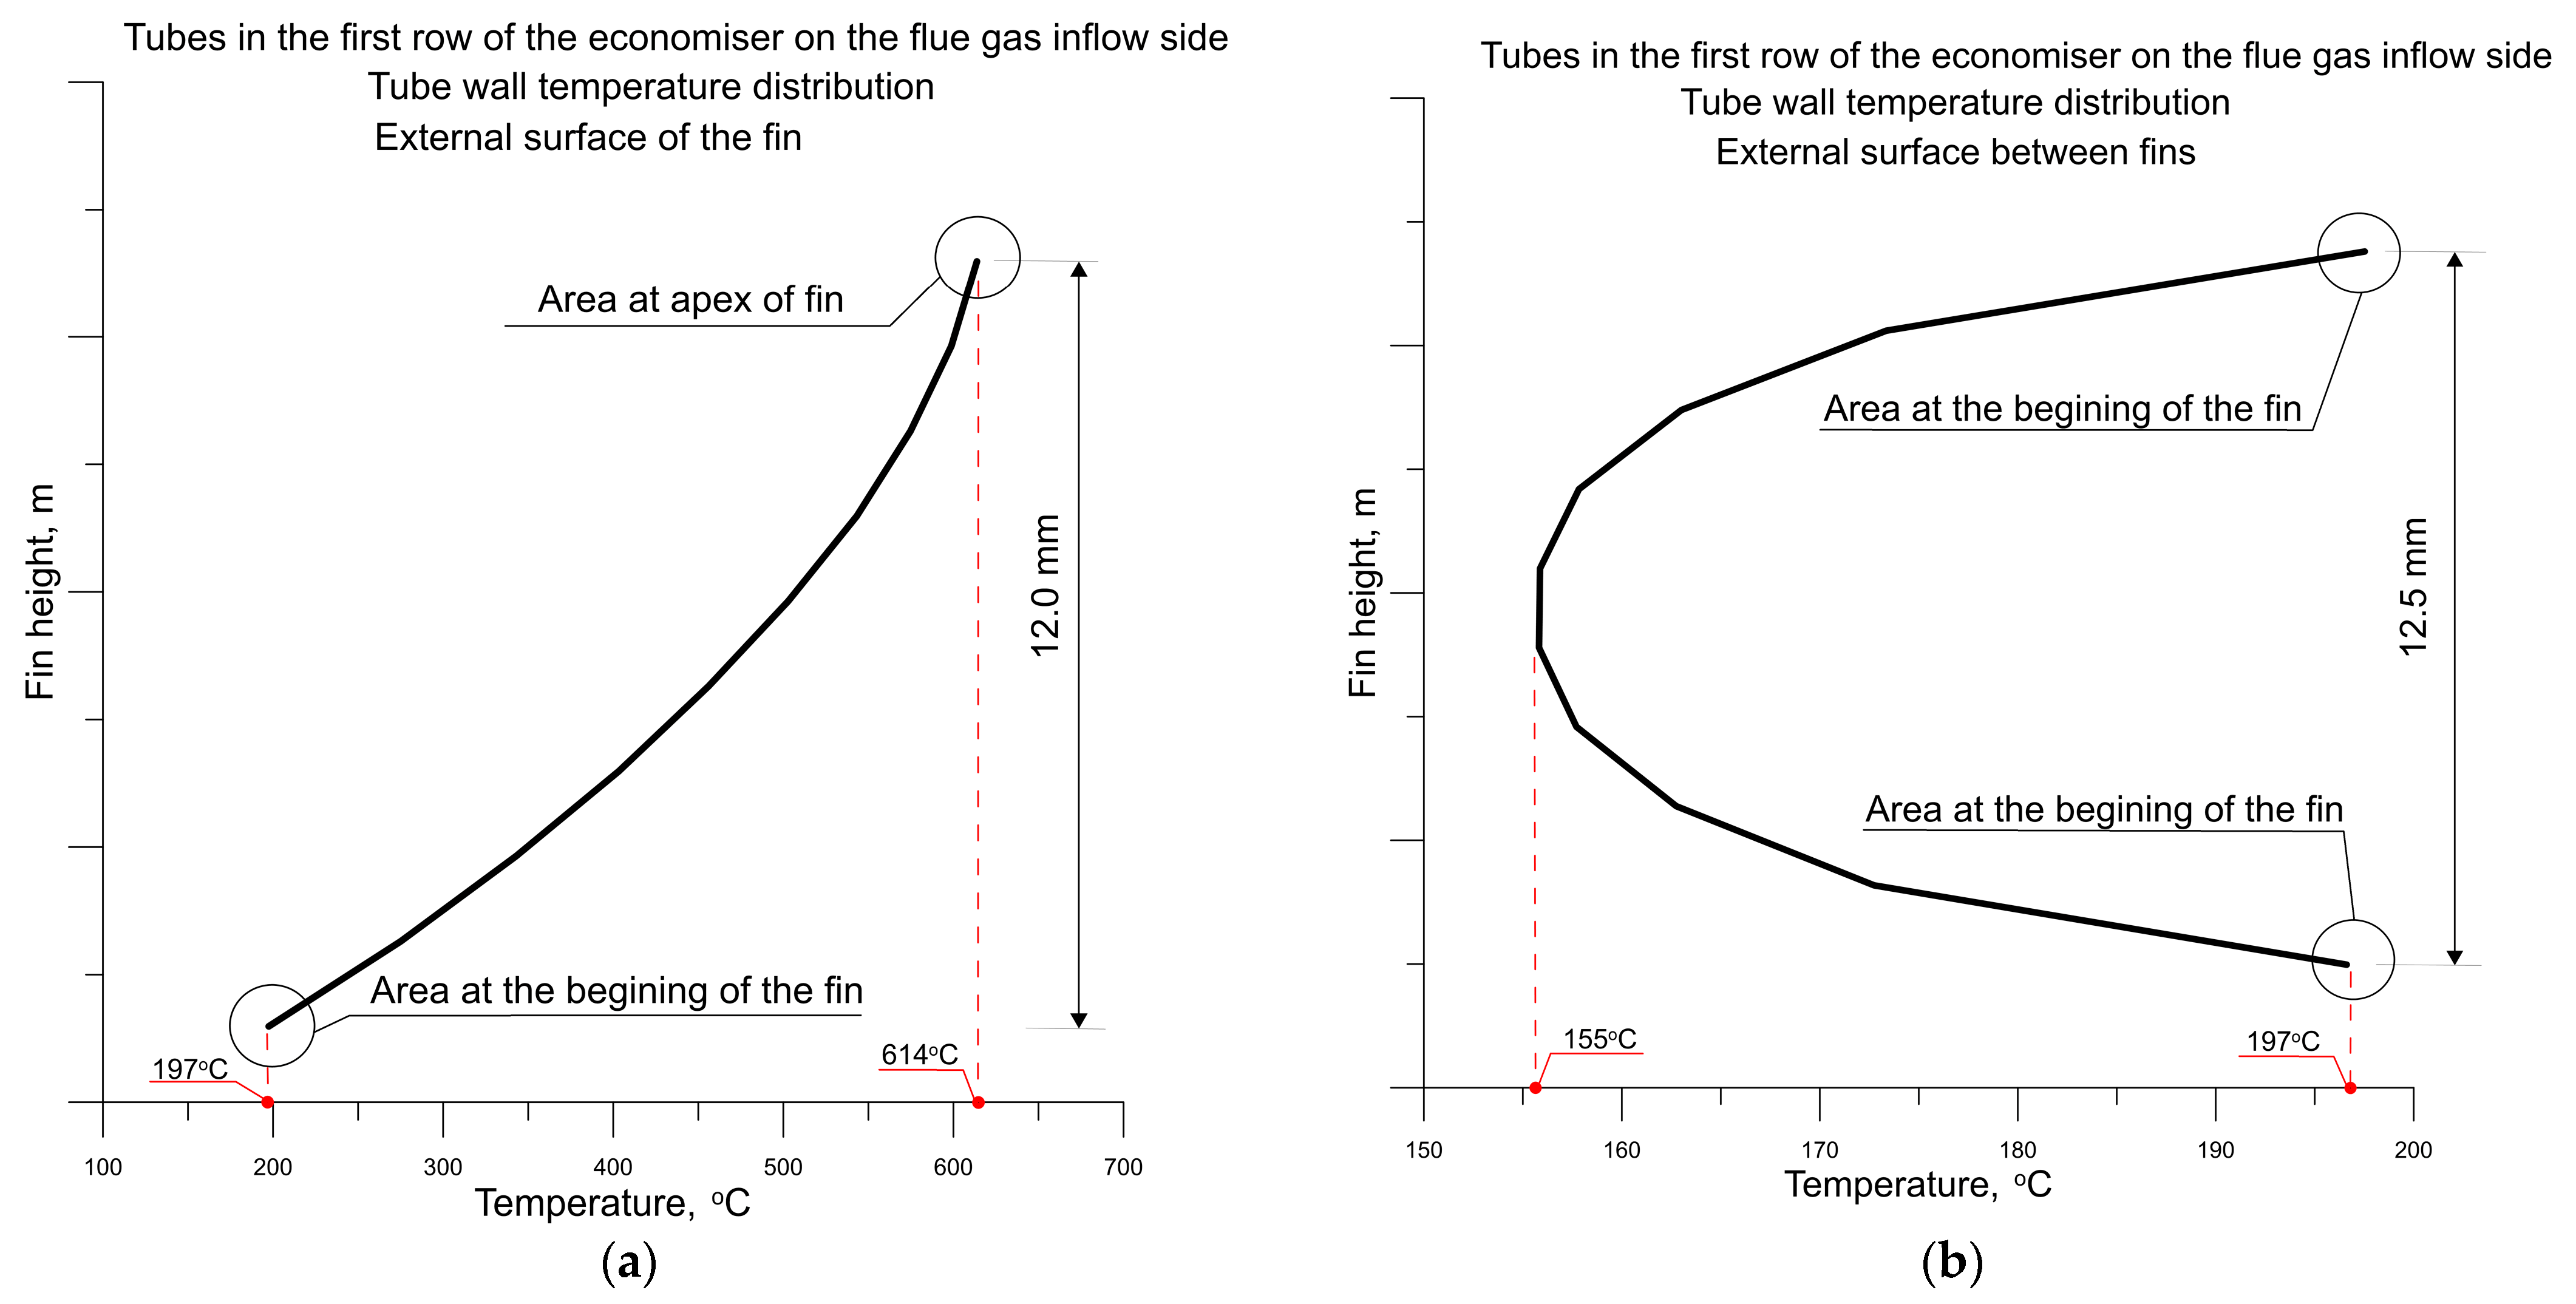
The first part of the analysis was performed for a situation in which the water mass flow inside the tubes of the second-stage economizer (ECO2) is as designed, and there is no vapor layer inside the tube at the wall on the flue gas inlet side. Performed CFD simulations show the huge effect of radiation on the operating temperatures of the first rows of tubes on the inlet side of the flue gas. Figure 7 shows temperature distribution across the first, second, and third row of the ECO2. When operating at full boiler load, the temperature at the uppermost part of the fins reaches 614 °C (Figure 8a). This temperature significantly surpasses the allowable limit for the steel used in the fins. As we move down the height of the fins, the wall temperature gradually decreases, eventually reaching 197 °C at the base. This results in a temperature drop of ΔT = 417 °C over a 12 mm section, equivalent to the height of the fins. The temperature of the outer surface of the pipe wall between the fins also peaks at the inlet side of the flue gas. The temperature change is parabolic (Figure 8b). The highest temperature on the inter-fin surface is reached at the base of the fin and is 197 °C. The lowest temperature value point is located in the middle of the fin pitch (155 °C).
An important fact is the temperature distribution of the fin wall along its perimeter. Figure 9a shows the temperature distribution of the fin at its top (where the maximum values are reached) along the perimeter for one pitch. It can be observed that in the case of the first row counting from the inlet side of the flue gas, the temperature variation is very high. In the front part, the temperature changes of the fin wall at the top are in the range of 375 °C up to 614 °C. The rear, shielded part of the fin is operating at much lower temperatures, ranging from 226 °C to 375 °C. The temperature difference at the circumference of the fin is 388 °C. Such a high-temperature difference is the reason for high stresses in the pipe wall. High compression stresses in the fin on the inlet side of the flue gas cause high tensile stresses in the pipe wall. If the pipe is operated with a wall temperature close to the allowable temperature for the material used, this will cause very rapid failure (rupture). The maximum heat flux value on the pipe’s inner surface occurs under the fin and is 542,700 W/m2, while the lowest value appears in the center of the inter-fin space (Figure 9b). Both heat flux values are very high. It is expected that film boiling of water (Type I boiling crisis) will occur on the pipe’s inner surface on the inflow side of the flue gas. In the second row of tubes on the inflow side of the flue gas, the effect of radiation is already much more minor. According to the CFD simulation, when the boiler operates at full load, the top of the fins reaches a temperature of 321 °C (Figure 10a). Moving down the height of the fins, the wall temperature decreases, reaching 145 °C at the base. Over a 12 mm section (the height of the fins), there’s a temperature drop of ΔT = 176 °C. Additionally, on the outer surface of the tube wall between the fins, the highest temperatures are observed on the side where the flue gas flows in (Figure 10b). The warmest point on the surface between the ribs is found at the base of the fin and registers at 145 °C. The lowest temperature is recorded in the middle of the rib pitch, measuring 126 °C. Figure 11 shows the temperature and heat flux changes of the finned tube in the second row on the inflow side of the flue gas. The temperature changes are shown at the apex of the fin at the periphery (where the maximum values are reached) for one pitch. In the front part, the temperature changes of the fin wall at the apex range from 265 °C to 321 °C.
The rear section of the fin, which is shielded from direct exposure, operates at comparatively lower temperatures, typically ranging between 214 °C and 265 °C. This results in a temperature difference of 107 °C around the perimeter of the fin (see Figure 11a). Notably, tubes in the second row, starting from the side where flue gas enters, benefit from more favourable operating conditions. These tubes are obscured by the first row of tubes, significantly reducing the impact of radiation. Importantly, the maximum temperature reached on both the pipe wall and the fin remains within a safe range, below the permitted temperature for the materials they are constructed from. Regarding heat flux, the maximum value at the pipe’s inner surface occurs beneath the fin and amounts to 254,500 W/m2, while the lowest value is located at the center of the space between the ribs, measuring 184,000 W/m2 (as depicted in Figure 11b). These values are more than twice as small as those for first-row tubes, owing to the minor influence of radiation on the heat transfer process.
In the third row of pipes, counting from the flue gas inflow side, the effect of radiation is negligible. Therefore, a smaller fin pitch was applied, s = 8.3 mm. Operating at 100% boiler load, the uppermost portions of the fins achieve a temperature of 281 °C (Figure 12a). As we traverse down the height of the ribs, the wall temperature steadily diminishes, ultimately registering 139 °C at the base. Over a 12 mm section, equivalent to the height of the ribs, there’s a temperature drop of ΔT = 142 °C. Notably, the outer surface of the pipe wall between the fins reaches its peak temperatures at the inlet side of the flue gas. The temperature variation follows a parabolic pattern (see Figure 12b).
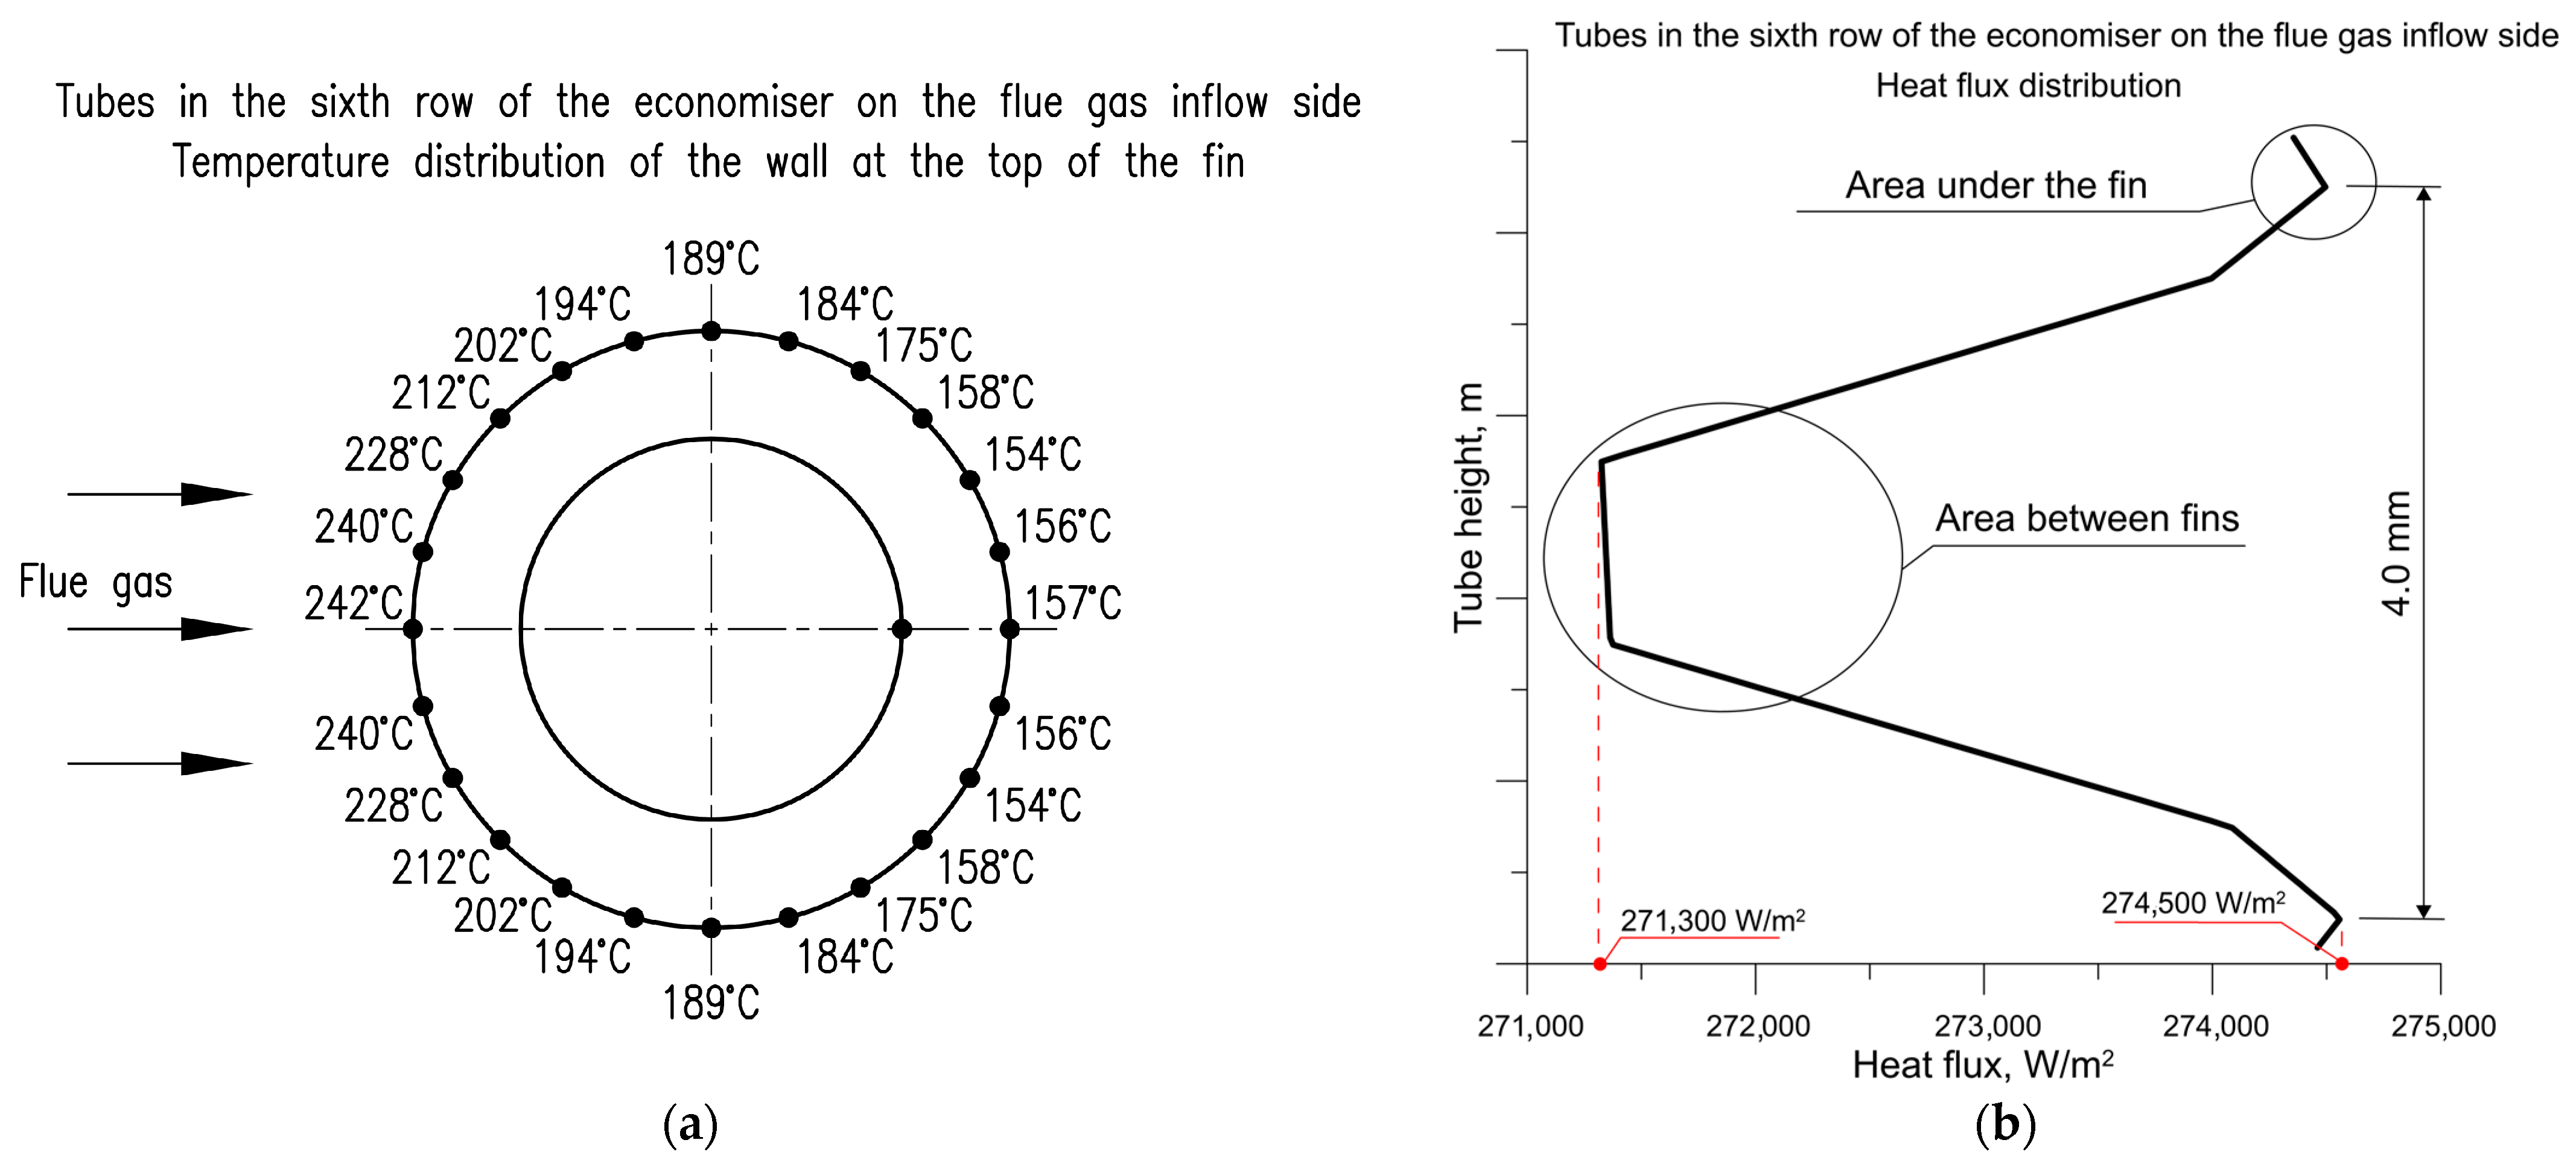
On the surface between the fins, the warmest point is at the base of the fin, where the temperature reaches 139 °C. Conversely, the coolest spot is found in the middle of the rib spacing, registering at 127 °C. Temperature changes occur over a small range. Figure 13 shows the temperature changes of the tube fin in the third row on the inflow side of the flue gas. The temperature changes are shown at the apex of the fin at the periphery (where the maximum values are reached) for one pitch. In the front section, the temperature variations across the fin wall at the highest point range from 241 °C to 280 °C. Meanwhile, in the rear section of the fin, which is shielded from direct exposure, temperatures range from 180 °C to 241 °C. This results in a temperature difference of 100 °C around the perimeter of the fin. It can be observed that the pipes in the third row, starting from the inflow side of the flue gas, work under better conditions than the earlier rows. These pipes are obscured by the lines of the first and second rows, which significantly reduces the impact of radiation. The maximum temperature reached on the wall of the pipe and the rib is in a safe range, below the temperature allowed for the material from which they are made. Figure 14 shows the variation in heat flux on the inner surface of the pipe at the inlet side of the flue gas (third row). The highest heat flux density on the inner surface of the pipe is located beneath the rib and measures 237,800 W/m2, while the smallest value is found between the fins. Since the preceding rows completely overshadow rows IV, V, and VI, radiation has little effect on the heat transfer process. Heat exchange here occurs mainly by convection. In the last row of the ECO2, the fin pitch is 4 mm. Operating at 100% boiler load, the uppermost regions of the fins attain a temperature of 242 °C (Figure 14a). Progressing down the height of the ribs, the wall temperature gradually decreases, approaching 141 °C near the base. Over a 12 mm section, equivalent to the rib height, there’s a temperature drop of ΔT = 101 °C. The highest temperature on the surface of the pipe is reached at the base of the fin and is 140.8 °C (Figure 14b). The point with the lowest temperature value is located be-tween the fins (136.4 °C). Temperature changes occur over a small range. In the case of temperature variations along the circumference of the rib, it was noted that in the last row of ECO2, they are small, ΔT is 88 °C (Figure 15a). The maximum heat flux density on the pipe’s inner surface occurs under the fin and is 274,500 W/m2, while the smallest value occurs between the fins (Figure 15b). The heat flux density value increases due to the fin pitch used, which is 4 mm. The number of fins is two times that of ECO2.2. The heat transfer area is therefore increased. Table 2 summarizes the temperatures and heat flux for the operation of the water heater ECO2 at 100% boiler capacity.

4.2. Analysis Considering Film Boiling of Water (Boiling Crisis of the First Kind)

As part of the carried-out CFD simulations, the distribution of heat flux density on the inner surface of the pipe on the inlet side of the flue gas was determined. The maximum heat flux density values on the pipe’s inner surface were observed under the fin: 542,700 W/m2, and the minimum, between the fins: 396,300 W/m2. Both values are very high. It is expected that the film boiling of water (a Type I boiling crisis) will occur on the pipe’s inner surface on the inlet side of the flue gas. If the temperature difference between the wall and the water is small, the boiling is calm. If the difference increases, a permanent vapor membrane may form, separating the heating surface of the pipe from the boiling liquid [34]. The vapor layer was modeled around the entire circumference of the tube. The developed numerical model considered heat transfer from the flue gas through the helically finned tube and a thin layer of steam to the water. The geometric model used in the calculations encompassed a section of the economizer pipe covering one pitch of the finned pipe. On the inside of the pipe, the water flow was modeled. The water temperature at the inlet to the modeled volume was taken as the average temperature at half the length of ECO2. It’s worth adding that, due to the high water flow in the ECO2 pipes, the temperature rise of the working medium along the length of the pipe, de-pending on the boiler load, was approximately 10 K. A boundary condition of the third kind was set on the outer surface of the line and the fin. An equivalent heat transfer coefficient was determined for the flue gas, considering the finned pipe [35], and the assumed flue gas temperature was derived from CFD modeling. The heat transfer process was modeled by heat conduction only through the vapor layer. This also verified the effect of the wall metal and fin’s temperature field on the temperature of super-heated steam. The analysis of the calculation (Figure 16) shows that even a very thin vapor layer of 0.1 mm causes a sharp increase in the fin temperature by more than 200 °C.
An increasing thickness of the vapor film causes a further increase in the temperature of the fin. If the vapor’s temperature increases, the fin’s temperature decreases. This is due to the rise in the thermal conductivity coefficient of superheated steam. Similar conclusions can be drawn after analyzing the results for the pipe wall. Even the thinnest layer of vapor causes a considerable temperature to increase in the pipe wall (which also depends on the amount of superheated steam).

5. Strength Analysis of Water Heater ECO2 Pipes

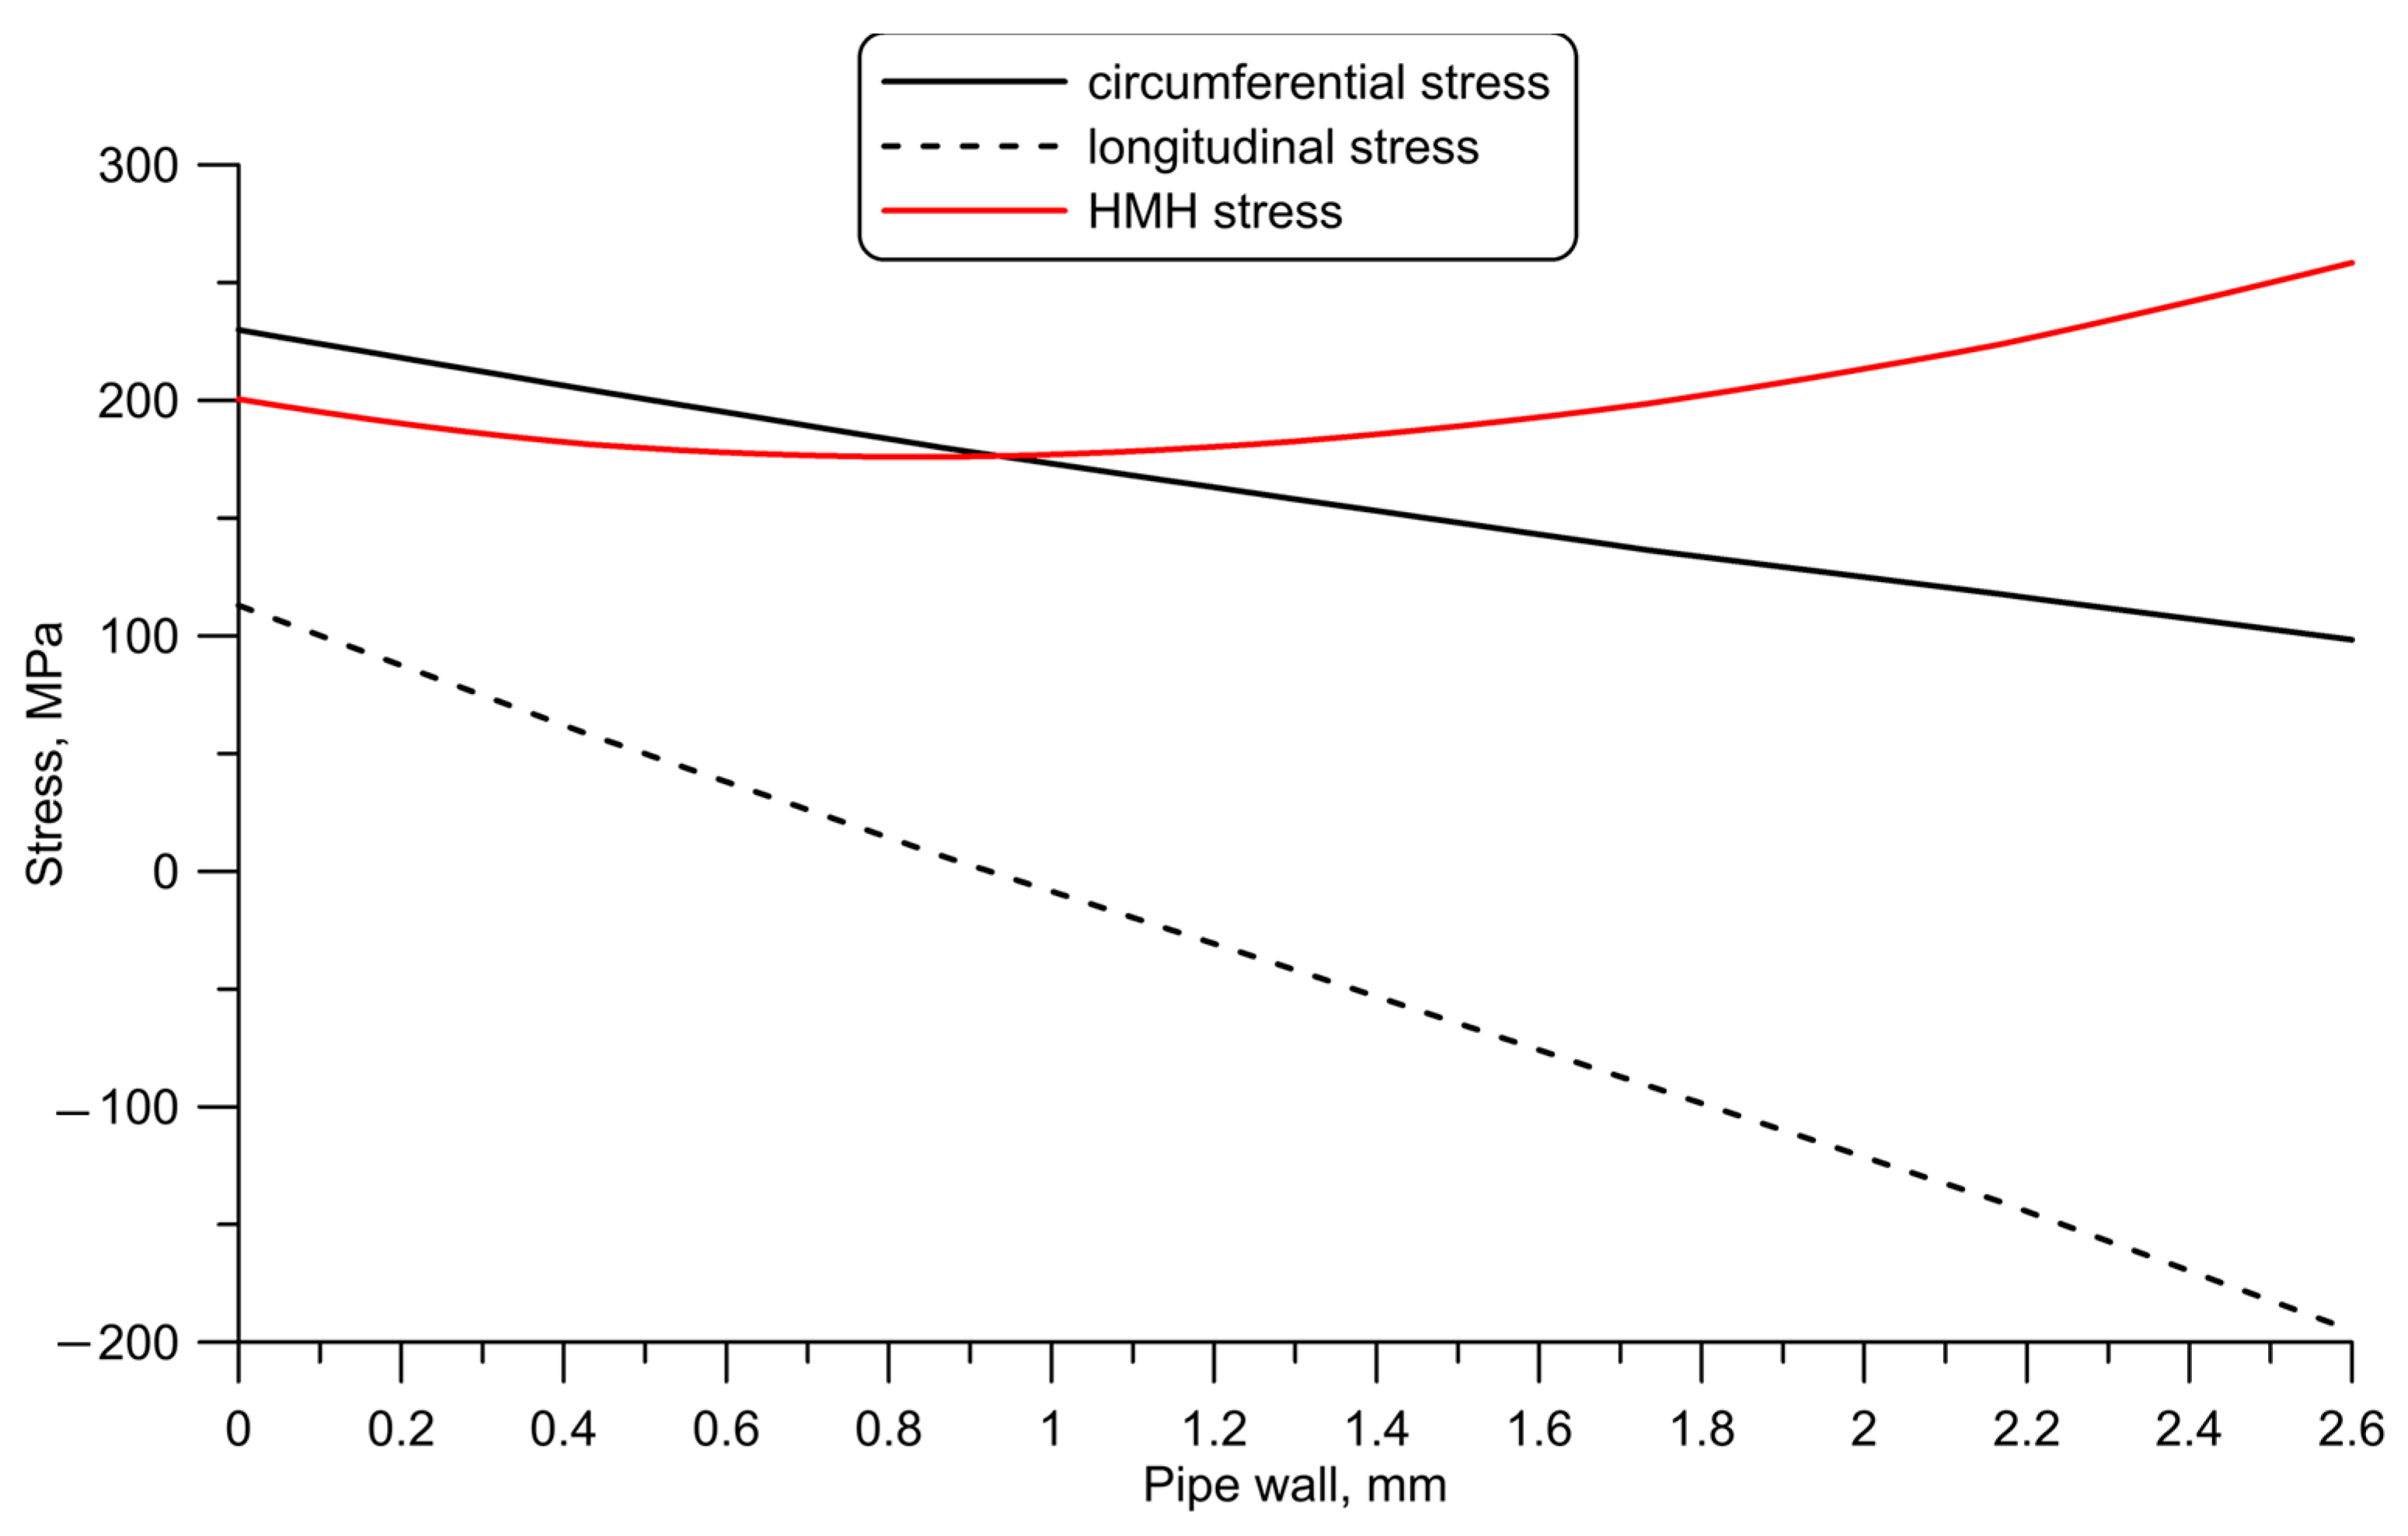
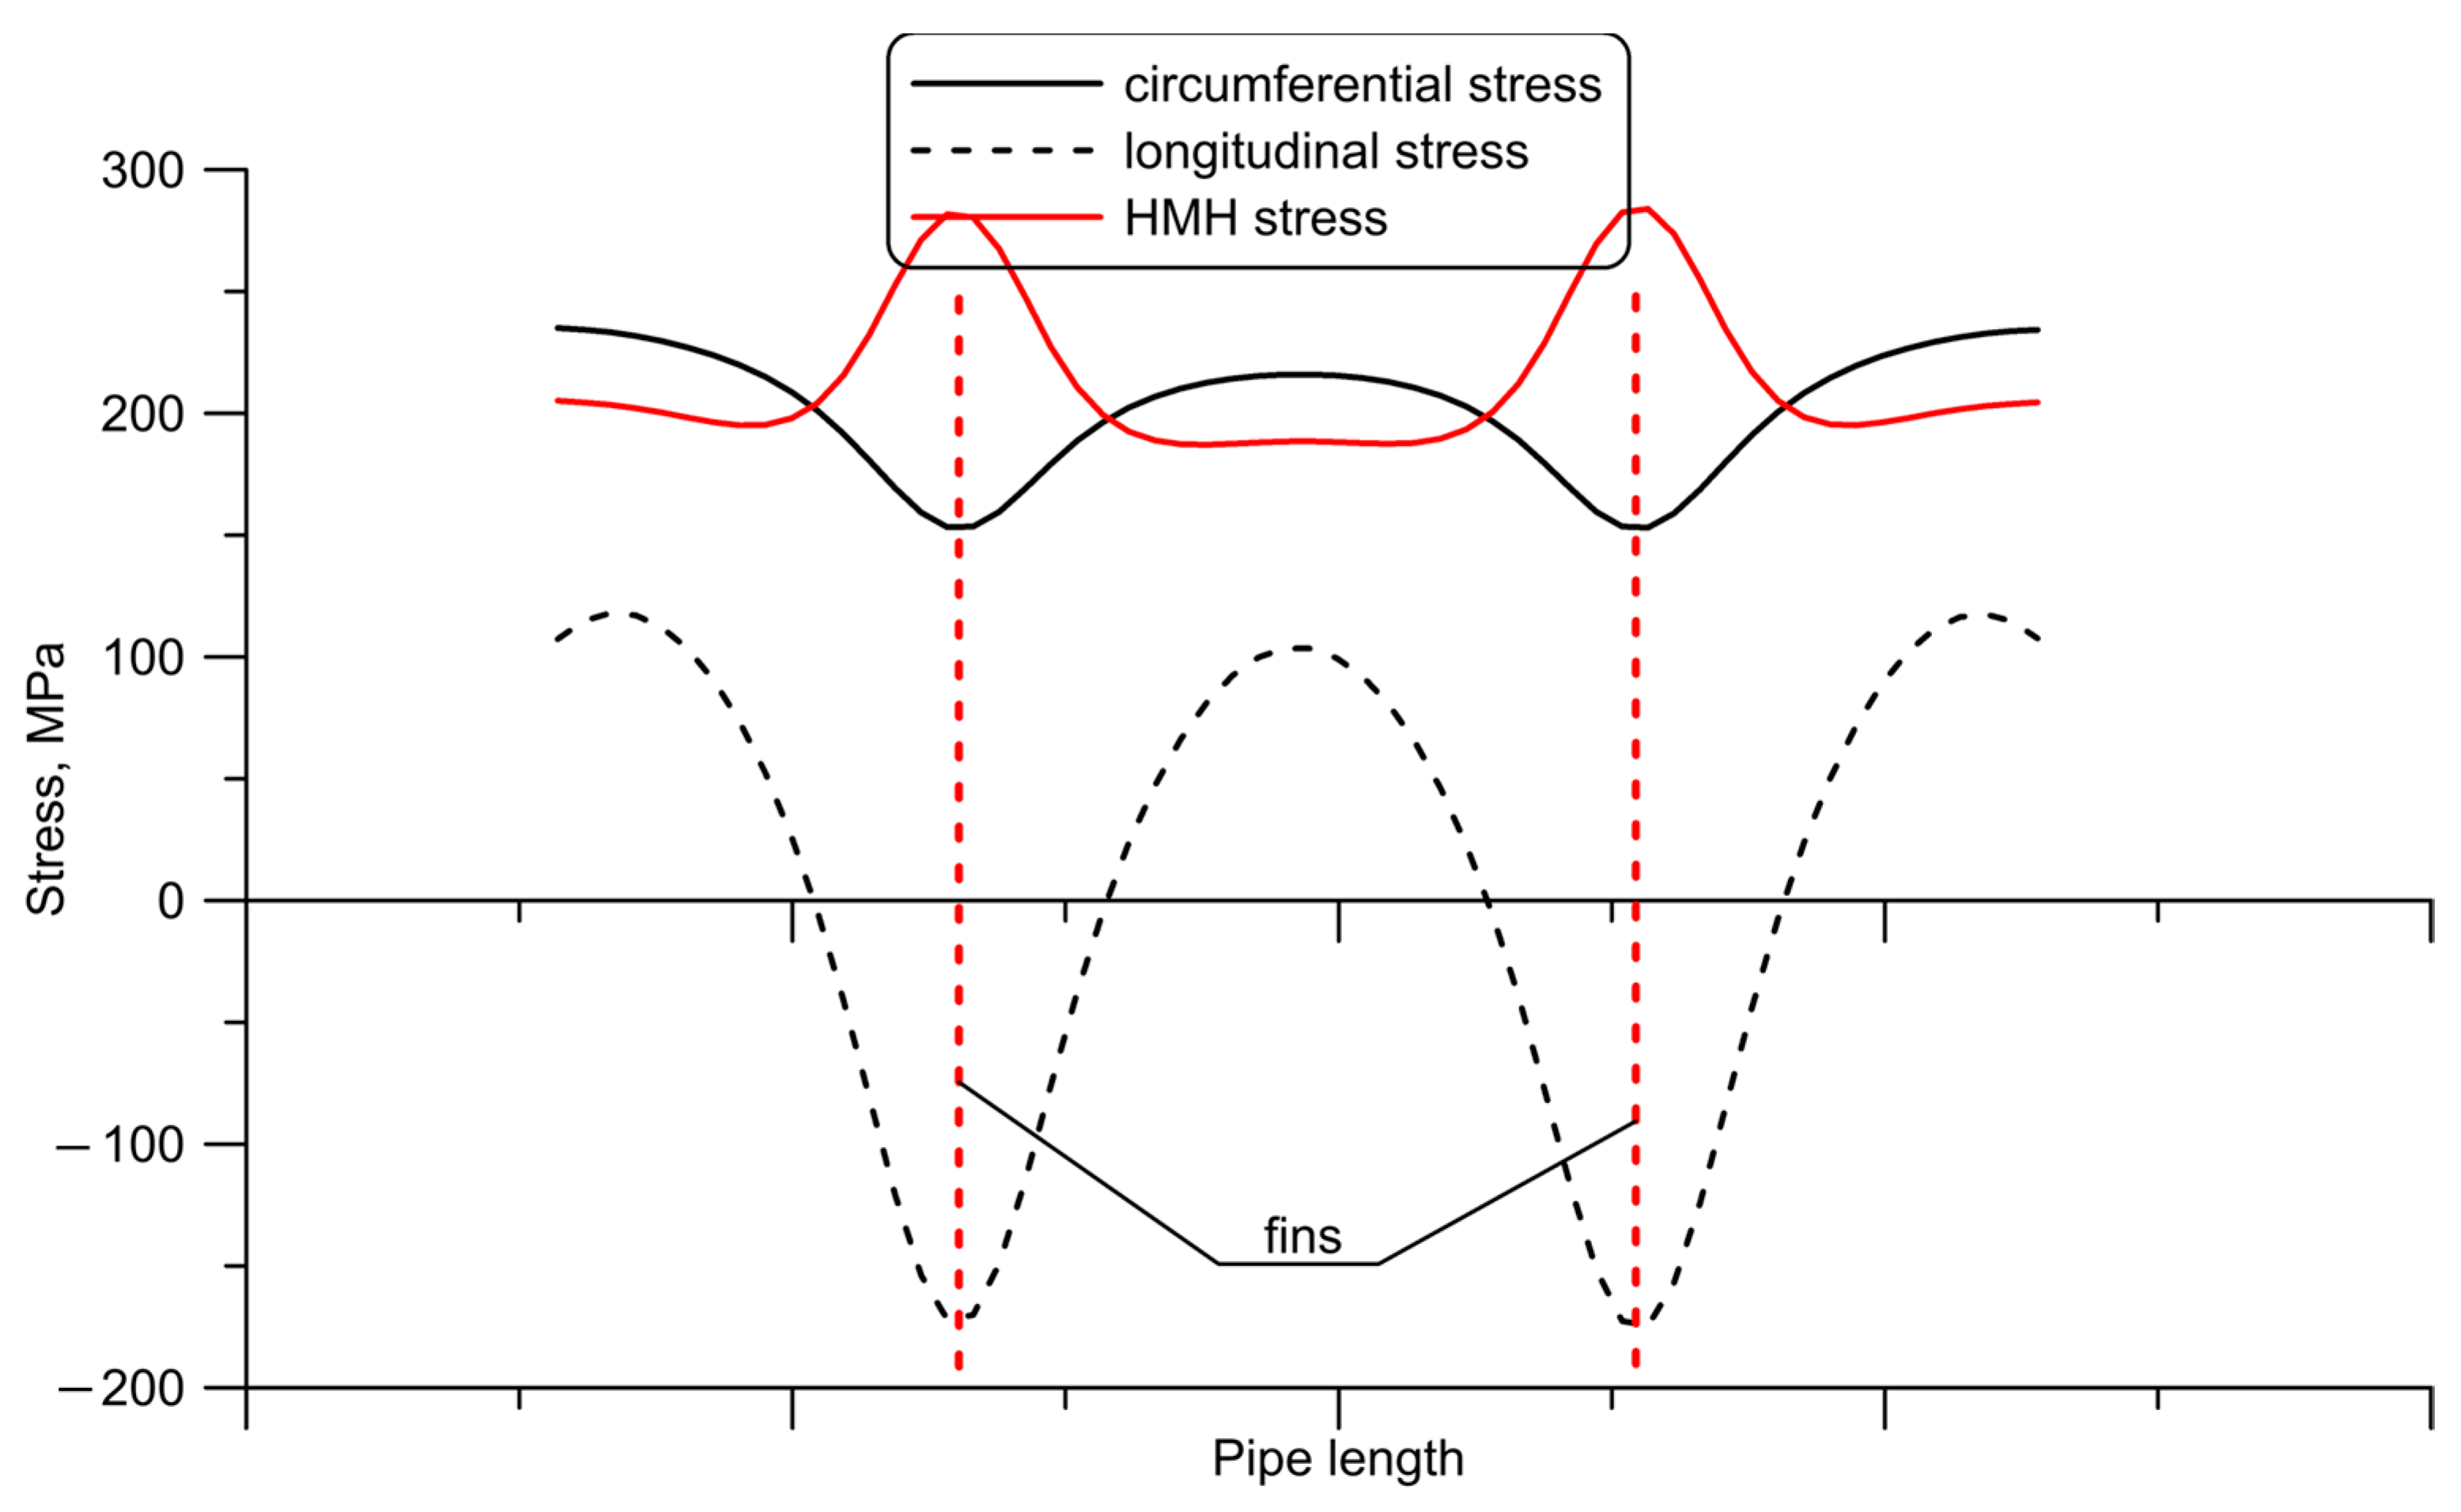
The economizer analyzed is constructed of 42.4 mm diameter helical finned tubes made of P235GH steel. The circumferential and longitudinal stresses from the pressure in the pipes can be simply determined from the analytical formulas [36]. In the case analyzed, for smooth pipes (without the fins), the stresses from pressure are negligible. For the full a boiler load, the pressure that prevails inside the water heater pipes is 1.6 MPa. The longitudinal and circumferential stresses from pressure only are 6.06 and 12.12 MPa, respectively. The stresses from the temperature, even though they will be higher, will still be less than the permissible ones. In the case of ECO2 finned pipes, determining stresses by analytical methods is difficult. Nevertheless, it can be said that the stresses from temperature and pressure will be much higher. This is due to the high temperature of the fins near their tops. There will be compressive stresses near the top of the fin, which will result in high tensile stresses in colder areas such as the base of the fin and in the pipe wall. Based on the thermal-flow calculation, and the information on the pressure that exists in the water heater pipes, a strength analysis was carried out for the first row of ECO2 pipes. The uneven temperature distribution around the finned pipe’s circumference significantly influences the distribution of longitudinal and circumferential stresses across the pipe wall, both under the fin (Figure 17) and between the fins (Figure 18). The total distribution of longitudinal, circumferential, and HMH stresses on the internal surface along the pipe on the inflow side is illustrated in Figure 19. The stress distribution is shown on two fin pitches. However, the strength analysis included a much longer length of the pipe, which could bend and extend at the ends. Tensile stresses reach 234.9 MPa. HMH stresses on the inner surface of the pipe under the fin reach a value of 283.9 MPa. Moreover, the highest stresses were observed at the top of the fin, on the side with the highest temperatures. The high operating temperature of the first row of pipes indicates its destruction due to the exceeding of the maximum permissible temperature at which the steel used may operate [37]. This results in unequal temperature distribution, whereby the stresses to which the first row of pipes is subjected exceed the yield strength of P235GH steel as early as 50 °C (Table 3).
Furthermore, above an operating temperature of 380 °C, time creep strength must be considered. Table 4 illustrates the creep strength of P235GH steel for 10,000 h, 100,000 h, and 200,000 h respectively.
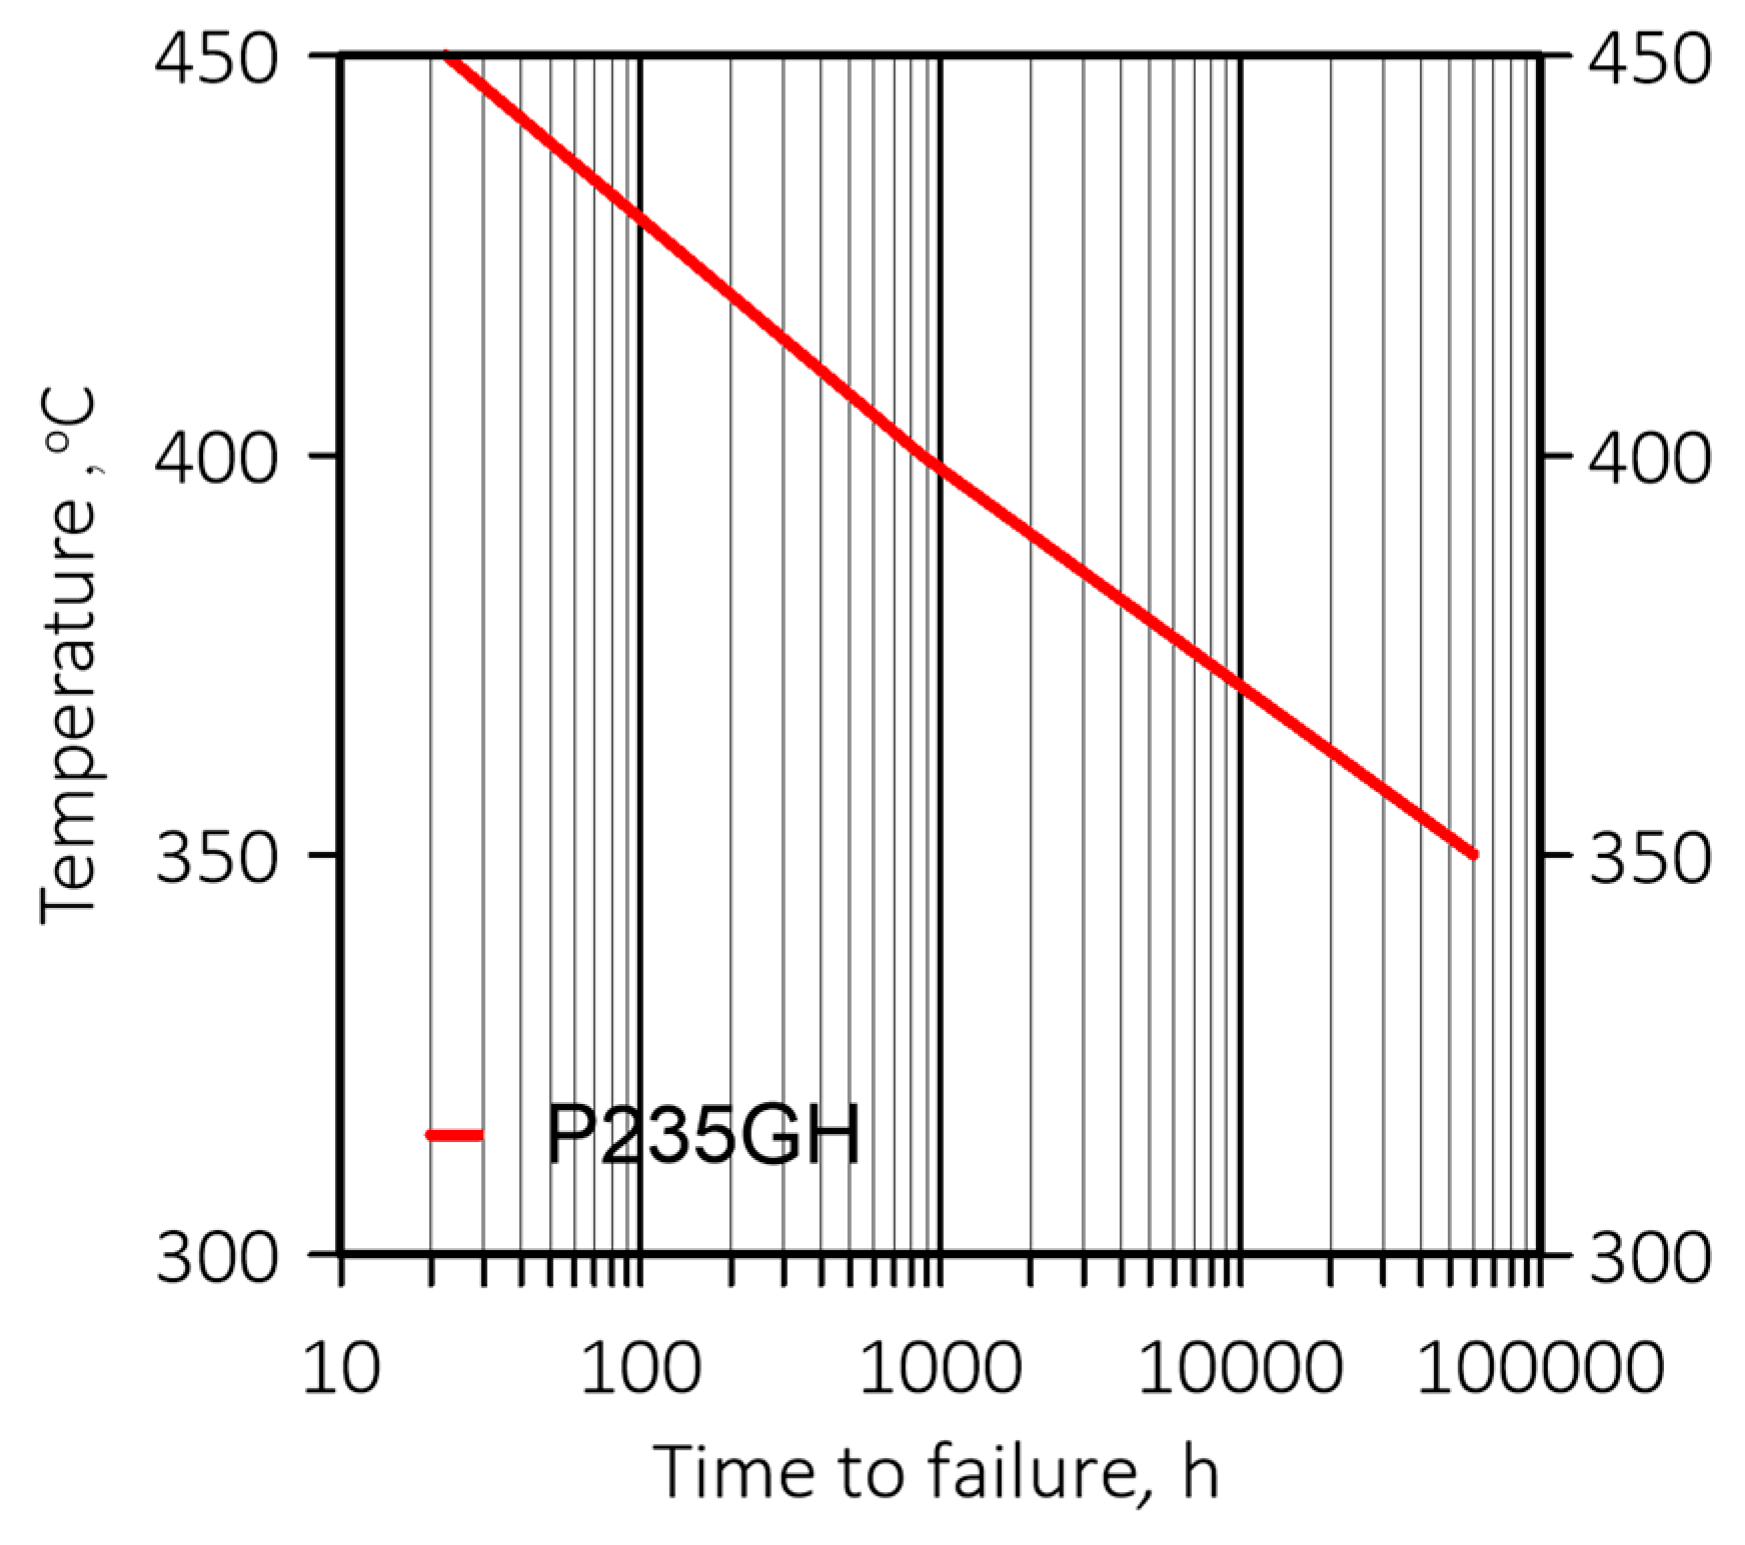
With the assumed stress applied to the ECO2 first-row pipe being 234.9 MPa, the mean time to failure as a function of operating temperature is depicted in Figure 20. The durability of the first row of piping was determined based on the Larson–Miller parameter [38]. The projected service life of the pipes will be even lower than the above values, as the HMH stresses are higher than those assumed in the calculations. It is important to note at this point that with a heat flux density on the inner pipe surface in the first pipe row at the inlet side of the flue gas of more than 500,000 W/m2, the temperature of the outer pipe surface may well exceed 400 °C due to the danger of a boiling film next to the wall.

6. Preventing Pipe Rupture—A Recommended Solution

The conducted analysis considered the quest for solutions that will enable the failure-free operation of the boiler. Making the first two rows of ECO2 from smooth pipes will increase the flue gas temperature after the following rows of tubes. Thanks to this, rows III, IV, V, and VI will absorb more heat from the flue gases (Table 5).
As a consequence, the flue gas temperature after the water heater will only increase by 28 °C compared to the flue gas temperature after ECO2 with all finned tubes (current system), as shown in Table 6. The flue gas temperature after ECO2 determined by the CFD simulation is higher than the design temperature, which is 390 °C. This is because the CFD modeling considers and reflects radiation’s effect on ECO2 operation and exhaust gas temperature much better than the analytical calculations. Using smooth pipes on the first two rows will result in a 5% decrease in the output of the ECO2 water heater [1]. The boiler output will change slightly because, although the flue gas temperature increases after ECO2, and ECO2 takes up less heat, the flue gas flows through ECO1, whose thermal output should increase. The boiler will still be able to operate at the required loads. It was also recommended that the water flow rate in the boiler’s heating spaces be increased using an increase in the recirculated water flow rate. The increase in water flow will eliminate the problem associated with the film boiling phenomenon.
Considering the above analyses, it was suggested to use plain tubes at least in the first two rows of ECO2 on the flue gas inflow side or to increase the value of water flow in the boiler heating spaces by increasing the mass flow rate of recirculated water to eliminate the causes of the failure [1]. To control the operating parameters of the water heater ECO2, it is also recommended to measure the wall temperature of selected pipes in the first two rows on the flue gas inflow side.

7. Conclusions

The primary objective of the research presented in this paper was to identify the causes behind the failure of a 130 MWt natural-gas-fired boiler. The analysis of boiler operating parameters and the damage to the water heater tubes indicated that one potential cause of the failure was the exceeding of the allowable operating temperature for the economizer tube material (P235GH steel). The short operational time of the boiler following start-up suggested a significant temperature exceedance. The developed method, based on CFD modeling and strength analysis, enabled the simulation of boiler operation. The acquired results revealed that the primary reason for the rapid failure of the pipes in the first row of the second-stage water heater ECO2 was the excessively high heat flow rate absorbed by the fins and tubes on the inlet side of the flue gas. In front of the ECO2 lies a substantial pipe-free space filled with flue gases containing strongly radiating components like water vapor and carbon dioxide (CO2). These gases emit intense radiation toward the unobstructed first row of pipes. The impact of radiation in augmenting the heat flow rate taken up by the tubes is considerably less pronounced in the second and subsequent rows of pipes. The obtained results indicated that the fin’s top temperature significantly exceeded acceptable levels for the steel composing the fins. Consequently, the fins were expected to experience rapid destruction due to high-temperature corrosion. Given the relatively low working pressure of water, not surpassing 1.6 MPa, the saturation temperature, which is the boiling point of water, does not surpass 202 °C. Thus, the high heat flux exceeding 500,000 W/m2 leads to membrane boiling of water (first kind boiling crisis) on the inner surface of the pipe on the inlet side of the flue gas. The vapor layer serves as effective insulation against heat. Both the pipe wall and fin temperature went beyond permissible levels for the relevant steels. The phenomenon of membrane boiling would also manifest at lower boiler capacities due to reduced water flow velocity in the pipes. These identified causes result in significant temperature discrepancies between the tubes and fins, particularly at their periphery, notably at the first row at the inlet side of the flue gas. This discrepancy stems from intense radiation from the gas side and the vortices forming in the rear area of the pipe. At full boiler load, the highest fin temperature reaches 614 °C, and the lowest is 226 °C, occurring at an angle of around 150° from the inflow side. The temperature difference around the fin’s perimeter is 388 °C. Such a substantial temperature variation contributes to high stresses in the pipe wall. Elevated compressive stresses on the inflow side of the fin translate to elevated tensile stresses in the pipe wall. In scenarios of film boiling, the wall temperature increases swiftly (surpassing the material’s limit temperature). Under such operational conditions, creep damage could occur within a few hours, even with relatively low flow pressures. The utilization of fins on the initial two pipe rows primarily accounts for pipe ruptures in the first row of the ECO2 pipes. This arrangement could also lead to burst pipes in the second row after a slightly extended operational period.

Author Contributions

Data curation, M.T.; Investigation, P.D., M.G. and J.T.; Validation, M.G. and K.K.; Supervision, J.T. and D.T.; Writing—original draft, M.G.; Review, M.T. and T.S. All authors have read and agreed to the published version of the manuscript.

Funding

This research received no external funding.

Data Availability Statement

3rd Party Data.

Conflicts of Interest

The authors declare no conflict of interest.

References

  1. Jang, J.; Pidaparthy, S.K.; Choi, B. Current Mode Control for LLC Series Resonant DC-to-DC Converters. Energies 2015, 8, 6098–6113. [Google Scholar] [CrossRef]
  2. Trojan, M.; Taler, J.; Dzierwa, P.; Taler, D.; Granda, M.; Kaczmarski, K. Analysis of damages on the boiler in district heating plant. In Proceedings of the Energy Fuels Environment EFE2022 International Conference, Cracow, Poland, 20–23 September 2022. [Google Scholar]
  3. Lombardi, L.; Carnevale, E.; Corti, A. A review of technologies and performances of thermal treatment systems for energy recovery from waste. Waste Manag. 2015, 37, 26–44. [Google Scholar] [CrossRef] [PubMed]
  4. Natural Gas-Fired Power; Technical Report; IEA: Paris, France, 2021; Available online: https://www.iea.org/reports/natural-gas-fired-power (accessed on 1 November 2021).
  5. Guerrero, J.; Alcaide-Moreno, A.; González-Espinosa, A.; Arévalo, R.; Tunkel, L.; Storch de Gracia, M.D.; García-Rosales, E. Reducing Energy Consumption and CO2 Emissions in Natural Gas Preheating Stations Using Vortex Tubes. Energies 2023, 16, 4840. [Google Scholar] [CrossRef]
  6. Tsoumalis, G.I.; Bampos, Z.N.; Chatzis, G.V.; Biskas, P.N. Overview of Natural Gas Boiler Optimization Technologies and Potential Applications on Gas Load Balancing Services. Energies 2022, 15, 8461. [Google Scholar] [CrossRef]
  7. Weiland, P. Biogas production: Current state and perspectives. Appl. Microbiol. Biotechnol. 2010, 85, 849–860. [Google Scholar] [CrossRef] [PubMed]
  8. Abdurrahman, A.A.; Abdelhamid, E.A.; Mohamed, E.; Osama, A.E. Towards nearly zero emissions natural gas-fired power plant using cryogenic carbon dioxide capture technology. Int. J. Greenh. Gas Control. 2023, 127, 103928. [Google Scholar] [CrossRef]
  9. Ouyang, T.; Wen, W.; Tan, X.; Zhang, M.; Wang, Z. Multi-criteria assessment of a new energy-saving and environmentally-friendly scheme for natural gas-fired power plants. Gas Sci. Eng. 2023, 113, 204965. [Google Scholar] [CrossRef]
  10. Lin, H.; Clavreul, J.; Jeandaux, C.; Crawley, J.; Butnar, I. Environmental life cycle assessment of heating systems in the UK: Comparative assessment of hybrid heat pumps vs. condensing gas boilers. Energy Build. 2021, 240, 110865. [Google Scholar] [CrossRef]
  11. Christos, N.D.; Evangelos, G.T.; Michael, C.G. Optimal bidding strategy of a gas-fired power plant in interdependent low-carbon electricity and natural gas markets. Energy 2023, 277, 127710. [Google Scholar] [CrossRef]
  12. Simic, K.; T’Jollyn, I.; Faes, W.; Bastero, J.B.; Laverge, J.; Paepe, M. Modelling of a gas-fired heating boiler unit for residential buildings based on publicly available test data. Energy Build. 2021, 253, 111451. [Google Scholar] [CrossRef]
  13. Granda, M.; Trojan, M. Numerical Model of the Double-Pipe System with Protective Layer. Heat Transf. Eng. 2022. [Google Scholar] [CrossRef]
  14. Shokouhmand, H.; Ghadimi, B.; Espanani, R. Failure analysis and retrofitting of superheater tubes in utility boiler. Eng. Fail. Anal. 2015, 50, 20–28. [Google Scholar] [CrossRef]
  15. Erne, S.; Scheger, G.; Wiedemair, W. Numerical and experimental investigation of surface-stabilized combustion in a gas-fired condensing boiler. Results Eng. 2023, 17, 100738. [Google Scholar] [CrossRef]
  16. Taler, J.; Zima, W.; Ocłoń, P.; Grądziel, S.; Taler, D.; Cebula, A.; Jaremkiewicz, M.; Korzeń, A.; Cisek, P.; Kaczmarski, K.; et al. Mathematical model of a supercritical power boiler for simulating rapid changes in boiler thermal loading. Energy 2019, 175, 580–592. [Google Scholar] [CrossRef]
  17. Harhara, A.; Hasan, M.M.F. Heat exchanger network synthesis with process safety compliance under tube rupture scenarios. Comput. Chem. Eng. 2022, 162, 107817. [Google Scholar] [CrossRef]
  18. Granda, M.; Trojan, M.; Taler, D. CFD analysis of steam superheater operation in steady and transient state. Energy 2020, 199, 117423. [Google Scholar] [CrossRef]
  19. Rahimi, M.; Khoshhal, A.; Shariati, S.M. CFD modelling of a boiler’s tubes rupture. Appl. Therm. Eng. 2006, 26, 2192–2200. [Google Scholar] [CrossRef]
  20. Li, Y.; Chen, H.; Zhi, P.; Liang, H.; Wang, Z.; Feng, Z.; Li, Z.; Kuang, Y. Failure analysis of superheater tubes in an air quenching cooler waste heat boiler. Eng. Fail. Anal. 2022, 131, 105869. [Google Scholar] [CrossRef]
  21. Khoshhal, A.; Rahimi, M.; Alsairafi, A.A. CFD investigation on the effect of air temperature on air blowing cooling system for preventing tube rupture. Int. Commun. Heat Mass Transf. 2009, 36, 750–756. [Google Scholar] [CrossRef]
  22. Suwarno Suwarno, S.; Nugroho, G.; Santoso, A. Witantyo, Failure analysis of air preheater tubes in a circulating fluidized bed boiler. Eng. Fail. Anal. 2021, 124, 105380. [Google Scholar] [CrossRef]
  23. Khadem Hosseini, R.; Yareiee, S. Failure analysis of boiler tube at a petrochemical plant. Eng. Fail. Anal. 2019, 106, 104146. [Google Scholar] [CrossRef]
  24. Purbolaksono, J.; Ahmad, J.; Beng, L.C.; Rashid, A.Z.; Khinani, A.; Ali, A.A. Failure analysis on a primary superheater tube of a power plant. Eng. Fail. Anal. 2010, 17, 158–167. [Google Scholar] [CrossRef]
  25. Gandhi, M.B.; Vuthaluru, R.; Vuthaluru, H.; French, D.; Shah, K. CFD based prediction of erosion rate in large scale wall-fired boiler. Appl. Therm. Eng. 2012, 42, 90–100. [Google Scholar] [CrossRef]
  26. Zhong, Y.X.; Wang, X.; Xu, G.; Ning, X.; Zhou, L.; Tang, W.; Wang, M.H.; Wang, T.; Xu, J.; Jiang, L.; et al. Investigation on slagging and high-temperature corrosion prevention and control of a 1000 MW ultra supercritical double tangentially fired boiler. Energy 2023, 275, 127455. [Google Scholar] [CrossRef]
  27. Nguyen, V.T.; Hyochan Kim, H.; Kim, B.J. Numerical investigation on ballooning and rupture of a Zircaloy tube subjected to high internal pressure and film boiling conditions. Nucl. Eng. Technol. 2023, 55, 2454–2465. [Google Scholar] [CrossRef]
  28. Xiong, P.; Lu, T.; Luo, Y.; Zhang, Q.; Ren, H.; Deng, J.; Heng, Y. Study on liquid–vapor interface oscillation characteristics and heat transfer of film boiling during quenching of fuel cladding surfaces. Appl. Therm. Eng. 2023, 219, 119615. [Google Scholar] [CrossRef]
  29. Kamenicky, R.; Frank, M.; Drikakis, D.; Ritos, K. Film Boiling Conjugate Heat Transfer during Immersion Quenching. Energies 2022, 15, 4258. [Google Scholar] [CrossRef]
  30. Wisudhaputra, A.; Yun, B.J.; Jeong, J.J. Improvement of the critical heat flux correlation in a thermal-hydraulic system code for a downward-flow narrow rectangular channel. Nucl. Eng. Technol. 2022, 54, 3962–3973. [Google Scholar] [CrossRef]
  31. Liu, Y.; Du, Y.; Fei, G.; Zhou, T. Effects of surface wettability on bubble departure and critical heat flux: A parametric study based on 3-D dynamic force analysis model. Int. J. Therm. Sci. 2023, 186, 108149. [Google Scholar] [CrossRef]
  32. Suwarno, S.; I’jazurrohman, A.J.; Yudanto, F.D. Failure analysis of waste heat boiler tubing caused by a high local heat flux. Eng. Fail. Anal. 2022, 136, 106147. [Google Scholar] [CrossRef]
  33. Granda, M. Steady state CFD analysis of heat transfer coefficient in pressurised pipes of superheater of OP210M steam boiler. MATEC Web Conf. 2018, 240, 05008. [Google Scholar] [CrossRef]
  34. Serwiński, M. Principles of Chemical Engineering; WNT: Warsaw, Poland, 1976. (In Polish) [Google Scholar]
  35. Taler, D. Numerical Modelling and Experimental Testing of Heat Exchangers, 1st ed.; Springer: Berlin/Heidelberg, Germany, 2019. [Google Scholar]
  36. Kannappan, S. Introduction to Pipe Stress Analysis; John Wiley & Sons: New York, NY, USA, 1985. [Google Scholar]
  37. Orłowski, P.; Dobrzański, W.; Szwarc, E. Kotły Parowe; WNT: Warsaw, Poland, 1979. (In Polish) [Google Scholar]
  38. French, D.N. Metallurgical Failures in Fossil Fired Boilers, 2nd ed.; John Wiley & Sons: New York, NY, USA, 1993. [Google Scholar]
Figure 1. Stages in the analysis of the causes of boiler failure.
Energies 16 06278 g001
Figure 2. The boiler layout. The primary material applied for the construction of the heating surfaces is P235GH steel. This includes the combustion chamber, screen, ECO2, and economizer 1 (ECO1) pipes. The sequence of the heating surfaces along the direction of the flue gas flow is as follows: festoon, ECO2, and ECO1. In the combustion chamber and the festoon (up to the first rows of ECO2), radiation plays a significant role in the heat transfer process. ECO2 is composed of finned tubes, which has an impact on the amount of heat transferred and the exchange efficiency. The hypothesis is that the predominant cause of tube damage in the first row of the second-stage water heater (ECO2) was an excessively high heat flow rate absorbed by the fins and tubes on the flue gas inflow side, both at high and low loads. The described design of ECO2 has the potential to generate regions prone to failure due to surpassing the material’s temperature limits.
Energies 16 06278 g002
Figure 3. Photographs of pipe bursts at the 1st (a) and 2nd (b) row of the third stage ECO2.
Energies 16 06278 g003
Figure 4. The changes in the water mass flow and firing rates during the boiler operation.
Energies 16 06278 g004
Figure 6. Flue gas bulk temperature behind the ECO2.
Energies 16 06278 g006
Figure 7. Temperature distribution along the ECO2.
Energies 16 06278 g007
Figure 8. Temperature distribution for the first row of ECO2 tubes at the inlet side of the flue gas: (a) on the fin surface, (b) on the surface between the fins.
Energies 16 06278 g008
Figure 9. Distribution (at the 1st row of the ECO2 pipes) in the case of (a) temperature around the perimeter of the fin in the top, (b) heat flux on the inner surface of the pipes.
Energies 16 06278 g009
Figure 10. Temperature distribution for the second row of ECO2 tubes at the inlet side of the flue gas: (a) on the fin surface, (b) on the surface between the fins.
Energies 16 06278 g010
Figure 11. Distribution (at the 2nd row of the ECO2 pipes) in the case of (a) temperature around the perimeter of the fin in the top, (b) heat flux on the inner surface of the pipes.
Energies 16 06278 g011
Figure 12. Temperature distribution for the third row of ECO2 tubes at the inlet side of the flue gas: (a) on the fin surface, (b) on the surface between the fins.
Energies 16 06278 g012
Figure 13. Distribution (at the 3rd row of the ECO2 pipes) in the case of (a) temperature around the perimeter of the fin in the top, (b) heat flux on the inner surface of the pipes.
Energies 16 06278 g013
Figure 14. The temperature distribution of the final row of ECO2 tubes on the side where flue gas enters; (a) on the fin surface, (b) on the surface between the fins.
Energies 16 06278 g014
Figure 15. Distribution (at the 6th row of the ECO2 pipes) in the case of (a) temperature around the perimeter of the fin in the top, (b) heat flux on the inner surface of the pipes.
Energies 16 06278 g015
Figure 16. The influence of steam layer thickness and different steam temperatures on the temperature of (a) the fin, (b) the inner and outer surface of the tube.
Energies 16 06278 g016
Figure 17. Distribution of circumferential, longitudinal, and HMH stresses on the pipe wall under the fin, at the inlet side of the flue gas (1st row ECO2).
Energies 16 06278 g017
Figure 18. Distribution of circumferential, longitudinal, and HMH stresses on the pipe wall between the fins, at the inlet side of the flue gas (1st row ECO2).
Energies 16 06278 g018
Figure 19. Distribution of circumferential, longitudinal, and HMH stresses along the pipe on the inner surface, on the inflow side of the flue gas (1st row ECO2).
Energies 16 06278 g019
Figure 20. The lifespan of the first row of pipes of the water heater ECO2.
Energies 16 06278 g020
Table 1. Mesh quality statistics.
Domain NameOrthogonal AngleExpansion FactorAspect Ratio
Min. (deg)MaximumMaximum
FlueGas35.59320
Water75.514654
Pipe39.91146
Global35.593654
bad (%)ok (%)good (%)bad (%)ok (%)good (%)bad (%)ok (%)good (%)
FlueGas0<1100<139700100
Water00100069400100
Pipe001000<11000<1100
Global0<1100<14960<1100
Table 2. Temperature and heat flux comparison for the operation of the water heater ECO2 at 100% boiler output.
Maximum Fin TemperatureMaximum Temperature of the External Surface of the Tube Maximum Heat Flux at the Inner Surface of the Tube
°C°CW/m2
IIIIIIIVVVIIIIIIIIVVVIIIIIIIIVVVI
614321281277254242197145139156163141542,700254,500237,800232,800274,500-
Table 3. Specified yield strength Re0.2 over temperature for P235GH steel components with wall thicknesses up to 60 mm.
T, °C50100150200250300350400
Re0.2, MPa206190180170150130120110
Table 4. Creep resistance rates of P235GH steel.
T, °C1% Elongation Limit, MPaCreep Resistance, MPa
10,000 h100,000 h10,000 h100,000 h200,000 h
380164118229165145
390150106211148129
40013695191132115
41012484174118101
4201137315810389
430101651429178
44091571277967
45080491136957
46072421005948
4706235865040
4805330754233
Table 5. Temperature and heat flux comparison for the operation of the water heater ECO2 at 100% boiler output (a recommended solution—1st and 2nd row smooth pipes).
Maximum Fin TemperatureMaximum Temperature of the External Surface of the Tube Maximum Heat Flux at the Inner Surface of the Tube
°C°CW/m2
IIIIIIIVVVIIIIIIIIVVVIIIIIIIIVVVI
--330298273252151124148.4140145142.6337,200160,500290,160250,700315,000286,500
Table 6. Flue gas temperature comparison for the operation of the water heater ECO2 at 100% boiler output.
Flue Gas Bulk Temperature, °C
Behind FestoonBehind the 1st RowBehind the 2nd RowBehind the 3rd RowBehind the 4th RowBehind the 5th RowBehind the 6th Row
Actual layout
(1st and 2nd row finned tubes)
985849777691608510417
recommended solution
(1st and 2nd row smooth pipes)
985872837744656544445
Disclaimer/Publisher’s Note: The statements, opinions and data contained in all publications are solely those of the individual author(s) and contributor(s) and not of MDPI and/or the editor(s). MDPI and/or the editor(s) disclaim responsibility for any injury to people or property resulting from any ideas, methods, instructions or products referred to in the content.