Abstract
Gasification of plastic waste is an emerging technology of particular interest to the scientific world given the production of a hydrogen-rich gas from waste material. Devolatilization is a first step thermochemical decomposition process which is crucial in determining the quality of the gas in the whole gasification process. The devolatilization of polypropylene (a key compound of plastic waste) has been investigated experimentally in a bench-scale fluidized bed reactor. Experimental tests were carried out by varying two key parameters of the process—the size of the polypropylene spheres (8–12 mm) and temperature (650–850 °C). Temperature shows the highest influence on the process. Greater molecular cracking results were more pronounced at higher temperatures, increasing the production of light hydrocarbons along with the formation of solid carbon residue and tar. The overall syngas output reduced, while the H2 content increased. Furthermore, a pseudo-first-order kinetic model was developed to describe the devolatilization process (Eapp = 11.8 kJ/mol, A1 = 0.55 s−1, ψ = 0.77).
1. Introduction
In recent years, research efforts on renewable and sustainable energy sources have been increasingly intensified due to the complexity of the global energy problems and the urgency of current global warming problems [1]. The world population is projected to increase to over 11 billion people by the end of the 21st century, geographically concentrated in the developing regions of the world [2]. This will result in net economic growth of those regions, which in the future will cause global growth of energy demand and resource consumption resulting in waste generation [3]. The projected growth of the world population should be compensated by avoiding the current severe mismanagement of waste. In this framework, the European Union (EU) has promoted thematic strategies on waste prevention and recycling, as well as regulations concerning the transition towards a circular and sustainable economy [4,5]. The use of waste as a raw material is crucial in a circular economy for applications in energy and biofuel production, as it is one of the pillars of the 2030 Agenda for sustainable development and contributes to decarbonization and minimization of landfill usage [6].
Based on current power demand and environmental concerns, thermochemical conversions could be an essential part of a sustainable and integrated waste management system, as they are suitable pathways for producing energy and fuel from waste [7,8,9]. First, heat treatment plants can directly convert the chemical energy content of waste into electricity and heat. Furthermore, thermochemical conversions such as pyrolysis and gasification allow to obtain more valuable fuels or chemicals (for example, through catalytic conversions of syngas), bringing the advantage of a unified and efficient treatment applicable to different types of solid waste [10]. Although the use of biomass in thermochemical processes for energy and chemical production has been extensively studied in the literature [11,12,13,14,15], similar studies on solid waste lead to less uniform conclusions due to the wider heterogeneity of waste materials [16]. This causes the need to specifically analyze each given class of waste in order to develop the related waste-to-energy/fuel production/chemicals production chain.
Plastic waste for thermochemical conversion applications is of growing interest due to the massive consumption of a wide range of plastic products, which has generated an enormous amount of waste with a current production of about 400 million tons [17]. Despite the new policies aimed at decreasing the consumption of plastic and the increasing use of bioplastics, it is imperative to find valid solutions to manage the great amount of plastic waste generated reducing the disposal into landfills [18].
A thermochemical conversion process like gasification is an alternative to waste incineration or waste-to-energy. Fluidized beds are used for several purposes, such as fluidized bed reactors for gasification and combustion of solid carbonaceous materials [19], fluid catalytic cracking [20], and heat or mass transfer, such as heat exchangers or applying a coating onto solid items [21,22].
In particular, fluidized bed gasification is considered an efficient way to convert plastic waste, leading to the production of a gas composed mainly of H2, CO, CO2, and CH4. A remarkable advantage of gasification is the production of energy, energy carriers, and chemicals from the producer gas using a mixture of different materials and reducing the emission of compounds related to the presence of oxygen [23,24]. The initial steps of the gasification process are drying and devolatilization. The devolatilization stage produces gas mainly composed of H2, CO, CO2, CH4, hydrocarbons, char, and tar. The kinetics of the process, the product distribution, and their composition are related to the operating conditions and will influence the gasification process and the composition of the producer gas [25]. The purpose of this work is to study the devolatilization of polypropylene (PP) particles. Uses for PP range from plastic packaging, parts for machinery, equipment and commercial use (kitchen utensil components, automobile components, equipment parts), and even fibers and textiles, making it one of the most extensively utilized thermoplastics worldwide. Today, the global market volume of PP is around 75 million tons, and this figure continues to grow exponentially [26].
Currently, only 1% of PP has been recycled while the remainder is left to degrade in landfills or is dispersed in the environment with degradation times of 20–30 years [23]. Furthermore, it has to be taken into account that complete mechanical recycling is not always possible given the presence of additives and chemical substances that modify their properties and do not allow to obtain finished products with the same characteristics as the virgin material [27]. Chemical recycling which involves the conversion of the material is therefore of growing interest.
This work arises from the need to fill the gap in literature concerning the kinetic data on the devolatilization of plastic materials in fluidized bed reactors. Given its wide use in various fields and the enormous quantity involved, PP was chosen as the plastic material object of study in this work, with the aim of converting it into fuel or chemicals of higher added value through the gasification process. These experimental tests were conducted in a lab-scale bubbling fluidized bed using different sizes of PP particles, ranging from 8 to 12 mm and temperature ranging from 650 °C to 850 °C. Finally, the results have been used to develop a kinetic model for describing the devolatilization process using a pseudo-first-order kinetic expression.
The developed model aims to provide accurate and satisfactory results of the devolatilization process in a bubbling fluidized bed, in agreement with the experimental evidence and findings described in the literature, by means of simplifying assumptions. This model should be regarded as an “engineering model”, i.e., as a tool for predicting the quantitative results of the thermochemical process and allow designing the whole gasifier performance, rather than a detailed descriptor of the physical and chemical evolution of each step of the devolatilization phenomenon. Such an “engineering” approach is not uncommon in the literature to describe complex phenomena in a quantitative manner able to provide tools for equipment design; see for instance the well-known “engineering” evaluation of heterogeneous catalysis, quite effective to predict the extent of such reactions under different operating conditions, although their intrinsic pathway and mechanism is not explored, and a quite general procedure is applied [28]. The tests allow the analysis of the real behavior of the material within a fluidized reactor that is not equally visible with alternative experimental methods.
2. Materials and Methods
2.1. Polypropylene
Polypropylene spheres were used in the experimental tests, made by 3D printing (Ultimaker S3® printer—Ultimaker B.V., Utrecht, The Netherlands), with Ultimaker PP® filament. This choice was intended to guarantee a high purity of the feedstock. The characterization of polypropylene, reported in the Table 1, was obtained from the literature [29,30].

Table 1.
PP characterization.
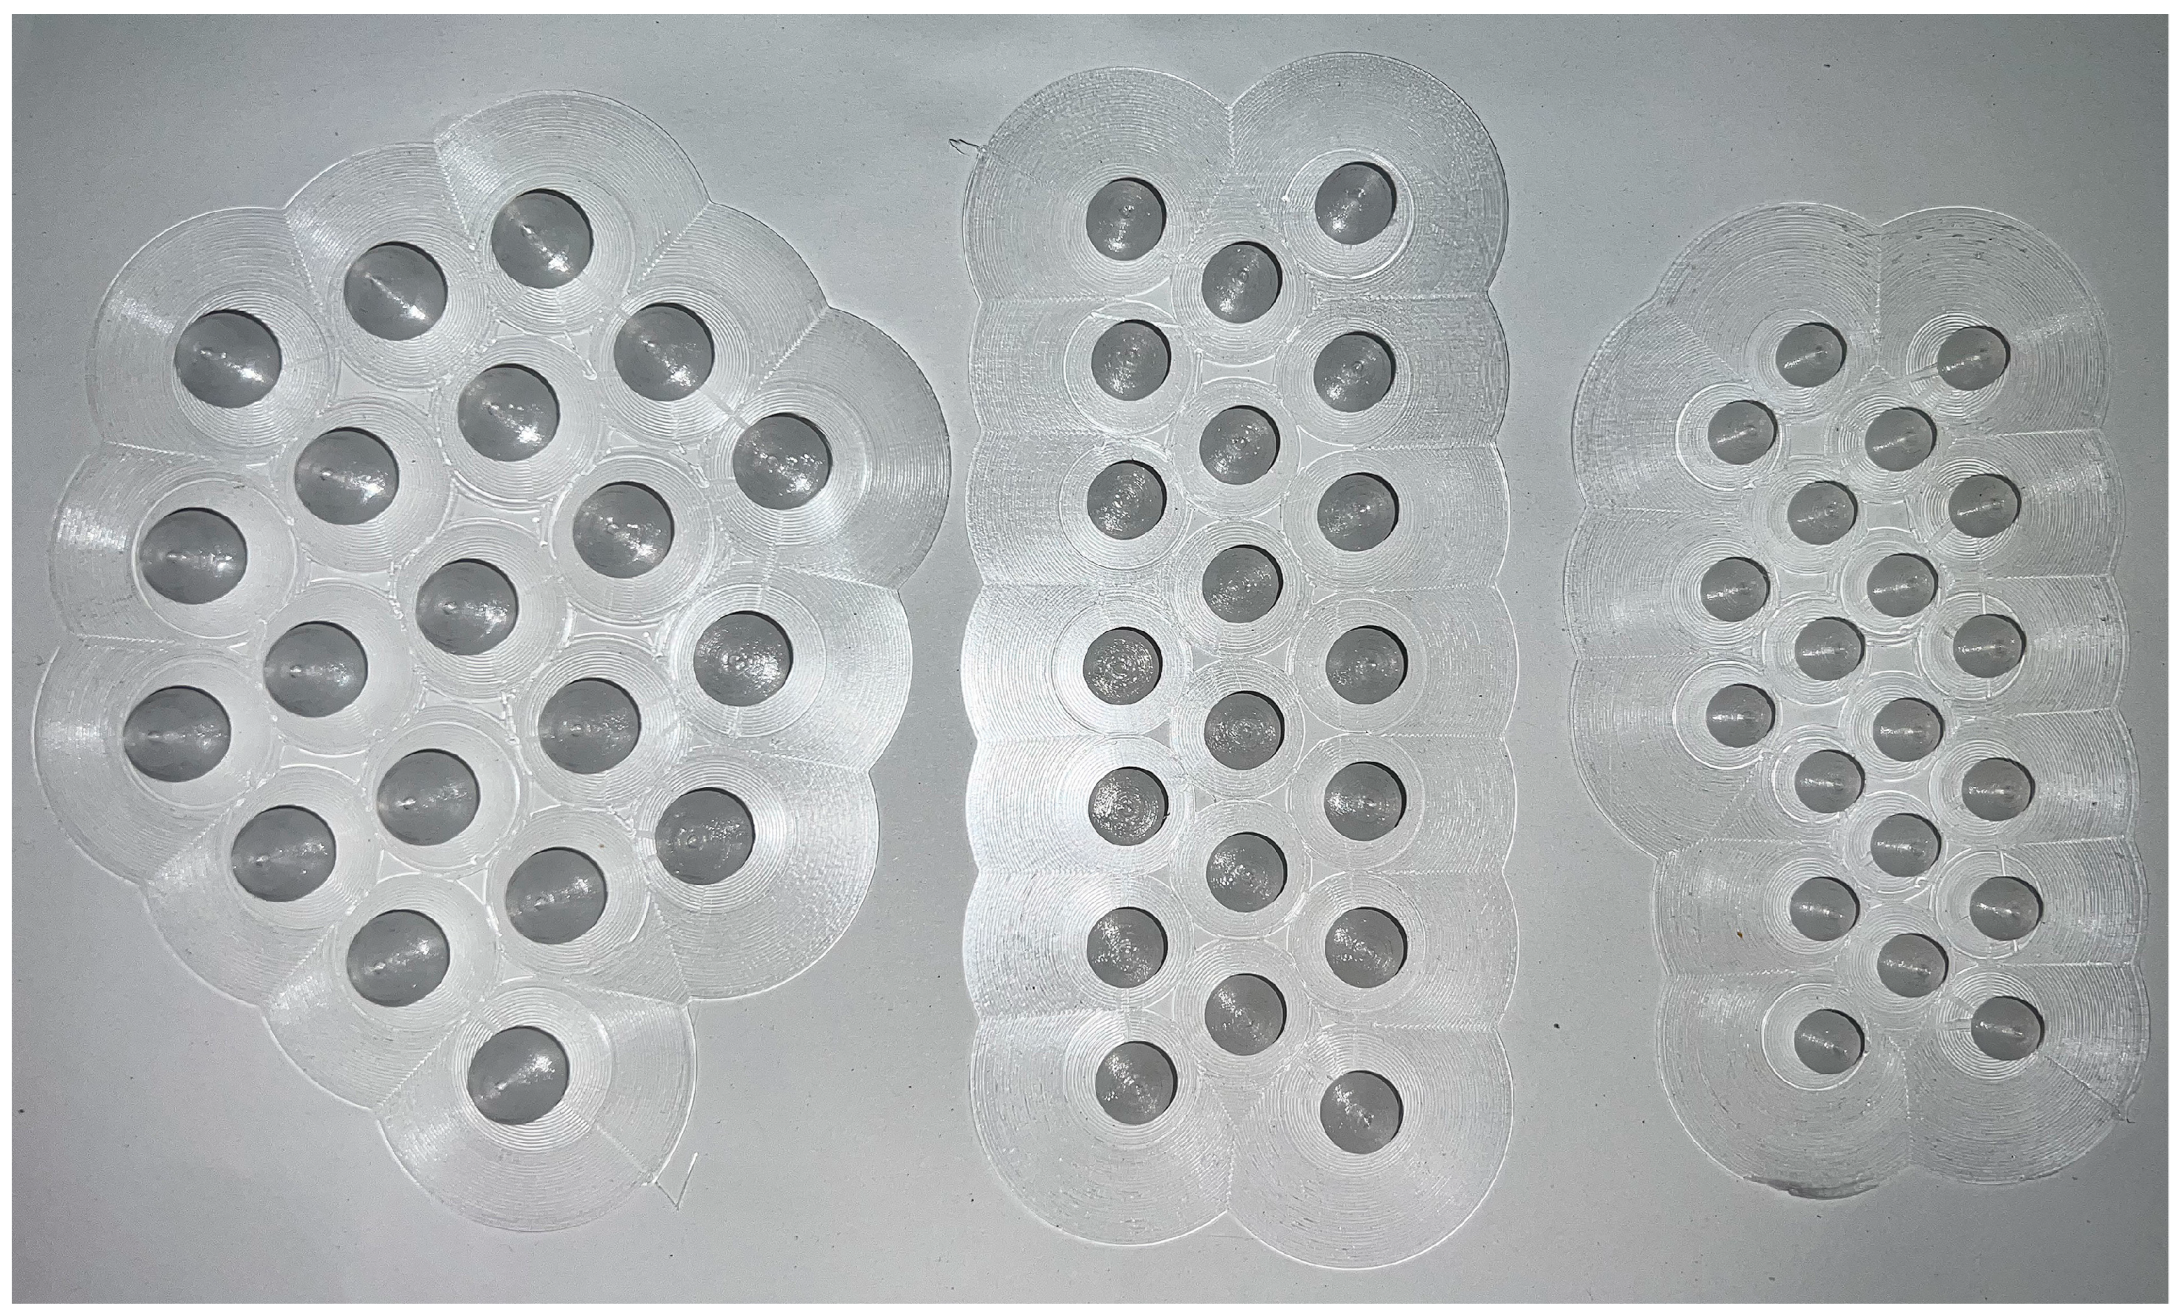
For testing, 3 different particle diameter sizes, 8, 10, and 12 mm, were selected, as can be seen in Figure 1.
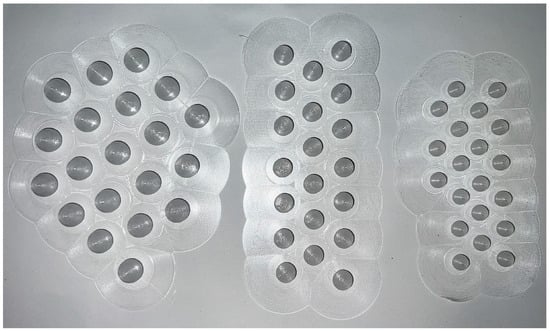
Figure 1.
Example of 3D-printed spheres.
The diameters were selected to be comparable to biomass pellet sizes usually used in the same experimental equipment and to represent possible reference sizes for comminution of plastic wastes. Furthermore, the spherical shape allows to obtain very reproducible size samples with negligible statistical variation. Because the particles were spherical, the effect of particle geometry and aspect ratio on product yields could be neglected. Different sizes of plastic sphere were chosen to observe heat and mass transfer effects through the particle, while operating within the geometry limitations of the reactor and feed system. Furthermore, smaller particles would have been difficult to feed with the feeding system configuration available.
The results obtained by means of this model can be adapted to typical polypropylene pellets using an average equivalent diameter (like Sauter mean diameter).
2.2. Bench Scale Experimental Apparatus
The devolatilization process takes place inside a bubbling fluidized bed reactor, consisting of quartz sand particles having a density of 2650 kg/m3 and particle size distribution as shown in Figure 2.
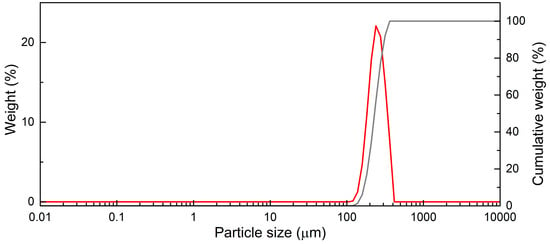
Figure 2.
Bed particles distribution (red: weight percentage; gray: cumulative weight percentage).
Sauter’s diameter results in 222 μm, calculated by the following equation:
where xi corresponds to the volume fraction of the ith particle fraction of diameter size dpi.
These values were used to calculate the minimum fluidization velocity (umf) as the temperature changes, through the Ergun equation [31].
The experimental test temperatures (reported in Table 2) are chosen among typical values used in the gasification process.
Table 2.
Minimum fluidization velocity and reactor working flow rates.
Based on these values, taking into account the size of the reactor, the nitrogen flow rate was calculated to ensure bed fluidization by setting a rate of 2 times of umf to promote both heat and mass transfer. The nitrogen flow rate also allows the creation of an inert environment, where secondary reactions are minimized.
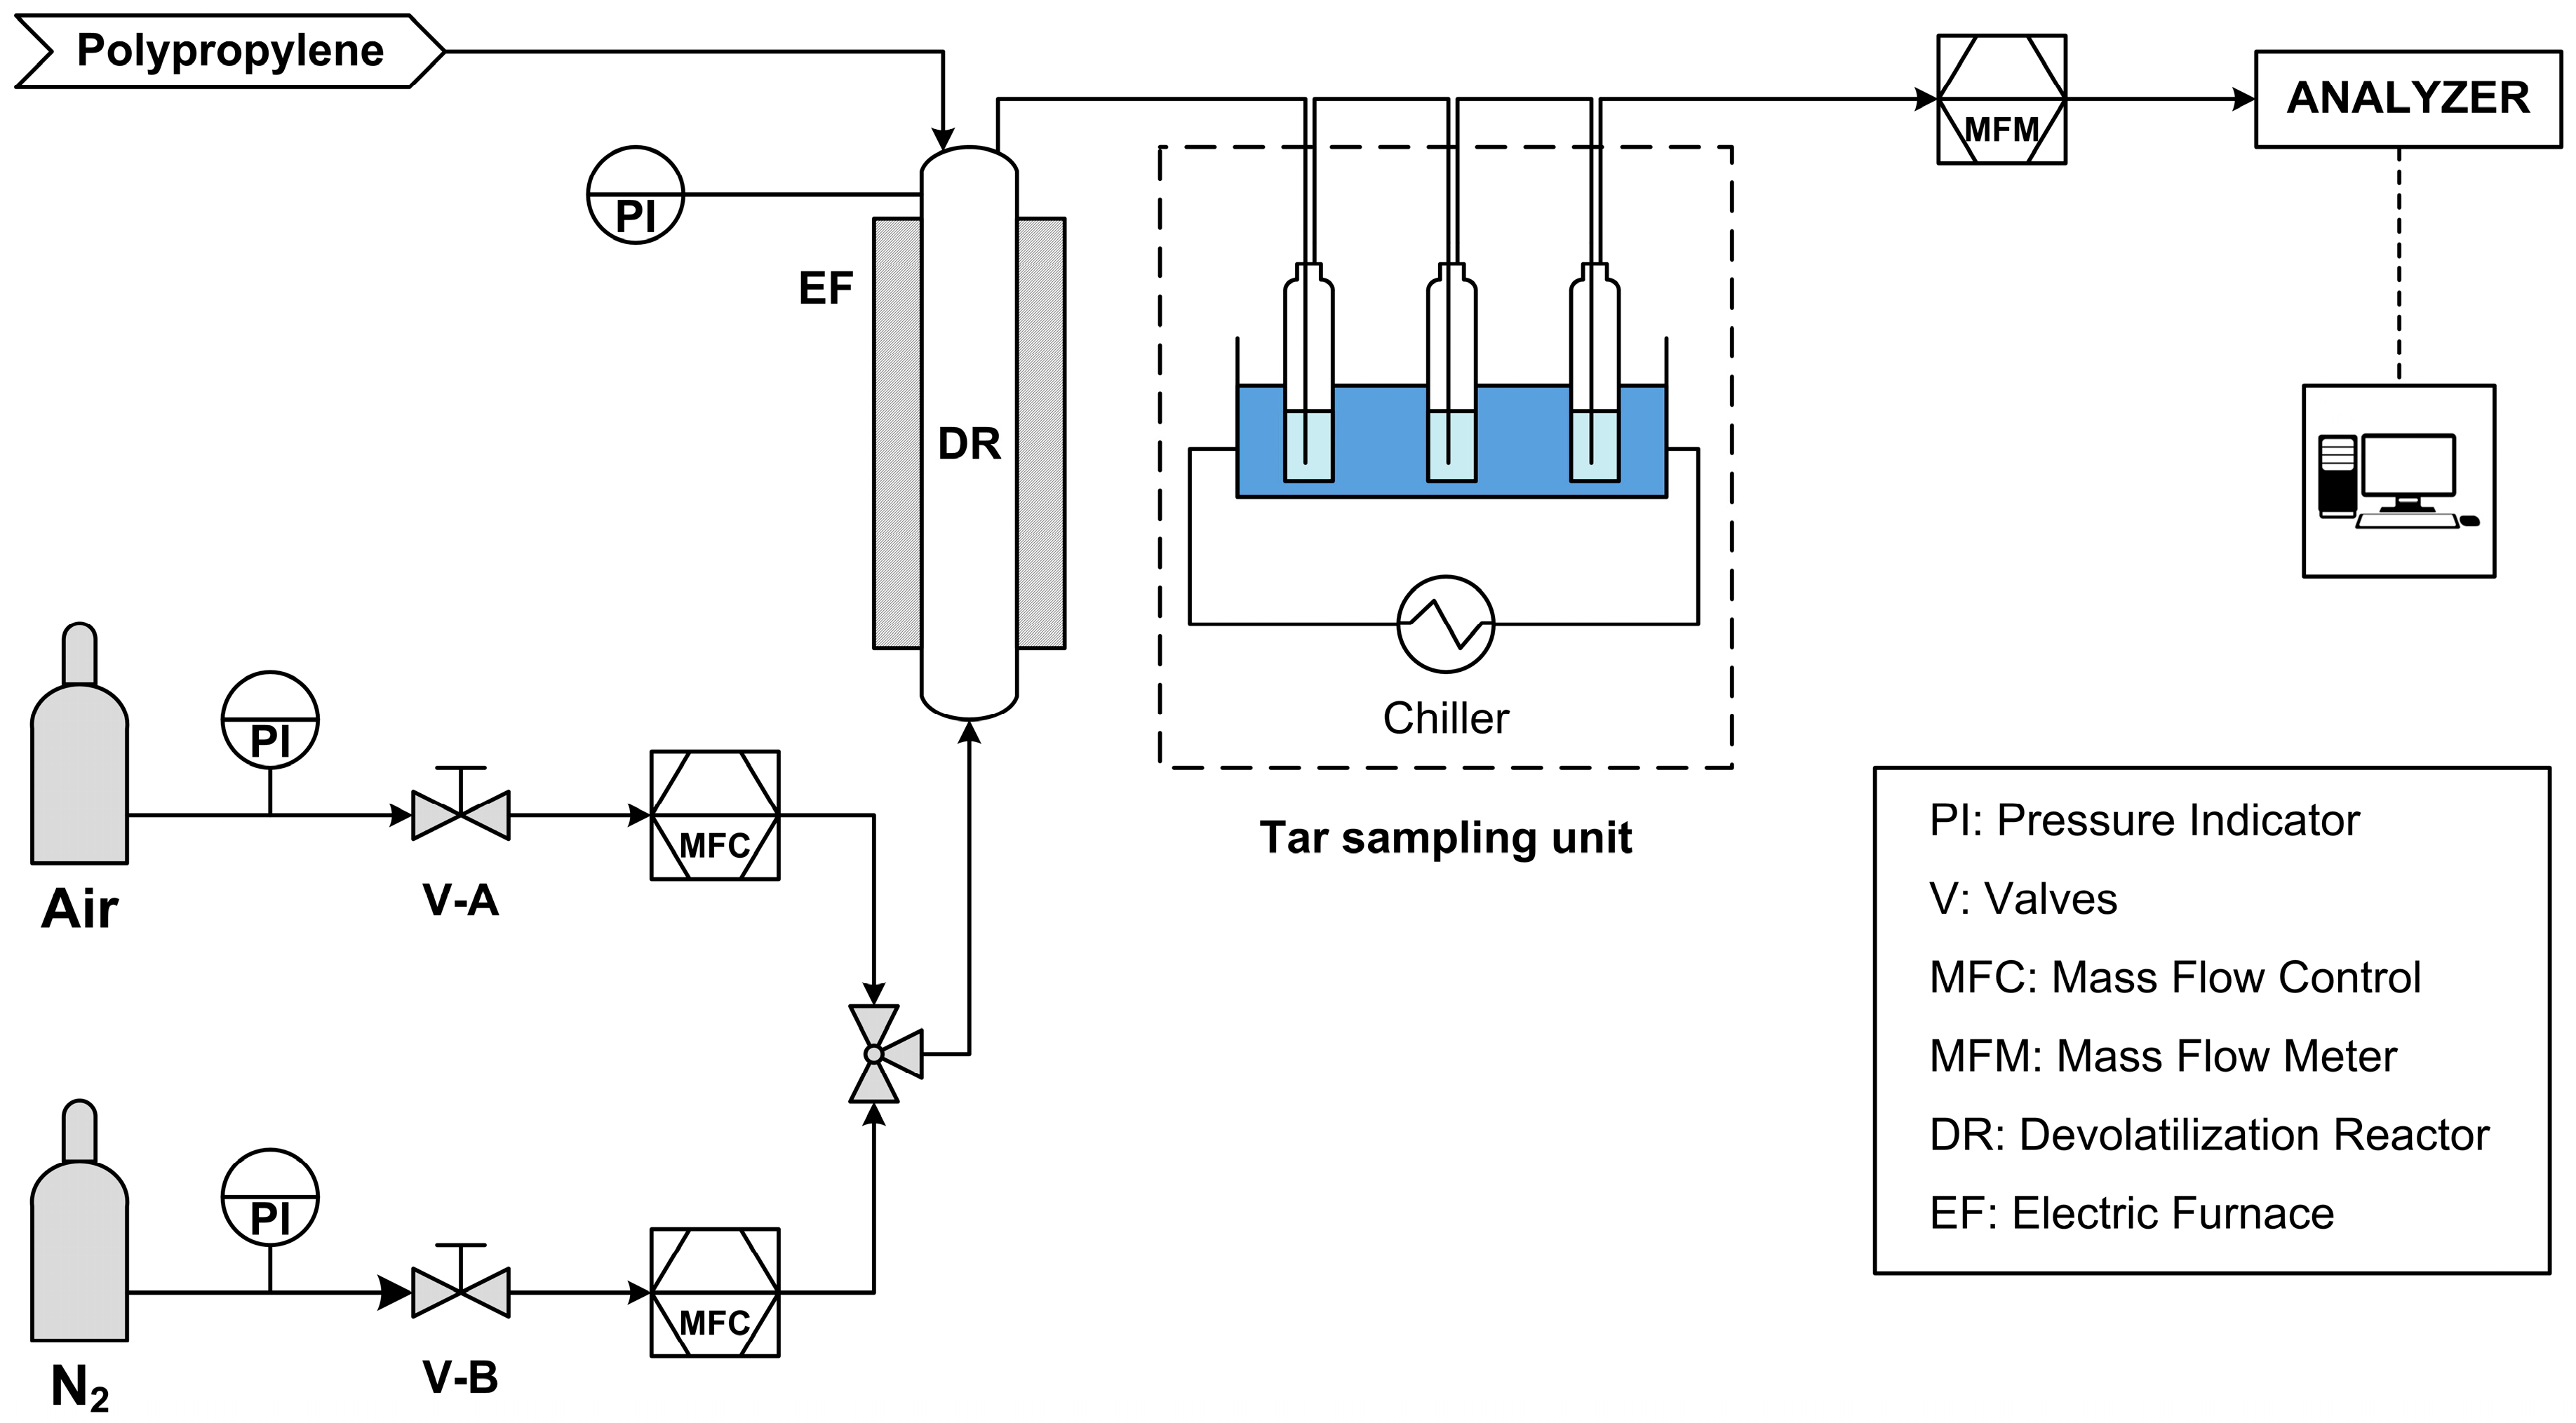
A schematic representation of the system used to conduct the devolatilization tests can be seen in Figure 3.
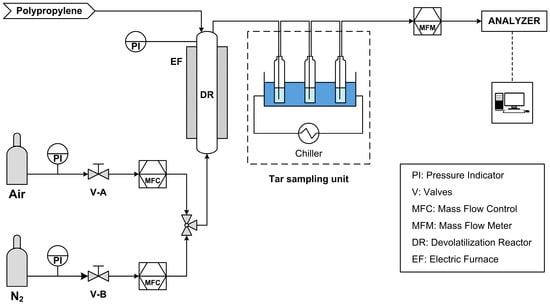
Figure 3.
Schematic diagram of devolatilization test plant.
The system consists of several units for the measurement and control of the process parameters:
- MFC, or Mass Flow Controllers, to control the flow rates of air and nitrogen, these two gases flow to the reactor in two distinct phases: the devolatilization phase, when nitrogen is introduced; the combustion phase, when air is introduced instead.
- PI, pressure gauges, both on the feeds and on the reactor itself, thus making it possible to monitor any leaks along the line and in the reactor.
- EF, electric furnace, to bring the reactor up to the process temperature.
- DR, devolatilization reactor (ID = 60 mm, H = 580 mm, Hbed = 90 mm).
- MFM (Mass Flow Meter), to measure the producer gas flow rate leaving the reactor.
- Thermocouple, for temperature control within the reactor.
- Analyzers, ABB in-line analyzers (Caldos and Uras) that measure the instantaneous gas composition in terms of CO, CO2, CH4, and H2.
In addition, downstream of the reactor there is the heavy hydrocarbons sampling unit, which is a system for sampling the tars produced by the devolatilization process: the gas produced is sent into impinger bottles filled with isopropanol and kept at a constant temperature of −10 °C to promote tar condensation and sampling. The sample taken is subsequently analyzed with GC/MS (Gas Chromatography with Mass Spectrometry, Agilent 7890/5975C—Agilent technologies, Inc., Santa Clara, CA, USA), to quantitatively and qualitatively define the heavy aromatics produced during devolatilization. The GC column used is a HP-5 ms capillary column with a length of 30 m, a diameter of 0.25 mm, and a film thickness of 0.25 µm. Helium was used as carrier gas. The method consists of a dwell at 30 °C for 8 min, a ramp up to 220 °C with a heating rate of 7 °C/min, and a final dwell at 220 °C for 5 min.
The PP sample is dropped into the reactor from the top through a dual valve system to ensure that an inert atmosphere is maintained. PP spheres fall directly into the bubbling bed, where they are heated fast up to the operating temperature, thus reproducing the conditions that best represent the practical applications, in which the feed point is just over the bed surface.
2.3. Test Procedure
Experimental tests were performed by varying either size of the PP particles and temperature of the fluidized bed.
The experimental tests were carried out following a well-defined procedure to define the production of gas, char, and tar and to allow a parametric analysis of the devolatilization process.
The first step is to feed the reactor with a defined flow rate of nitrogen, so to ensure an oxygen-free atmosphere within the whole system. Single polypropylene particles, as mentioned above, are injected from above, instantaneously. In each devolatilization test, only a single plastic particle was fed to the reactor, so that interaction with other reacting particles does not exists and concentration and residence time of devolatilization products (organic vapors) are low enough to minimize gas phase and heterogeneous secondary reactions.
The flow rate of the whole gas is measured by MFM, whereas the composition in terms of carbon dioxide, carbon monoxide, methane, and hydrogen is analyzed by ABB analyzers (Caldos and Uras); the tars present in the gas phase, on the other hand, are determined by the analysis of the isopropanol in the impinger bottles downstream of the reactor.
The online measurements by ABB are also complemented by specific analyses to identify other hydrocarbons present in the produced gas; for these analyses, gas bags were taken and subsequently analyzed by an Agilent 990 Micro-GC gas analyzer (Agilent technologies, Inc., Santa Clara, CA, USA).
Devolatilization tests were repeated 10 times for each operating condition.
Approximately 10 to 15 min after the injection of a sphere, when the ABB analyzer came back to zero values of CO, CO2, CH4, and H2 and the flow rate measured by the MFM was equal to that of the nitrogen flow, the next sphere was dropped onto the fluidized bed.
A measure of the spheres devolatilization time is obtained from the profile as a function of time of gas released.
The response obtained from each test is the result of the dynamics of the devolatilization process plus mixing and transport lags effects. To avoid axial mixing, connection lines with high length to inner diameter ratio were used.
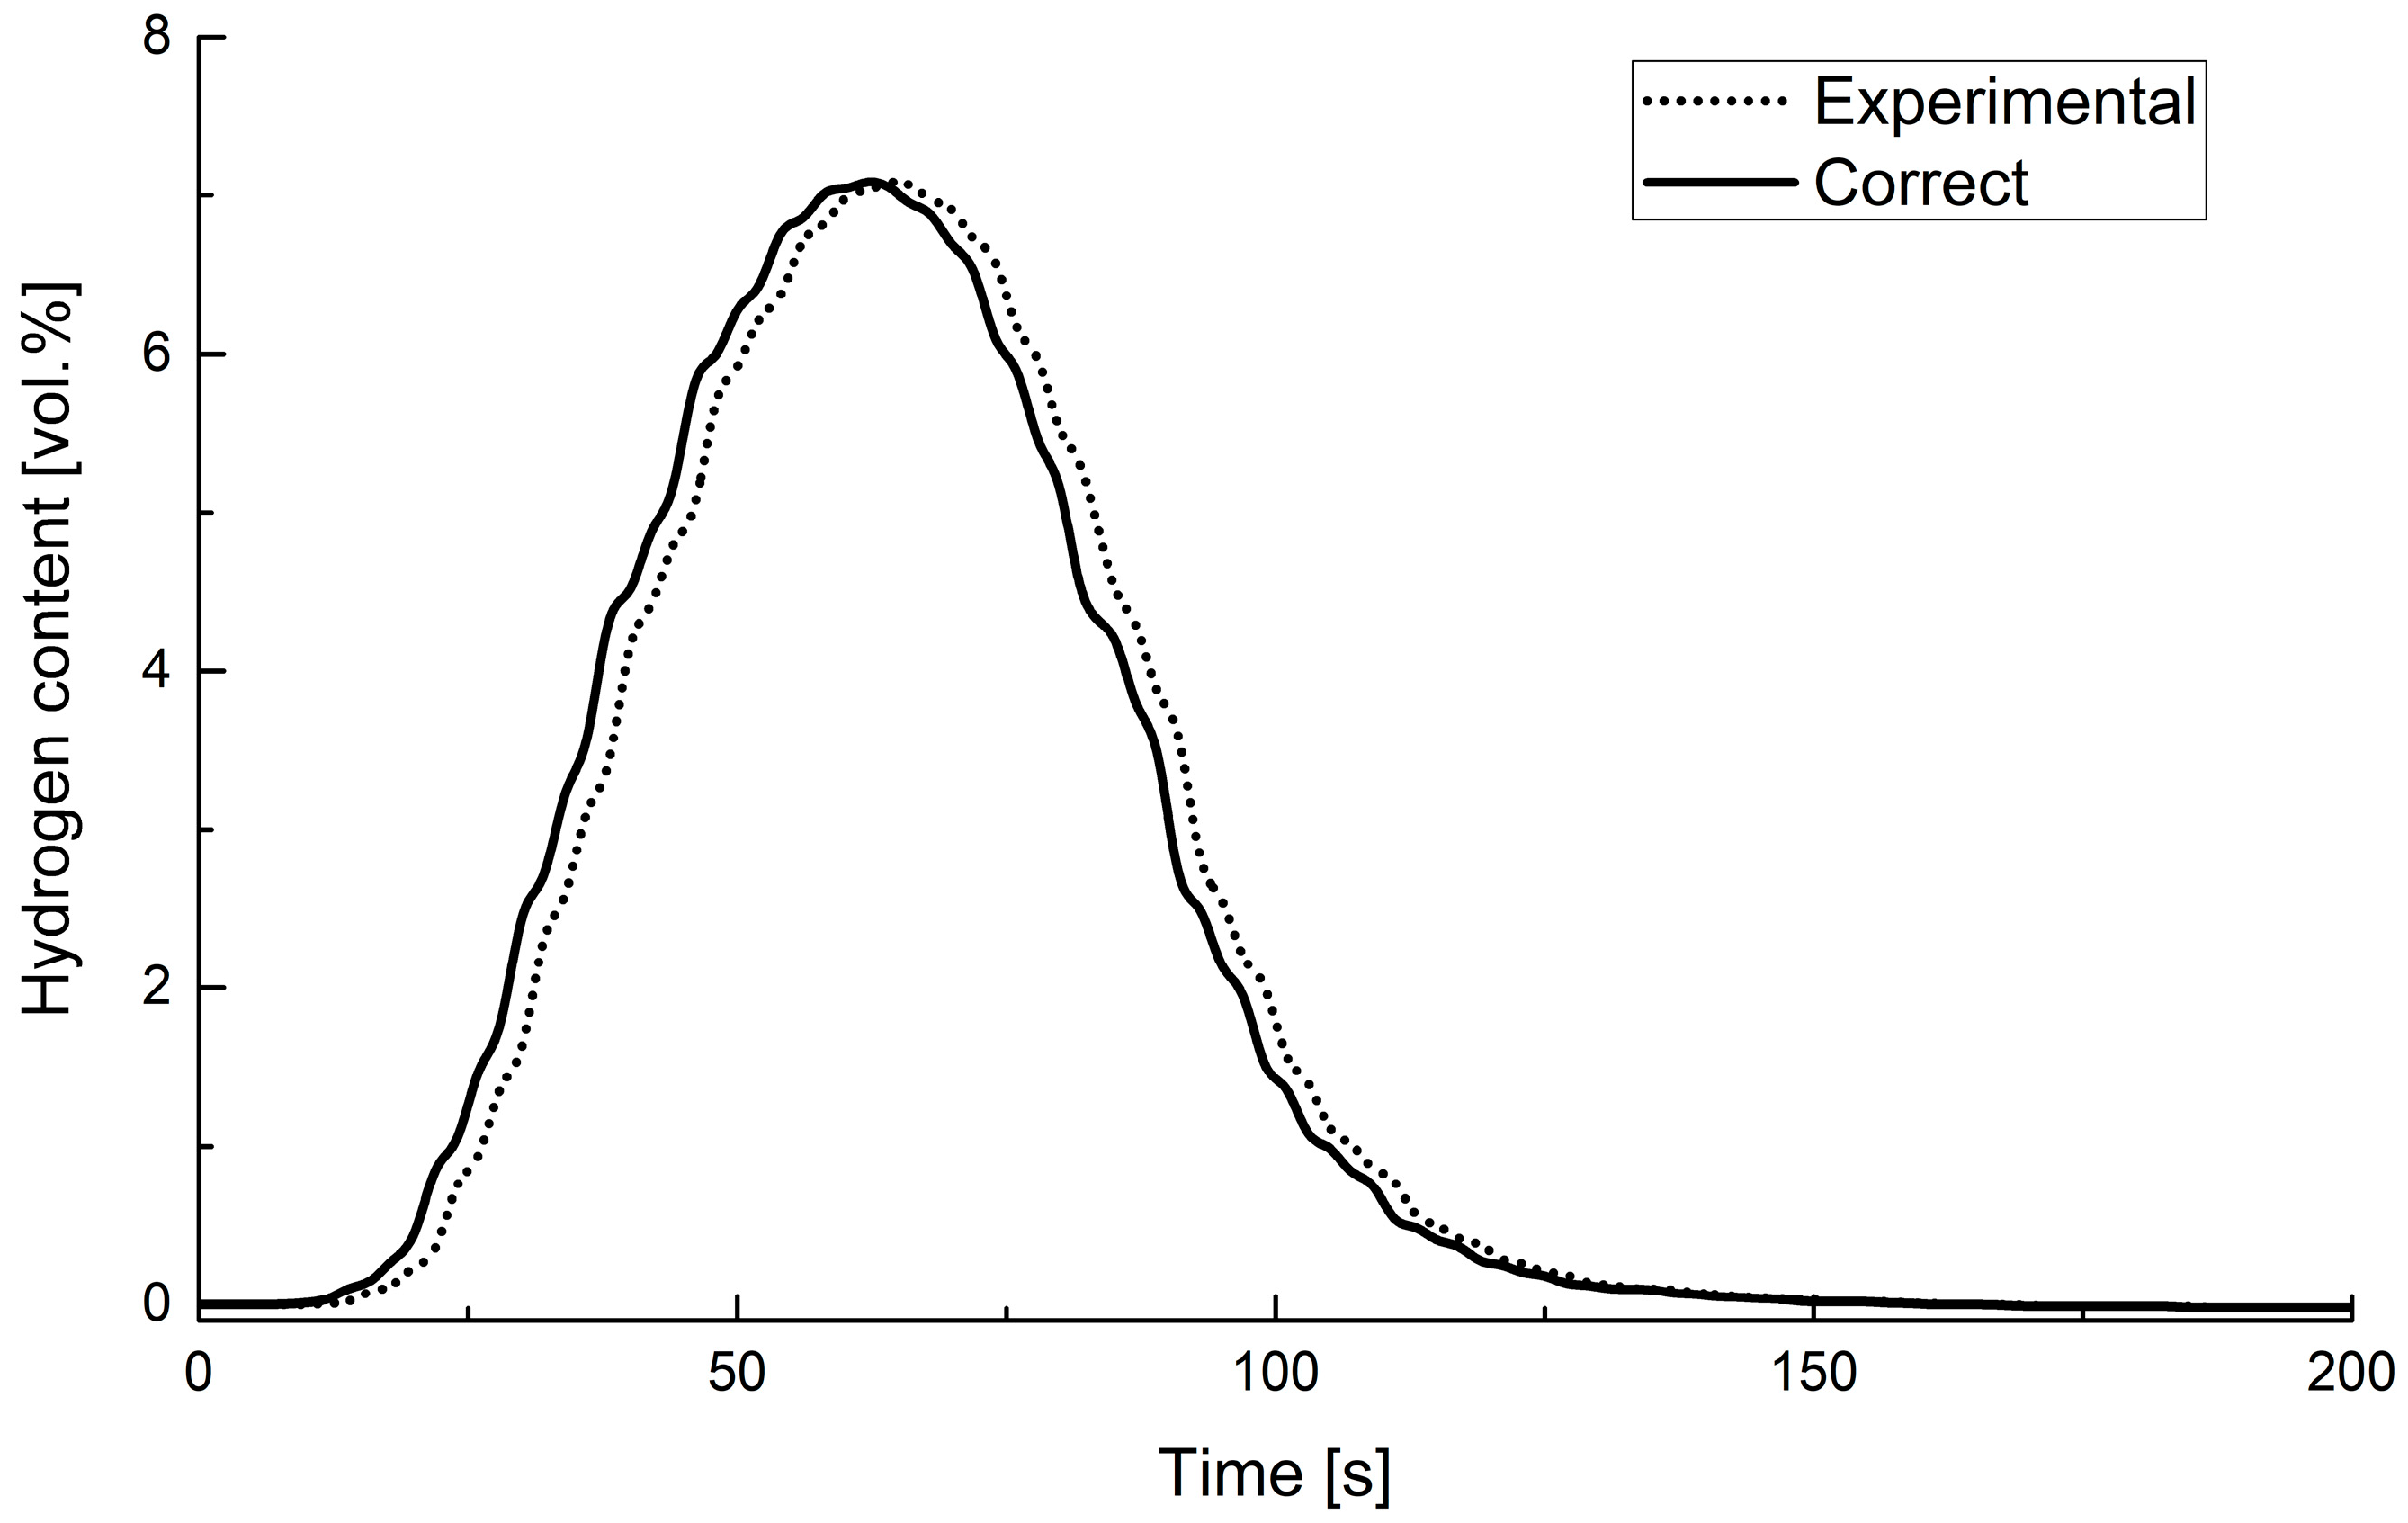
According to the procedure reported in the literature [32], the elimination of external effects was carried out by performing tests on residence times with tracer gas (CO2). An example of the experimental data correction is shown in Figure 4.
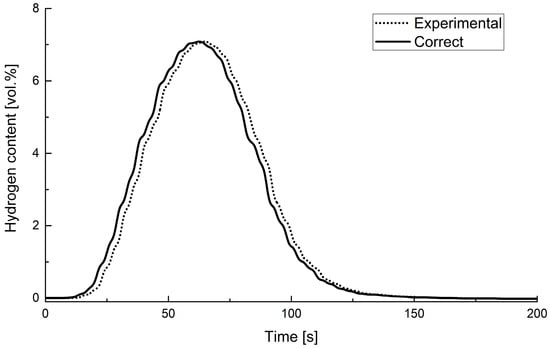
Figure 4.
Measured and corrected values of hydrogen concentration as a function of time.
Comparing the corrected data and the raw experimental ones supports the negligibility of mixing and transport lag effects of the system, ensuring the accurate assessment of the devolatilization time.
Finally, the combustion step was carried out. In this phase, air at a fixed flow rate is fed to the reactor and the flow rate of gas produced and its composition (in term of CO and CO2) are measured. From these data, the amount of char remaining inside the reactor was determined.
By performing the complete series of tests for each combination of the above operating parameters, it is possible to identify the optimal operating conditions and derive the kinetic expressions that best fit the experimental results.
2.4. Mathematical Model
The thermal decomposition of a solid is a complex phenomenon, and its modelling is extensively studied; in this paper, a simplified semi-empirical approach is specifically adopted, which uses a small number of parameters that can be easily estimated through experimental data obtained from devolatilization tests.
The approach taken is much simpler than that frequently adopted to describe kinetics and thermally induced chemical reactions of solid feedstock; it takes its cue from the kinetics of homogeneous reactions and postulates a first-order single-stage global reaction pseudo-mechanism [33].
This simple approach based on thermoneutrality of the devolatilization allows to accurately describe particles consumption inside the fluidized bed using simple heat exchange parameters and taking into account the simultaneous particle dimension variation. As it is well known, heat transfer from a hot fluidized bed to a “cold” particle is characterized by a very short time, of a similar order to that of devolatilization at the high temperature levels investigated in this study. As result, the addition of other heat transfer mechanisms or shape changes of particles (like those related to melting process) would not change appreciably the time scale of the process considered here. The melting of particles could also correspond to a change of shape commonly neglected in literature; in addition, during the injection of the PP particle, it rapidly sinks in the bed thanks to the coating created by the attached sand and due to this a spherical shape could be maintained [34,35].
Using this pseudo-first-order kinetics, it is possible to describe the mass consumption and the amount of gas released like a chemical reaction, useful for the implementation in more complex gasification models.
The kinetics of the process (more properly, the “conversion” kinetics) is characterized by an apparent activation energy and a pre-exponential factor. External and intra-particle mass transfer resistances are incorporated into the overall kinetic expression [36]. The endothermic and exothermic reaction paths are assumed to be at thermal equilibrium, so that the overall change in the enthalpy of devolatilization can be ignored; this assumption of a thermo-neutral process is widely applied in the literature, even in more sophisticated models [37].
Of particular interest is the pre-exponential factor used in the kinetic equation; it is expressed through a power law function of the change in diameter of the fuel particle with respect to the reference particle, this factor being necessary for fitting the experimental data. The starting point for modeling comes from the equations of conservation of mass and energy.
The temperature profile within the PP sphere, after it is fed inside the reactor, is derived through the application of Fourier’s law—a law that describes the conduction of heat within a homogeneous spherical particle.
This equation is solved with the initial condition and boundary conditions showed below. The boundary conditions on the particle surface consider the exchange by convection and radiation up to the bed temperature; in particular, the decomposition reaction is considered to begin once the ignition temperature of 360 °C is reached [34,38].
I.C.
B.C.s
The apparent devolatilization kinetics for a particle, in accordance with the concepts expressed above, can then be described by the following differential expression, in terms of conversion, which includes pseudo first-order kinetics:
With the term Kg, kinetic “constant”, averaged along the radius of the particle, calculated as a function of temperature. This value is calculated at each time step according to the equation below.
As mentioned above, the pre-exponential factor A that appears in Equation (8) depends on the initial particle size:
Thus, an additional parameter ψ was introduced to adjust the pre-exponential factor according to the initial size of the fed particle (D0i) from the reference particle expressed through D01.
The progression of devolatilization in turn determines the corresponding shrinkage of the particle diameter Dp(t), expressed through the equation below.
The parameter Dfin identifies the size of the residual ash at the end of the process.
This shrinkage corresponds to the release of a certain amount of gas.
The process and thus the conversion continue until the particle is completely consumed; the time required for the completion of devolatilization will be denoted as td.
Matlab® software (version R2019b Update 5-9.7.0.1319299) was used to solve the equations; in particular, a centered finite difference method was used for spatial discretization and the ODE 15S function was used to solve the equations in the time domain.
Using the results obtained from the laboratory tests, the kinetic parameters (Eapp, A1, ψ) necessary for modeling the process were derived following the fitting procedure reported by Jand and Foscolo [33]. The diameter of the smallest particle was chosen as the reference diameter (D01 = 8 mm) and was used for the determination of the A1 and Eapp parameters by a regression on the experimental data, exploiting the devolatilization time values as the temperature varies. The data on the devolatilization time as a function of temperature, for the largest particle (12 mm), were instead used to estimate the ψ exponent with a secondary fitting process that already implements the A1 and Eapp parameters derived earlier.
The data obtained from the tests were then used on the intermediate particle (10 mm) to validate the kinetic parameters found previously.
3. Results and Discussion
The trends of gas composition, measured online by ABB analyzer, obtained during the devolatilization phase and the combustion phase, are reported in the Supplementary Materials. Knowing the composition and flow rate of produced gas, the latter measured by MFM, it is possible to derive the molar flow rates of gas obtained. By integration of the curves, the whole amount of gas produced in each test was derived.
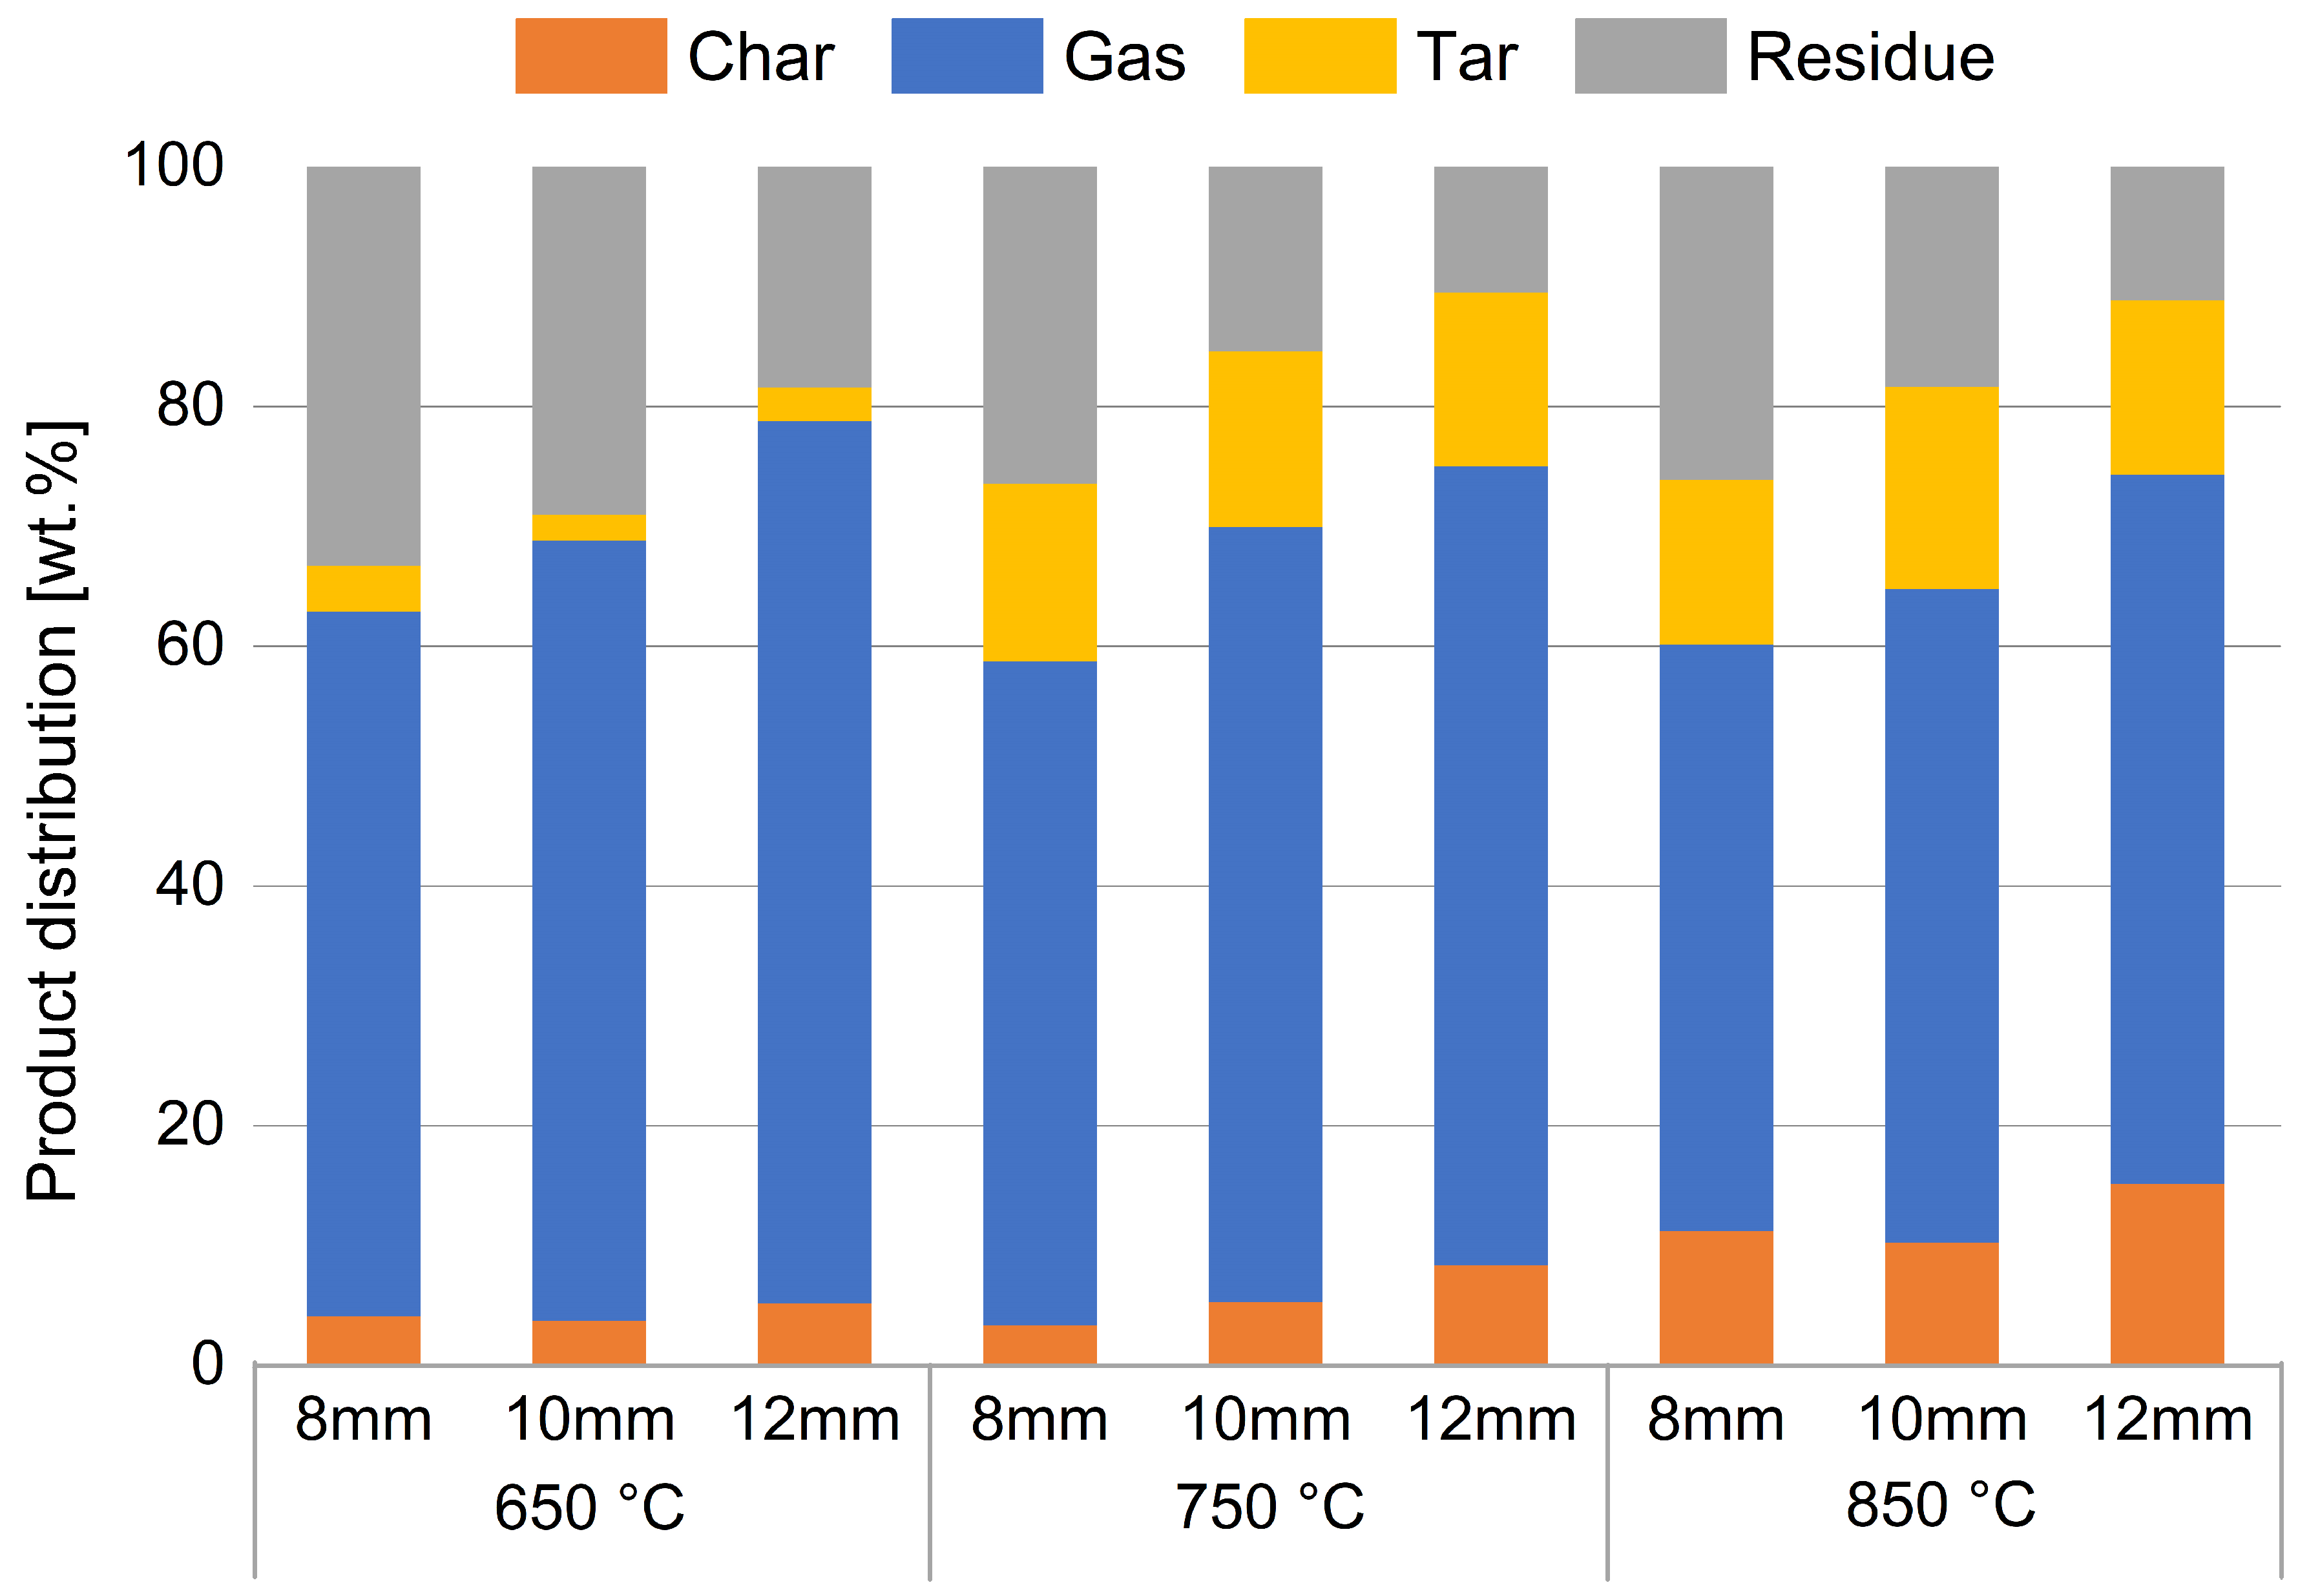
Using the procedure just described, the following results were obtained. A first key point to analyses is the distribution of products from the devolatilization process. Figure 5 shows the weight percentages of the individual products obtained for each set of particle size/temperature. The whole gas yield is measured by MFM, as mentioned above.
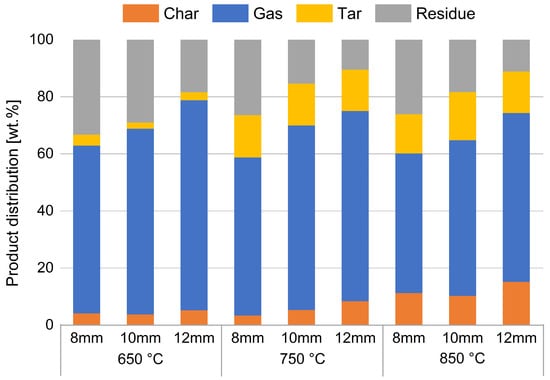
Figure 5.
Percentage distribution of devolatilization products. The whole gas yield is measured by MFM.
Subdivision of products is made into gas, tar, and char, measured as described above; residue is calculated through mass balances. This encloses the portion of unmeasured compounds and the portion of ash in the tested sample.
The unmeasured term is made up of those compounds not identified by the analyses performed and include heavy aliphatic hydrocarbons and additional aromatic compounds generated in the process; similar considerations are reported in the literature [39].
Figure 5 shows that, as the temperature increases, there is an increase in the percentage of char and tar (heavy aromatics) and a simultaneous decrease in the produced gas and residue. Furthermore, as the particle size increases, there is an increase in the percentage of char and gas produced and a simultaneous decrease in the residue, while the percentage of tar remains almost constant.
What is called char is probably obtained by the thermal cracking of heavy hydrocarbons that probably condense in the colder parts of the reactor. This observation justifies the presence of the solid carbon at the end of devolatilization process, while fixed carbon was not observed in proximate analysis. Due to the slower heating of the inner section of the particles, such compounds may create more in tests with larger spheres, as shown by the increasing trend in Figure 5.
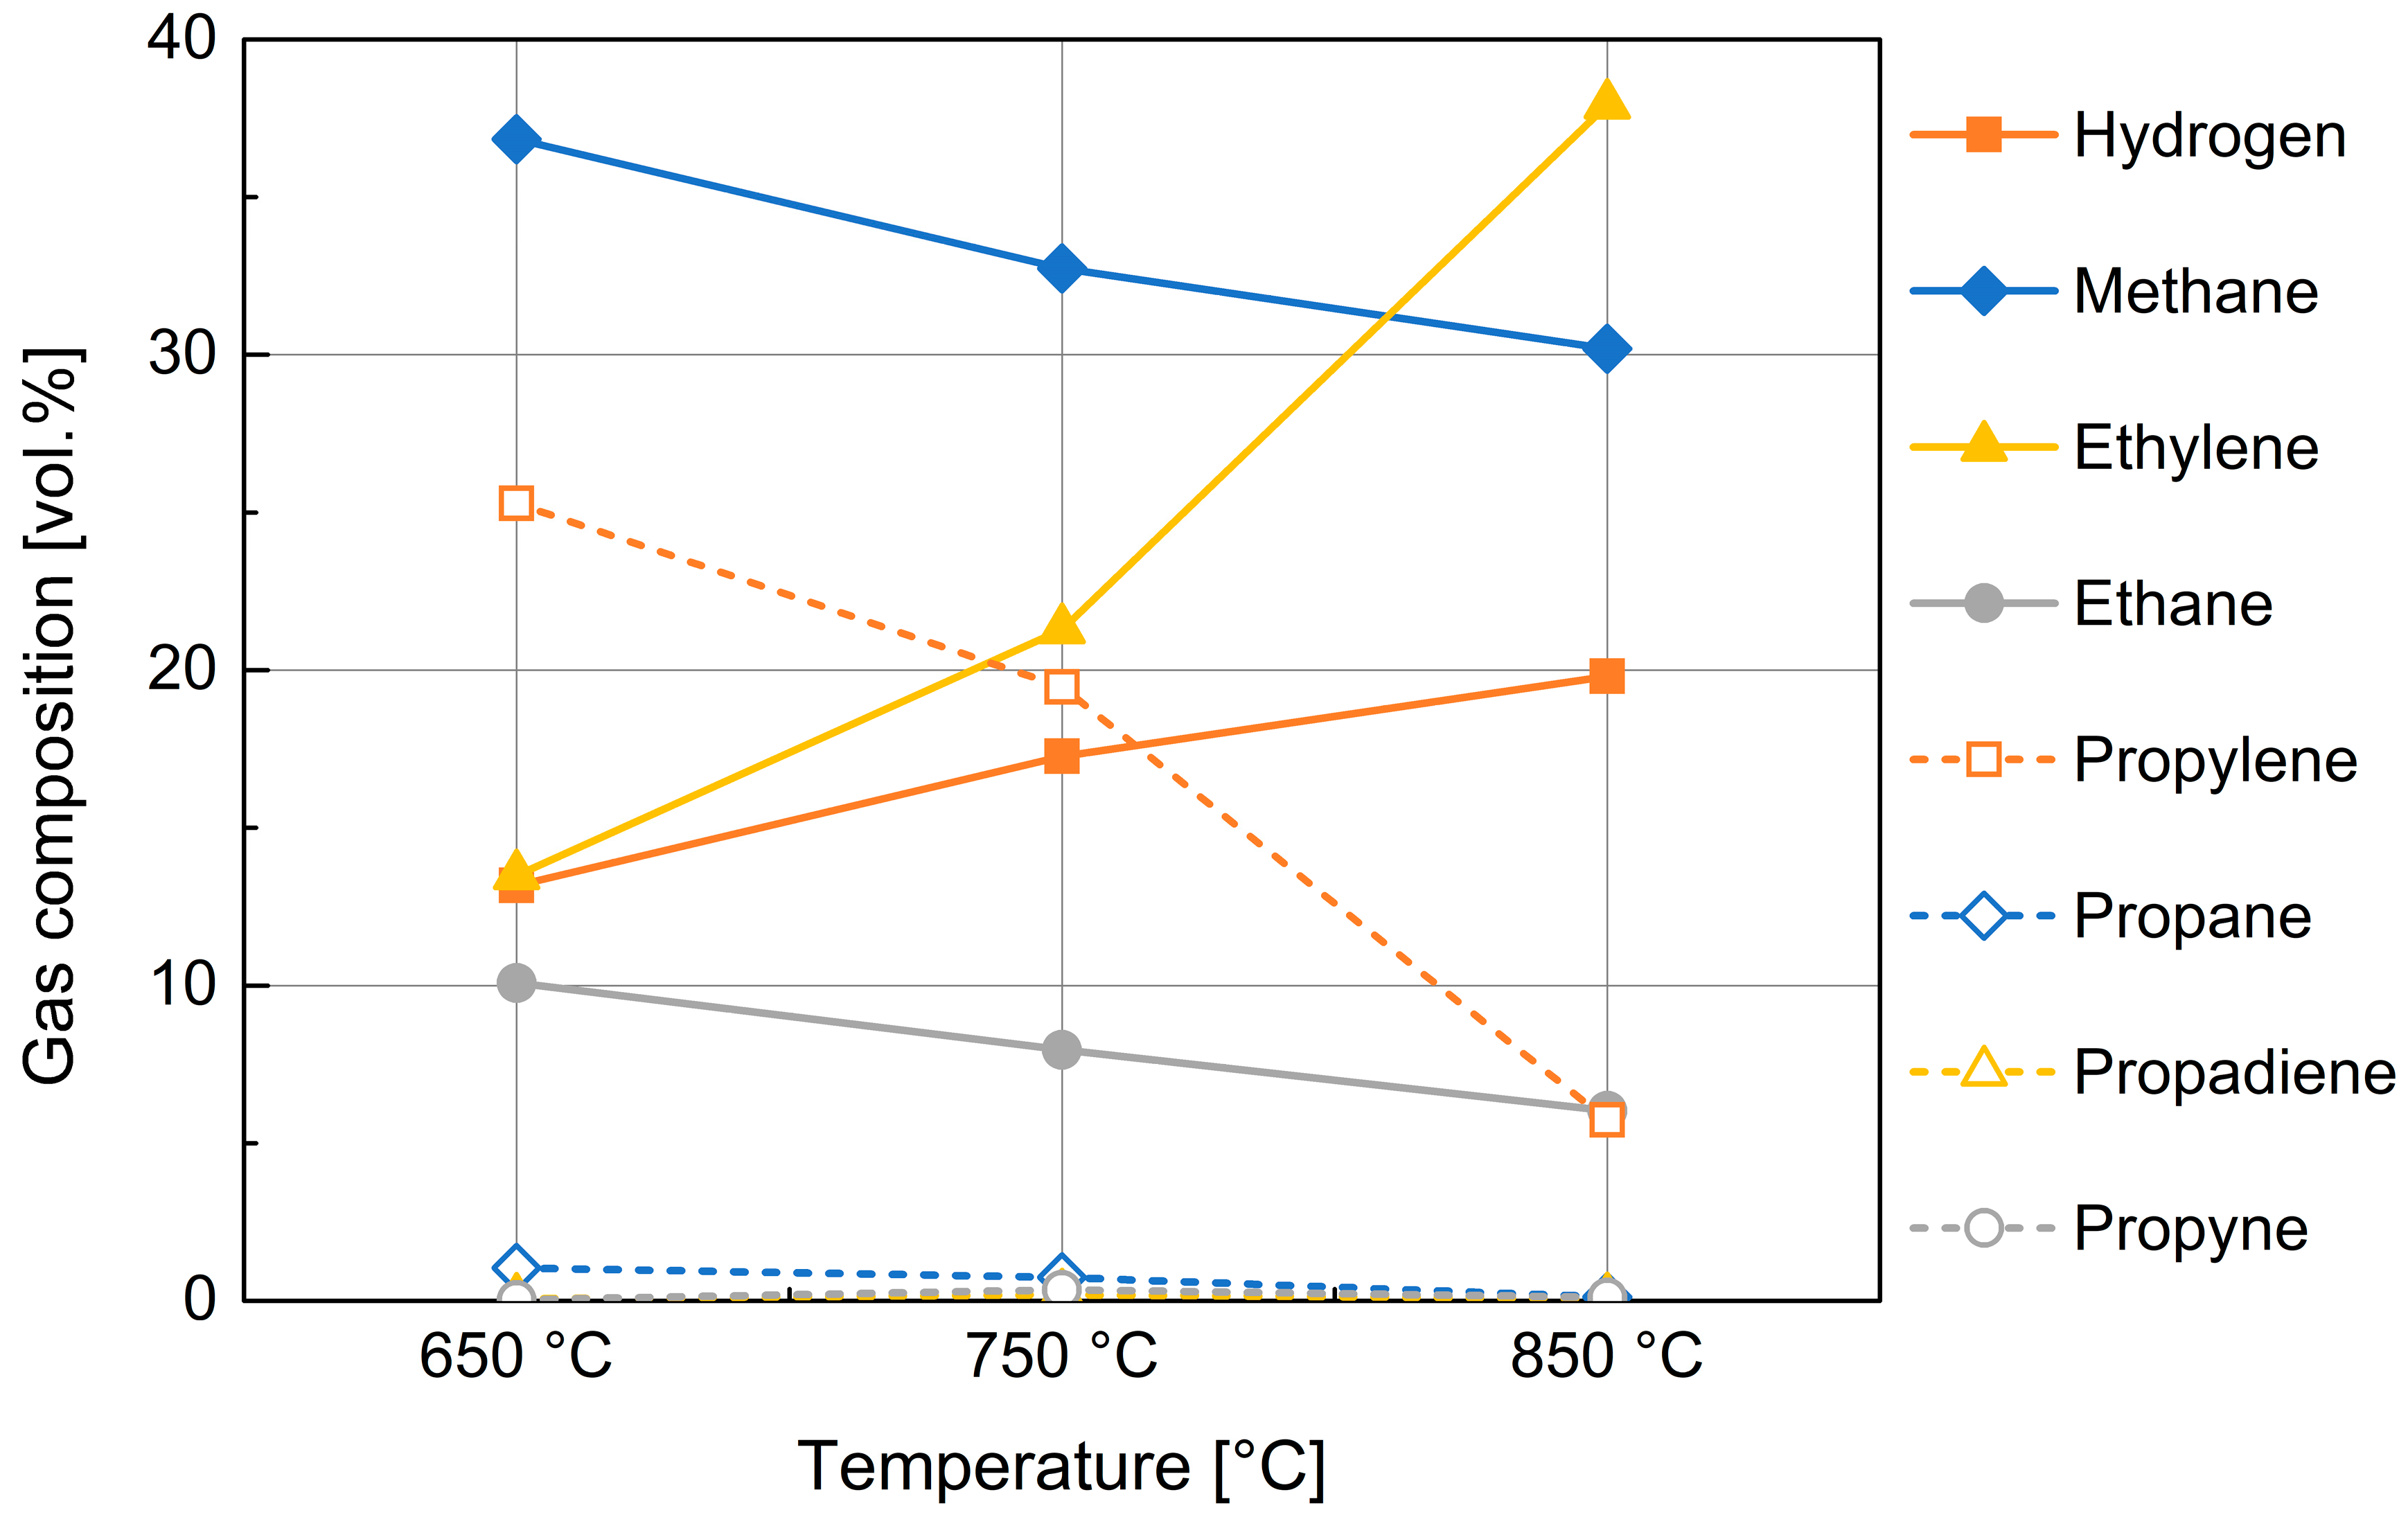
The behavior related to the increase in tar percentage with temperature is justified by the Diels–Alder and subsequent dehydrogenation reactions that involve molecular recombination of the released gases [40]. Due to these secondary reactions, the propylene, ethane, and propane contents decrease, while ethylene increases and the formation of aromatic hydrocarbons occurs (Figure 6).
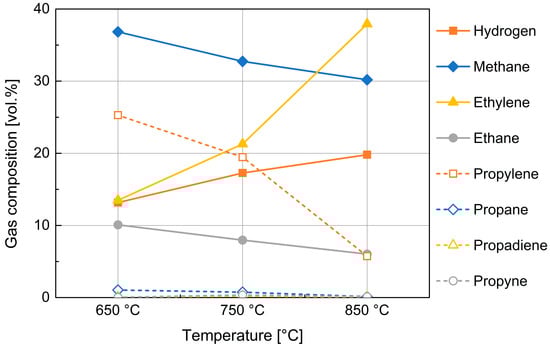
Figure 6.
Composition of the gas obtained from devolatilization of 10 mm PP spheres.
A similar behavior was observed in tests performed with plastic compounds by Jung et al., where the increase in tar concentration with temperature is explained by a conversion of heavy aliphatic hydrocarbons in aromatic compounds [39]. In particular, Jung et al. carried out pyrolysis tests of polypropylene pellets with a diameter of 2–3.35 mm in a bench scale fluidized bed at temperatures between 668 °C and 746 °C. Similarly to the results obtained in this work, they found that the percentage of the aliphatic and aromatic compounds varied between 30 and 43 wt.% with an increase in the aromatic compounds, from 10 to 27 wt.%, at increasing temperature. In addition, the residual char varied between 2 and 7 wt%. Mastral et al. carried out pyrolysis tests on HDPE at different temperatures (between 650–850 °C) and they also observed a relevant increase in the aromatic hydrocarbons with an increase in temperature, although no quantitative measurement of them was reported [41].
As mentioned in the previous section, product gas analysis by ABB in-line analyzer was complemented by micro-GC analysis for the identification of compounds different from CO, CO2, CH4, and H2 (Figure 6).
Figure 6 shows a rough composition of whole gas produced in the devolatilization process. The influence of devolatilization temperature is reported for the medium-size PP particles; the size of PP feedstock did not determine noticeable changes, at least in the examined range. The composition in hydrogen and methane, being cumulatively about one half of product gas by volume, is then better examined utilizing experimental data provided by the ABB analyzer, in relation of their importance for syngas quality.
Figure 6 also shows a substantial presence in the gas phase of more or less complex aliphatic hydrocarbons; among the hydrocarbons, a significant presence of ethylene, ethane, and propylene is noticeable; their composition is also found to be highly variable with temperature.
The data highlight a mechanism showing that at higher temperature values, greater molecular cracking results in the formation of lighter and more stable hydrocarbons (according to thermodynamical Francis Diagram).
The release of compounds similar to those found here is mentioned in the literature in thermal decomposition processes of polypropylene [38,42], as a further confirmation of the validity of these analyses.
Of particular interest in this last graph is the mirror-like behavior of propylene and ethylene which could highlight the cracking of the first and simultaneous formation of the second in agreement with the mechanisms of reactions reported in literature [43].
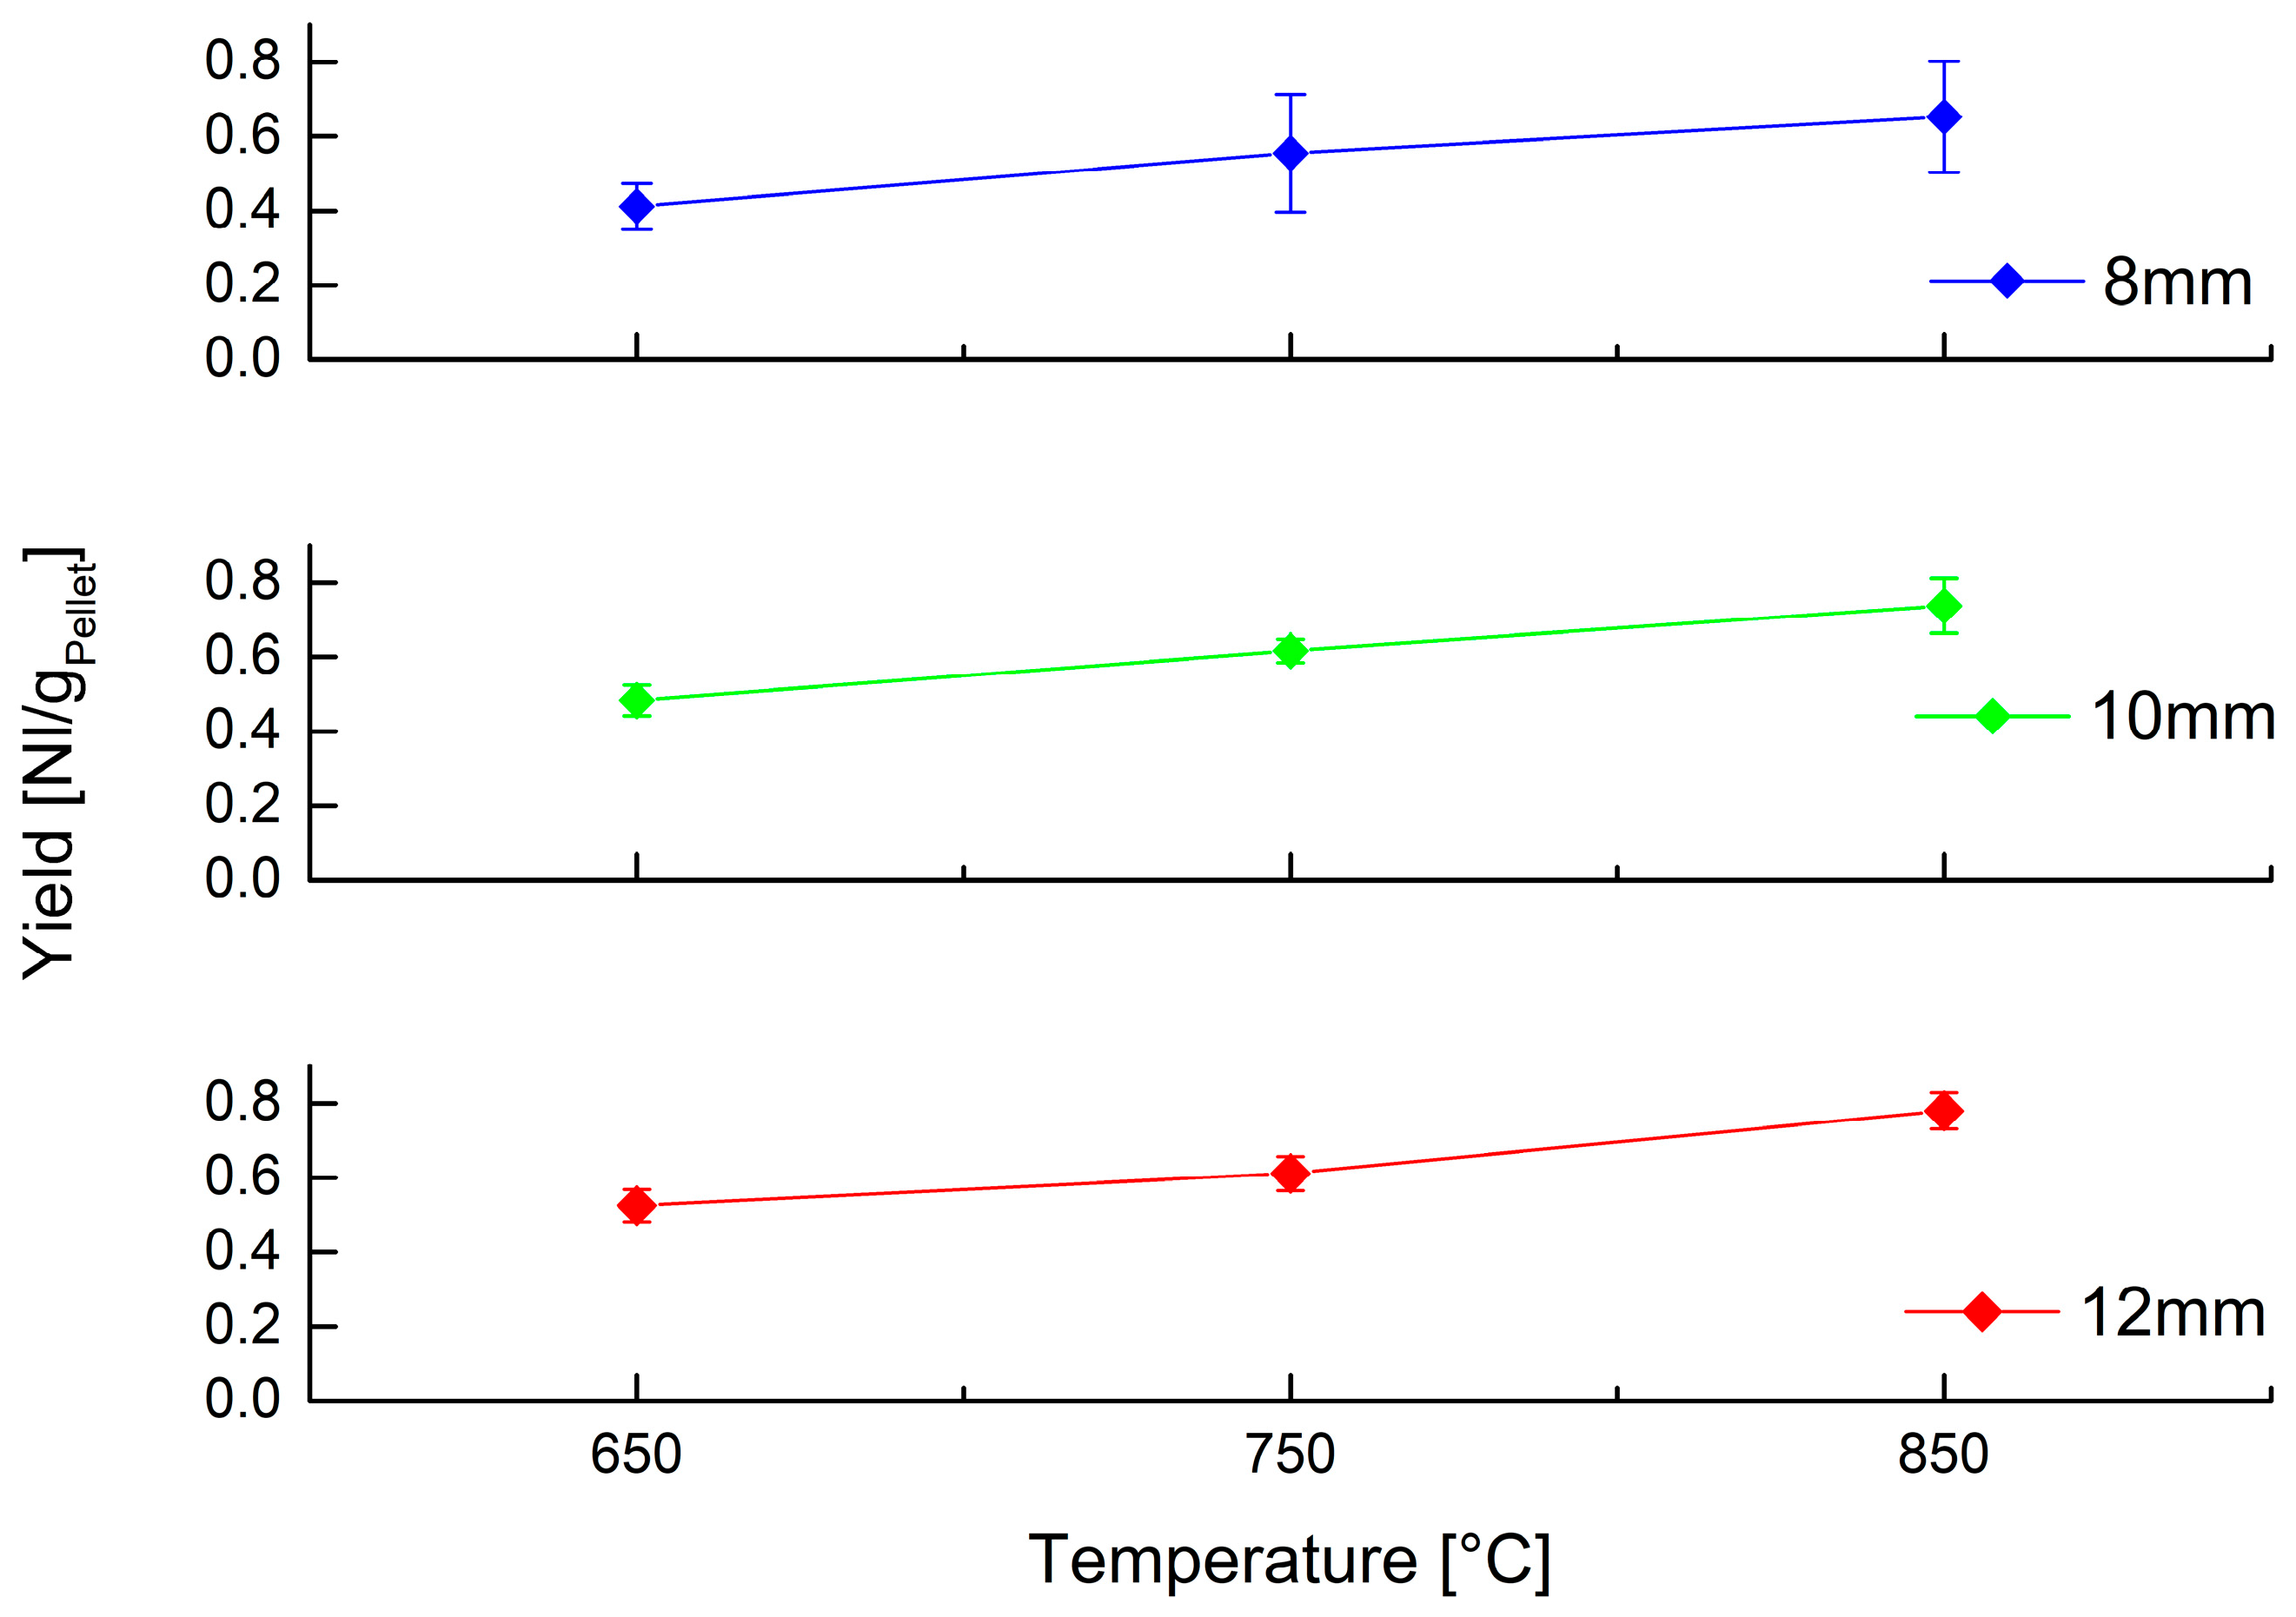
In addition to composition, it is important to quantify gas production, so Figure 7 shows the gas yield obtained for each combination of operating parameters.
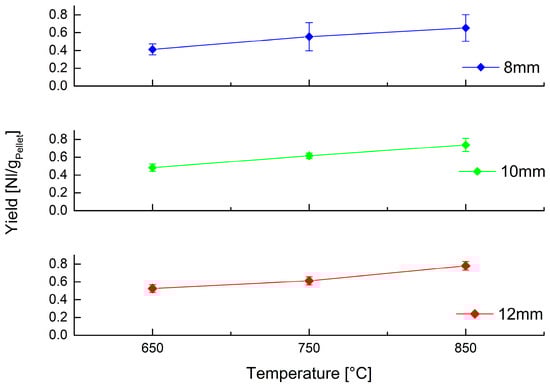
Figure 7.
Volumetric yield of gas obtained at different temperature by devolatilization of PP spheres of different size.
Yield also shows a similar trend as that highlighted above: temperature is the most relevant operating parameter, with an important influence on gas production, while size variation is less influential.
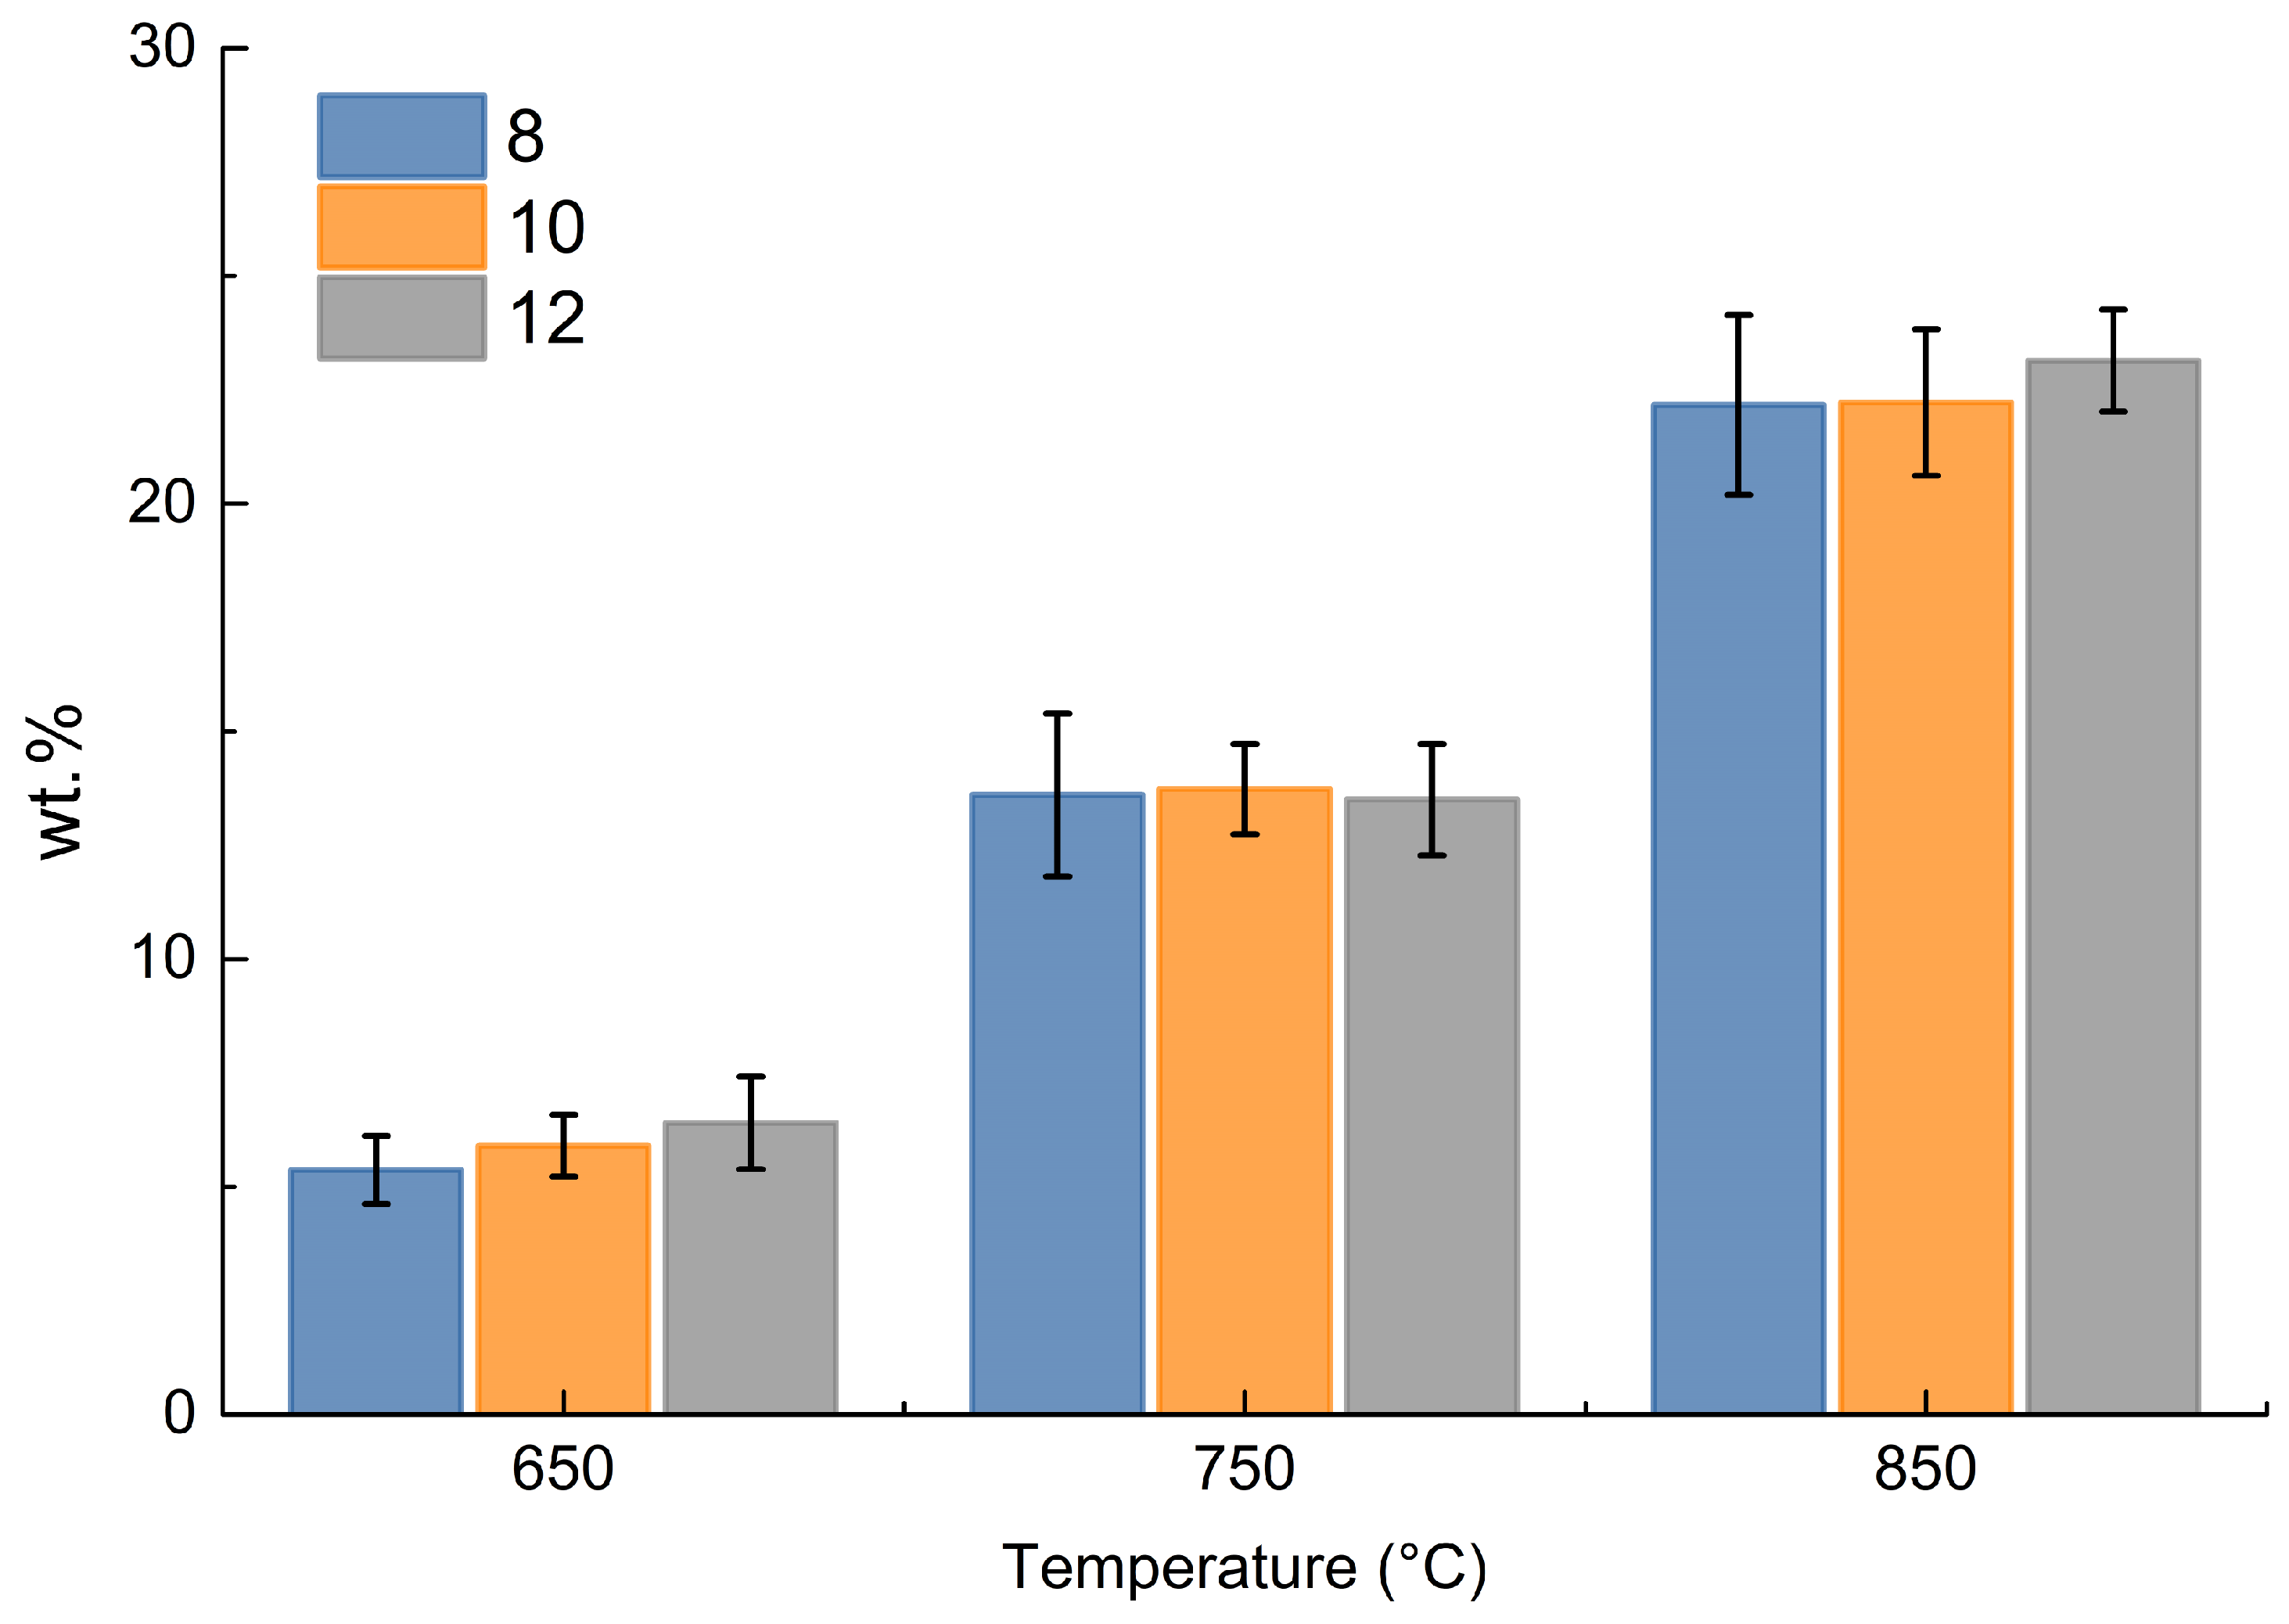
Focusing on methane and hydrogen produced, the following data by weight were obtained for each test from the measurements by ABB, as shown in Figure 8.
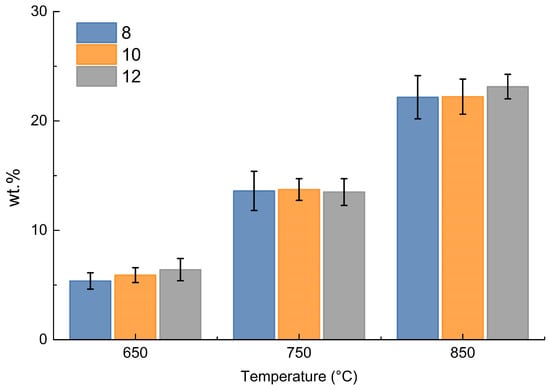
Figure 8.
Cumulative weight % of hydrogen and methane in the gas phase.
Figure 8 shows that the change in size is almost irrelevant in the production of hydrogen and methane, while the increase in temperature is the determining factor; as the temperature increases, there is an increase in hydrogen and methane production, which can be justified by increasing thermal decomposition toward light gaseous products at higher temperature.
This mechanism appears to be similar to that already analyzed by the micro-GC results.
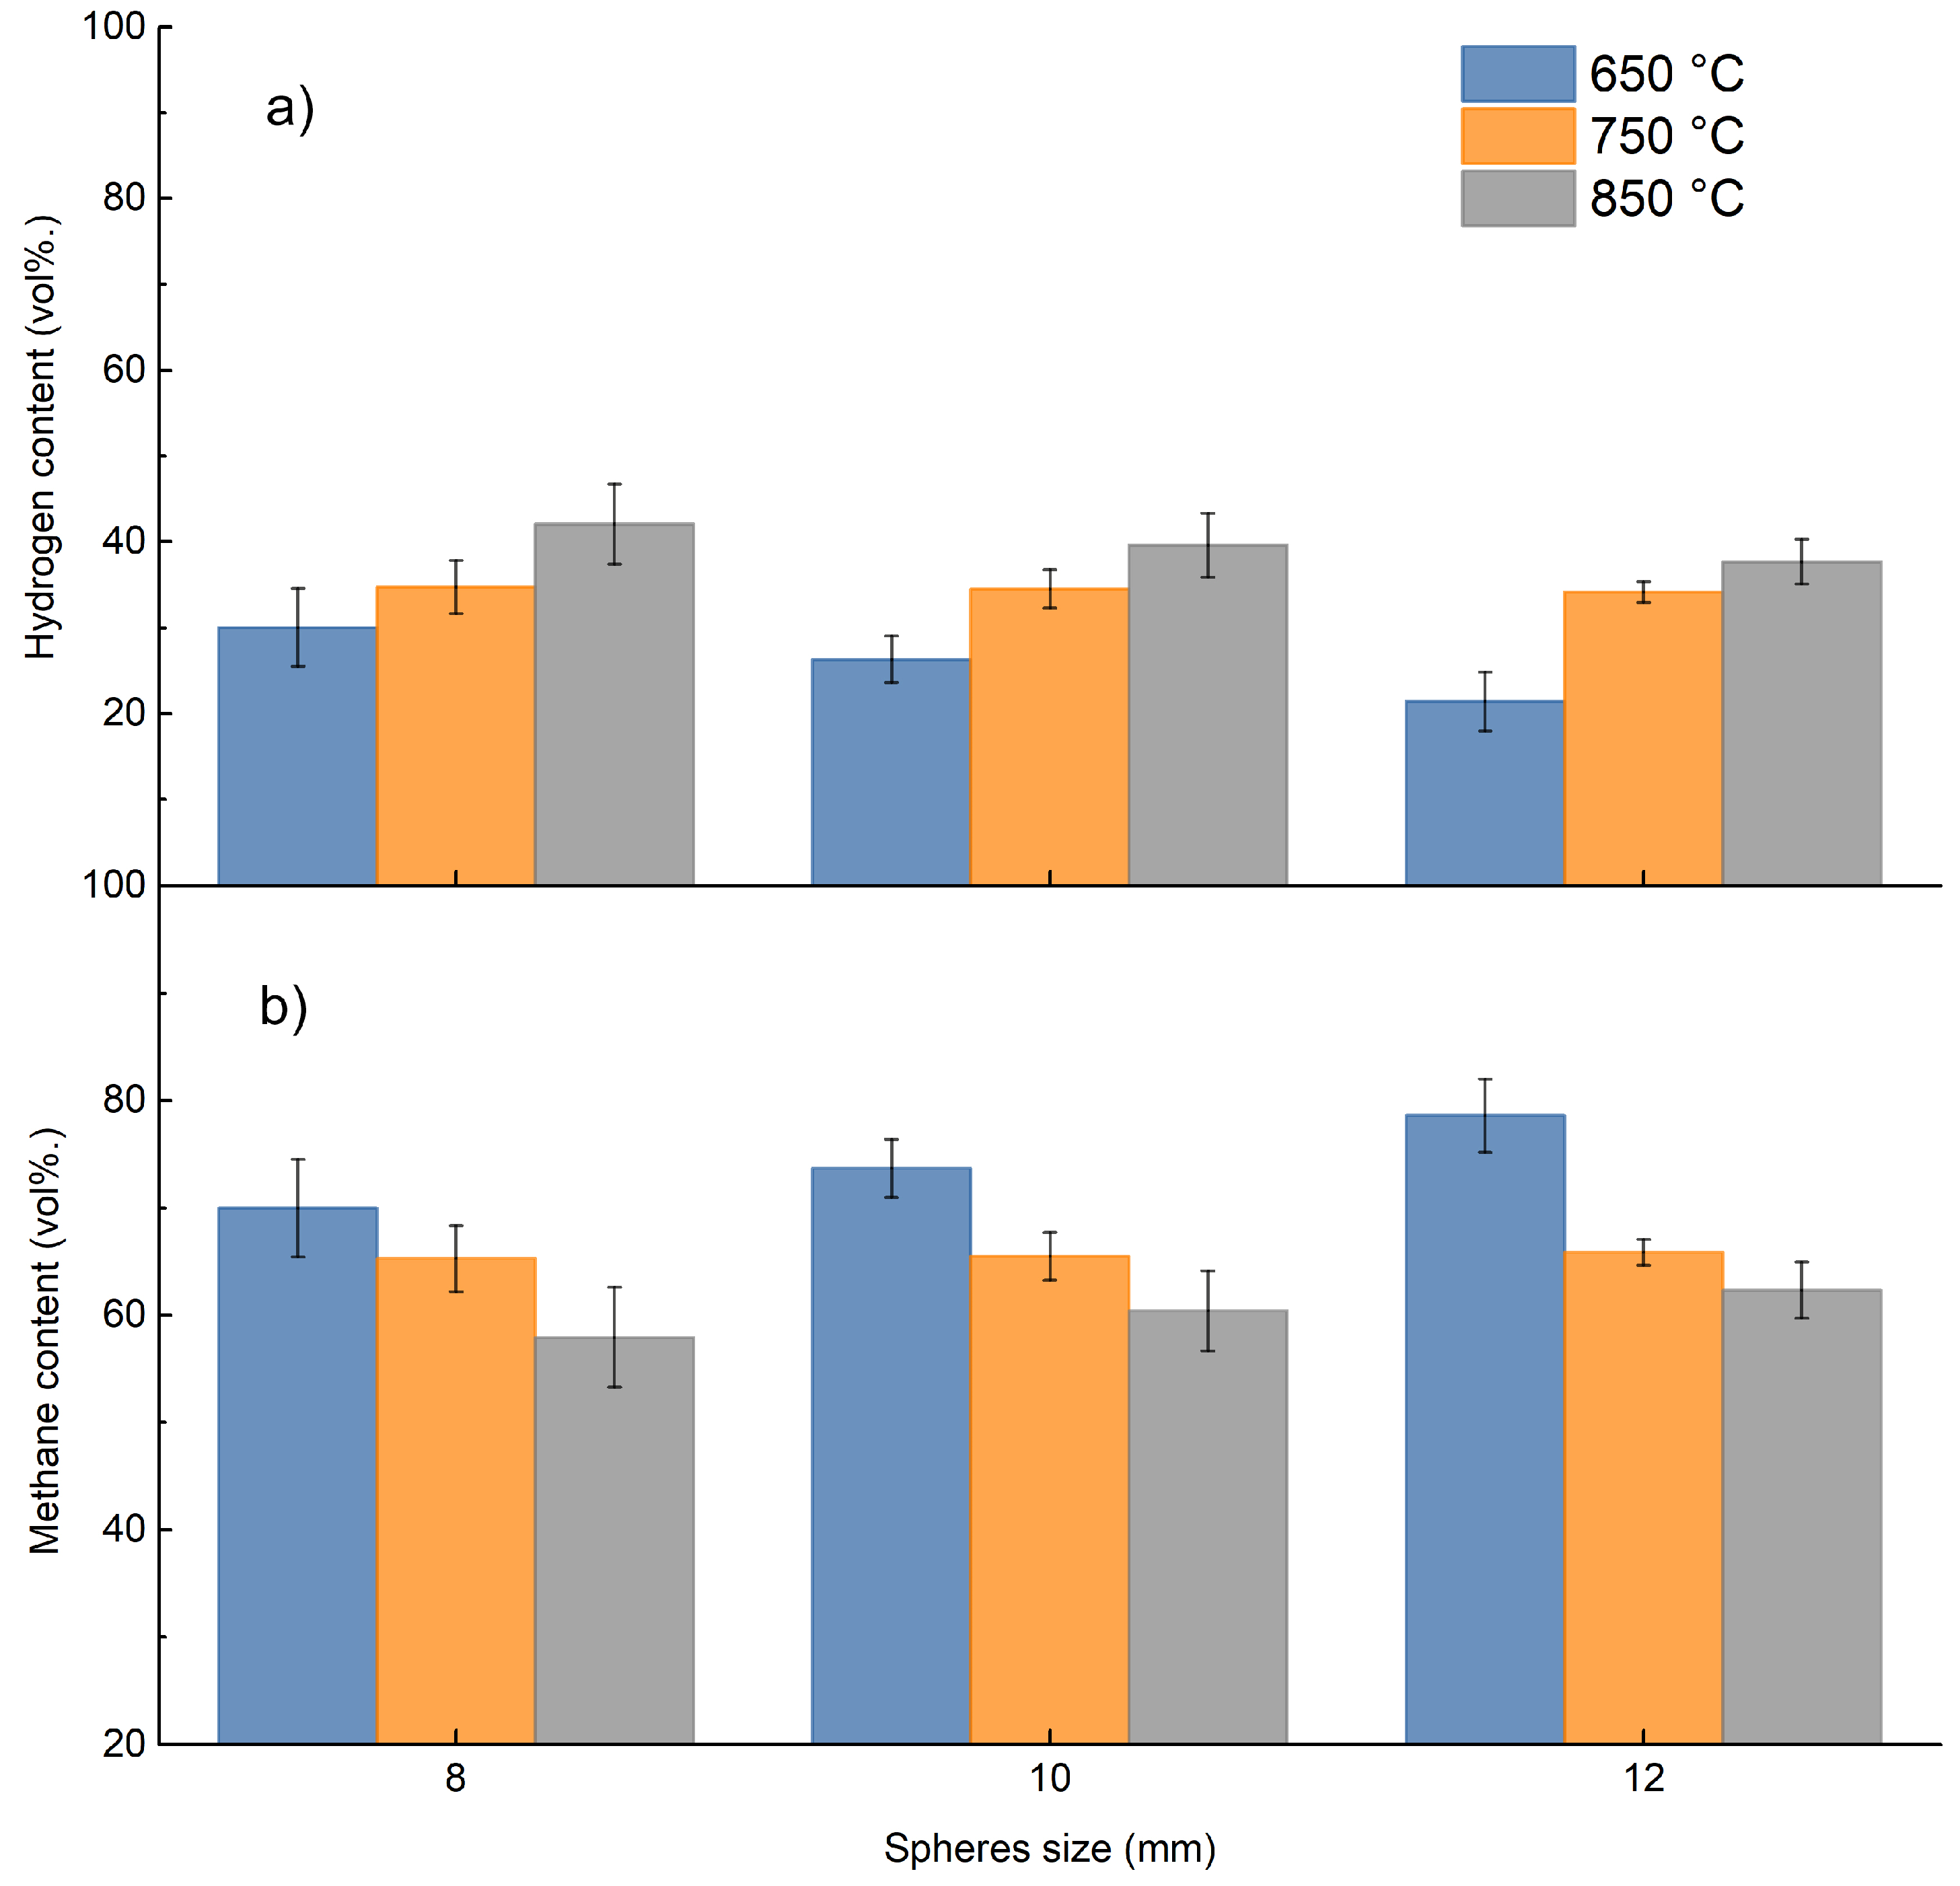
Figure 9 shows the volumetric relative composition of methane and hydrogen grouped by size as temperature changes. Figure 9 also shows quite good correspondence of hydrogen and methane relative composition between analysis with micro-GC and ABB online measurements, respectively.

Figure 9.
Percentage of hydrogen and methane in the gas produced as the size of the sphere changes: (a) H2 vol%; (b) CH4 vol%.
Figure 9 shows how temperature and size of the PP sphere influence hydrogen and methane relative composition; an increase in the operating temperature results in a substantial increase in hydrogen with a simultaneous decrease in methane composition; similar, however less obvious, behavior occurs as a function of the PP sphere size. The increase in sphere size probably results in slower decomposition. From these considerations, it is then possible to select a favorable temperature and PP sphere size in relation to the desired product.
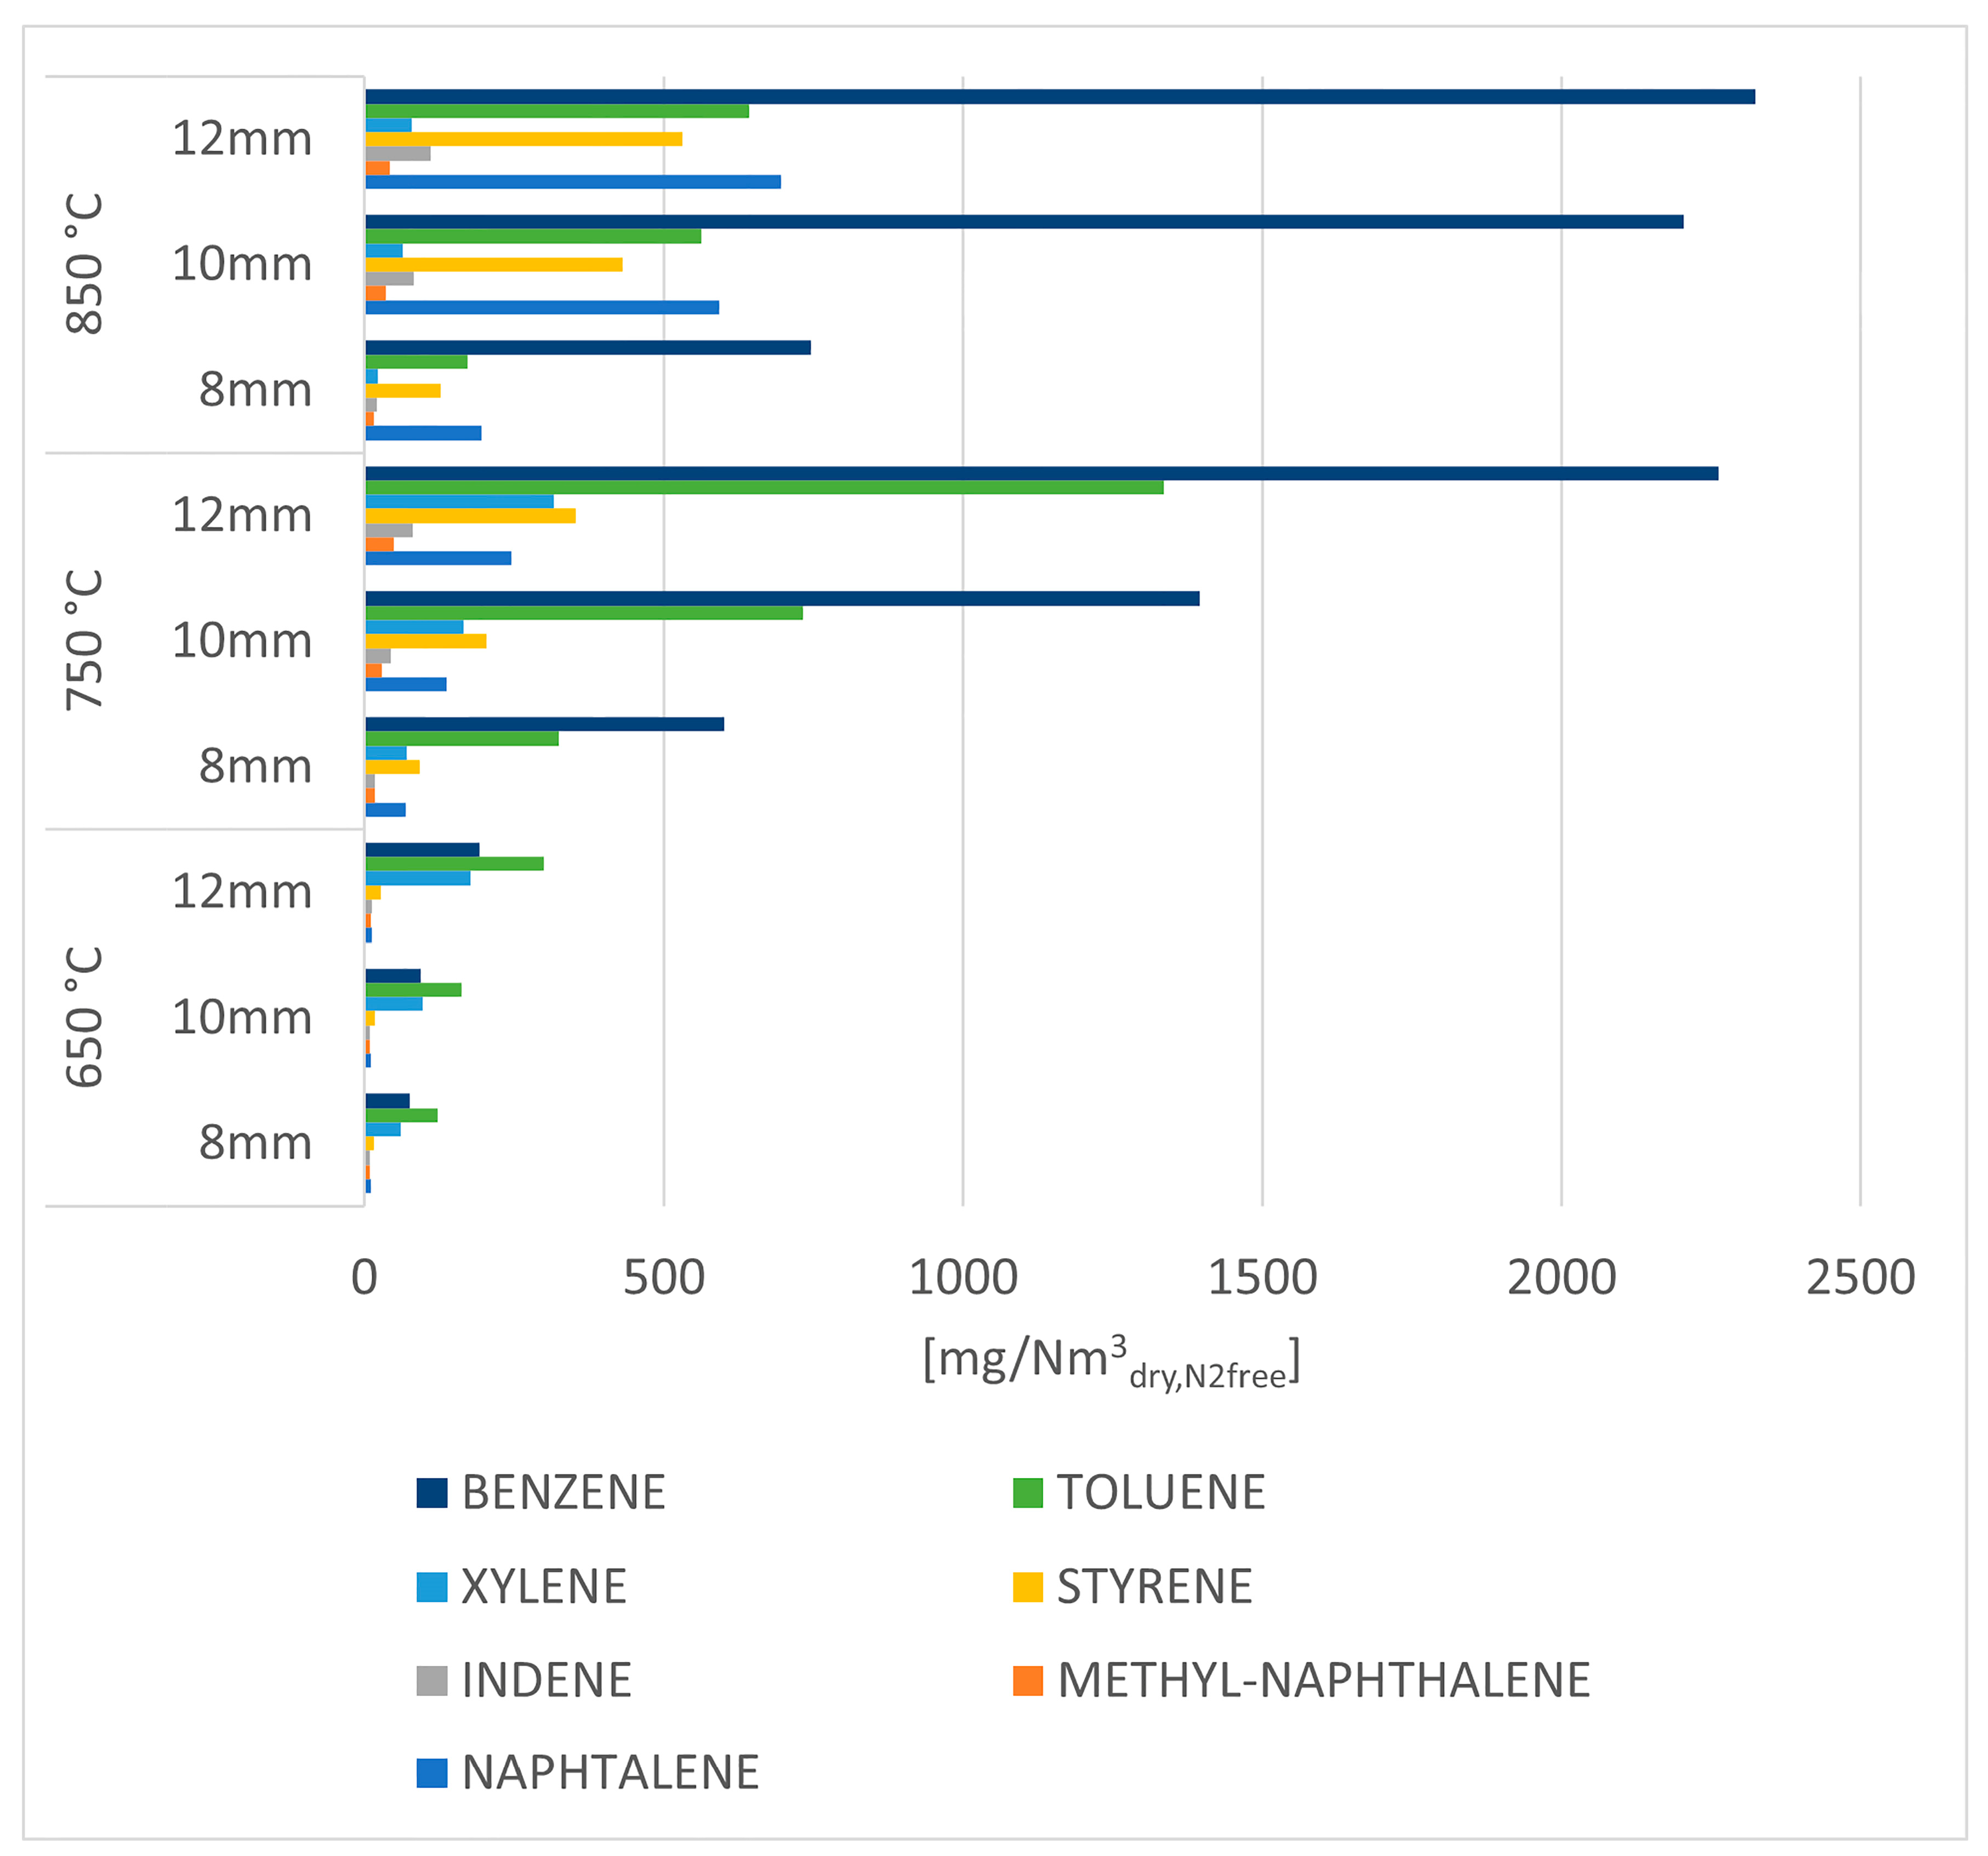
By having thoroughly analyzed the amount and composition of the gas produced by the process, the analysis of the results related to the aromatic hydrocarbons follows in Figure 10.

Figure 10.
Aromatic hydrocarbons concentration in the organic phase condensed in iso propanol bottles for tar trapping.
Figure 10 shows the concentration of individual aromatic hydrocarbons for each of the operating parameters; the increase in concentration of all species is noticeable as temperature increases, with considerably high values for benzene, toluene, naphthalene, and styrene in the experimental tests at 850 °C.
As explained above (see description of Figure 5), the increase in these compounds can be explained by Diels–Alder reaction and subsequent dehydrogenation reactions coupled with the decomposition of heavier aliphatic hydrocarbons.
These results offer a comprehensive overview of the products released during the devolatilization process of PP; this knowledge is fundamental to carry out subsequent investigations of the whole gasification process.
Data on the times required for complete devolatilization of the spheres were also obtained from the experimental tests and showed in Table 3.
Table 3.
Devolatilization times obtained from experimental tests.
Through the equations described in the section about mathematical modelling and the knowledge of values reported in Table 3, the kinetic parameters required for modelling the devolatilization of polypropylene were derived (Table 4).
Table 4.
Kinetic parameters derived using Matlab numerical model.
As reported by Aboulkas et al., different reaction models can be used for the description of the polypropylene devolatilization process. All models give different activation energy, but the correlation coefficients are always higher than 0.94 [44].
The results here obtained differ from that reported by Aboulkas et al. [44], highlighting the influence of the process conditions tested.
The apparent activation energy here derived is obtained using a fluidized bed reactor allowing a very fast heating up of the particles, as occurs in the practical application. The model derived can be then used for the simulation of the devolatilization process during the gasification in a fluidized bed reactor. Future activities are related to the implementation of this kinetic model to the CFD simulation of a gasifier.
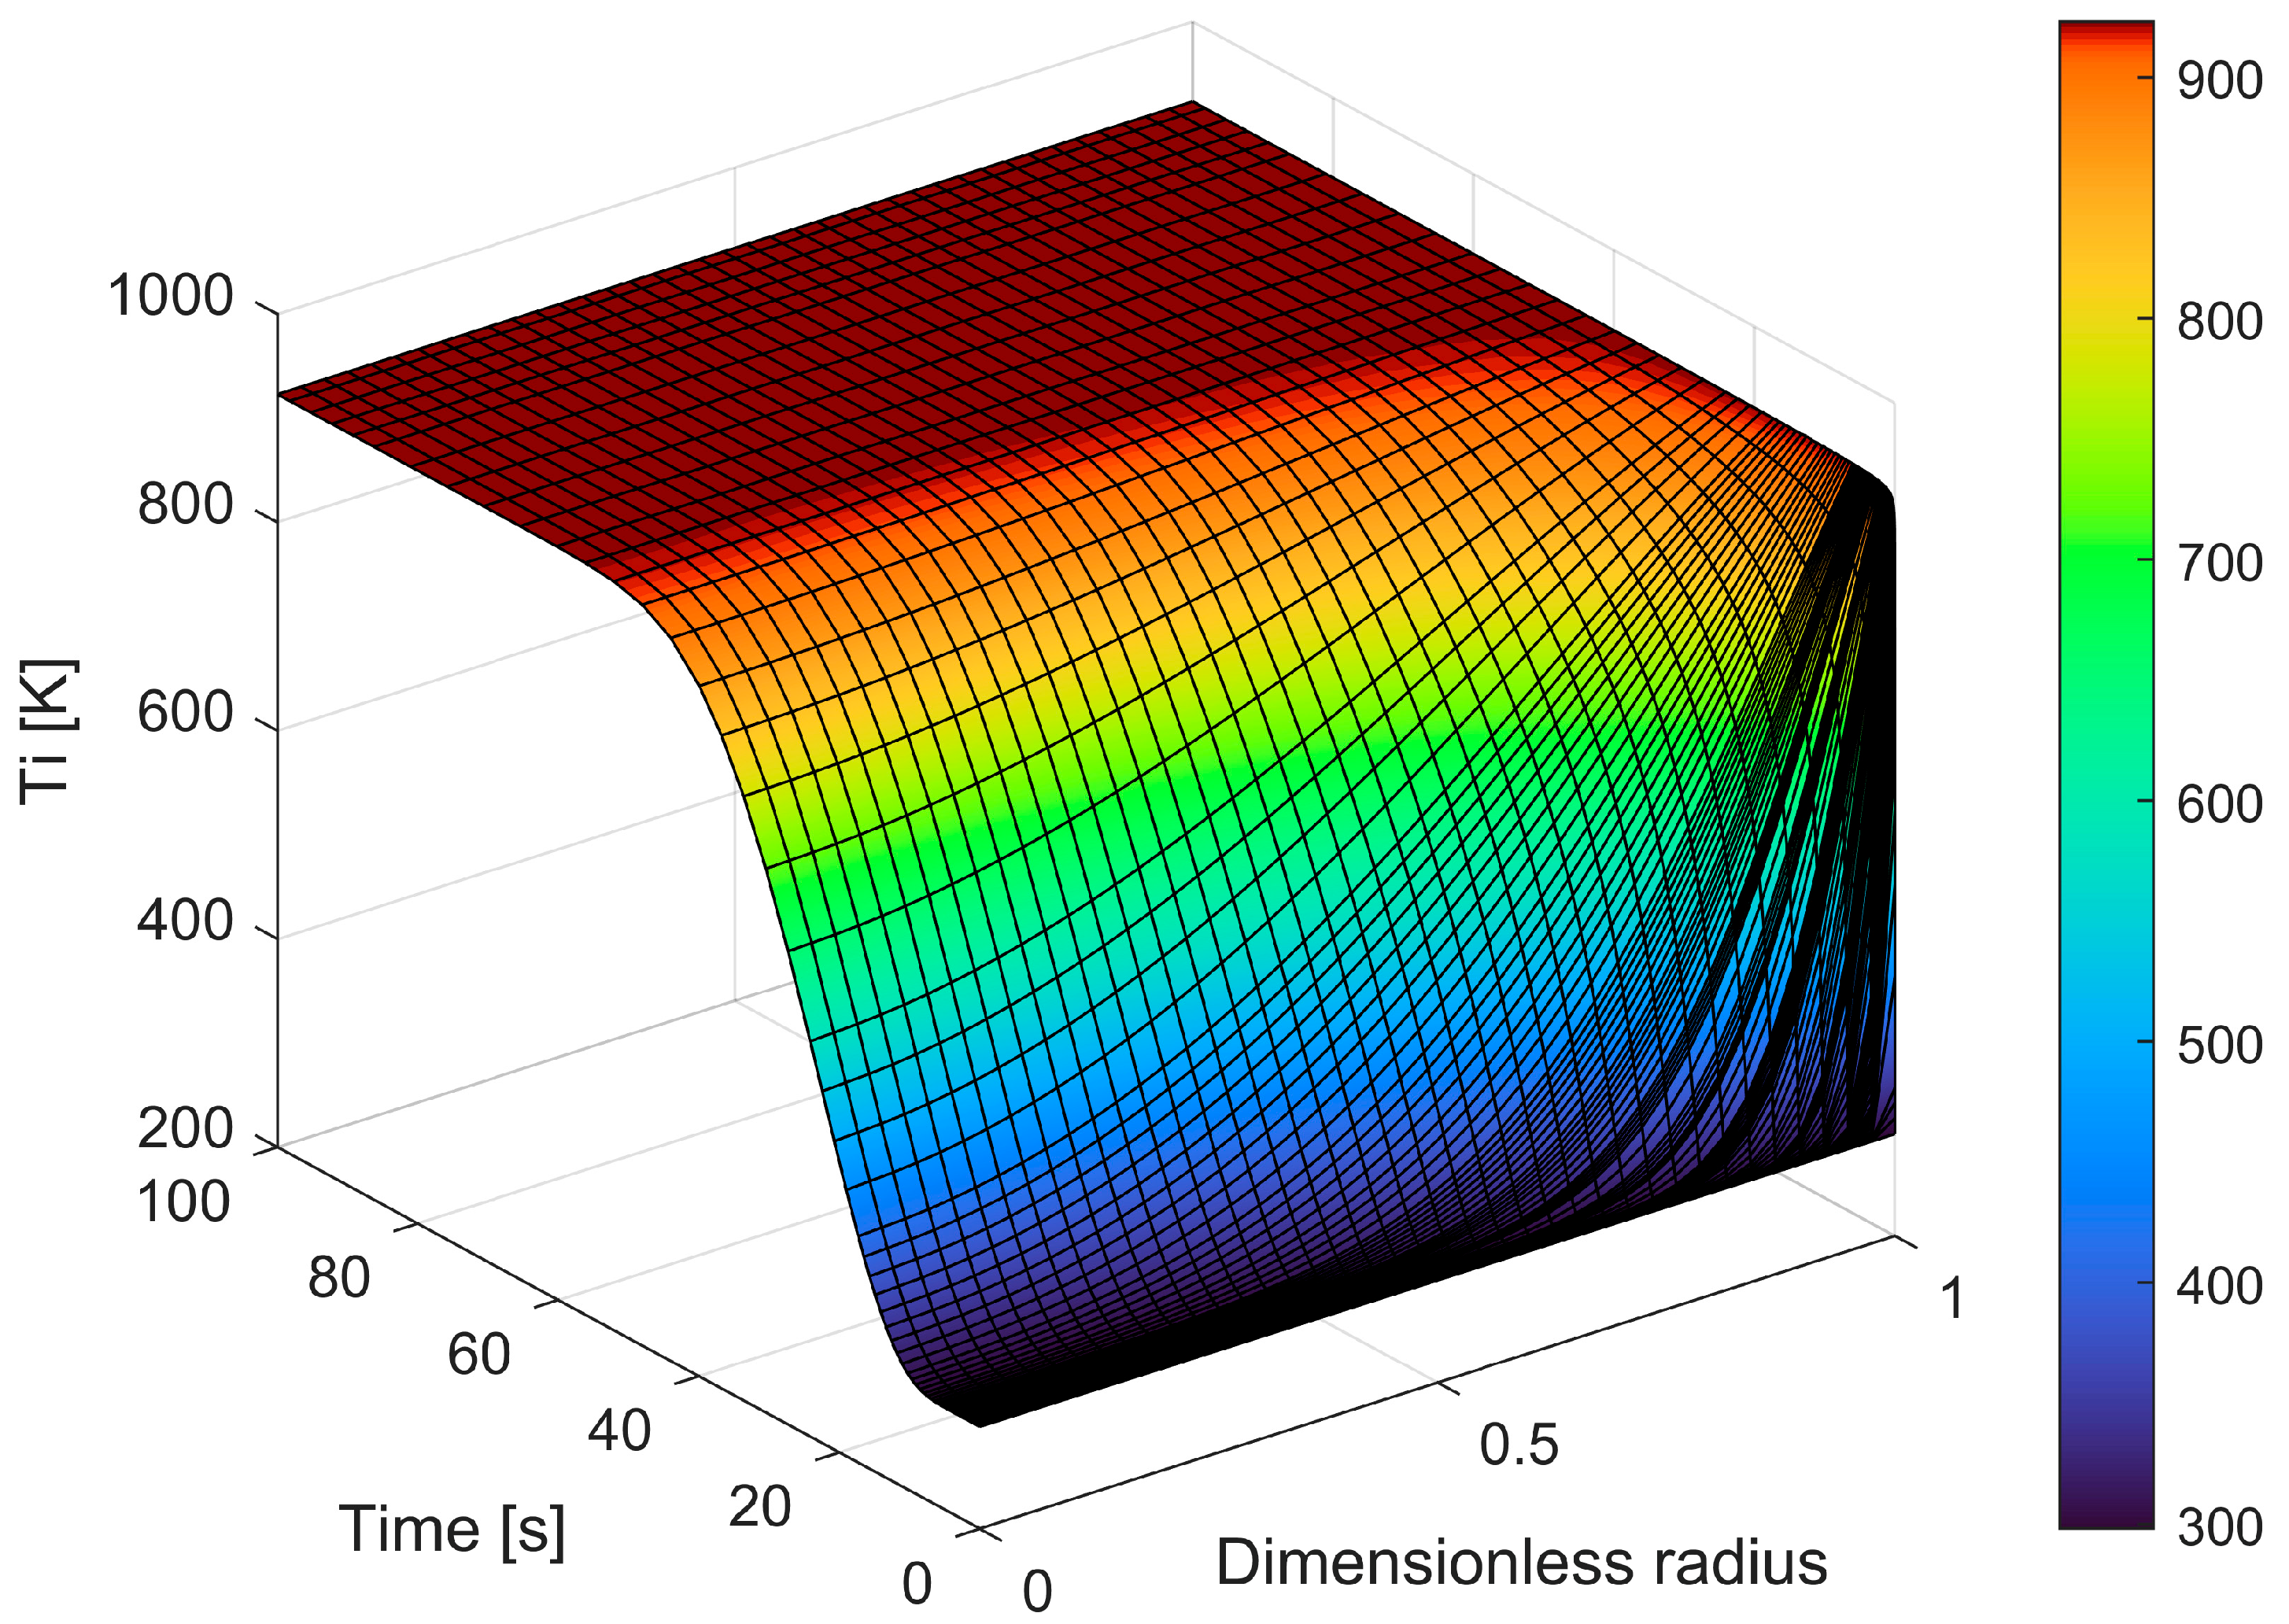
The equations that provide the particle conversion, the particle’s time consumption, and the released gas flow rate were then solved. Figure 11 shows the calculated temperature profile inside the particle during time for a 12 mm PP sphere (initial sphere diameter) at 650 °C vs. time.
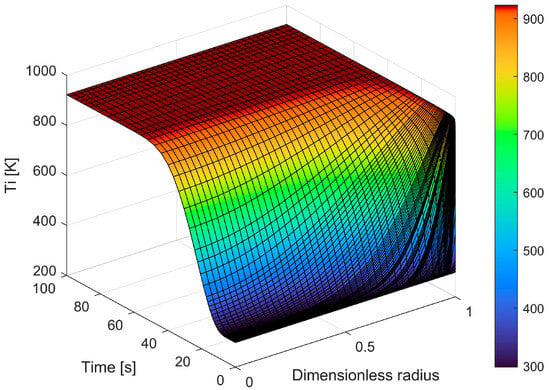
Figure 11.
Temperature profile within the particle as time changes.
The figure also shows the discretization used by the software for time and dimensionless particle size. A dimensionless radius is used and is calculated each time as a function of particle shrinkage; for these reasons, the figure does not show radius reduction.
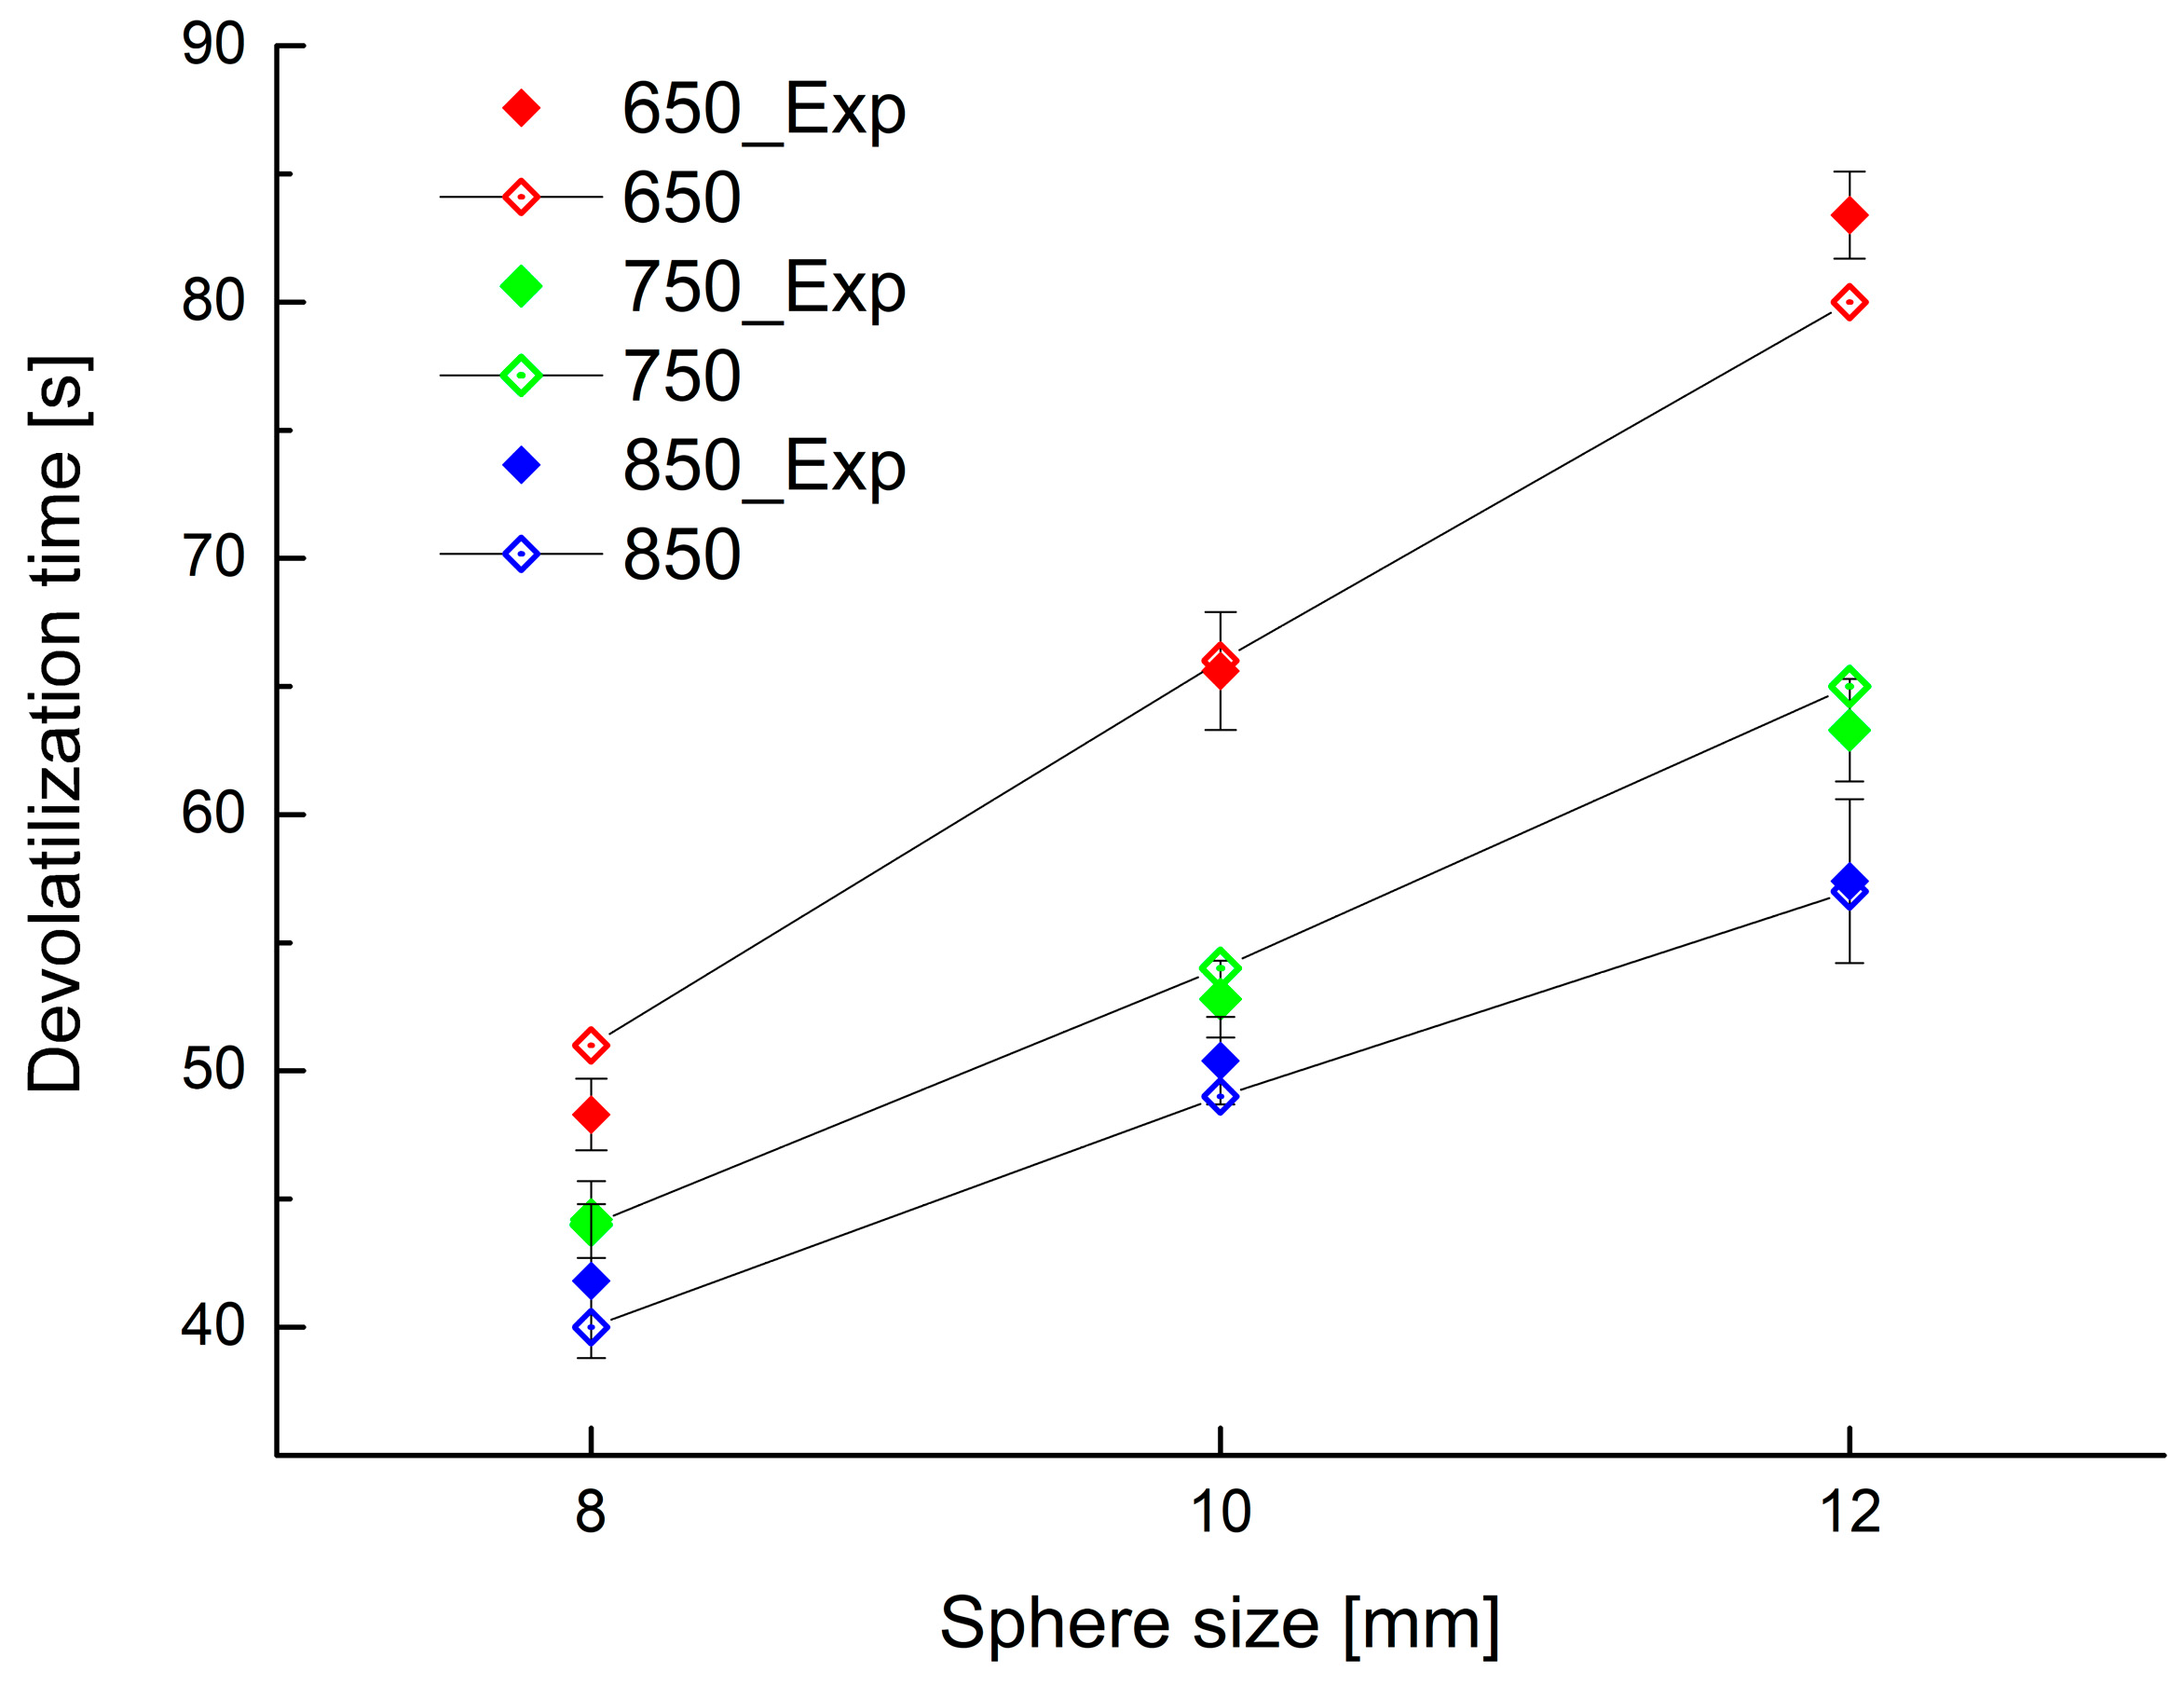
This simplified model is able to describe the process with reasonable accuracy. To show good fitting between the experimental data and predictions by the model, reported values of the devolatilization times obtained experimentally as well as from the model are shown in Figure 12. The agreement between corresponding values is remarkably good.
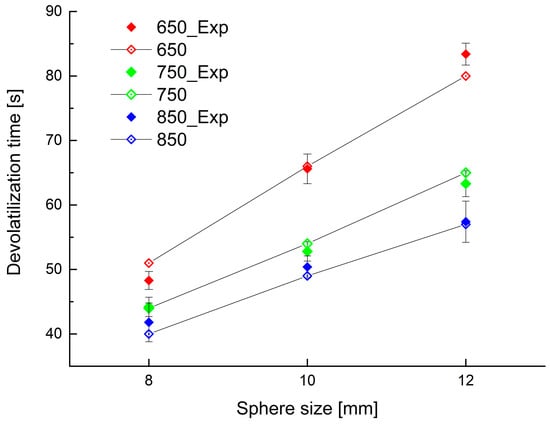
Figure 12.
Experimental and calculated devolatilization time for different bed temperature and initial PP sphere size (solid symbols experimental data, open symbols simulation results).
Figure 12 was plotted using a particle final conversion of 99.3% by mass, the ash portion being 0.7 percent by mass.
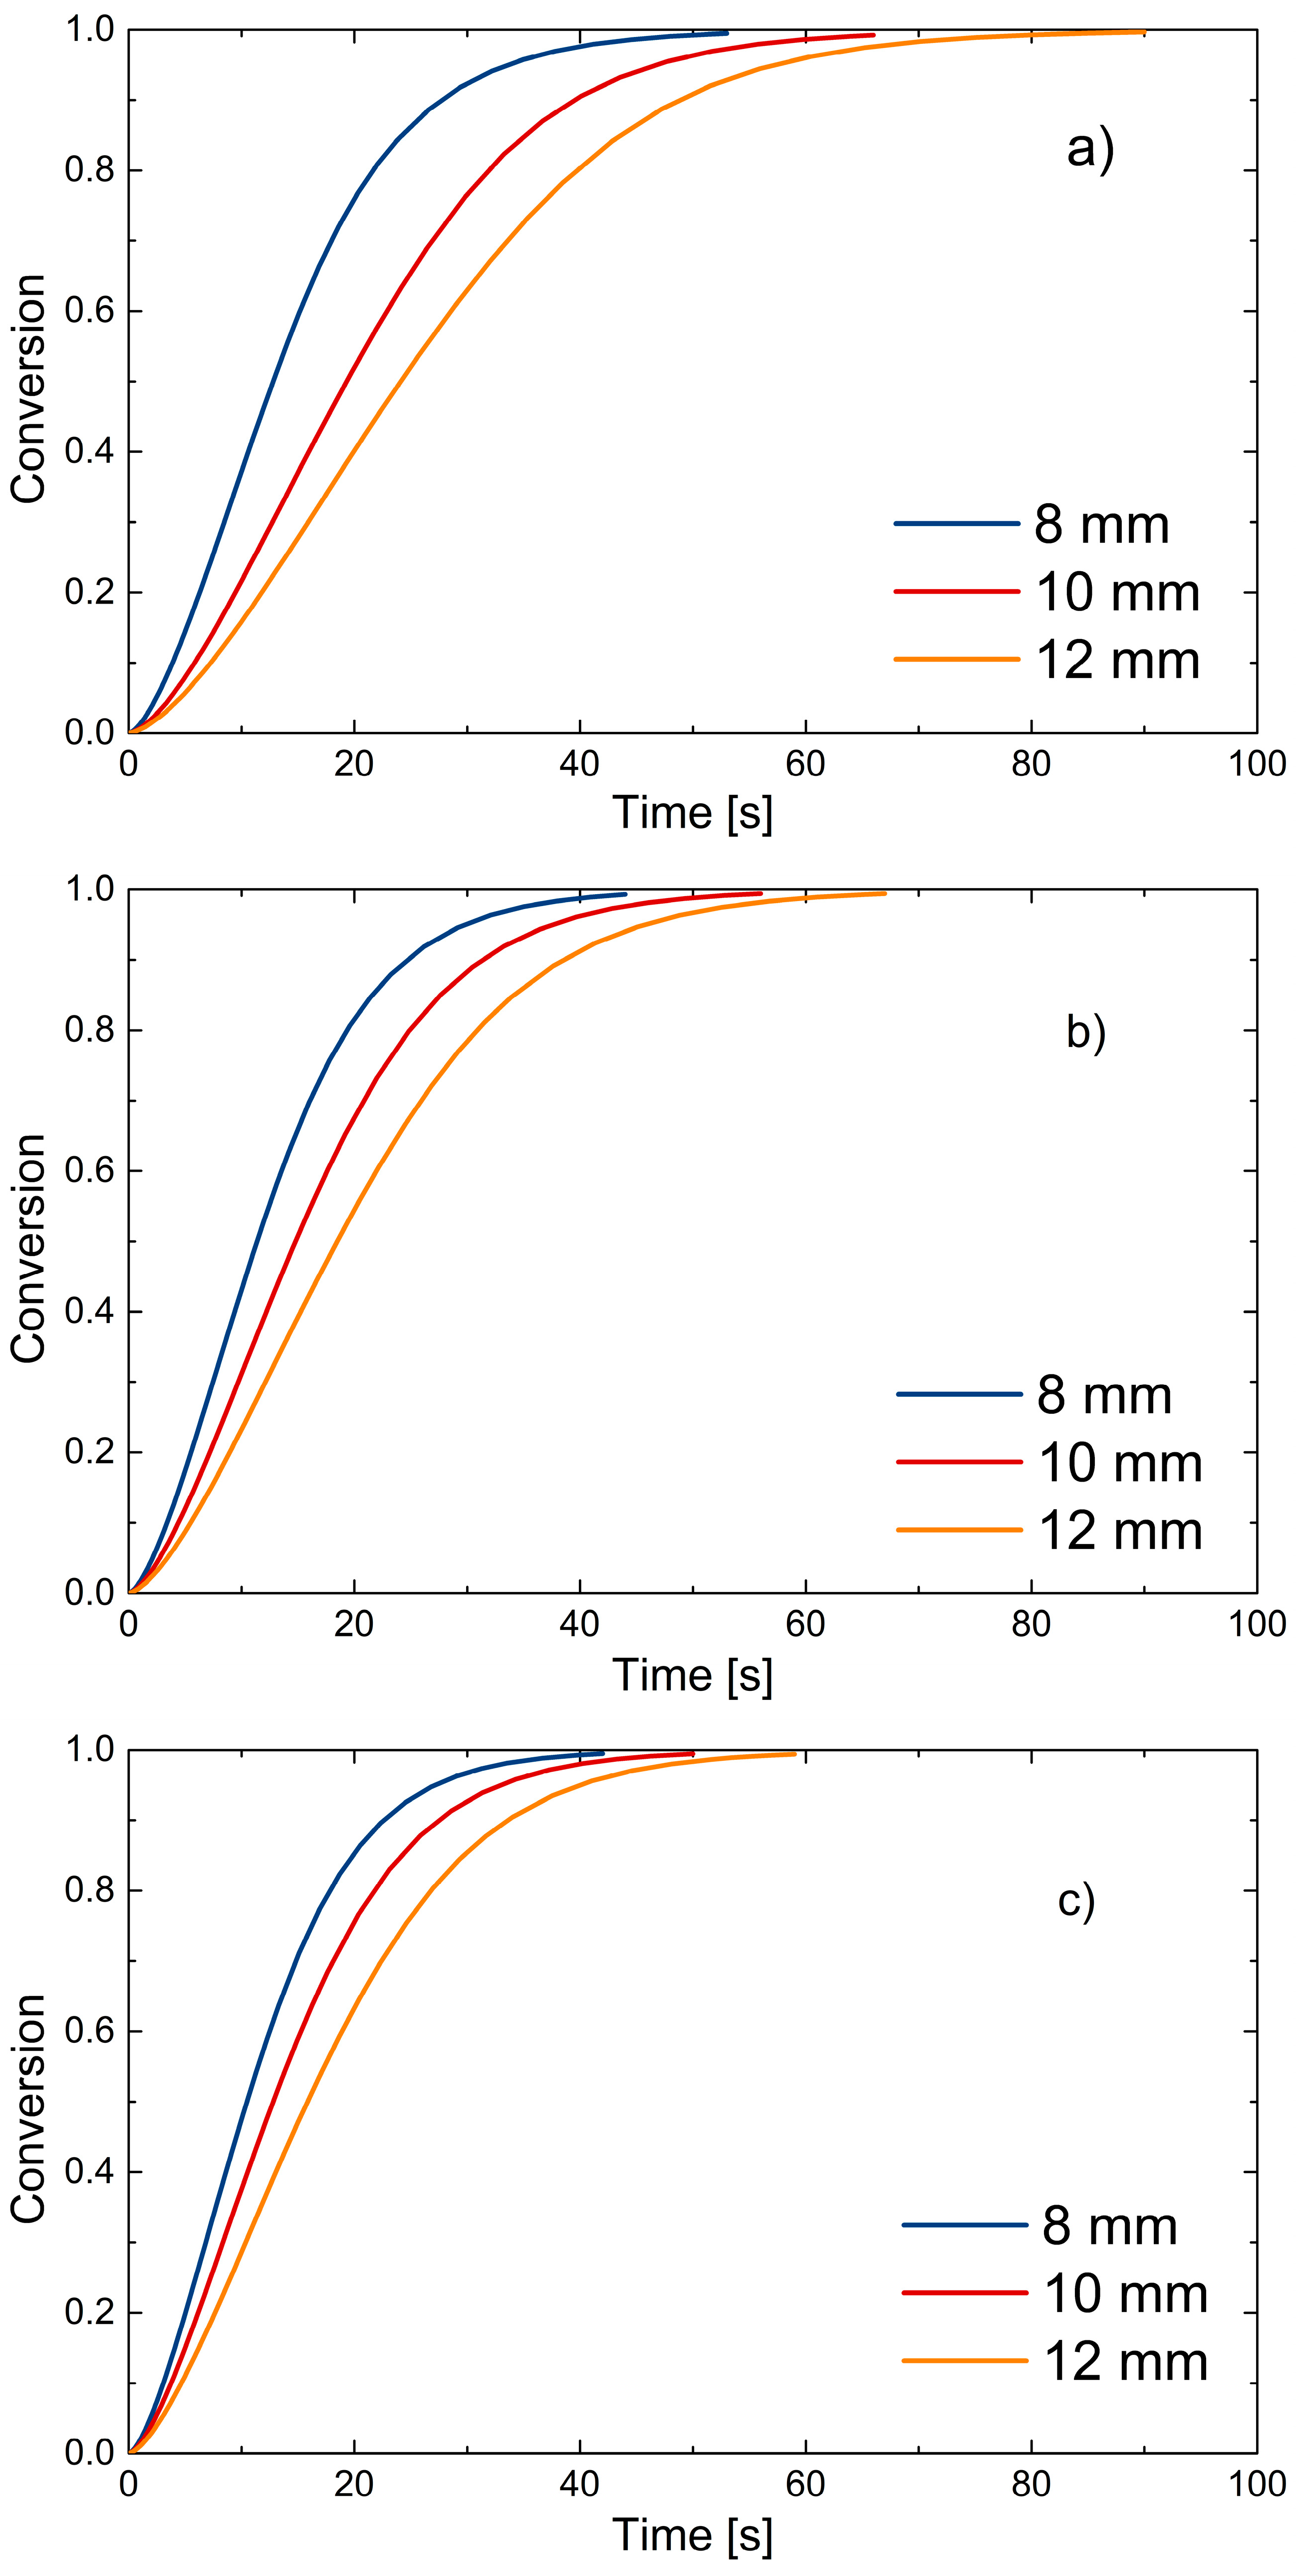
Finally, the conversion trends described by the model are reported. The same final conversion used to demonstrate good fitting of devolatilization times is used in Figure 13.
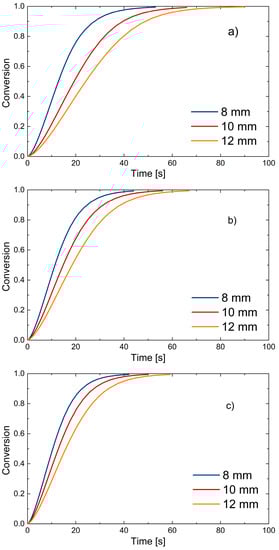
Figure 13.
PP sphere conversion as predicted by the model: (a) 650 °C; (b) 750 °C; (c) 850 °C.
Figure 13 shows how the mathematical model describes the devolatilization process in the experimentally derived time intervals; it is also noticeable that temperature and sphere size affect the decomposition process and thus the conversion. Decreasing diameter size and increasing temperature result in faster decomposition and shorter devolatilization time, as expected. Clearly, the range of validity of the model is limited to the temperatures and PP sizes considered here. A thermo-neutral process is also assumed, where devolatilization of the particle does not result in appreciable changes in bed temperature.
4. Conclusions
The main objective of this work was to analyze and study the PP devolatilization process within a fluidized bed reactor and thus contribute to the study of plastic materials in thermochemical conversion applications.
Analysis of the results obtained led to a number of important conclusions. Temperature was found to be the most influential parameter. As the temperature increased, an increase in the percentages of residual solid carbon and tar produced and a concomitant decrease in the gas released was noted; however, when analyzing the composition of this gas, a higher percentage of hydrogen, methane, and light hydrocarbons was noted at higher temperature, favored by greater molecular cracking; the increase in the percentage of tar produced, on the other hand, resulted from the presence of secondary reactions involving molecular recombination of the most unstable compounds.
The variation in feedstock particle size resulted in a minor influence on the products; as this parameter increased, an increase in the percentage of char and gas produced was noted, while the percentage of tar remained almost unchanged; analyzing the gas composition shows a decrease in the percentage of hydrogen produced as size increases probably caused by slower decomposition.
The investigation of gas released, tar produced, and respective compositions in the devolatilization step allows for subsequent developments in the design of gasification systems.
A pseudo-first-order kinetic expression was used to develop the kinetic model, characterized by the presence of three fitting parameters. The determination of these parameters was made from the knowledge of the devolatilization time values obtained experimentally, using a dual fitting mechanism and a verification mechanism. The fitting mechanism consisted of regression on the data obtained for the largest and smallest spheres, while the verification mechanism was applied by comparing the experimental data for the intermediate sphere with the corresponding ones predicted by the model.
The mathematical model allowed the identification of the kinetic parameters to describe the process of thermal decomposition of the particle, such as the shrinkage of the particle and the conversion of the solid fuel. The model was able to describe with relatively simple kinetics the complex process of devolatilization, highlighting the possibility of multiple implementations of such kinetics, particularly within Computational Fluid Dynamics CFD or Computational Particle Fluid Dynamics CPFD simulations dealing with the gasification process.
The coupling kinetic model and experimental data of volume and composition of the released products provide a comprehensive overview of the polypropylene devolatilization process that can be exploited for future studies and developments related to gasification of waste plastics.
Although this study focuses on polypropylene, allowing an overview of the behavior of the single pure compound, which represents an important portion of plastic waste, it turns out to be a fundamental basis for carrying out future studies where possible interactions of multiple plastic materials not considered here will be analyzed to reproduce the behavior of typical plastic waste.
Supplementary Materials
The following supporting information can be downloaded at: https://www.mdpi.com/article/10.3390/en16176324/s1.
Author Contributions
Conceptualization, A.V. and A.A.P.; Methodology, A.A.P.; Software, A.V.; Formal analysis, A.V.; Investigation, A.V., A.A.P., E.C. and A.H.; Data curation, A.V. and E.C.; Writing—original draft, A.V.; Writing—review & editing, A.A.P., S.I., E.C., A.H., V.C., N.R., P.U.F. and A.D.C.; Supervision, A.A.P., P.U.F. and A.D.C.; Project administration, A.D.C.; Funding acquisition, A.D.C. All authors have read and agreed to the published version of the manuscript.
Funding
This work was supported by Enereco Spa and PNRR program (DM 352/2022 M4C2) that co-financed a PhD fellowship to the University of L’Aquila (funding number: 91616).
Data Availability Statement
The data presented in this study are available on request from the corresponding author. The data are not publicly available because they are confidential between the company and the authors of this work.
Conflicts of Interest
Authors Nicola Rovelli and Valerio Corradetti are employees of ENERECO s.p.a, who have participated in the editing-review and editing of the manuscript. The results described are entirely those seen by the authors and do not necessarily reflect the interest of ENERECO s.p.a. The remaining authors have no conflict of interest to declare.
Nomenclature
| Property | Symbol | Value | Unit |
| Apparent activation energy | Eapp | - | J/mol |
| Ash diameter | 0.0002 | m | |
| Bed temperature | Tb | 650–750–850 | °C |
| Conversion | - | - | |
| Devolatilization time | td | - | s |
| Effective emissivity | - | ||
| Emissivity bed | 0.8 | - | |
| Final diameter post devolatilization | Dfin | 0.0002 | m |
| Gas constant | R | 8.314 | J/mol K |
| Gas density | 0.383–0.345–0.315 | kg/m3 | |
| Gas viscosity | (3.96–4.21–4.45) × 10−5 | Pa s | |
| Heat transfer coefficient convection | h | 335 | W/(m2 K) |
| Ignition temperature | Tinj | 360 | °C |
| Kinetic parameter for particle diameter variation | - | - | |
| Particle conductivity | keff | 0.15 | W/(m K) |
| Particle diameter | |||
| Particle diameter considered | D0i | 8–10–12 | mm |
| Particle Emissivity | 0.9 | - | |
| Particle mass | mp | 0.23–0.44–0.75 | g |
| Particle radius | |||
| Particle specific heat | Cp | 1600 | J/(kg K) |
| Particles density | ρp | 697 | kg/m3 |
| Percentage of volatile material in the particle | w | 0.993 | - |
| Pre-exponential reference factor | A1 | - | s−1 |
| Reference particle diameter | D01 | 8 | mm |
| Sand density | 2650 | kg/m3 | |
| Stefan-Boltzman constant | 5.67 × 10⁻⁸ | W/(m2 K4) | |
| Void fraction at minimum fluidization condition | 0.44 | - | |
| Volatile matter density | kg/m3 | ||
| Volumetric flow rate released by devolatilization | Q | - |
References
- Perea-Moreno, M.-A.; Samerón-Manzano, E.; Perea-Moreno, A.-J. Biomass as Renewable Energy: Worldwide Research Trends. Sustainability 2019, 11, 863. [Google Scholar] [CrossRef]
- Bongaarts, J. Development: Slow down population growth. Nature 2016, 530, 409–412. [Google Scholar] [CrossRef] [PubMed]
- Ellen Macarthur Foundation. How to Build a Circular Economy|Ellen MacArthur Foundation. 2022. Available online: https://ellenmacarthurfoundation.org/ (accessed on 23 June 2023).
- European Commission. A European Green Deal|European Commission. 2019. Available online: https://ec.europa.eu/info/strategy/priorities-2019-2024/european-green-deal_en (accessed on 8 September 2021).
- European Commission. Circular Economy Action Plan; European Commission: Brussels, Belgium, 2015.
- United Nations. Transforming Our World: The 2030 Agenda for Sustainable Development; United Nations: New York, NY, USA, 2015.
- Arena, U. Process and technological aspects of municipal solid waste gasification. A review. Waste Manag. 2012, 32, 625–639. [Google Scholar] [CrossRef]
- Lombardi, L.; Carnevale, E.; Corti, A. A review of technologies and performances of thermal treatment systems for energy recovery from waste. Waste Manag. 2015, 37, 26–44. [Google Scholar] [CrossRef] [PubMed]
- Materazzi, M.; Foscolo, P.U. Substitute Natural Gas from Waste: Technical Assessment and Industrial Applications of Biochemical and Thermochemical Processes; Academic Press: Cambridge, MA, USA, 2019. [Google Scholar] [CrossRef]
- Papa, A.A.; Savuto, E.; Di Carlo, A.; Tacconi, A.; Rapagnà, S. Synergic Effects of Bed Materials and Catalytic Filter Candle for the Conversion of Tar during Biomass Steam Gasification. Energies 2023, 16, 595. [Google Scholar] [CrossRef]
- Di Carlo, A.; Savuto, E.; Foscolo, P.U.; Papa, A.A.; Tacconi, A.; Del Zotto, L.; Aydin, B.; Bocci, E. Preliminary Results of Biomass Gasification Obtained at Pilot Scale with an Innovative 100 kWth Dual Bubbling Fluidized Bed Gasifier. Energies 2022, 15, 4369. [Google Scholar] [CrossRef]
- Marcantonio, V.; Monarca, D.; Villarini, M.; Di Carlo, A.; Del Zotto, L.; Bocci, E. Biomass Steam Gasification, High-Temperature Gas Cleaning, and SOFC Model: A Parametric Analysis. Energies 2020, 13, 5936. [Google Scholar] [CrossRef]
- Rapagnà, S.; Gallucci, K.; Foscolo, P.U. Olivine, dolomite and ceramic filters in one vessel to produce clean gas from biomass. Waste Manag. 2018, 71, 792–800. [Google Scholar] [CrossRef]
- Savuto, E.; May, J.; Di Carlo, A.; Gallucci, K.; Di Giuliano, A.; Rapagnà, S. Steam Gasification of Lignite in a Bench-Scale Fluidized-Bed Gasifier Using Olivine as Bed Material. Appl. Sci. 2020, 10, 2931. [Google Scholar] [CrossRef]
- Timofeeva, S.S.; Karaeva, J.V.; Kovalev, A.A.; Kovalev, D.A.; Litti, Y.V. Steam gasification of digestate after anaerobic digestion and dark fermentation of lignocellulosic biomass to produce syngas with high hydrogen content. Int. J. Hydrog. Energy 2023, 48, 7559–7568. [Google Scholar] [CrossRef]
- Malsegna, B.; Di Giuliano, A.; Gallucci, K. Experimental Study of Absorbent Hygiene Product Devolatilization in a Bubbling Fluidized Bed. Energies 2021, 14, 2399. [Google Scholar] [CrossRef]
- United Nations. Visual Feature|Beat Plastic Pollution. 2022. Available online: https://www.unep.org/interactives/beat-plastic-pollution/ (accessed on 17 April 2023).
- Ciuffi, B.; Chiaramonti, D.; Rizzo, A.M.; Frediani, M.; Rosi, L. A Critical Review of SCWG in the Context of Available Gasification Technologies for Plastic Waste. Appl. Sci. 2020, 10, 6307. [Google Scholar] [CrossRef]
- Basu, P. Combustion and Gasification in Fluidized Beds; CRC Press: Boca Raton, FL, USA, 2006; pp. 1–496. [Google Scholar]
- Bai, P.; Etim, U.J.; Yan, Z.; Mintova, S.; Zhang, Z.; Zhong, Z.; Gao, X. Fluid catalytic cracking technology: Current status and recent discoveries on catalyst contamination. Catal. Rev. 2018, 61, 333–405. [Google Scholar] [CrossRef]
- Cheng, J.; Yang, H.; Li, H.; Hu, C.; Yu, X.; Li, R. Reaction mechanism of Ni-coated Cu composite powder prepared by liquid-solid fluidized bed 3D electrodes. Chem. Eng. J. 2022, 428, 132529. [Google Scholar] [CrossRef]
- Wu, C.; Yang, H.; He, X.; Hu, C.; Yang, L.; Li, H. Principle, development, application design and prospect of fluidized bed heat exchange technology: Comprehensive review. Renew. Sustain. Energy Rev. 2022, 157, 112023. [Google Scholar] [CrossRef]
- Thiounn, T.; Smith, R.C. Advances and approaches for chemical recycling of plastic waste. J. Polym. Sci. 2020, 58, 1347–1364. [Google Scholar] [CrossRef]
- Zaccariello, L.; Mastellone, M.L. Fluidized-Bed Gasification of Plastic Waste, Wood, and Their Blends with Coal. Energies 2015, 8, 8052–8068. [Google Scholar] [CrossRef]
- Tokmurzin, D.; Nam, J.Y.; Park, S.J.; Yoon, S.J.; Mun, T.Y.; Yoon, S.M.; Moon, J.H.; Lee, J.G.; Lee, D.H.; Ra, H.W.; et al. Three-Dimensional CFD simulation of waste plastic (SRF) gasification in a bubbling fluidized bed with detailed kinetic chemical model. Energy Convers. Manag. 2022, 267, 115925. [Google Scholar] [CrossRef]
- Statista Research Department. Polypropylene Global Market Volume 2015–2029|Statista; Statista Research Department: New York, NY, USA, 2022. [Google Scholar]
- Evode, N.; Qamar, S.A.; Bilal, M.; Barceló, D.; Iqbal, H.M. Plastic waste and its management strategies for environmental sustainability. Case Stud. Chem. Environ. Eng. 2021, 4, 100142. [Google Scholar] [CrossRef]
- Fogler, H.S. Elements of Chemical Reaction Engineering, 6th ed.; Pearson Education International: London, UK, 2020. [Google Scholar]
- Xiao, R.; Jin, B.; Zhou, H.; Zhong, Z.; Zhang, M. Air gasification of polypropylene plastic waste in fluidized bed gasifier. Energy Convers. Manag. 2007, 48, 778–786. [Google Scholar] [CrossRef]
- Zhou, H.; Meng, A.; Long, Y.; Li, Q.; Zhang, Y. Classification and comparison of municipal solid waste based on thermochemical characteristics. J. Air Waste Manag. Assoc. 2014, 64, 597–616. [Google Scholar] [CrossRef] [PubMed]
- Kunii, D.; Levenspiel, O. Fluidization Engineering, 2nd ed.; Butterworth-Heinemann: Oxford, UK, 2013. [Google Scholar]
- Rapagnà, S.; Mazziotti di Celso, G. Devolatilization of wood particles in a hot fluidized bed: Product yields and conversion rates. Biomass- Bioenergy 2008, 32, 1123–1129. [Google Scholar] [CrossRef]
- Jand, N.; Foscolo, P.U. Decomposition of Wood Particles in Fluidized Beds. Ind. Eng. Chem. Res. 2005, 44, 5079–5089. [Google Scholar] [CrossRef]
- Iannello, S.; Foscolo, P.U.; Materazzi, M. Investigation of single particle devolatilization in fluidized bed reactors by X-ray imaging techniques. Chem. Eng. J. 2022, 431, 133807. [Google Scholar] [CrossRef]
- Nakhaei, M.; Wu, H.; Grévain, D.; Jensen, L.S.; Glarborg, P.; Clausen, S.; Dam–Johansen, K. Experiments and modeling of single plastic particle conversion in suspension. Fuel Process. Technol. 2018, 178, 213–225. [Google Scholar] [CrossRef]
- Kulkarni, M.S.; Dudukovic’, M.P. Dynamics of gas phase and solid phase reactions in fixed bed reactors. Chem. Eng. Sci. 1996, 51, 3083–3088. [Google Scholar] [CrossRef]
- Wurzenberger, J.C.; Wallner, S.; Raupenstrauch, H.; Khinast, J.G. Thermal conversion of biomass: Comprehensive reactor and particle modeling. AIChE J. 2002, 48, 2398–2411. [Google Scholar] [CrossRef]
- Mortezaeikia, V.; Tavakoli, O.; Khodaparasti, M.S. A review on kinetic study approach for pyrolysis of plastic wastes using thermogravimetric analysis. J. Anal. Appl. Pyrolysis 2021, 160, 105340. [Google Scholar] [CrossRef]
- Jung, S.-H.; Cho, M.-H.; Kang, B.-S.; Kim, J.-S. Pyrolysis of a fraction of waste polypropylene and polyethylene for the recovery of BTX aromatics using a fluidized bed reactor. Fuel Process. Technol. 2010, 91, 277–284. [Google Scholar] [CrossRef]
- Cypres, R. Aromatic hydrocarbons formation during coal pyrolysis. Fuel Process. Technol. 1987, 15, 1–15. [Google Scholar] [CrossRef]
- Mastral, F.; Esperanza, E.; García, P.; Juste, M. Pyrolysis of high-density polyethylene in a fluidised bed reactor. Influence of the temperature and residence time. J. Anal. Appl. Pyrolysis 2002, 63, 1–15. [Google Scholar] [CrossRef]
- Nanda, S.; Berruti, F. Thermochemical conversion of plastic waste to fuels: A review. Environ. Chem. Lett. 2021, 19, 123–148. [Google Scholar] [CrossRef]
- Sundaram, K.M.; Froment, G.F. Modeling of Thermal Cracking Kinetics. 3. Radical Mechanisms for the Pyrolysis of Simple Paraffins, Olefins, and Their Mixtures. Ind. Eng. Chem. Fundam. 1978, 17, 174–182. [Google Scholar] [CrossRef]
- Aboulkas, A.; El Harfi, K.; El Bouadili, A. Thermal degradation behaviors of polyethylene and polypropylene. Part I: Pyrolysis kinetics and mechanisms. Energy Convers. Manag. 2010, 51, 1363–1369. [Google Scholar] [CrossRef]

Disclaimer/Publisher’s Note: The statements, opinions and data contained in all publications are solely those of the individual author(s) and contributor(s) and not of MDPI and/or the editor(s). MDPI and/or the editor(s) disclaim responsibility for any injury to people or property resulting from any ideas, methods, instructions or products referred to in the content. |
© 2023 by the authors. Licensee MDPI, Basel, Switzerland. This article is an open access article distributed under the terms and conditions of the Creative Commons Attribution (CC BY) license (https://creativecommons.org/licenses/by/4.0/).