Abstract
Two representative organic-rich mudstones from the Middle Permian (MP) and the Upper Carboniferous (UC) around the Fukang Depression in the Junggar Basin were selected to study and compare the pyrolysis behavior and kinetics. The MP and UC were described as type I and type II kerogen, respectively. The FTIR and XRD results revealed that the MP contains carbonates and different clay minerals compared to the UC. Peak deconvolution was used for the UC to delineate the pyrolysis process to better understand and compare the similarities and differences in the pyrolysis kinetics of the two mudstones. In addition, the Coats-Redfern method was employed to further differentiate the reaction stages based on the differences in the reaction models during pyrolysis. The kinetic results revealed that the activation energy, pre-exponential factors, and reaction models of the two mudstones have some similarities and differences. Combined with the analysis of the pyrolysis volatiles, the UC sample can release more CH4, CO, CO2, and aromatic hydrocarbon compounds at high temperatures, indicating that the UC has more oxygen-containing functional groups and aromatics, while the MP has more aliphatics. Through the above studies, the pyrolysis kinetics and mechanism of two organic-rich rocks could be clarified, guiding their development and efficient utilization.
1. Introduction
Petroleum resources are important resources for socio-economic development and human survival. Hydrocarbon source rocks from different geological sources and depositional environments have different organic matter structures [1,2,3] and mineral compositions, influencing the pyrolysis mechanism and process [4,5,6]. Therefore, the non-reproducibility and strategic significance of petroleum resources and the complexity of the kerogen structure determine the necessity of efficient and rational development and utilization to alleviate the current energy crisis [7].
The Fukang Depression is located between the central depression and the eastern uplift zone of the Junggar Basin. Hydrocarbon source rocks with good organic matter abundance and hydrocarbon potential have been developed in both the Upper Carboniferous and Middle Permian in this region [8]. The tectonic strata of the Upper Carboniferous-Permian system mainly show a transition from marine to terrestrial phases due to tectonic movements [9]. In addition, there are frequent volcanic activities within the Carboniferous system, and complex volcanic rock constructions were developed [10]. The Permian is a lacustrine depositional environment [11]. Therefore, the hydrocarbon source rocks within the Carboniferous and Permian systems surrounding the Fukang Depression possess intricate depositional environments and vary in parental material origins. In addition, researchers have found that the oil preservation and storage capacity of organic-rich mudstones may be severely underestimated. The organic-rich rocks have the potential to be employed for the commercial production of oil and gas [12]. Therefore, an in-depth understanding and comparison of the pyrolysis kinetics and mechanism of different organic-rich mudstones is of great importance to identify the different deposition environments of different periods and to comprehensively elucidate the pyrolysis process.
Thermogravimetric analysis (TGA) is an efficient technique to study pyrolysis kinetics and behavior with thermogravimetric curves [13] and is extensively used in pyrolysis research of organic-rich rocks, such as oil shale [14,15,16] and coal [17,18,19]. However, the pyrolysis kinetic research of other organic-rich rocks is seldom reported, and more theoretical research via thermogravimetric analysis is necessary for development and application. According to the obtained TGA data with the mass loss variation, the activation energy E and other kinetic parameters can be obtained through different kinetic methods [20,21,22,23]. In addition, the Fourier Transform Infrared (FTIR) spectrometer is popularly coupled with TGA for the online identification of volatile products during pyrolysis [24]. Kerogen’s pyrolysis behavior is intricate, as several reactions occur simultaneously due to the organic and mineral complexity. Therefore, researchers employed peak deconvolution to distinguish overlapping peaks and analyze the kinetics separately [25]. The fitting models comprised Asym2sig, Weibull, Fraser-Suzuki [26], Gaussian [27], and Bi-Gaussian [28] models. Deconvolution analysis enables the differentiation of pyrolysis reactions, but there is a lack of relevant studies on the changes in the kinetic model during the reaction process. Previous research using a non-linear least squares approach based on the rate equation has successfully identified the reaction stages through modifications of the mechanistic model [2], but this method is computationally expensive. Therefore, this paper provides a more detailed delineation of the reaction process by using peak deconvolution and the Coats-Redfern method. The Coats-Redfern method, a kinetic method, aids in identifying the reaction model and distinguishing the reaction process based on variations in the reaction model.
In this paper, two organic-rich mudstones with high hydrocarbon generation potential from the Upper Carboniferous (Bashan Formation) semi-deep lacustrine sediments and the Middle Permian (Pingdiquan Formation) lacustrine sediments around the Fukang Depression were selected as the research samples. By studying the pyrolysis kinetics and process through thermogravimetric analysis, the pyrolysis process and kinetics of two mudstones were investigated, thus guiding the exploration and development of organic-rich rocks and their efficient utilization.
2. Materials and Methods
2.1. Materials and Characterization
The Permian samples are from the Middle Permian Pingdiquan Formation in Sha 123 well (MP), and the Carboniferous samples are from the Upper Carboniferous Bashan Formation in Shaqiu 12 well (UC). Both samples were ground into powers (less than 0.2 mm) with a mechanical grinder. All characterizations were tested with powder samples. A US Leco CS-344 carbon and sulfur analyzer was used to measure the total organic carbon (TOC) and organic sulfur contents of the rocks on samples pre-treated with dilute hydrochloric acid in accordance with GB/T 19145-2003. Rock-Eval pyrolysis was performed using a Rock-Eval 6 instrument according to GB/T 18602-2012. The mineralogical characteristics were characterized by X-ray diffraction (XRD) on a powder X-ray diffractometer (Japan, Rigaku D/Max-2600). The functional groups were characterized using a Bruker ALPHA FTIR spectrometer (America).
2.2. Thermogravimetric Measurements
Thermogravimetric experiments were carried out with Diamond TG/DTA analyzer at 5, 10, 20, and 40 K/min in nitrogen atmosphere from 300 K up to 1200 K. About 25 mg of powder sample was evenly distributed on the alumina crucible to reduce heat transfer.
2.3. TG-FTIR Analysis
Analysis of about 10 mg sample was performed on a TGA 4000 thermogravimetric analyzer (PerkinElmer) coupled with a Spectrum Two FTIR spectrometer (PerkinElmer). Samples were heated from ambient temperature to 1100 K at a heating rate of 20 K min−1. Purge gas was nitrogen with a flow rate of 50 mL min−1. The volatile products with increasing temperature were monitored in situ via FTIR. To ensure the reproducibility and accuracy of experimental results, each test was conducted at least twice.
2.4. Kinetic Methods
The reaction rate equation can be characterized as:
where α is the conversion rate during the pyrolysis process; k is the rate constant; A refers to the pre-exponential factor, min−1; E is the activation energy, kJ mol−1; R = 8.314 J mol−1 K−1; T is the reaction temperature, K; f(α) in Table 1 is the solid-state conversion function based on the reaction mechanism [29].

Table 1.
The common reaction mechanism functions of solid-state pyrolysis.
g(α) is the integral form of f (α), which can be characterized as Equation (2).
For a constant heating rate, the heating rate β can be defined as Equation (4), and in Equation (1) can be replaced with .
2.4.1. Starink Method
The Starink method, which is an isoconversional method without model fitting, is widely used in pyrolysis kinetics studies to calculate kinetic parameters. The Starink method is a highly accurate method compared to the Ozawa and Kissinger methods according to the comparative study by Starink et al. [30] and is expressed as:
The value of E is determined from the slope of a plot of ln(β/T1.8) versus 1/T by applying linear regression analysis at different heating rates.
2.4.2. Coat-Redfern Method
Coat-Redfern method was employed to determine the reaction models, specifically the reaction-order model, nucleation model, phase-boundary reaction, and diffusion model [31] (Table 1). According to Equations (1) and (2), the equation used in the Coats-Redfern method to calculate the kinetic parameters is as follows:
Under the same value of α at different heating rates, the activation energies are determined from the slope of the regression lines of Y versus X. Among the activation energies calculated using the Coats-Redfern method applying different reaction mechanism functions, the activation energies similar to those calculated using the Starink methods and giving the best fitting results were selected as the reaction model to describe the pyrolysis mechanism [28].
2.4.3. Peak Deconvolution Analysis by Asym2sig Function
Peak deconvolution was necessary to investigate the pyrolysis process in more detail for the UC sample due to the more complex organic structure and pyrolysis processes compared to MP sample according to the reaction rate plots. In addition, the peak deconvolution process also allows for a better comparison with the pyrolysis process and kinetics of MP and UC. According to previous research and data analysis based on correlation coefficient R2 and residual sum of squares (RSS), the Asym2sig function was chosen for its excellent fit in separating overlapping peaks within asymmetrical curves. The function is shown below.
where y0, A, x, xc, w1, w2, w3 represent the baseline offset, the maximum amplitude, independent variable, peak center, full width of half maximum, variance of low-energy side, and variance of high-energy side, respectively. In addition, RRS is defined as:
where yiexp and yith are the experimental and predicted results.
3. Results and Discussion
3.1. Chemical Characterization and Structures of the Two Mudstones
The results tested by the Rock-Eval and carbon and sulfur analyzer are summarized in Table 2 and indicate that the TOC contents were 10.24 wt.% for the MP and 23.72 wt.% for the UC, respectively, which were higher than the general hydrocarbon source rocks. The UC was in the immaturity stage, and the MP was in the maturity stage with good hydrocarbon potential from the values of S2 and Tmax. The HI value of the MP (866.47 mg HC g−1 TOC−1) was almost twice that of the UC (447.24 mg HC g−1 TOC−1). Combining the values of the HI, OI, S2, and TOC, it was determined that the organic matter types of the MP and UC were type I and type II, respectively [32]. The MP contains more aliphatic groups and has a higher oil generation potential than UC.
Table 2.
Rock-Eval and carbon and sulfur analysis results of two mudstones.
Figure 1a presents the XRD spectra of the two mudstones, and the mineral compositions and relative contents are summarized in Table 3. Compared to the UC, the MP contains some amount of carbonate (calcite: 14.18 wt.%). The higher quartz content (46.51 wt.%) in the UC may be related to the frequent volcanic activity in the Upper Carboniferous period. Moreover, the UC has a higher clay content (total clay minerals = 50.00 wt.%). Furthermore, the XRD pattern exhibited some variations in the types of clay minerals found, with the UC containing some kaolinite, while the MP did not. Different types of clay minerals may have different catalytic effects on pyrolysis [4], and various types of clay minerals display diverse temperature ranges for the loss of crystallized water.
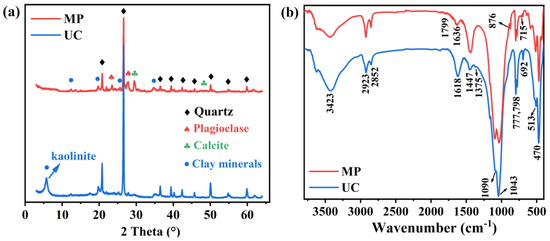
Figure 1.
(a) XRD patterns and (b) FTIR spectra of MP and UC.
Table 3.
Mineralogical compositions and relative contents results of two mudstones.
Figure 1b presents the FTIR spectra of the two mudstones. Among them, 470, 513, 777, 798, 1040, and 1082 cm−1 are derived from the vibration of the Si-O bonds in quartz, feldspar, and clay minerals [33]. The peaks at these locations vary in intensity between the two samples, which is attributed to the discrepancies in the quartz and feldspar content as well as the types and quantities of the clay minerals. The peaks at 715 cm−1 and 1799 cm−1 and the peaks at 876 cm−1 and 1447 cm−1 are derived from calcites [34]. The peak at 1447 cm−1 in the MP samples also has the contribution of the deformation vibration peaks of methylene (-CH2-) [35]. In addition, the stretching bands for the aliphatic hydrocarbon of CH2 and CH3 are detected at 2923 cm−1 and 2852 cm−1, respectively [36]. The flexural vibration of methyl (-CH3-) is solely observed at 1375 cm−1 in the UC sample, possibly due to its higher content of short or branched chain hydrocarbons. The peak at 692 cm−1 may be assigned to the out-of-plane bending vibration of alkene CH [37]. In addition, the peaks at 1636 cm−1 and 1618 cm−1 are derived from C=C stretching vibrations in the benzene rings [36], suggesting that the UC has more aromatic compounds based on peak strength. Moreover, the peaks at 3423 cm−1 are attributed to the vibrations of the hydroxyl groups in the clay minerals.
3.2. Analysis of Pyrolysis Process
3.2.1. Thermogravimetric Analysis
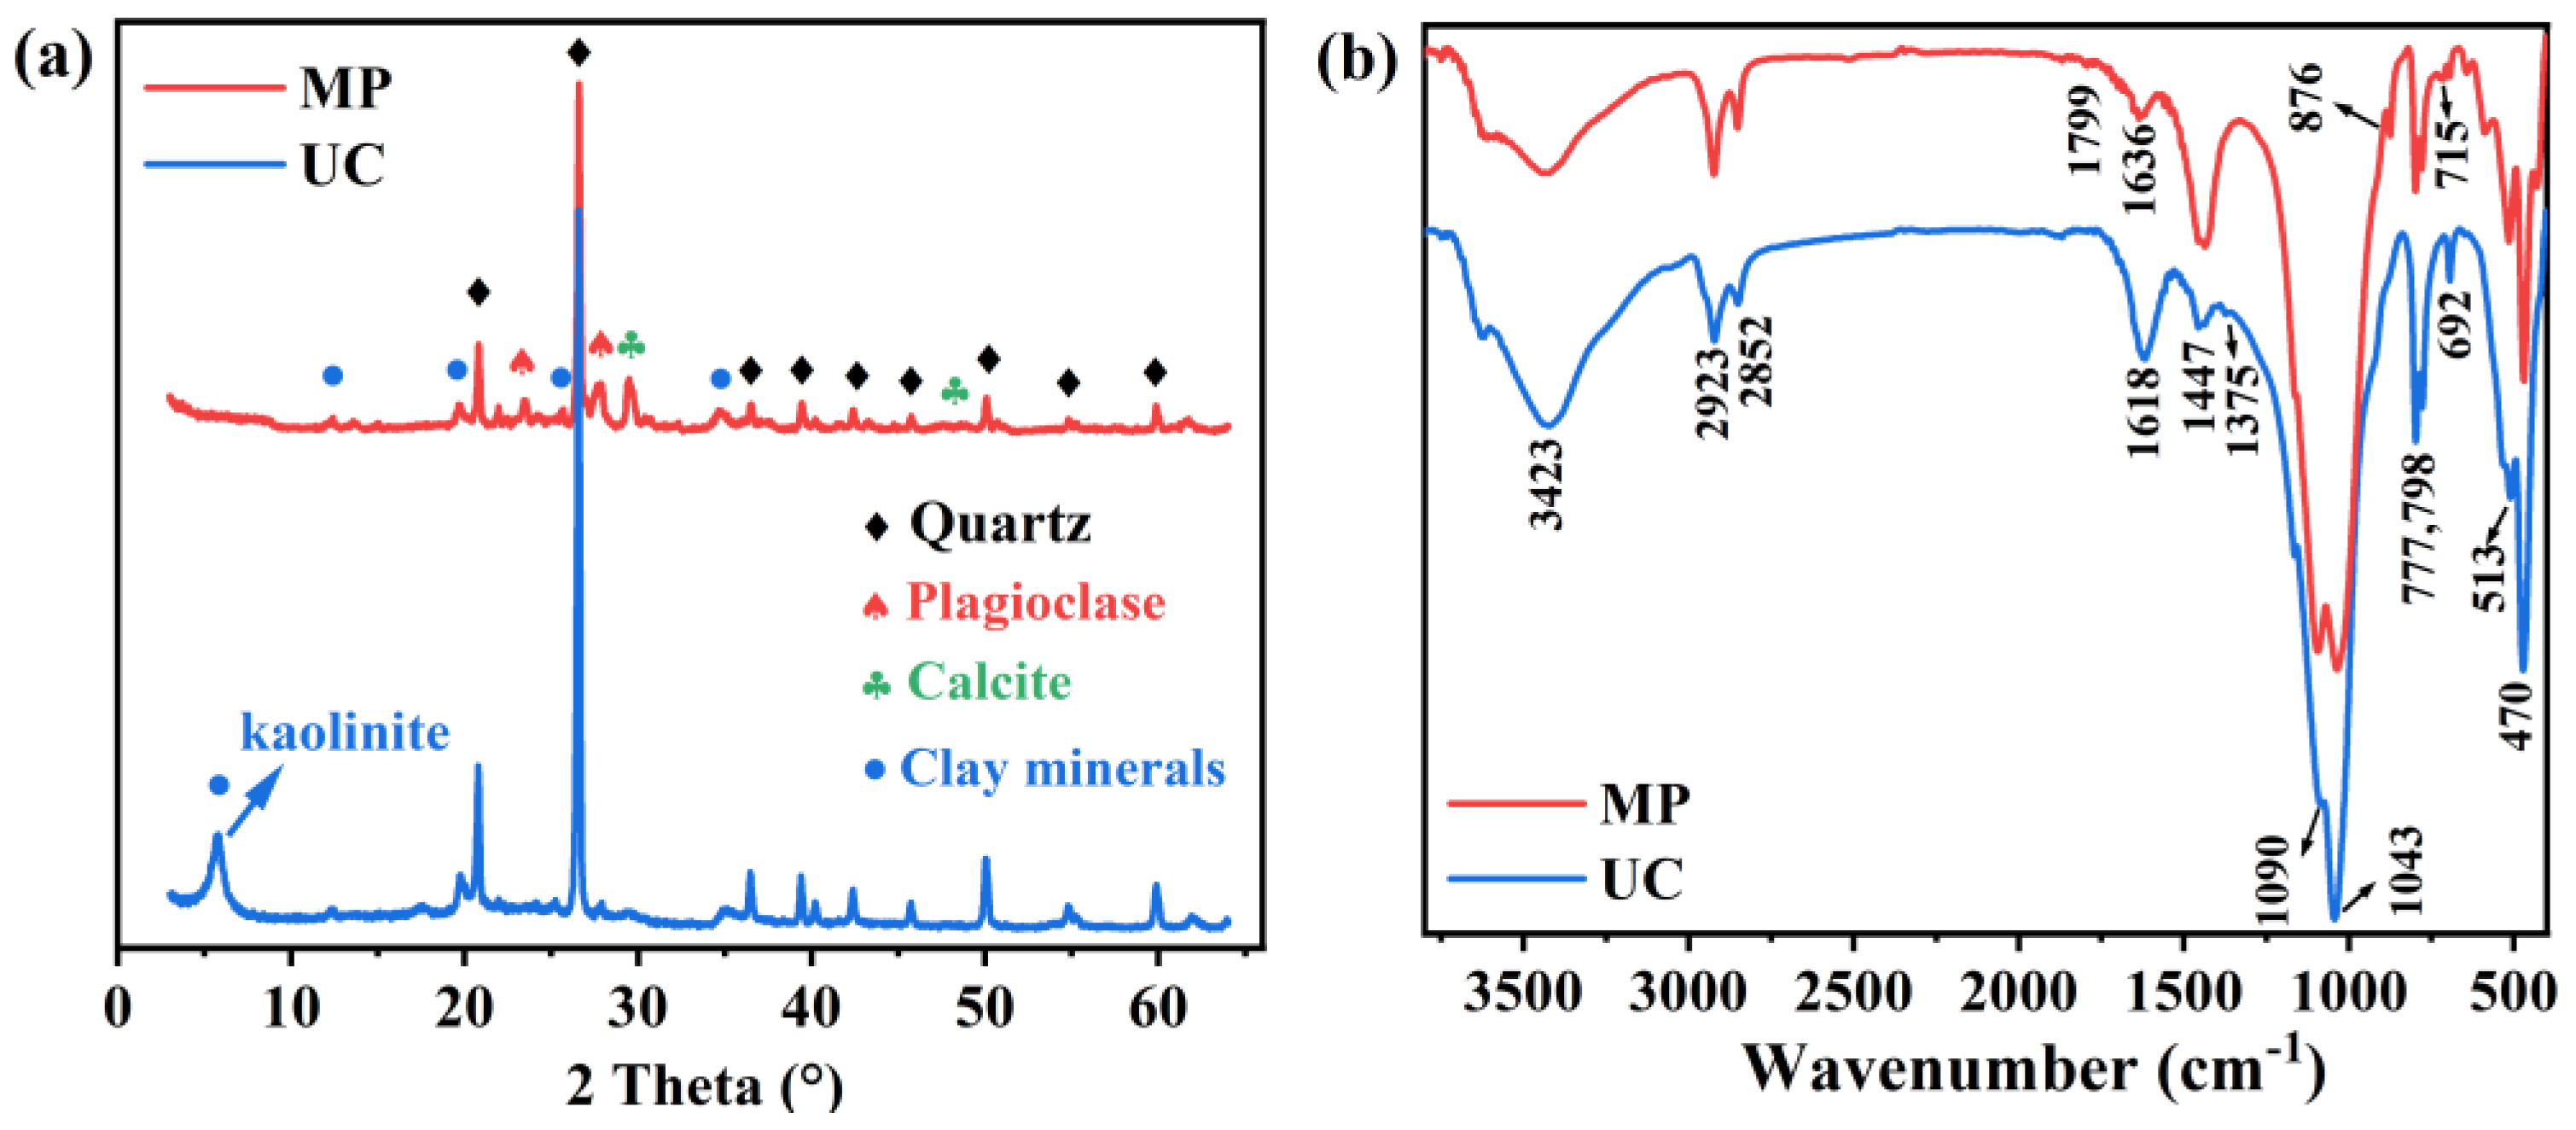
Figure S1 in Supplementary Materials displays the mass loss (thermogravimetry, TG) and differential thermal analysis (differential thermogravimetry, DTG) curves of the pyrolysis of the MP and UC samples at heating rates of 5, 10, 20, and 40 K min−1. The weight loss at temperatures below 450 K is primarily attributed to the evaporation of the adsorbed water and interlayer water in the clay minerals [27]. The varying peak patterns also illustrate the differences in the clay mineral types between the two mudstones, resulting in different water loss peaks. The majority of weight loss observed above 900 K for the MP is attributed to the decomposition of carbonates. The pyrolytic hydrocarbon generation process of organic matter occurs mainly at temperatures of approximately 600–900 K for the MP and 600–950 K for the UC. Table 4 summarizes the characteristic parameters at different stages of the pyrolysis reaction for the two mudstones. This study mainly focuses on the investigation and discussion of the pyrolysis kinetics in the decomposition stage of organic matter. Figure 2 presents the graphs of conversion rates α and reaction rates dα/dt based on the TG and DTG profiles during the pyrolysis stage of the organic matter. There are some differences in the pyrolytic behavior of the two samples attributed to discrepancies in the organic matter structure. The MP contains more aliphatic groups, whereas the UC contains more aromatic hydrocarbons and oxygenated organics. Compared to the UC, the MP has a higher pyrolysis reaction rate, indicating its superior pyrolysis hydrocarbon ability. The UC can produce organic matter at higher temperatures than the MP. Additionally, the maximum pyrolysis rate temperature for the UC is slightly lower than that of the MP during the organic matter pyrolysis stage due to the lower thermal maturity of the UC [38].
Table 4.
The characteristic parameters of the two mudstones in TG and DTG curves.
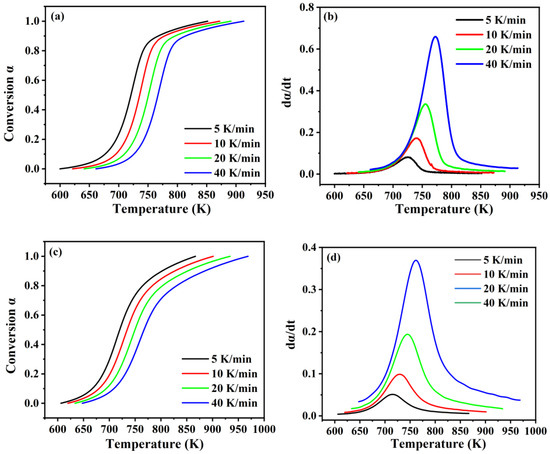
Figure 2.
The conversion rates α and reaction rates dα/dt curves of (a,b) MP; (c,d) UC.
3.2.2. Separation of Overlapping Peaks with Asym2sig Function
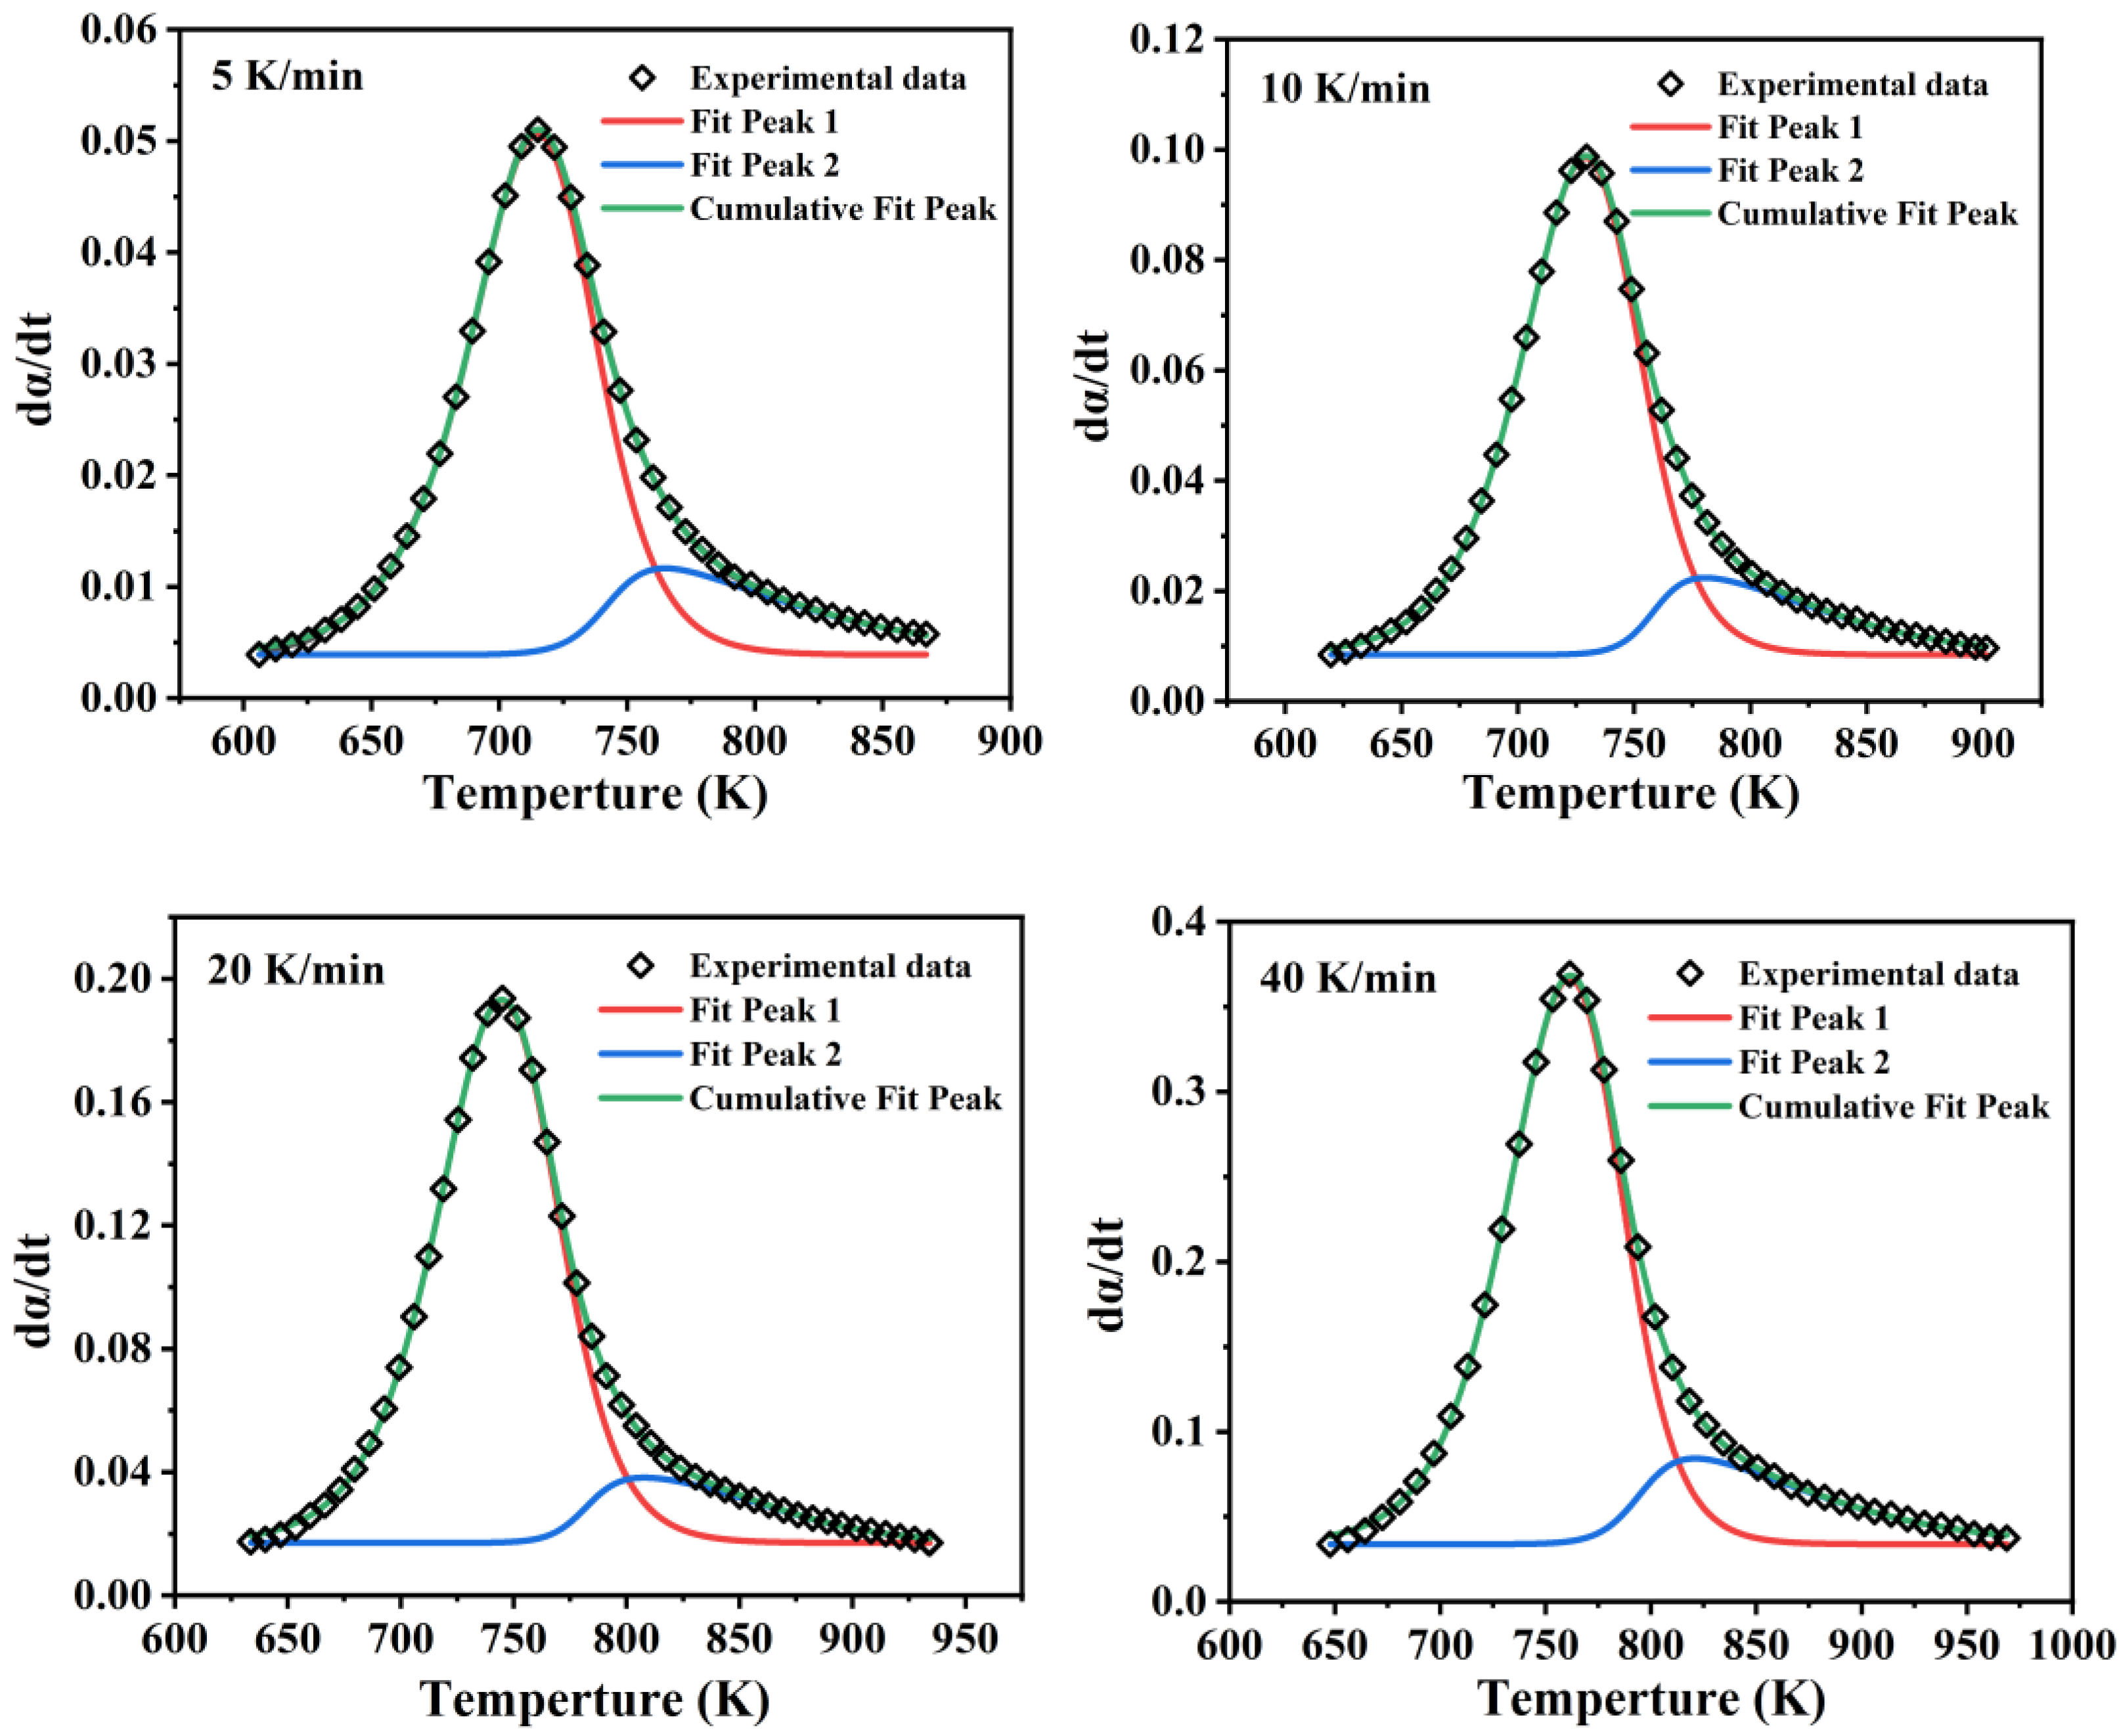
Based on the data presented in Figure 2d and the deconvolution method, the reaction rate evolution of the UC was separated into two distinct sub-peaks in Figure 3. Peak I mainly includes the decomposition of aliphatic hydrocarbons, while Peak II represents the decomposition of residual kerogen. This stage is primarily associated with the decomposition of short-chain hydrocarbons and aromatic compounds, as well as aromatization reactions. The main thermal characteristics of the fitting parameters for the two peaks are presented in Table 5. The RSS is small enough, and the R2 is close to 1, further demonstrating the accuracy of the fitting results. The pyrolysis process of each stage was further analyzed through kinetic methods.
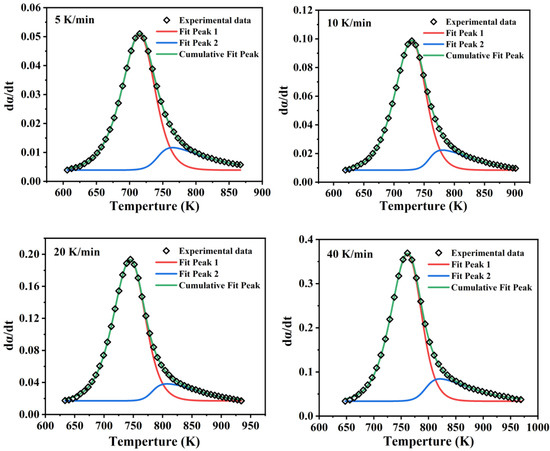
Figure 3.
Asym2sig peak fitting for UC at 5, 10, 20, and 40 K/min.
Table 5.
Thermal characteristics for two sub-peaks based on Asym2sig function for UC.
3.3. Pyrolysis Kinetic Analysis
3.3.1. Determination of Activation Energies
Starink methods were employed to calculate the activation energy based on the thermogravimetric data at four heating rates. Figure 4 depicts the changes in activation energy and correlation coefficients R2 for the two mudstones as the conversion rate increases. The correlation coefficients are close to 1, indicating sufficient accuracy in the obtained activation energies. The average activation energies calculated for the MP, UC-Peak I, and UC-Peak II are 191.74 kJ/mol, 185.65 kJ/mol, and 144.04 kJ/mol, respectively. A similarity can be discerned between the activation energy and pattern of the MP and UC-Peak I, which may arise from the presence of similar organic structures (aliphatic hydrocarbons) during the pyrolysis stage. Comparatively, the activation energy of UC-Peak II and its trend differed significantly from that of the MP, indicating a distinction between the organic structures of the UC and MP.
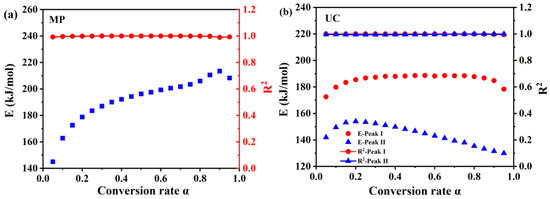
Figure 4.
The activation energies E and the corresponding correlation coefficient R2 of the organic matter pyrolysis process by Starink method for (a) MP; (b) UC.
3.3.2. Evaluation of Reaction Models and Pre-Exponential Factors
The reaction model was initially fitted using the Coats-Redfern method. Table S1 illustrates the activation energies and the correlation coefficients of the different reaction models for the MP during the whole pyrolysis process at heating rates of 5, 10, 20, and 40 K/min. A plot of In(g(α)/T2) versus 1/T was made using the F1, D1, and A2/3 reaction mechanisms at a heating rate of 20 K/min as an example (Figure S2a). The analysis reveals a clear contrast in reaction models for the conversion ranges of 0.05–0.75 and 0.75–0.95. Therefore, the reaction models for the two conversion stages need to be calculated separately. It can be deduced initially that the possible reaction mechanism functions of the two stages are A5/6, Avarami-Erofeev model, and F3, third-order model (n = 3), with a high correlation coefficient R2 by calculation, respectively (Table S1). The linear relationship between E and InA was applied to obtain the initial pre-exponential factors. Table S6 summarizes the linear relationship between E and InA at different heating rates for the MP according to Table S1. Here, the average activation energies of the two stages obtained by the Starink method, which are 186.986 kJ/mol and 208.32 kJ/mol, respectively, were employed to obtain the initial pre-exponential factors (Table S4).
The same calculation method was employed for the UC. The results are shown in Figure S2, Tables S2–S4. For Peak I, the pyrolysis process can be divided into three conversion stages according to the different reaction mechanism functions. The first and second stages (α∈(0.05–0.2) and (0.2–0.7)) have reaction mechanism functions of A2/3 and A4/5, respectively; the third stage (α∈(0.7–0.95)) is F2. Here, the average activation energies of the three stages are 180.27 kJ/mol, 187.80 kJ/mol, and 185.72 kJ/mol, respectively. The initial pre-exponential factors are summarized in Table S4. Similarly, the pyrolysis process can be divided into three stages for Peak II, and the mechanistic models are A1.5 (α∈(0.05–0.34)), F2 (α∈(0.34–0.78)), and A3/4 (α∈(0.78–0.95)), respectively. The average activation energies of the three stages are, respectively, 150.73 kJ/mol, 144.69 kJ/mol, and 132.53 kJ/mol.
In summary, this study shows that the reaction mechanism functions of the two mudstones differ. Table 6 summarizes the kinetic parameters (average activation energy and reaction model) for the two mudstones at different conversion rate ranges. In conjunction with Figure 4, it is evident that the MP and UC-Peak I have some similarities in the reaction models in the same conversion range. The difference in the average activation energy may be due to the catalytic or inhibitory effect of the different minerals and structural discrepancies in the aliphatic hydrocarbons. In contrast, UC-Peak II differs significantly from Peak I in the kinetic model. The reaction models were further determined more precisely by correcting the reaction model.
Table 6.
The average activation energy and reaction model for the two mudstones at different conversion rate ranges.
3.3.3. Model Reconstruction
From the above research on reaction models, it can be discovered that a single reaction mechanism function may not respond well to the pyrolysis reaction model, and the common pyrolysis reaction models are not suitable for solid structures [20]. Therefore, to better align with the experimental data, the accommodation function can be introduced to modify the theoretical reaction model, which can be expressed according to the Sestak-Berggren method [39]:
αm, (1−α)n, and [−In(1−α)]p represent three different reaction models. To obtain the modified function, the Málek method [40] was employed to reconstruct the kinetic models, and the expressions are as follows:
E and A represent the average activation energies (obtained by the Starink method) and the pre-exponential factors at different heating rates. The shape of the theoretical curve f(α) should therefore be consistent with the experimental curve y(α). If there is good agreement between the simulated and experimental plots, f(α) is the most appropriate reaction model. Based on the previous preliminary determination of the reaction mechanism functions and further data fitting and calculations, Table 7 summarizes the optimal fitting parameters. MP and UC-Peak I exhibit similar values of m, n, and p in similar conversion ranges. In contrast, the values of m, n, and p for UC-Peak I are different from those of UC-Peak II.
Table 7.
Optimum fitting parameters of MP and UC.
The reaction rate’s fitted expression can be obtained by inserting the modified f(a) into the rate equation (Equation (1)). Figure 5 compares the reaction rates between the experimental and simulated data and shows good agreement in the range of 0 ≤ α ≤ 1. Furthermore, the correlation coefficients of R2 are close to 1 at all four heating rates (Tables S5–S7), illustrating the effectiveness and accuracy of the process segmentation by deconvolution and using the Coats-Redfern method. In addition, the final A at different heating rates are shown in Tables S5–S7. Therefore, the modified function can accurately describe the pyrolysis kinetics of the two mudstones. The slight errors between the measured and fitted data occur mainly between the conversion rates 0–0.05 and 0.95–1, which are due to the inaccurate values of the kinetic parameters in the first and last 10% of the reaction [41].
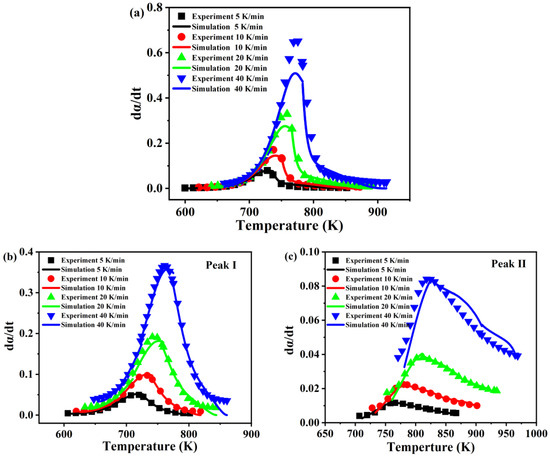
Figure 5.
Comparison of the reaction rate dα/dt between the experimental and simulated data for (a) MP; (b) UC-Peak I; (c) UC-Peak II.
From the aforementioned kinetic studies, it can be determined that these kinetic parameters can well-express the pyrolysis process and kinetics of the two mudstones. In addition, there are some similarities and differences in the variation of the activation energies and the reaction model. The differences in the organic microstructure and mineral composition led to the differences in the pyrolysis kinetics.
3.4. Volatile Products Analysis
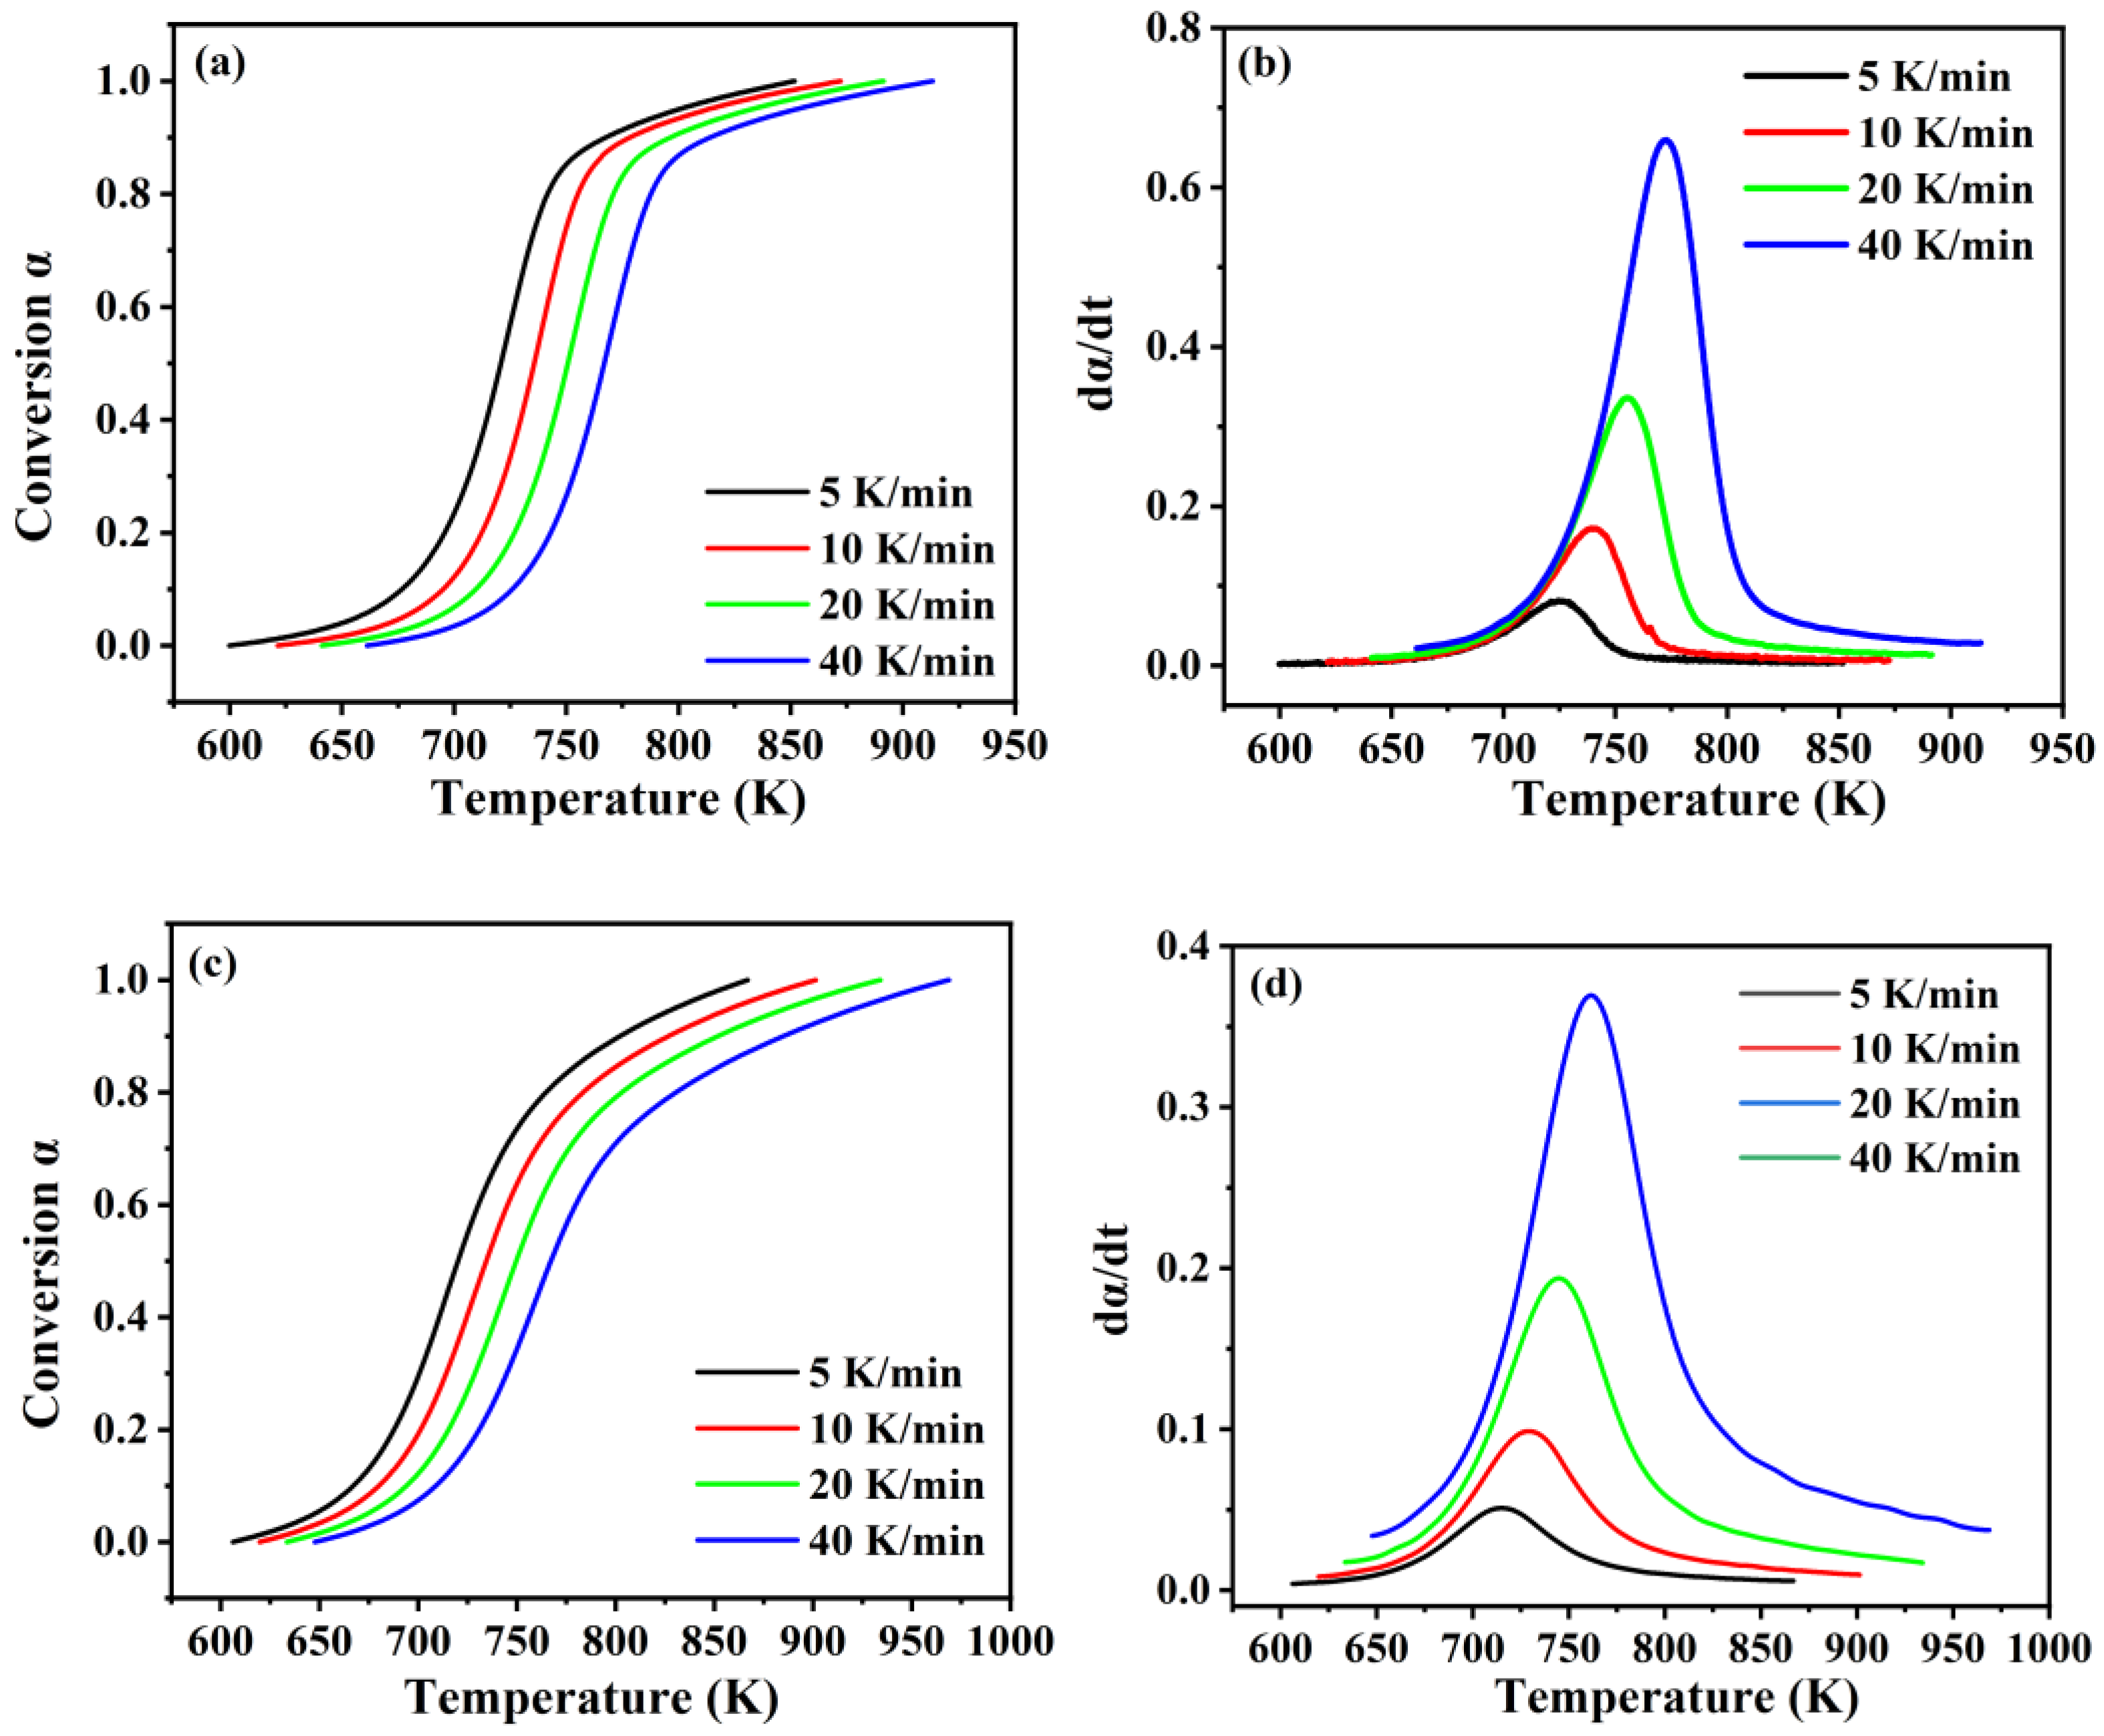
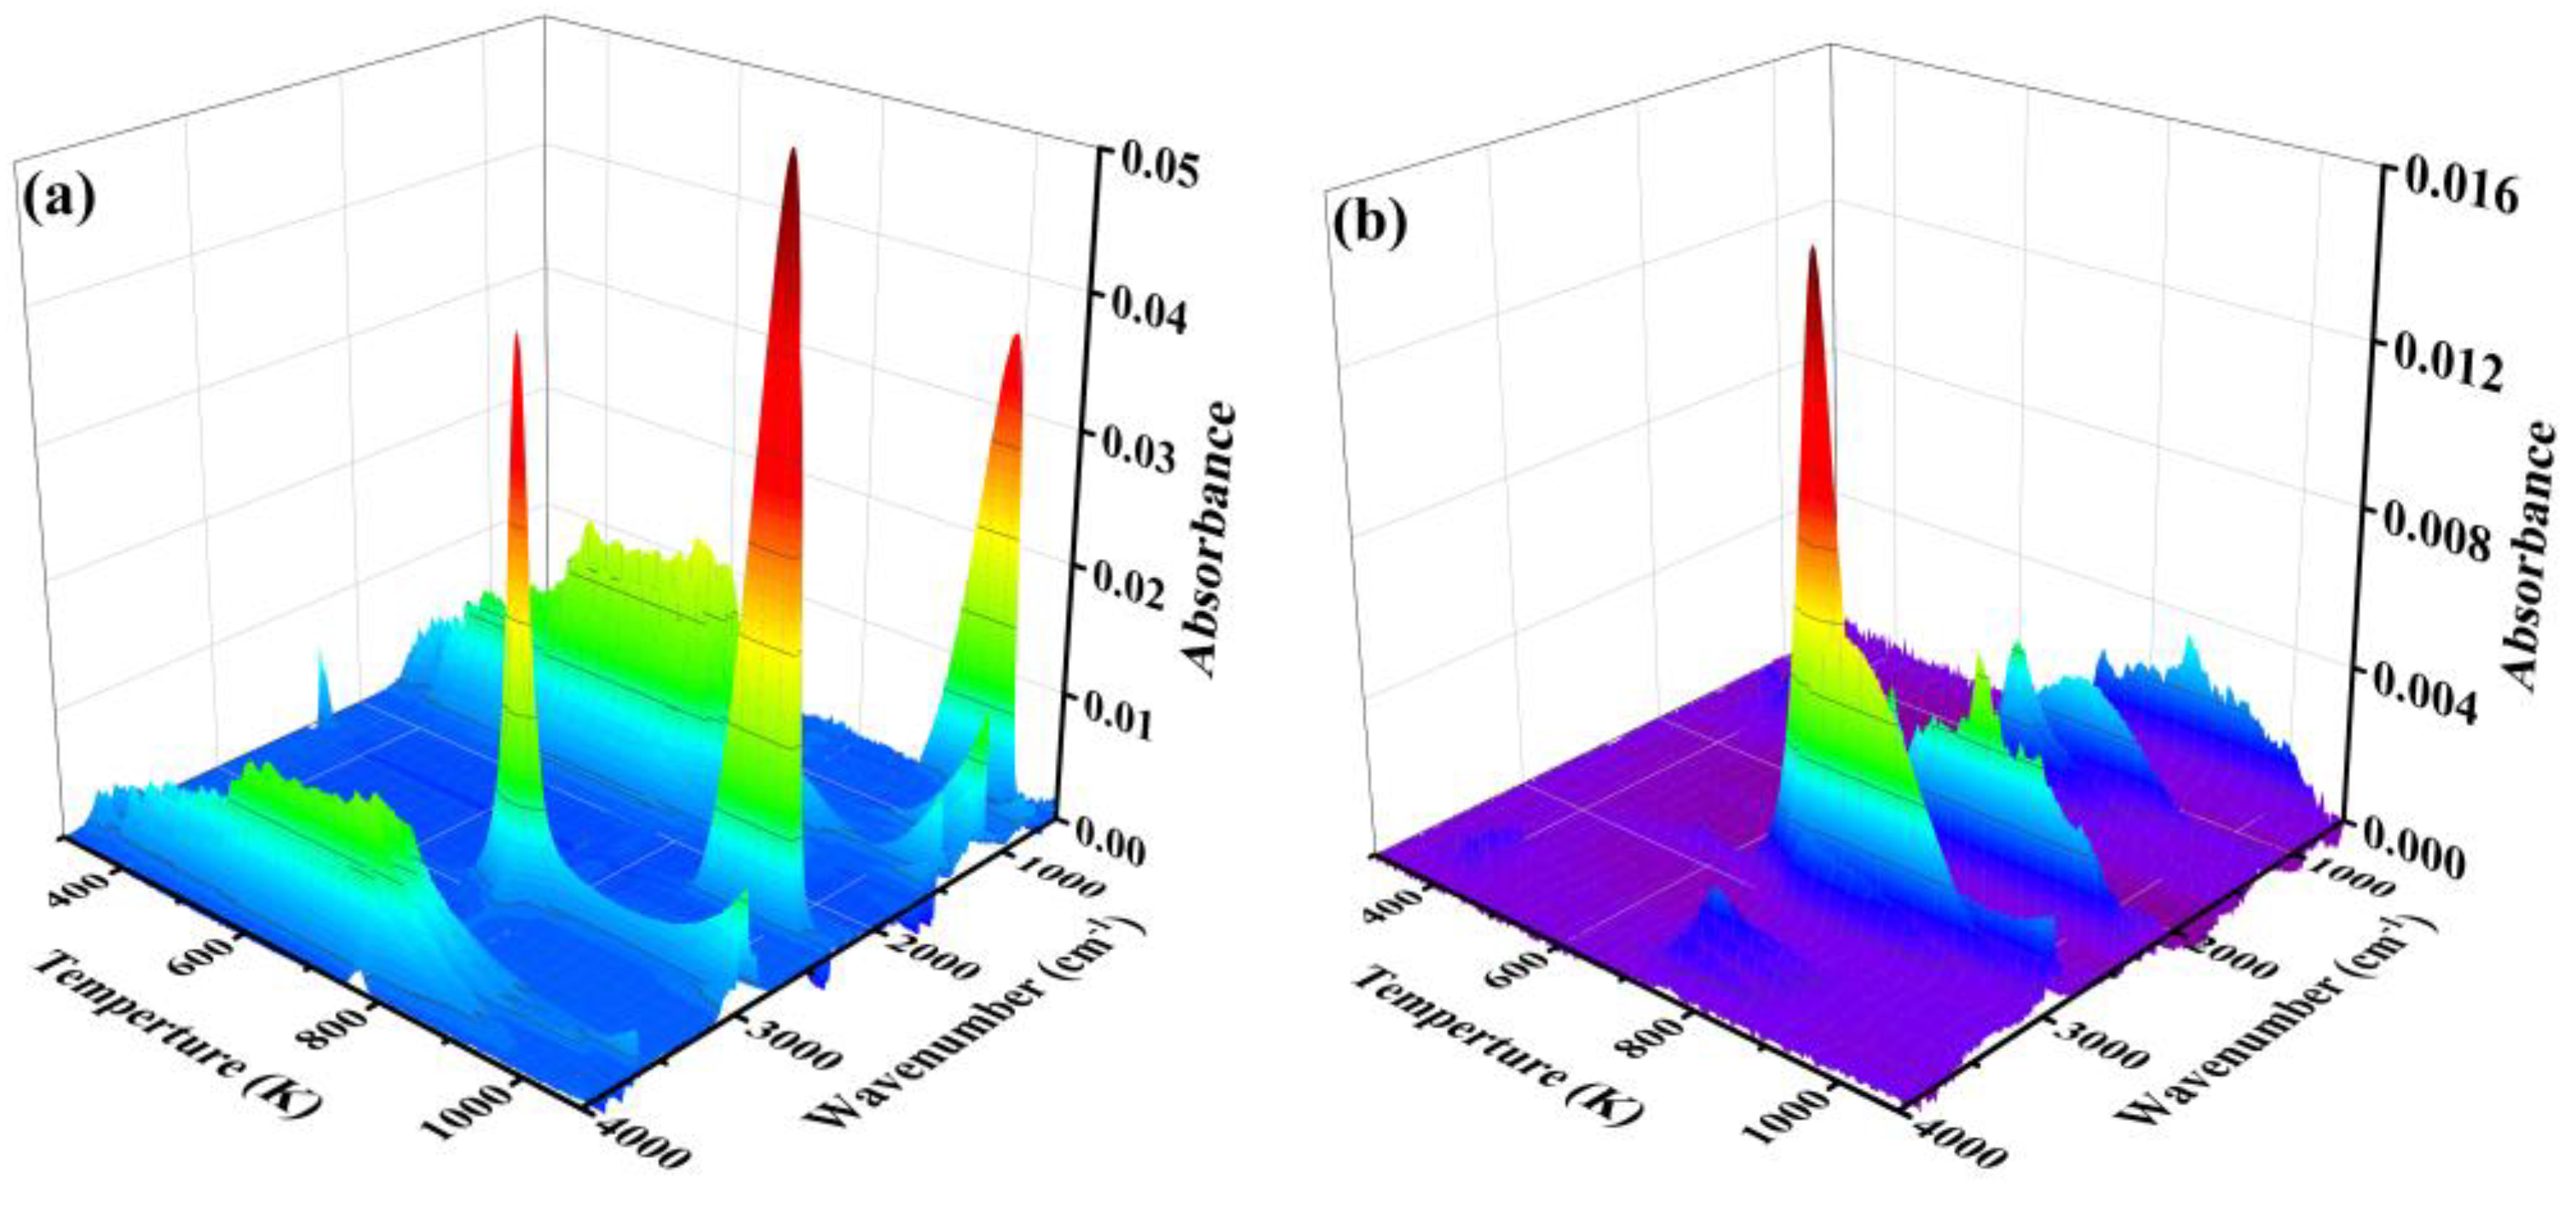
To further investigate the effects of the differences in the organic matter structure and mineral composition between the two mudstones on the pyrolysis kinetics and processes and to clarify the relationship between the pyrolysis kinetics and processes, simultaneous testing and analysis of the volatiles of the pyrolysis process were performed online using TG-FTIR. Figure 6a,b depicts the three-dimensional diagram of the pyrolysis volatiles between 300–1100 K at a heating rate of 20 K/min for the MP and UC, respectively. In addition, for a more comprehensive and in-depth understanding of the changes in the pyrolysis volatiles in the pyrolysis hydrocarbon generation process (650–950 K), Figure 6c,d shows the evolution process of the major pyrolysis volatiles and functional groups with the temperature change, including the C2+ aliphatics, CH4, aromatics, CO2, CO, OH, C-O in ethers, phenols, alcohols [42], and so on. It can be discovered that the pyrolysis volatilization products of the MP and UC are significantly different at different temperatures. Due to the wide distribution of hydroxyl peaks, the peaks with sharper and higher intensity were selected as the target peaks of the hydroxyl groups in Figure 6c,d. The target peaks of other volatiles were also determined based on this criterion. For the MP, hydroxyl peaks were detected from 300 K to 1000 K, peaking at approximately 600–800 K. However, small hydroxyl peaks appeared at 300–500 K for the UC, which originate from the adsorbed water and interlayer water in the clay minerals [28], and at 700–950 K, which mainly originate from the crystalline water in the clay minerals [27]. In addition, the intensity of the hydroxyl peaks detected in the MP sample is much higher than that of the UC. The temperature interval and intensity of the hydroxyl peaks appearing in the two samples are different. This derives from the differences in the types of clay minerals.

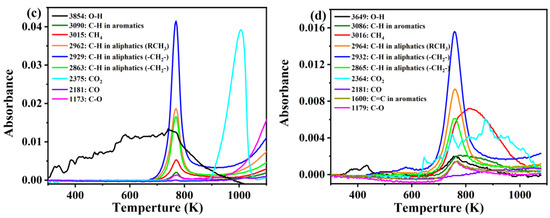
Figure 6.
(a,b) Three-dimensional infrared spectra of volatile compounds released during pyrolysis at 20 K min−1; (c,d) the evolution of the major pyrolysis volatiles with temperature increasing ((a,c) for MP and (b,d) for UC).
The types and yields of the volatiles differed between the two mudstones during the generation of pyrolytic hydrocarbons. The principal difference was observed in the volatilization of CO2 and CO. CO2 was produced within the temperature range of 650–1000 K, and CO started to increase slowly above 700 K for the UC. As the UC does not contain carbonate, the production of CO and CO2 mainly derives from C-O and C=O in the organic matter. There is almost no CO or CO2 production in the pyrolytic hydrocarbon generation stage (650–900 K), and the production of CO2 above 900 K originates from the decomposition of carbonate for the MP. Consequently, the UC contains more oxygenated functional groups than the MP. In addition, weak volatilization of organic matter containing C-O bonds (1300–1000 cm−1) is also observed in both mudstones with comparable intensity.
The second disparity pertains to the difference in the type and yield of hydrocarbons. The yield of C2+ aliphatic hydrocarbons for the MP is much higher than that for the UC due to the better organic matter type. However, in terms of both the yield and temperature range, the UC can produce more methane in a wider temperature range. This research discovered that methane production predominantly stems from the breakage of C-C bonds of aliphatic hydrocarbons from about 720 K to 800 K [32], and some more stable C-C bonds in short-chain aliphatic hydrocarbons and aromatics tended to break to produce methane above 800 K [43]. Therefore, the organic matter of the UC may contain more branched or short-chain aliphatic hydrocarbons and aromatic hydrocarbons. In addition, the aromatics started to volatilize above 700 K and only exhibited a significant decrease above 900 K for the UC, whereas the aromatics volatilized mainly and primarily in the range of 700–800 K for the MP.
To further clarify the impact of the different organic microstructures of the two samples on the pyrolysis volatiles, the ratio of the peak area at the position adjacent to 2962 cm−1 to the peak area at the position near 2929 cm−1 is defined as the branched degree of the volatile aliphatic hydrocarbons. The intensity of -RCH3 increases with the number of branched chains present in the volatiles. The ratio of the peak area at 3016 cm−1 to the peak area at 2929 cm−1, 3016 cm−1, and 3086 cm−1 was determined as the methanogenicity of the volatile hydrocarbon. The ratios of the peak area at 3086 cm−1 to the peak areas at 2929 cm−1, 3016 cm−1, and 3086 cm−1 are considered the aromaticity of the volatile hydrocarbons. The relative peak area was calculated through integration. The temperature interval of integration for the two mudstones is between 650–900 K. Table 8 summarizes the peak areas of the two mudstones at different positions and the associated indices. The branched degree of the aliphatic hydrocarbons in the UC is higher than that in the MP, indicating that the organic matter of the UC may contain more branched or short-chain aliphatic hydrocarbons, while the MP may possess more long-chain aliphatic hydrocarbons. The branched degree of the aliphatic hydrocarbons may also impact the amount of methane produced through pyrolysis. The higher the branched degree, the more methane that would be produced by pyrolysis and the higher the methanogenicity. The methanogenicity of the UC was three times higher than that of the MP. And this does not include the methane production of the UC above 900 K (above 900 K, the intensity of the UC methane peak is higher than that of the non-methane aliphatic hydrocarbons), indicating that the organic structure of the UC is more favorable for methane production than that of the MP. In addition, the aromaticity of the UC is also significantly greater than that of the MP (about four times), illustrating that the UC may contain more aromatic hydrocarbons and therefore improve methane production.
Table 8.
The relative peak areas of pyrolytic volatiles of MP and UC at different positions and the associated indices.
3.5. Discussion and Summary
Table 9 summarizes and compares the chemical structural properties, pyrolysis kinetics, and processes of two mudstones in this paper. There are some differences in organic microstructure due to the different depositional environments. The kerogen of UC has relatively more oxygenated organic matter, multi-branched or short-chain organic matter pyrolysis process aliphatic hydrocarbons, and aromatic hydrocarbons, while MP has relatively more long-chain aliphatic hydrocarbons. The lower maturity of UC indicates a higher presence of less-thermodynamically stable functional groups, which affects the activation energy. Moreover, different mineral compositions may also have different catalytic effects on the pyrolysis kinetics and processes. Based on the above research, there are some similarities and differences in the reaction process and kinetic parameters of the two mudstones at different stages.
Table 9.
The comparison of the chemical structural properties, pyrolysis kinetics, and pyrolysis processes of MP and UC.
The pyrolysis product types and reaction models of MP and UC-Peak I have some similarities, indicating that the two stages have some similarities in the pyrolysis process, which primarily involves the pyrolysis of aliphatic hydrocarbons. The differences in activation energy are probably due to differences in aliphatic structure and mineral composition. It has been demonstrated that the activation energies of pyrolysis involving more long-chain aliphatic hydrocarbons are relatively lower than those involving short- or medium-chain aliphatic hydrocarbons [44]. However, the lower maturity of UC may counteract the effect of aliphatic hydrocarbon chain length on activation energy. And the presence of carbonates in MP may inhibit the pyrolysis of long-chain aliphatic hydrocarbons [45].
As UC contains more aromatic compounds, short-chain hydrocarbons, and oxygenated organic compounds, it produces relatively more methane and oxygenated compounds at high temperatures, resulting in a more intricate reaction process (Peak II). It is noteworthy that the activation energy of peak II is lower than that of peak I. which is related to the pyrolysis of organic matter and the interaction between organic matter and pyrolysis products and minerals. The presence of minerals may significantly reduce the activation energy of methane production and the pyrolysis of oxygenated organic matter [46,47]. In addition, the catalytic and adsorptive effects of clay minerals also significantly affect the production and activation energy of gaseous hydrocarbons [4,48].
4. Conclusions
In this study, two representative organic-rich mudstones from different depositional environments widely distributed in the Junggar Basin were selected for the investigation and comparison of the pyrolysis kinetics and processes based on thermogravimetric experiments. The characterization of the Rock-Eval pyrolysis, FTIR, and XRD show some differences in the organic matter type and microstructure. The MP had more aliphatic hydrocarbon and a higher hydrocarbon generation potential. In addition, the MP contained some amount of carbonate minerals, whereas the UC has a relatively high content of quartz and clay minerals. There were also some differences in the types of clay minerals between the two samples. The kinetic results found that the pyrolysis processes in the MP and UC-Peak I were relatively similar, mainly involving aliphatic hydrocarbon pyrolysis processes. In contrast, since the UC contained relatively more oxygenated organic matter, multi-branched or short-chain aliphatic hydrocarbons, and aromatic hydrocarbons, the UC could produce more methane, CO, CO2, and aromatic volatiles at high temperatures. Therefore, Stage II of the UC differs from Stage I in terms of the type and yield of the pyrolysis volatiles, activation energy, and its trend and reaction mechanism. In addition, the kinetic parameters could be well-fitted to the reaction rates, indicating the effectiveness of the kinetic methods.
In conclusion, this paper provides a novel method to compare and study the pyrolysis kinetics of hydrocarbon source rocks of different kerogen types. It is expected that this study can provide a theoretical basis for the development and utilization of organic-rich rocks of different types in different geological periods.
Supplementary Materials
The following supporting information can be downloaded at: https://www.mdpi.com/article/10.3390/en16176372/s1, Figure S1: TG and DTG curves of (a, b) MP; (c, d) UC.; Figure S2: The plot of In(g(α)/T2) against 1/T when the reaction model is F1, D1 and A2/3 at 20 K/min for (a) MP; (b) UC-Peak I; (c) UC-Peak II. Table S1: Calculation results of the activation energy and reaction mechanism of MP using Coats-Redfern method; Table S2: Calculation results of the activation energy and reaction mechanism of UC (Peak I) using Coats-Redfern method; Table S3: Calculation results of the activation energy and reaction mechanism of UC (Peak II) using Coats-Redfern method; Table S4: The linear equation of E and InA and kinetic parameters at different heating rates; Table S5: The final pre-exponential factors A and the correlation coefficients R2 between experimental data and simulated data of MP; Table S6: The final pre-exponential factors A and the correlation coefficients R2 between experimental data and simulated data of UC-Peak I; Table S7: The final pre-exponential factors A and the correlation coefficients R2 between experimental data and simulated data of UC-Peak II.
Author Contributions
Methodology, Y.L.; Validation, Y.L.; Investigation, Y.L.; Data Curation, Y.L. and Z.S.; Writing—Original Draft Preparation, Y.L.; Writing—Review and Editing, Y.L., S.Z., J.L., Z.S. and W.P.; Supervision, S.Z. and J.L.; Project Administration, S.Z and J.L.; Funding Acquisition, S.Z and J.L. All authors have read and agreed to the published version of the manuscript.
Funding
This study was supported by the National Natural Science Foundation of China (Nos. 42272192 and 41872147) and the National Natural Science Foundation of China (Nos. 42172178 and 42372178).
Data Availability Statement
Not applicable.
Conflicts of Interest
The authors declare no competing financial interest.
References
- Schenk, H.J.; Di Primio, R.; Horsfield, B. The conversion of oil into gas in petroleum reservoirs. Part 1: Comparative kinetic investigation of gas generation from crude oils of lacustrine, marine and fluviodeltaic origin by programmed-temperature closed-system pyrolysis. Org. Geochem. 1997, 26, 467–481. [Google Scholar] [CrossRef]
- Casal, M.D.; Vega, M.F.; Diaz-Faes, E.; Barriocanal, C. The influence of chemical structure on the kinetics of coal pyrolysis. Int. J. Coal Geol. 2018, 195, 415–422. [Google Scholar] [CrossRef]
- Bai, F.; Liu, Y.; Lai, C.; Sun, Y.; Wang, J.; Sun, P.; Xue, L.; Zhao, J.; Guo, M. Thermal Degradations and Processes of Four Kerogens via Thermogravimetric–Fourier-Transform Infrared: Pyrolysis Performances, Products, and Kinetics. Energy Fuels 2020, 34, 2969–2979. [Google Scholar] [CrossRef]
- Horsfield, B.; Douglas, A.G. The influence of minerals on the pyrolysis of kerogens. Geochim. Cosmochim. Acta 1980, 44, 1119–1131. [Google Scholar] [CrossRef]
- Ma, X.; Zheng, J.; Zheng, G.; Xu, W.; Qian, Y.; Xia, Y.; Wang, Z.; Wang, X.; Ye, X. Influence of pyrite on hydrocarbon generation during pyrolysis of type-III kerogen. Fuel 2016, 167, 329–336. [Google Scholar] [CrossRef]
- Jiang, H.; Song, L.; Cheng, Z.; Chen, J.; Zhang, L.; Zhang, M.; Hu, M.; Li, J.; Li, J. Influence of pyrolysis condition and transition metal salt on the product yield and characterization via Huadian oil shale pyrolysis. J. Anal. Appl. Pyrolysis 2015, 112, 230–236. [Google Scholar] [CrossRef]
- Behar, F.; Roy, S.; Jarvie, D. Artificial maturation of a Type I kerogen in closed system: Mass balance and kinetic modelling. Org. Geochem. 2010, 41, 1235–1247. [Google Scholar] [CrossRef]
- Gong, D.; Wang, Y.; Yuan, M.; Liu, C.; Mi, J.; Lu, S.; Zhao, L. Genetic types and origins of natural gases from eastern Fukang Sub-depression of the Junggar Basin, NW China: Implication for low-mature coal-derived gases. J. Nat. Gas Geosci. 2017, 2, 179–189. [Google Scholar] [CrossRef]
- Gong, D.; Song, Y.; Wei, Y.; Liu, C.; Wu, Y.; Zhang, L.; Cui, H. Geochemical characteristics of Carboniferous coaly source rocks and natural gases in the Southeastern Junggar Basin, NW China: Implications for new hydrocarbon explorations. Int. J. Coal Geol. 2019, 202, 171–189. [Google Scholar] [CrossRef]
- Yang, X.-F.; He, D.-F.; Wang, Q.-C.; Tang, Y. Tectonostratigraphic evolution of the Carboniferous arc-related basin in the East Junggar Basin, northwest China: Insights into its link with the subduction process. Gondwana Res. 2012, 22, 1030–1046. [Google Scholar] [CrossRef]
- Sun, P.A.; Wang, Y.; Leng, K.; Li, H.; Ma, W.; Cao, J. Geochemistry and origin of natural gas in the eastern Junggar Basin, NW China. Mar. Pet. Geol. 2016, 75, 240–251. [Google Scholar] [CrossRef]
- Shao, D.; Zhang, T.; Ko, L.T.; Li, Y.; Yan, J.; Zhang, L.; Luo, H.; Qiao, B. Experimental investigation of oil generation, retention, and expulsion within Type II kerogen-dominated marine shales: Insights from gold-tube nonhydrous pyrolysis of Barnett and Woodford Shales using miniature core plugs. Int. J. Coal Geol. 2020, 217, 103337. [Google Scholar] [CrossRef]
- Pan, L.; Dai, F.; Li, G.; Liu, S. A TGA/DTA-MS investigation to the influence of process conditions on the pyrolysis of Jimsar oil shale. Energy 2015, 86, 749–757. [Google Scholar] [CrossRef]
- Tiwari, P.; Deo, M. Compositional and kinetic analysis of oil shale pyrolysis using TGA–MS. Fuel 2012, 94, 333–341. [Google Scholar] [CrossRef]
- Bai, F.; Sun, Y.; Liu, Y.; Li, Q.; Guo, M. Thermal and kinetic characteristics of pyrolysis and combustion of three oil shales. Energy Convers. Manag. 2015, 97, 374–381. [Google Scholar] [CrossRef]
- Bouamoud, R.; Moine, E.C.; Mulongo-Masamba, R.; El Hamidi, A.; Halim, M.; Arsalane, S. Type I kerogen-rich oil shale from the Democratic Republic of the Congo: Mineralogical description and pyrolysis kinetics. Pet. Sci. 2020, 17, 255–267. [Google Scholar] [CrossRef]
- Bai, H.; Mao, N.; Wang, R.; Li, Z.; Zhu, M.; Wang, Q. Kinetic characteristics and reactive behaviors of HSW vitrinite coal pyrolysis: A comprehensive analysis based on TG-MS experiments, kinetics models and ReaxFF MD simulations. Energy Rep. 2021, 7, 1416–1435. [Google Scholar] [CrossRef]
- Wang, M.; Li, Z.; Huang, W.; Yang, J.; Xue, H. Coal pyrolysis characteristics by TG–MS and its late gas generation potential. Fuel 2015, 156, 243–253. [Google Scholar] [CrossRef]
- Yan, J.; Liu, M.; Feng, Z.; Bai, Z.; Shui, H.; Li, Z.; Lei, Z.; Wang, Z.; Ren, S.; Kang, S.; et al. Study on the pyrolysis kinetics of low-medium rank coals with distributed activation energy model. Fuel 2020, 261, 116359. [Google Scholar] [CrossRef]
- Zhang, W.; Zhang, J.; Ding, Y.; He, Q.; Lu, K.; Chen, H. Pyrolysis kinetics and reaction mechanism of expandable polystyrene by multiple kinetics methods. J. Clean. Prod. 2021, 285, 125042. [Google Scholar] [CrossRef]
- Wang, J.; Lian, W.; Li, P.; Zhang, Z.; Yang, J.; Hao, X.; Huang, W.; Guan, G. Simulation of pyrolysis in low rank coal particle by using DAEM kinetics model: Reaction behavior and heat transfer. Fuel 2017, 207, 126–135. [Google Scholar] [CrossRef]
- Venkatesh, M.; Ravi, P.; Tewari, S.P. Isoconversional Kinetic Analysis of Decomposition of Nitroimidazoles: Friedman method vs Flynn–Wall–Ozawa Method. J. Phys. Chem. A 2013, 117, 10162–10169. [Google Scholar] [CrossRef] [PubMed]
- Yan, J.; Jiao, H.; Li, Z.; Lei, Z.; Wang, Z.; Ren, S.; Shui, H.; Kang, S.; Yan, H.; Pan, C. Kinetic analysis and modeling of coal pyrolysis with model-free methods. Fuel 2019, 241, 382–391. [Google Scholar] [CrossRef]
- Yan, J.; Jiang, X.; Han, X.; Liu, J. A TG–FTIR investigation to the catalytic effect of mineral matrix in oil shale on the pyrolysis and combustion of kerogen. Fuel 2013, 104, 307–317. [Google Scholar] [CrossRef]
- Wang, W.; Luo, G.; Zhao, Y.; Tang, Y.; Wang, K.; Li, X.; Xu, Y. Kinetic and thermodynamic analyses of co-pyrolysis of pine wood and polyethylene plastic based on Fraser-Suzuki deconvolution procedure. Fuel 2022, 322, 124200. [Google Scholar] [CrossRef]
- Moine, E.c.; Groune, K.; El Hamidi, A.; Khachani, M.; Halim, M.; Arsalane, S. Multistep process kinetics of the non-isothermal pyrolysis of Moroccan Rif oil shale. Energy 2016, 115, 931–941. [Google Scholar] [CrossRef]
- Bai, F.; Guo, W.; Lü, X.; Liu, Y.; Guo, M.; Li, Q.; Sun, Y. Kinetic study on the pyrolysis behavior of Huadian oil shale via non-isothermal thermogravimetric data. Fuel 2015, 146, 111–118. [Google Scholar] [CrossRef]
- Zhang, J.; Sun, L.; Zhang, J.; Ding, Y.; Chen, W.; Zhong, Y. Kinetic parameters estimation and reaction model modification for thermal degradation of Beizao oil shale based on thermogravimetric analysis coupled with deconvolution procedure. Energy 2021, 229, 120791. [Google Scholar] [CrossRef]
- Zhang, J.; Ding, Y.; Du, W.; Lu, K.; Sun, L. Study on pyrolysis kinetics and reaction mechanism of Beizao oil shale. Fuel 2021, 296, 120696. [Google Scholar] [CrossRef]
- Starink, M.J. The determination of activation energy from linear heating rate experiments: A comparison of the accuracy of isoconversion methods. Thermochim. Acta 2003, 404, 163–176. [Google Scholar] [CrossRef]
- Khawam, A.; Flanagan, D.R. Solid-State Kinetic Models: Basics and Mathematical Fundamentals. J. Phys. Chem. B 2006, 110, 17315–17328. [Google Scholar] [CrossRef] [PubMed]
- Huang, Z.; Liang, T.; Zhan, Z.-W.; Zou, Y.-R.; Li, M.; Peng, P.a. Chemical structure evolution of kerogen during oil generation. Mar. Pet. Geol. 2018, 98, 422–436. [Google Scholar] [CrossRef]
- Sun, Y.; Bai, F.; Liu, B.; Liu, Y.; Guo, M.; Guo, W.; Wang, Q.; Lü, X.; Yang, F.; Yang, Y. Characterization of the oil shale products derived via topochemical reaction method. Fuel 2014, 115, 338–346. [Google Scholar] [CrossRef]
- Gougazeh, M.; Alsaqoor, S.; Borowski, G.; Alsafasfeh, A.; Hdaib, I. The behavior of Jordanian oil shale during combustion process from the El-Lajjun deposit, Central Jordan. J. Ecol. Eng. 2022, 23, 133–140. [Google Scholar] [CrossRef] [PubMed]
- Zhao, Y.; Liu, L.; Qiu, P.-H.; Xie, X.; Chen, X.-Y.; Lin, D.; Sun, S.-Z. Impacts of chemical fractionation on Zhundong coal’s chemical structure and pyrolysis reactivity. Fuel Process. Technol. 2017, 155, 144–152. [Google Scholar] [CrossRef]
- Zhao, Y.; Xing, C.; Shao, C.; Chen, G.; Sun, S.; Chen, G.; Zhang, L.; Pei, J.; Qiu, P.; Guo, S. Impacts of intrinsic alkali and alkaline earth metals on chemical structure of low-rank coal char: Semi-quantitative results based on FT-IR structure parameters. Fuel 2020, 278, 118229. [Google Scholar] [CrossRef]
- Song, H.; Liu, G.; Zhang, J.; Wu, J. Pyrolysis characteristics and kinetics of low rank coals by TG-FTIR method. Fuel Process. Technol. 2017, 156, 454–460. [Google Scholar] [CrossRef]
- Safaei-Farouji, M.; Jafari, M.; Semnani, A.; Gentzis, T.; Liu, B.; Liu, K.; Shokouhimehr, M.; Ostadhassan, M. TGA and elemental analysis of type II kerogen from the Bakken supported by HRTEM. J. Nat. Gas Sci. Eng. 2022, 103, 104606. [Google Scholar] [CrossRef]
- Šesták, J.; Berggren, G. Study of the kinetics of the mechanism of solid-state reactions at increasing temperatures. Thermochim. Acta 1971, 3, 1–12. [Google Scholar] [CrossRef]
- Málek, J. The kinetic analysis of non-isothermal data. Thermochim. Acta 1992, 200, 257–269. [Google Scholar] [CrossRef]
- Burnham, A.K. Historical Perspective on the Maturation of Modeling Coal and Kerogen Pyrolysis. Energy Fuels. 2021, 35, 10451–10460. [Google Scholar] [CrossRef]
- Wang, Q.; Hua, Z.; Guan, J. Structure of Wangqing oil shale and mechanism of carbon monoxide release during its pyrolysis. Energy Sci. Eng. 2019, 7, 2398–2409. [Google Scholar] [CrossRef]
- van Heek, K.H.; Hodek, W. Structure and pyrolysis behaviour of different coals and relevant model substances. Fuel 1994, 73, 886–896. [Google Scholar] [CrossRef]
- Liang, H.; Xu, F.; Grice, K.; Xu, G.; Holman, A.; Hopper, P.; Fu, D.; Yu, Q.; Liang, J.; Wang, D. Kinetics of oil generation from brackish-lacustrine source rocks in the southern Bohai Sea, East China. Org. Geochem. 2020, 139, 103945. [Google Scholar] [CrossRef]
- Chang, Z.; Chu, M.; Zhang, C.; Bai, S.; Lin, H.; Ma, L. Influence of inherent mineral matrix on the product yield and characterization from Huadian oil shale pyrolysis. J. Anal. Appl. Pyrolysis 2018, 130, 269–276. [Google Scholar] [CrossRef]
- Katti, D.R.; Thapa, K.B.; Katti, K.S. Modeling molecular interactions of sodium montmorillonite clay with 3D kerogen models. Fuel. 2017, 199, 641–652. [Google Scholar] [CrossRef]
- Faisal, H.M.N.; Katti, K.S.; Katti, D.R. An insight into quartz mineral interactions with kerogen in Green River oil shale. Int. J. Coal Geol. 2021, 238, 103729. [Google Scholar] [CrossRef]
- Lei, H.; Shi, Y.; Guan, P.; Fang, X. Catalysis of aluminosilicate clay minerals to the formation of the transitional zone gas. Sci. China Ser. D Earth Sci. 1997, 40, 130–136. [Google Scholar] [CrossRef]


Disclaimer/Publisher’s Note: The statements, opinions and data contained in all publications are solely those of the individual author(s) and contributor(s) and not of MDPI and/or the editor(s). MDPI and/or the editor(s) disclaim responsibility for any injury to people or property resulting from any ideas, methods, instructions or products referred to in the content. |
© 2023 by the authors. Licensee MDPI, Basel, Switzerland. This article is an open access article distributed under the terms and conditions of the Creative Commons Attribution (CC BY) license (https://creativecommons.org/licenses/by/4.0/).